Impact Analysis of Economic Contributors on Knowledge Creation Activity by Using the Symmetric Decomposition Method


Abstract
:1. Introduction
2. Model and Methodology
3. Empirical Analysis
3.1. Linkage between Patent Classification and Industry Classification
3.2. ICT Industry Classification
3.3. Data
4. Result and Discussion
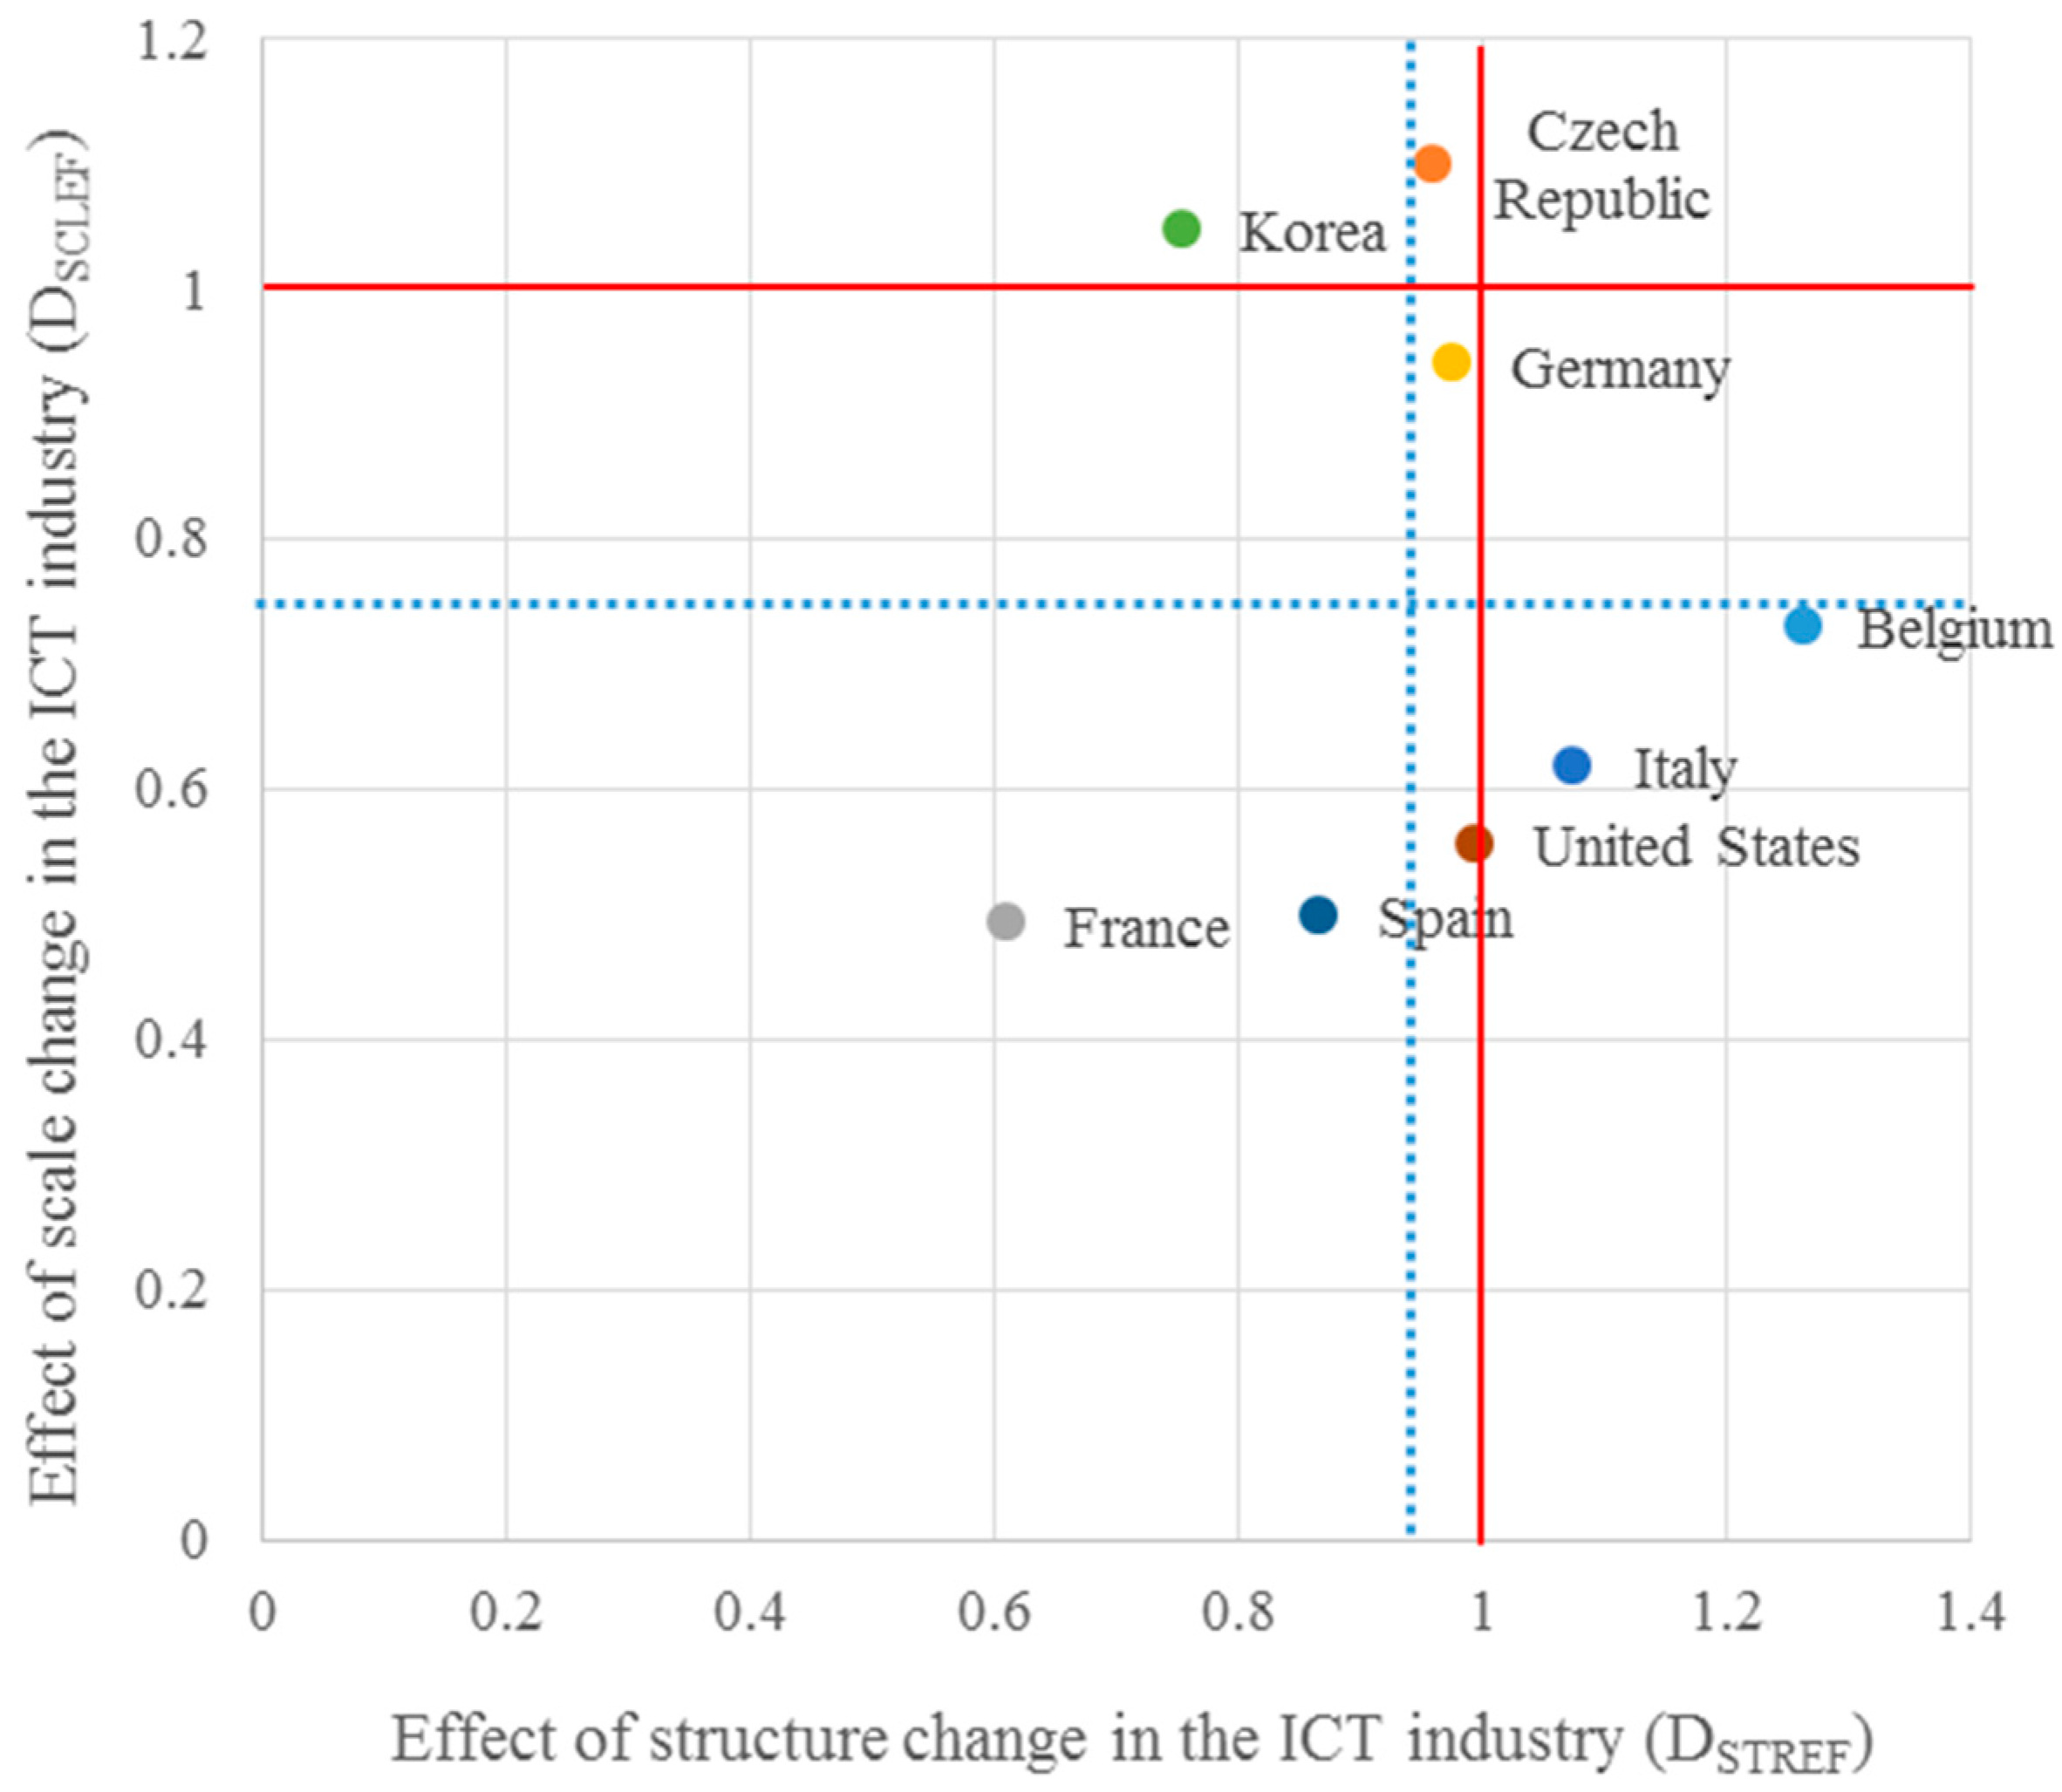
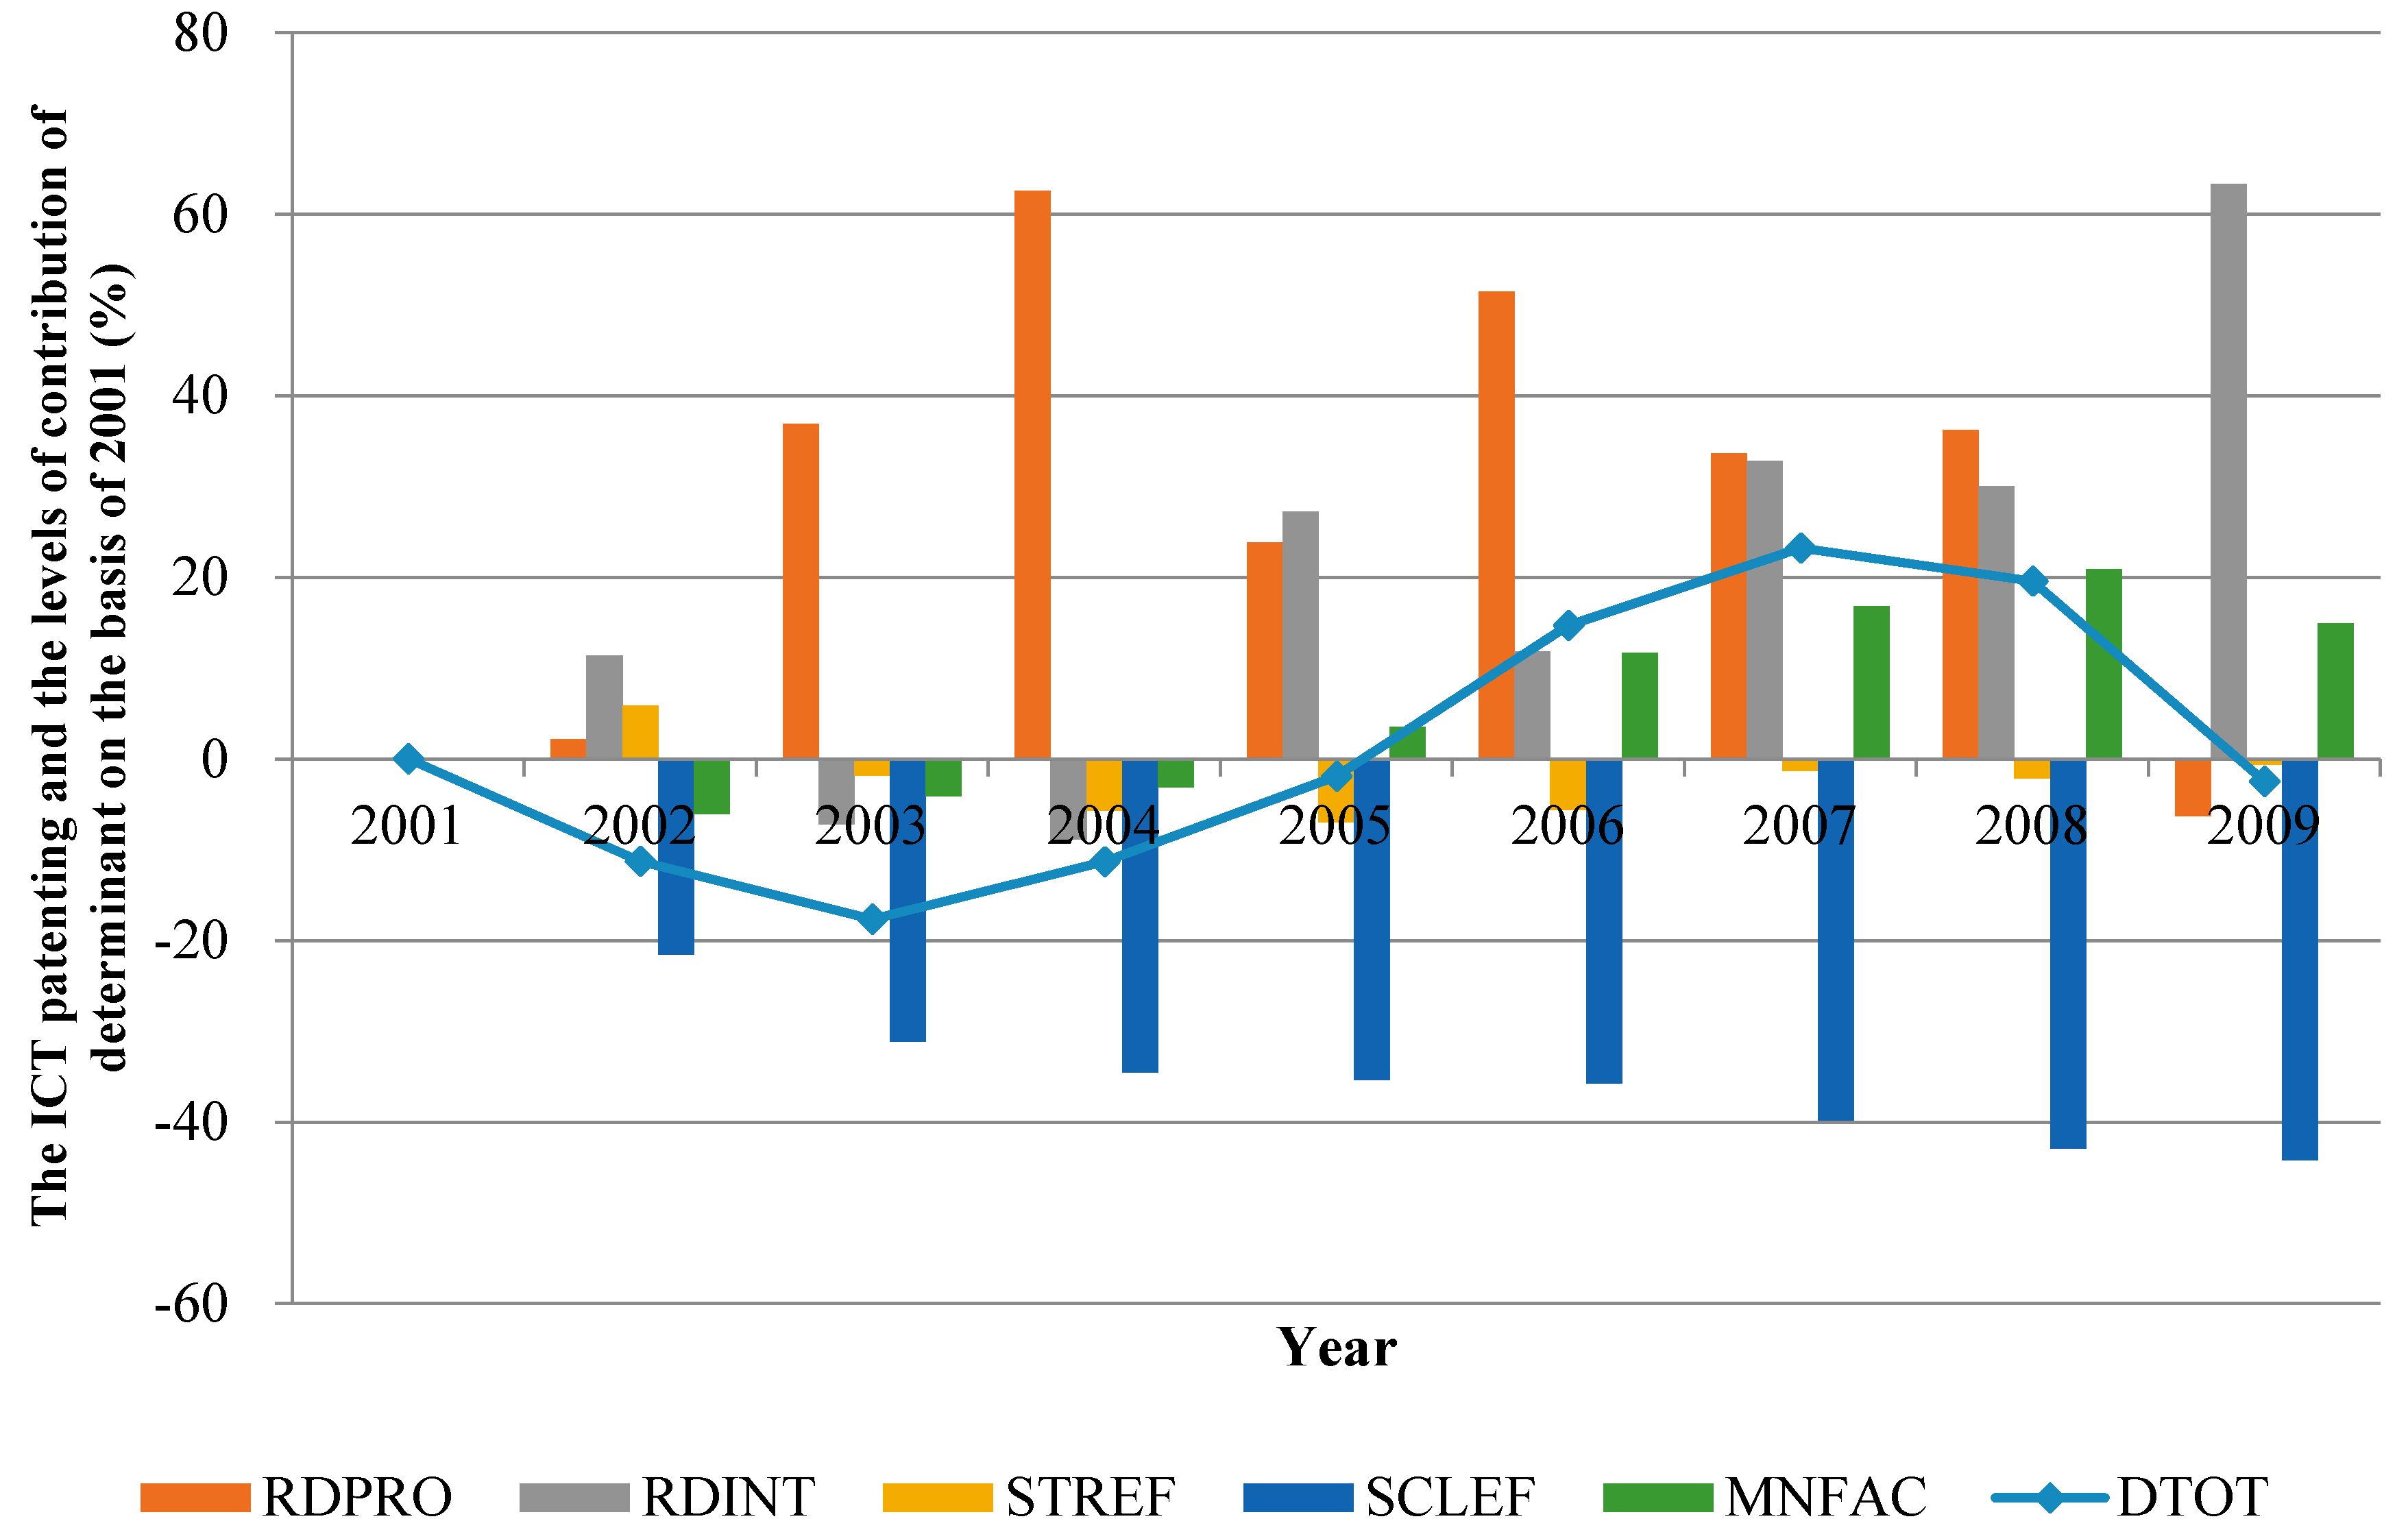
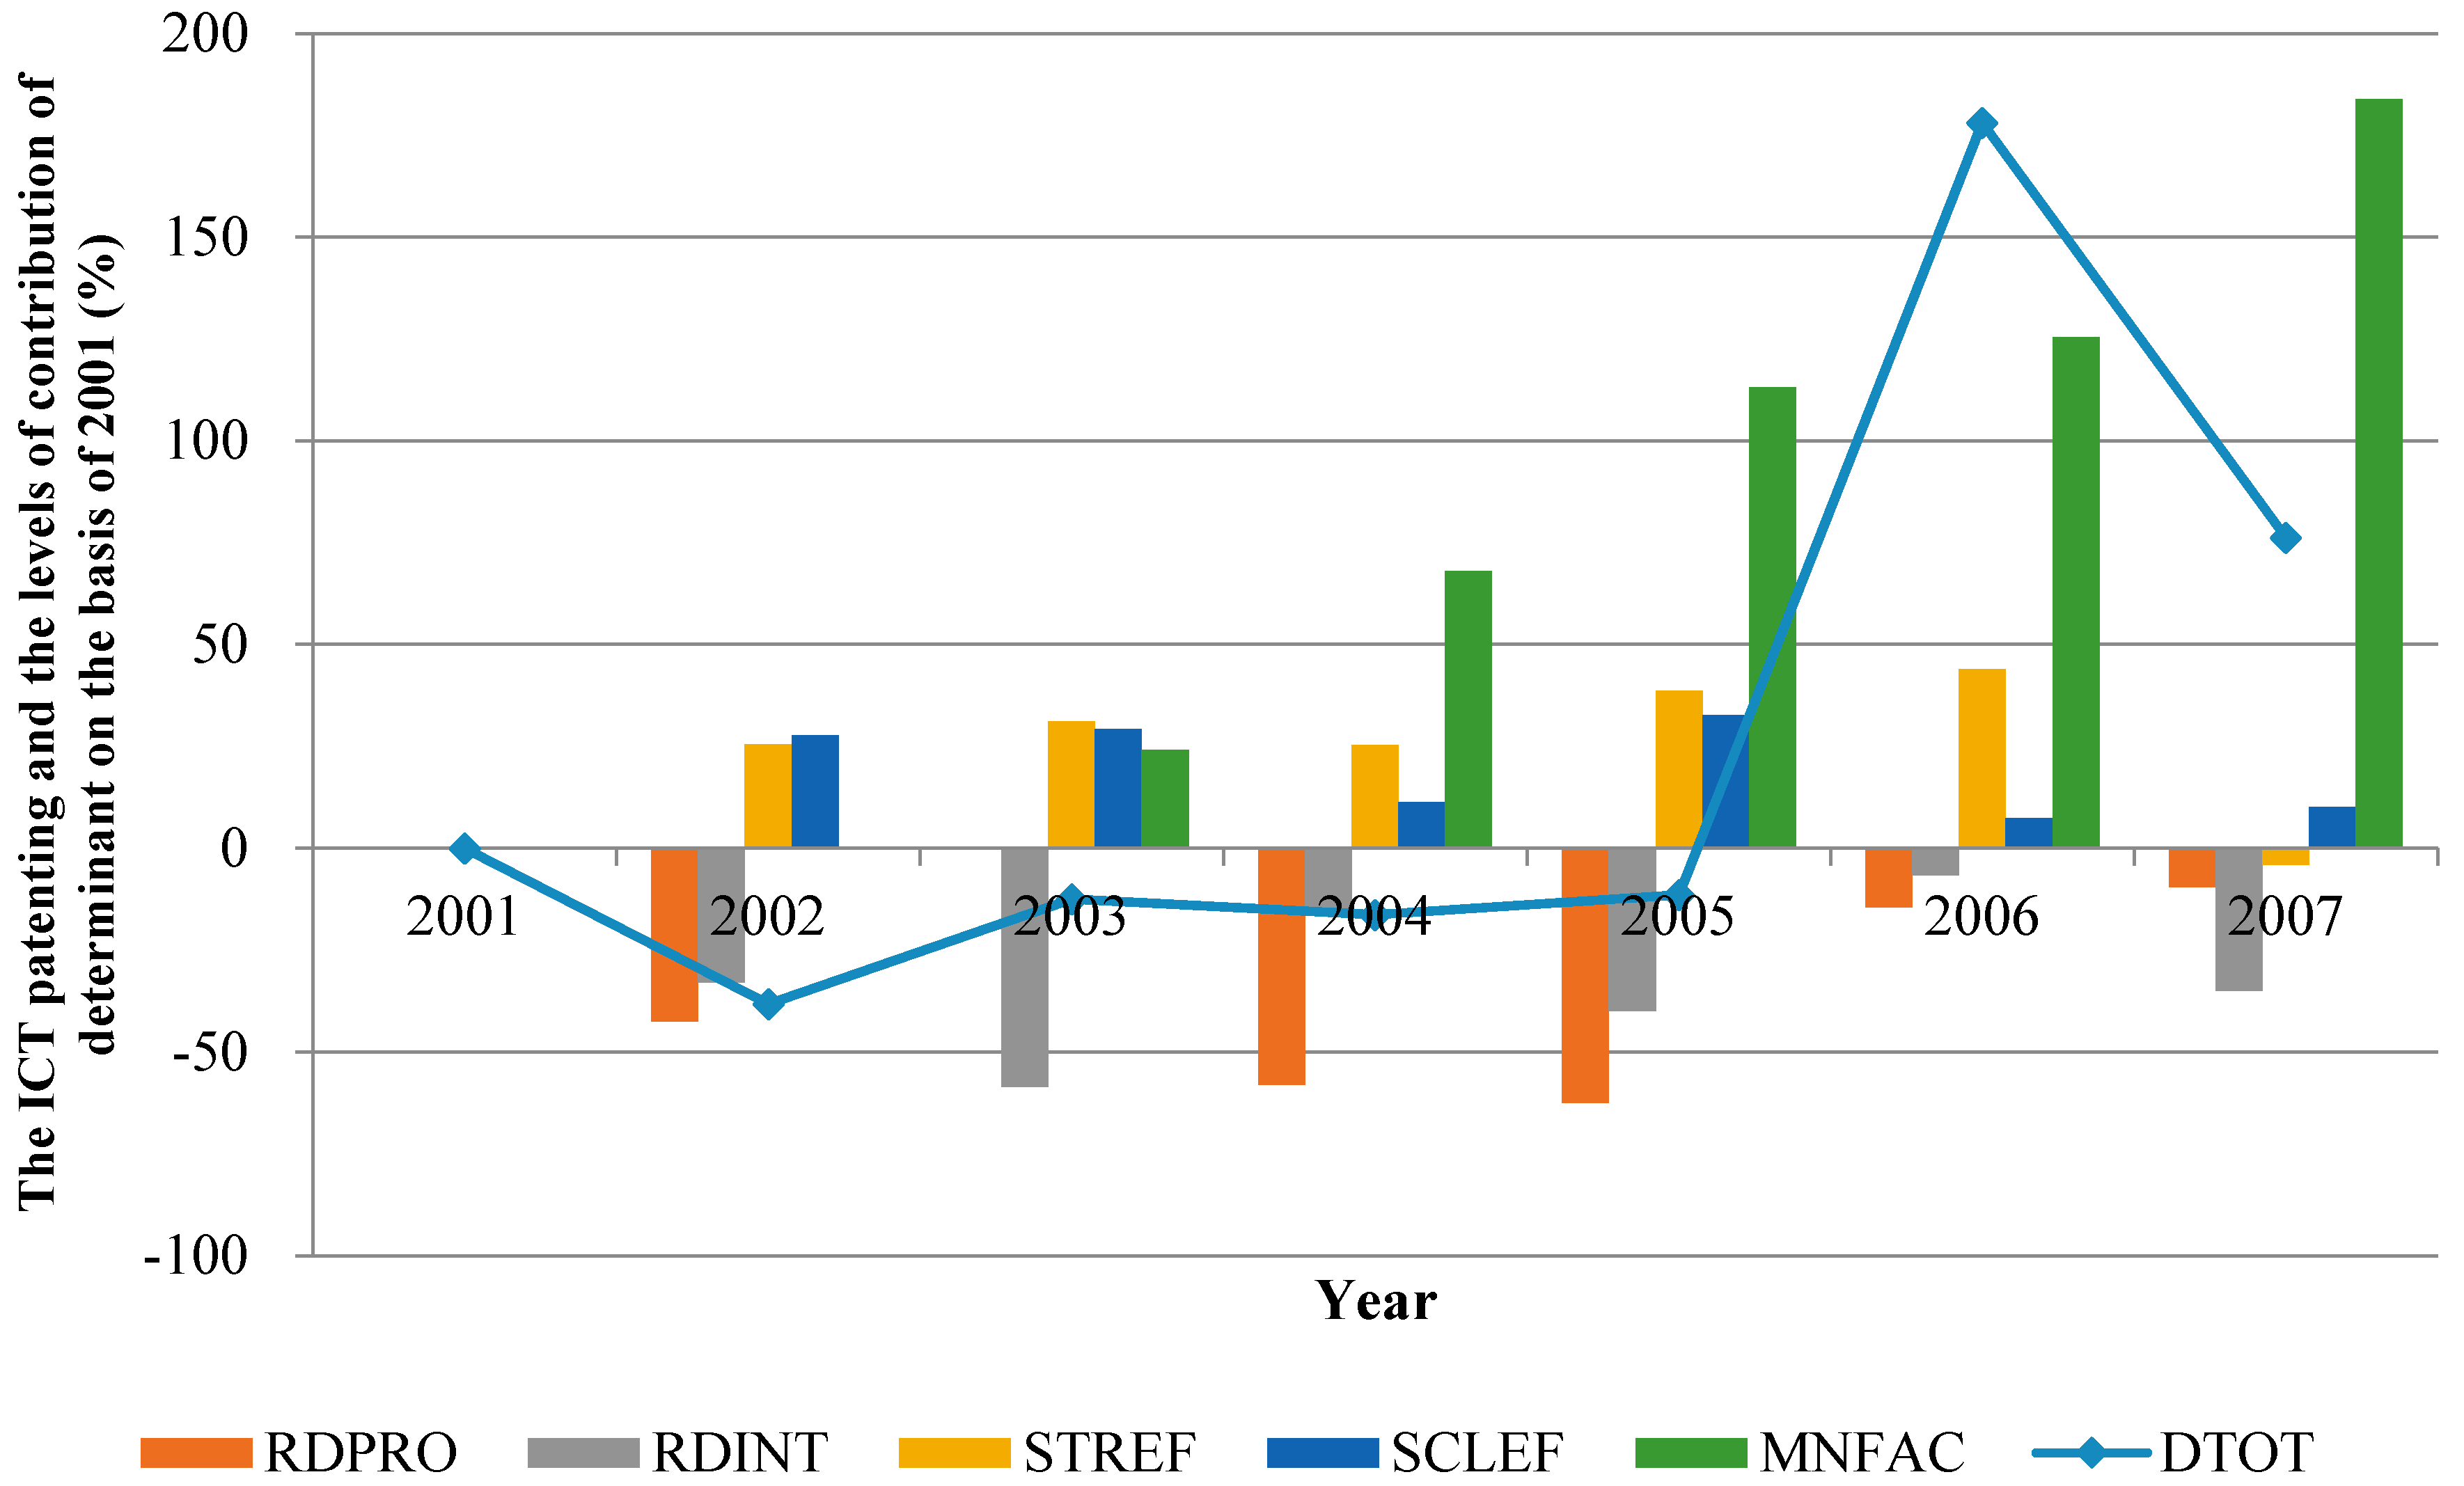
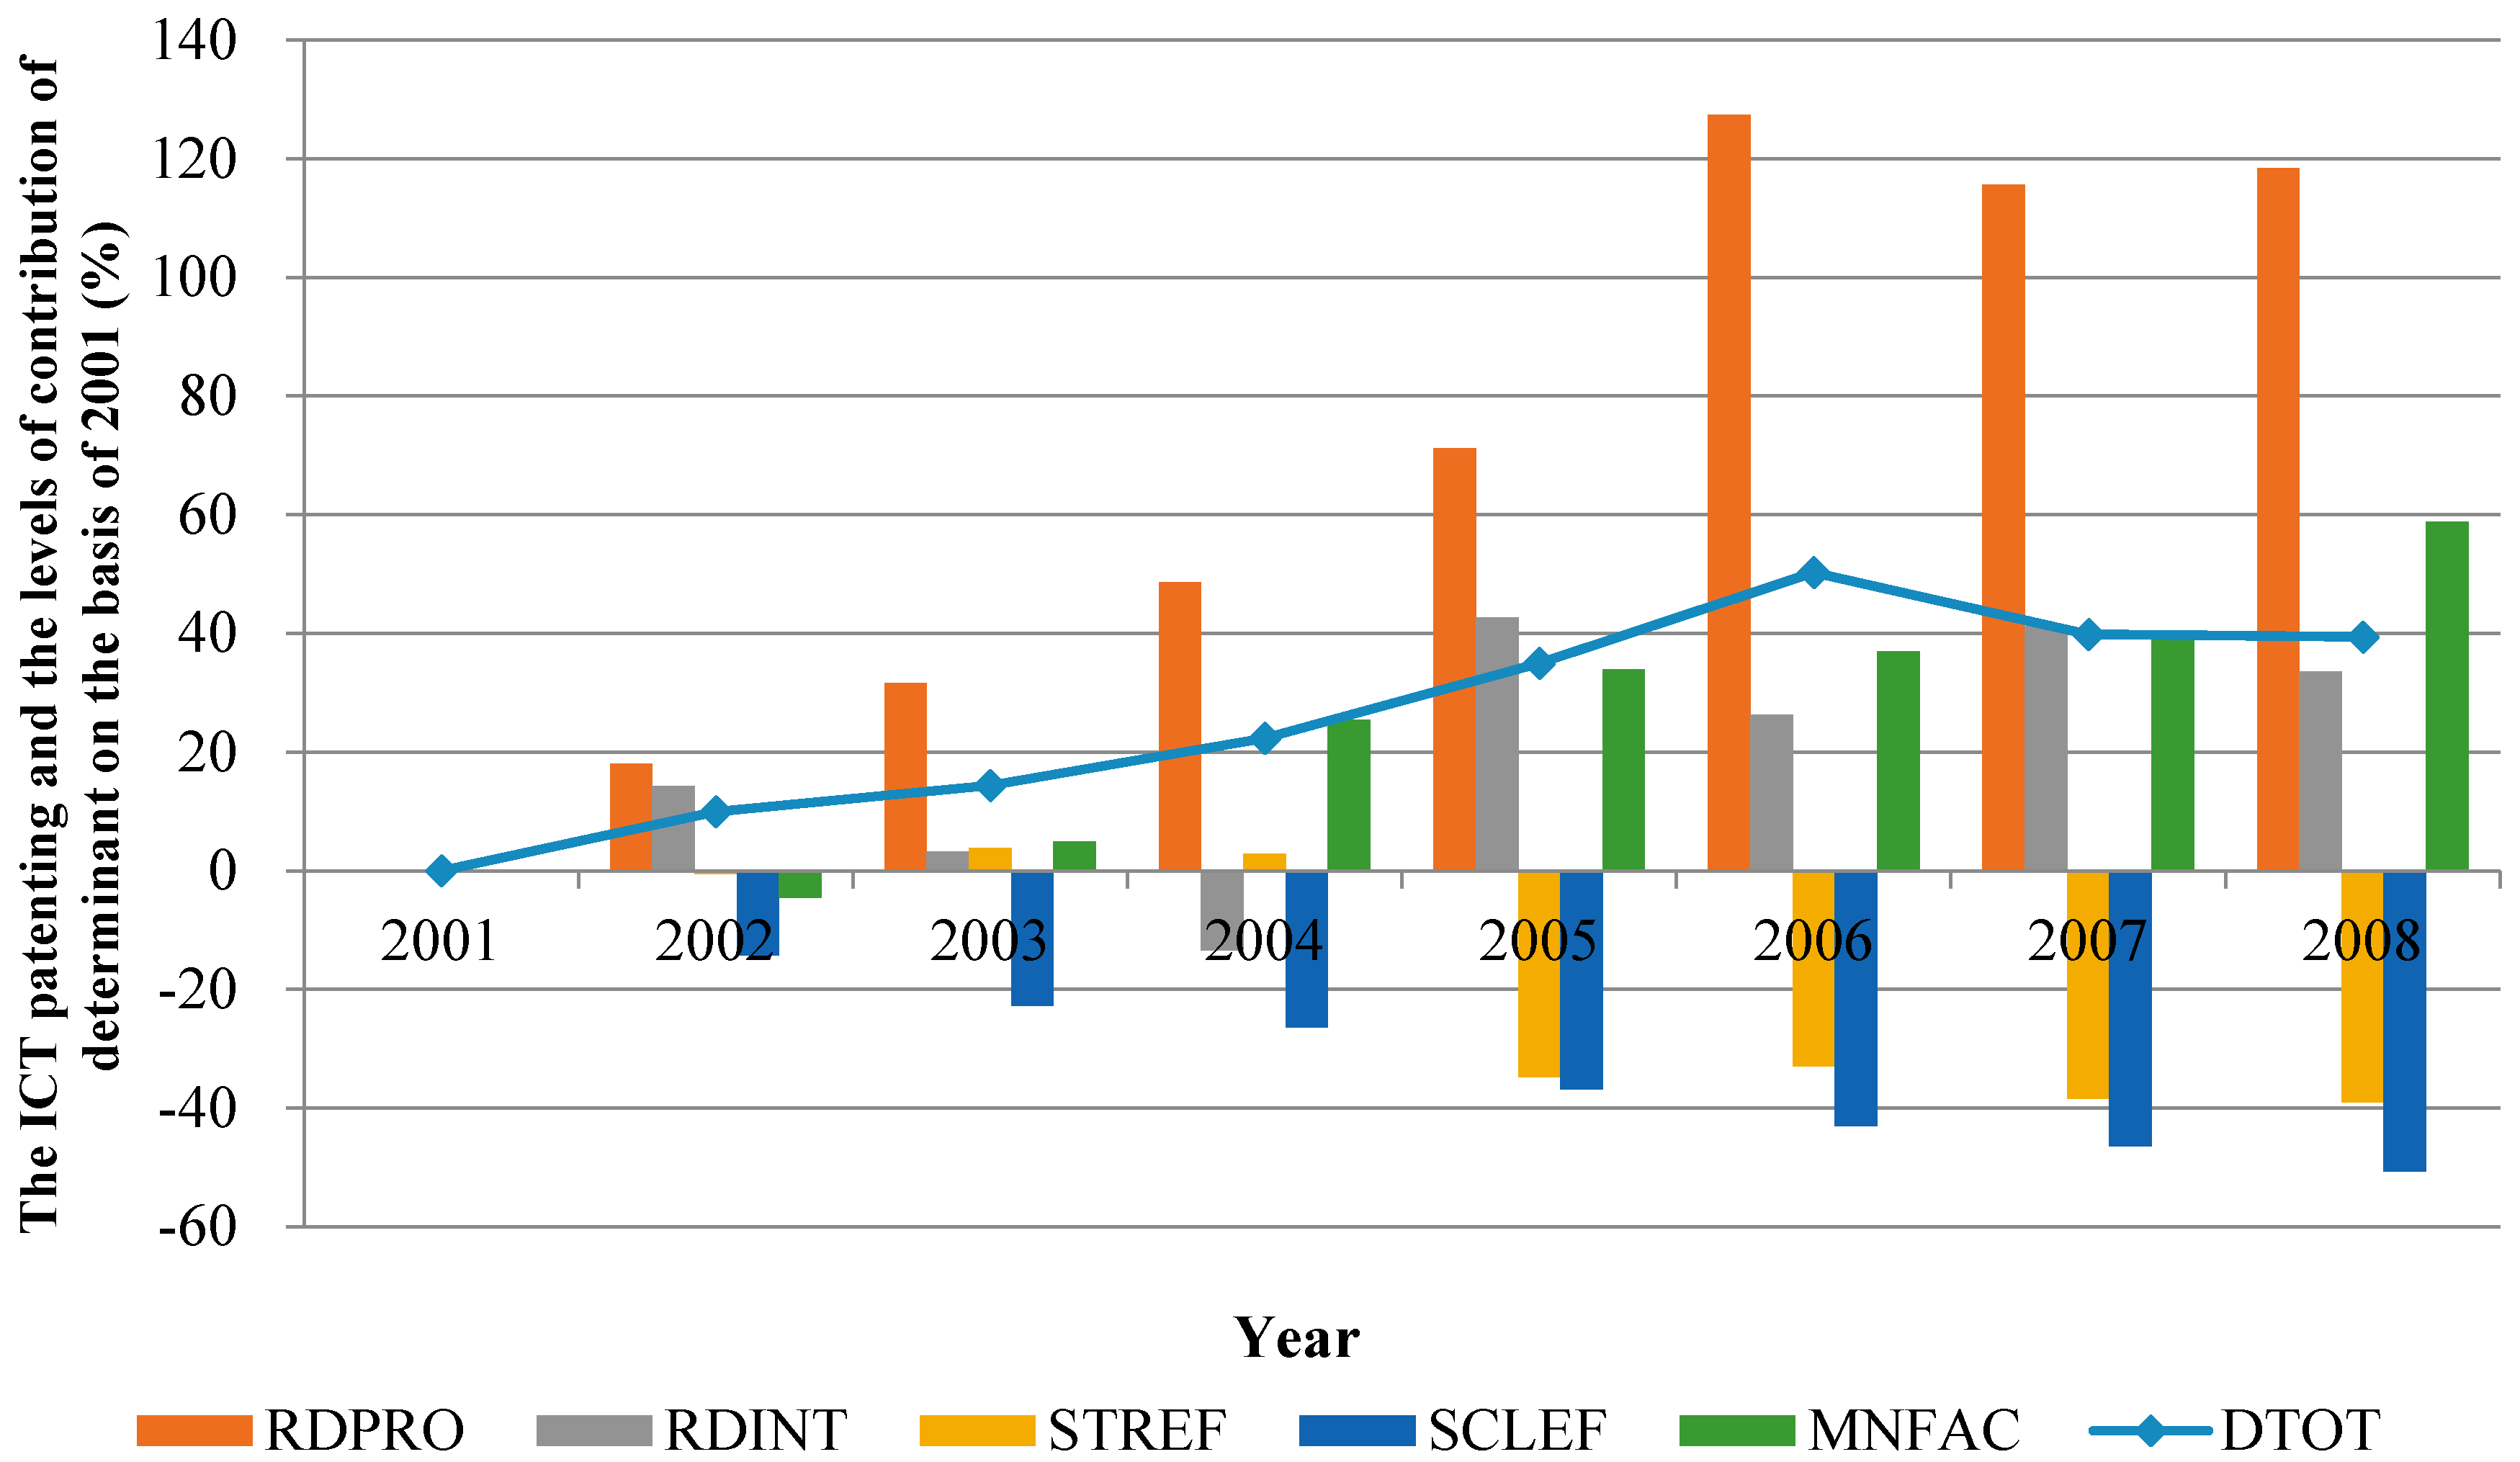
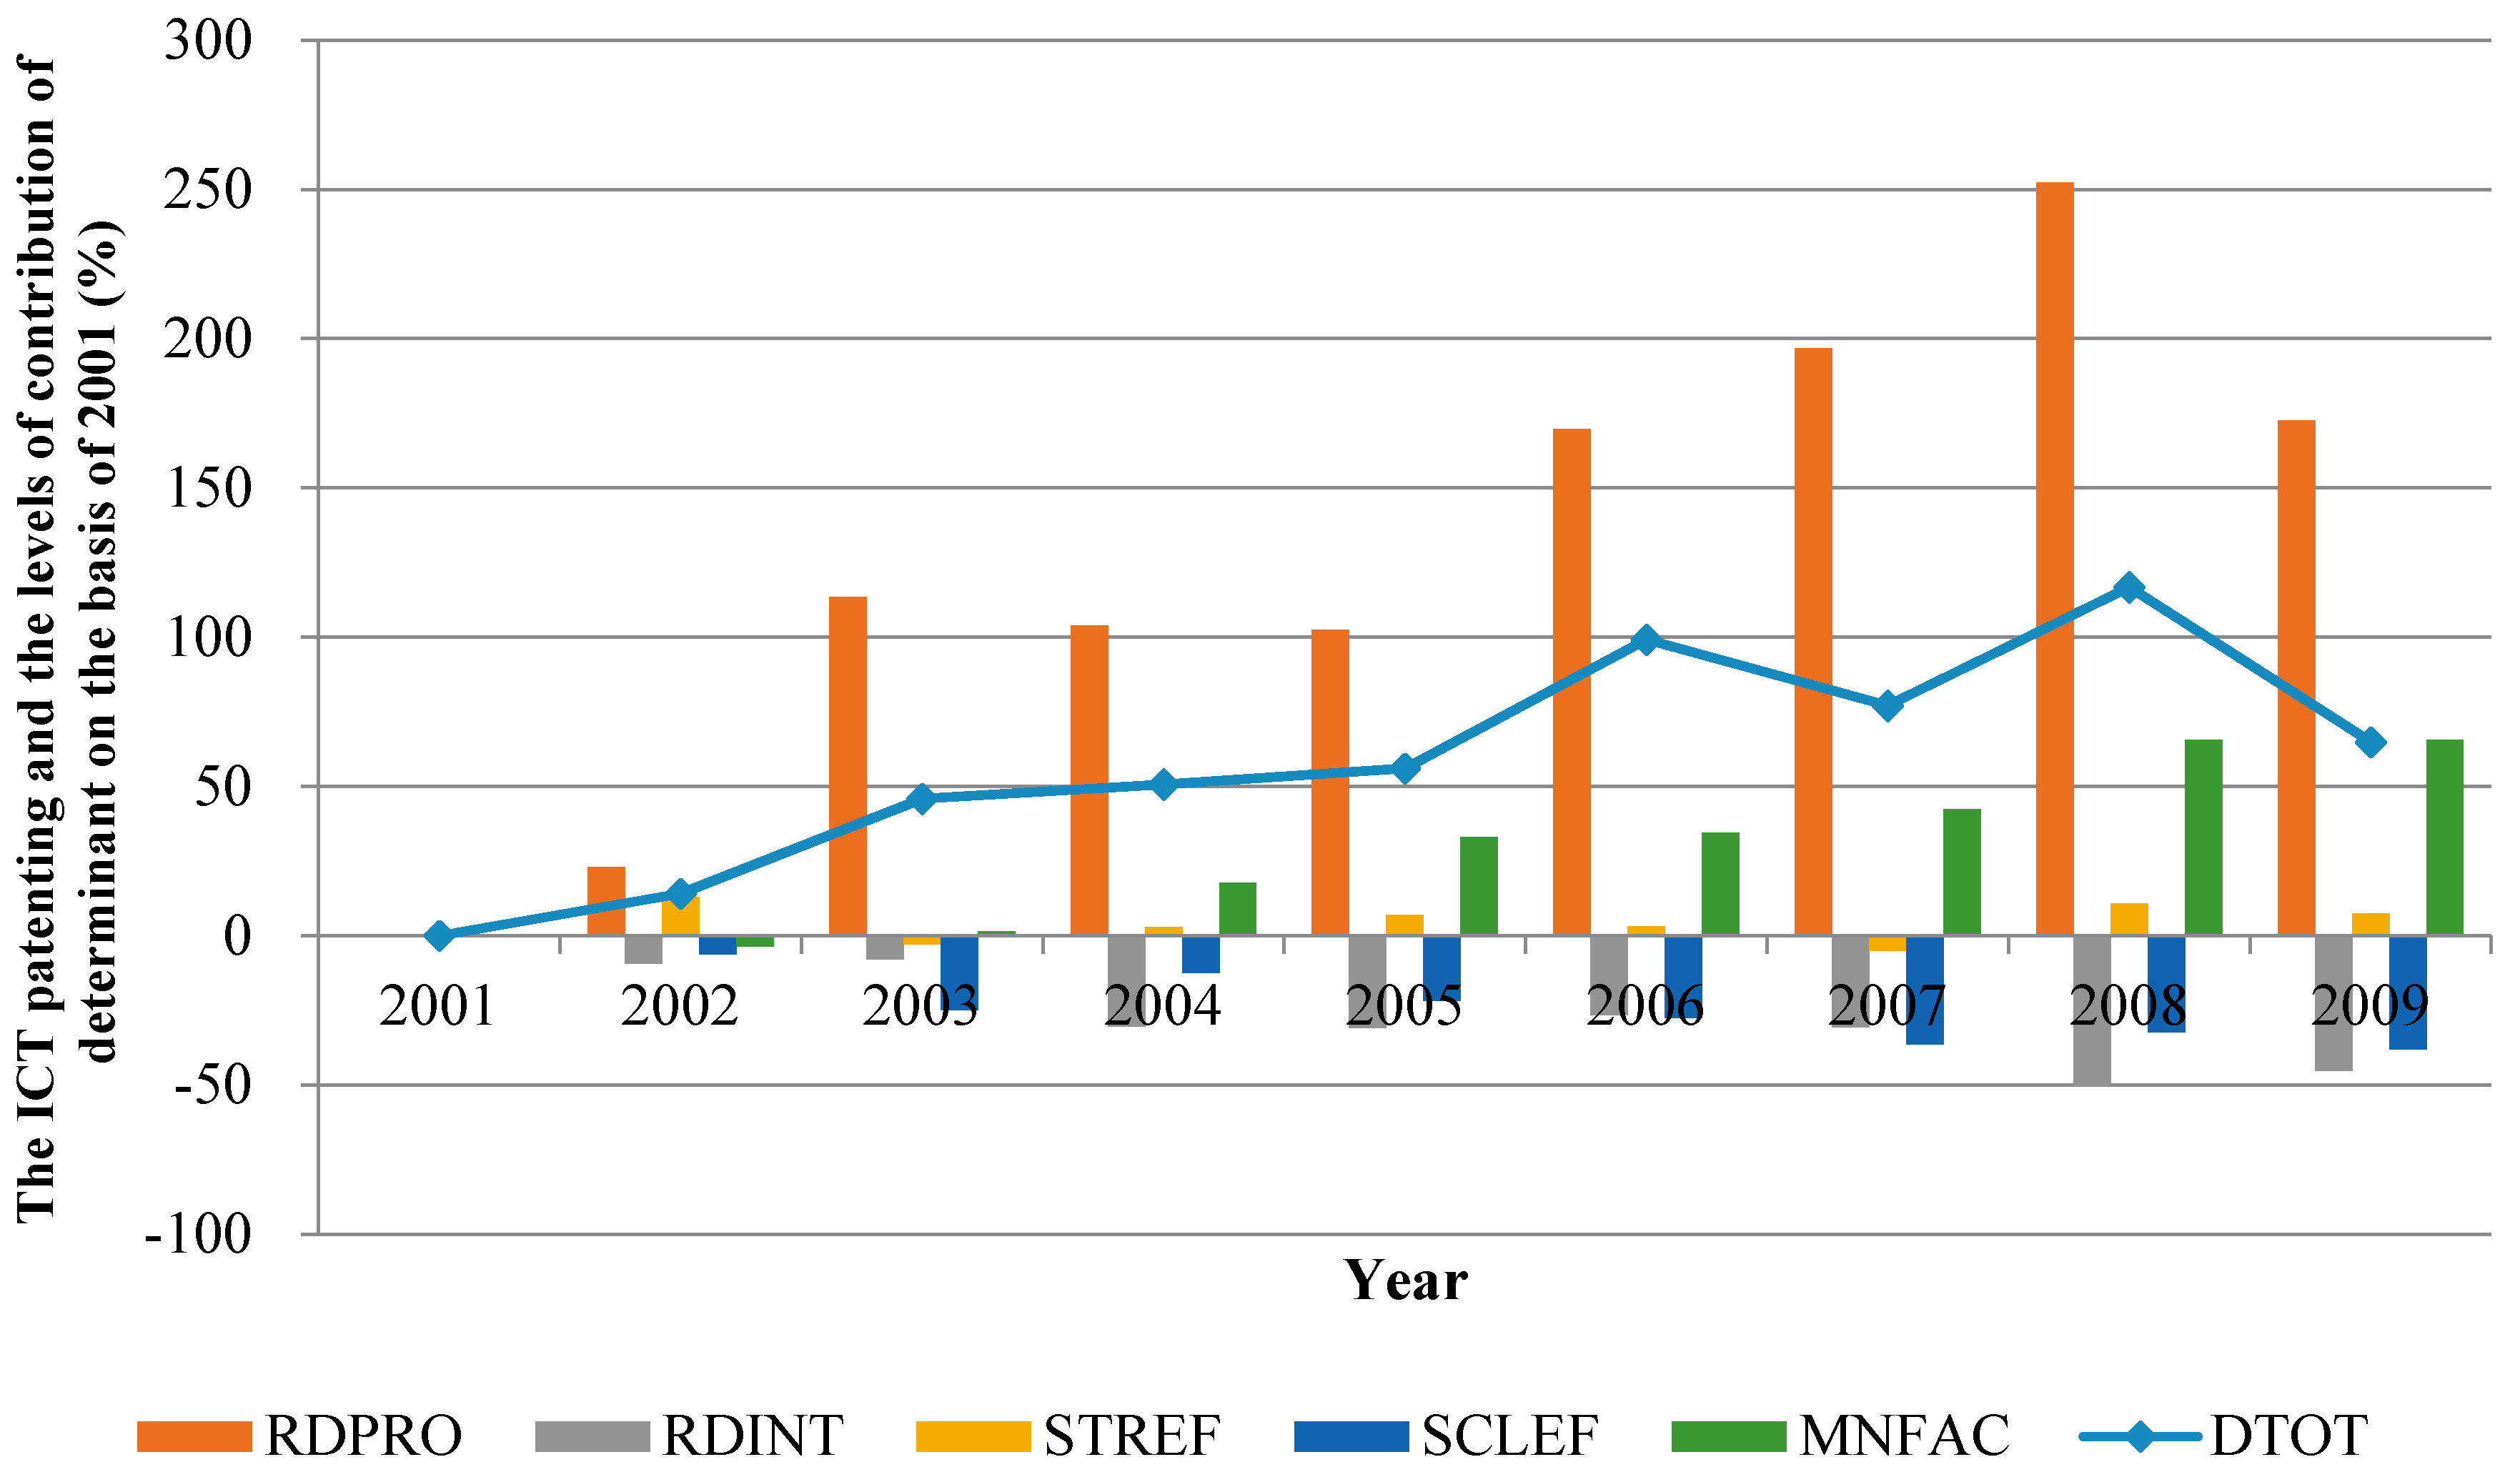
4.1. The Effects of Micro Level’s Contributors on ICT Patenting
4.2. The Effects of Meso Level’s Contributors on ICT Patenting
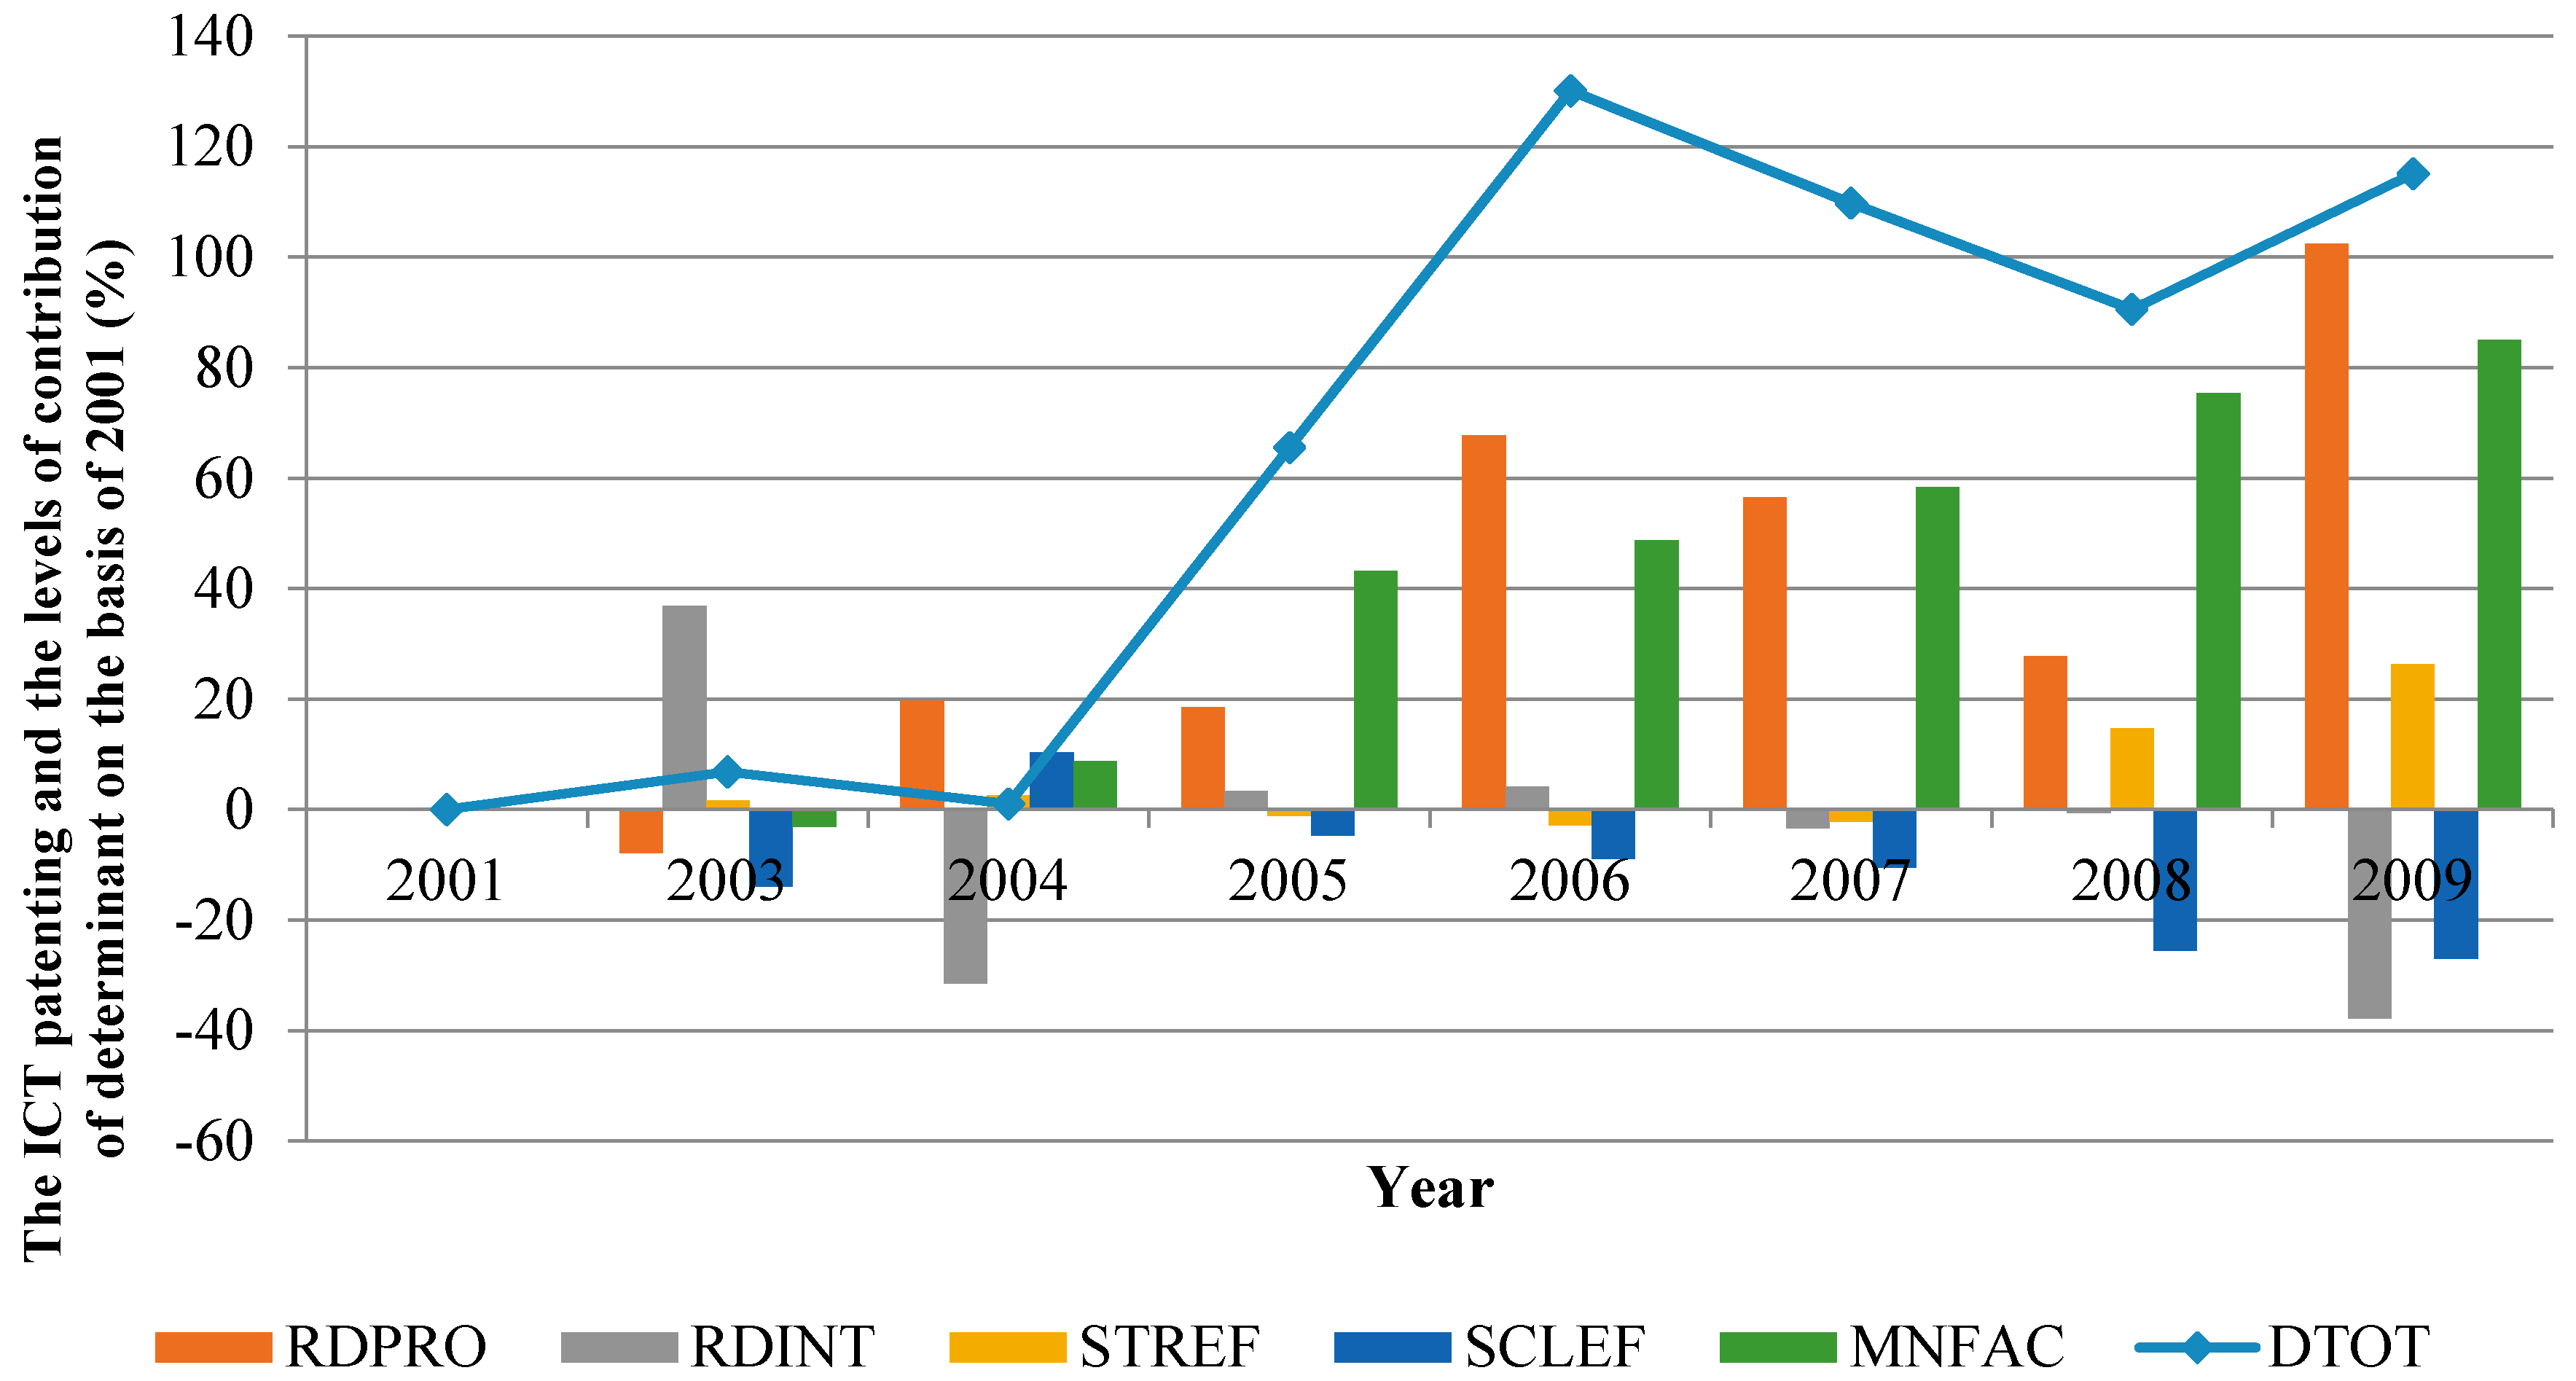
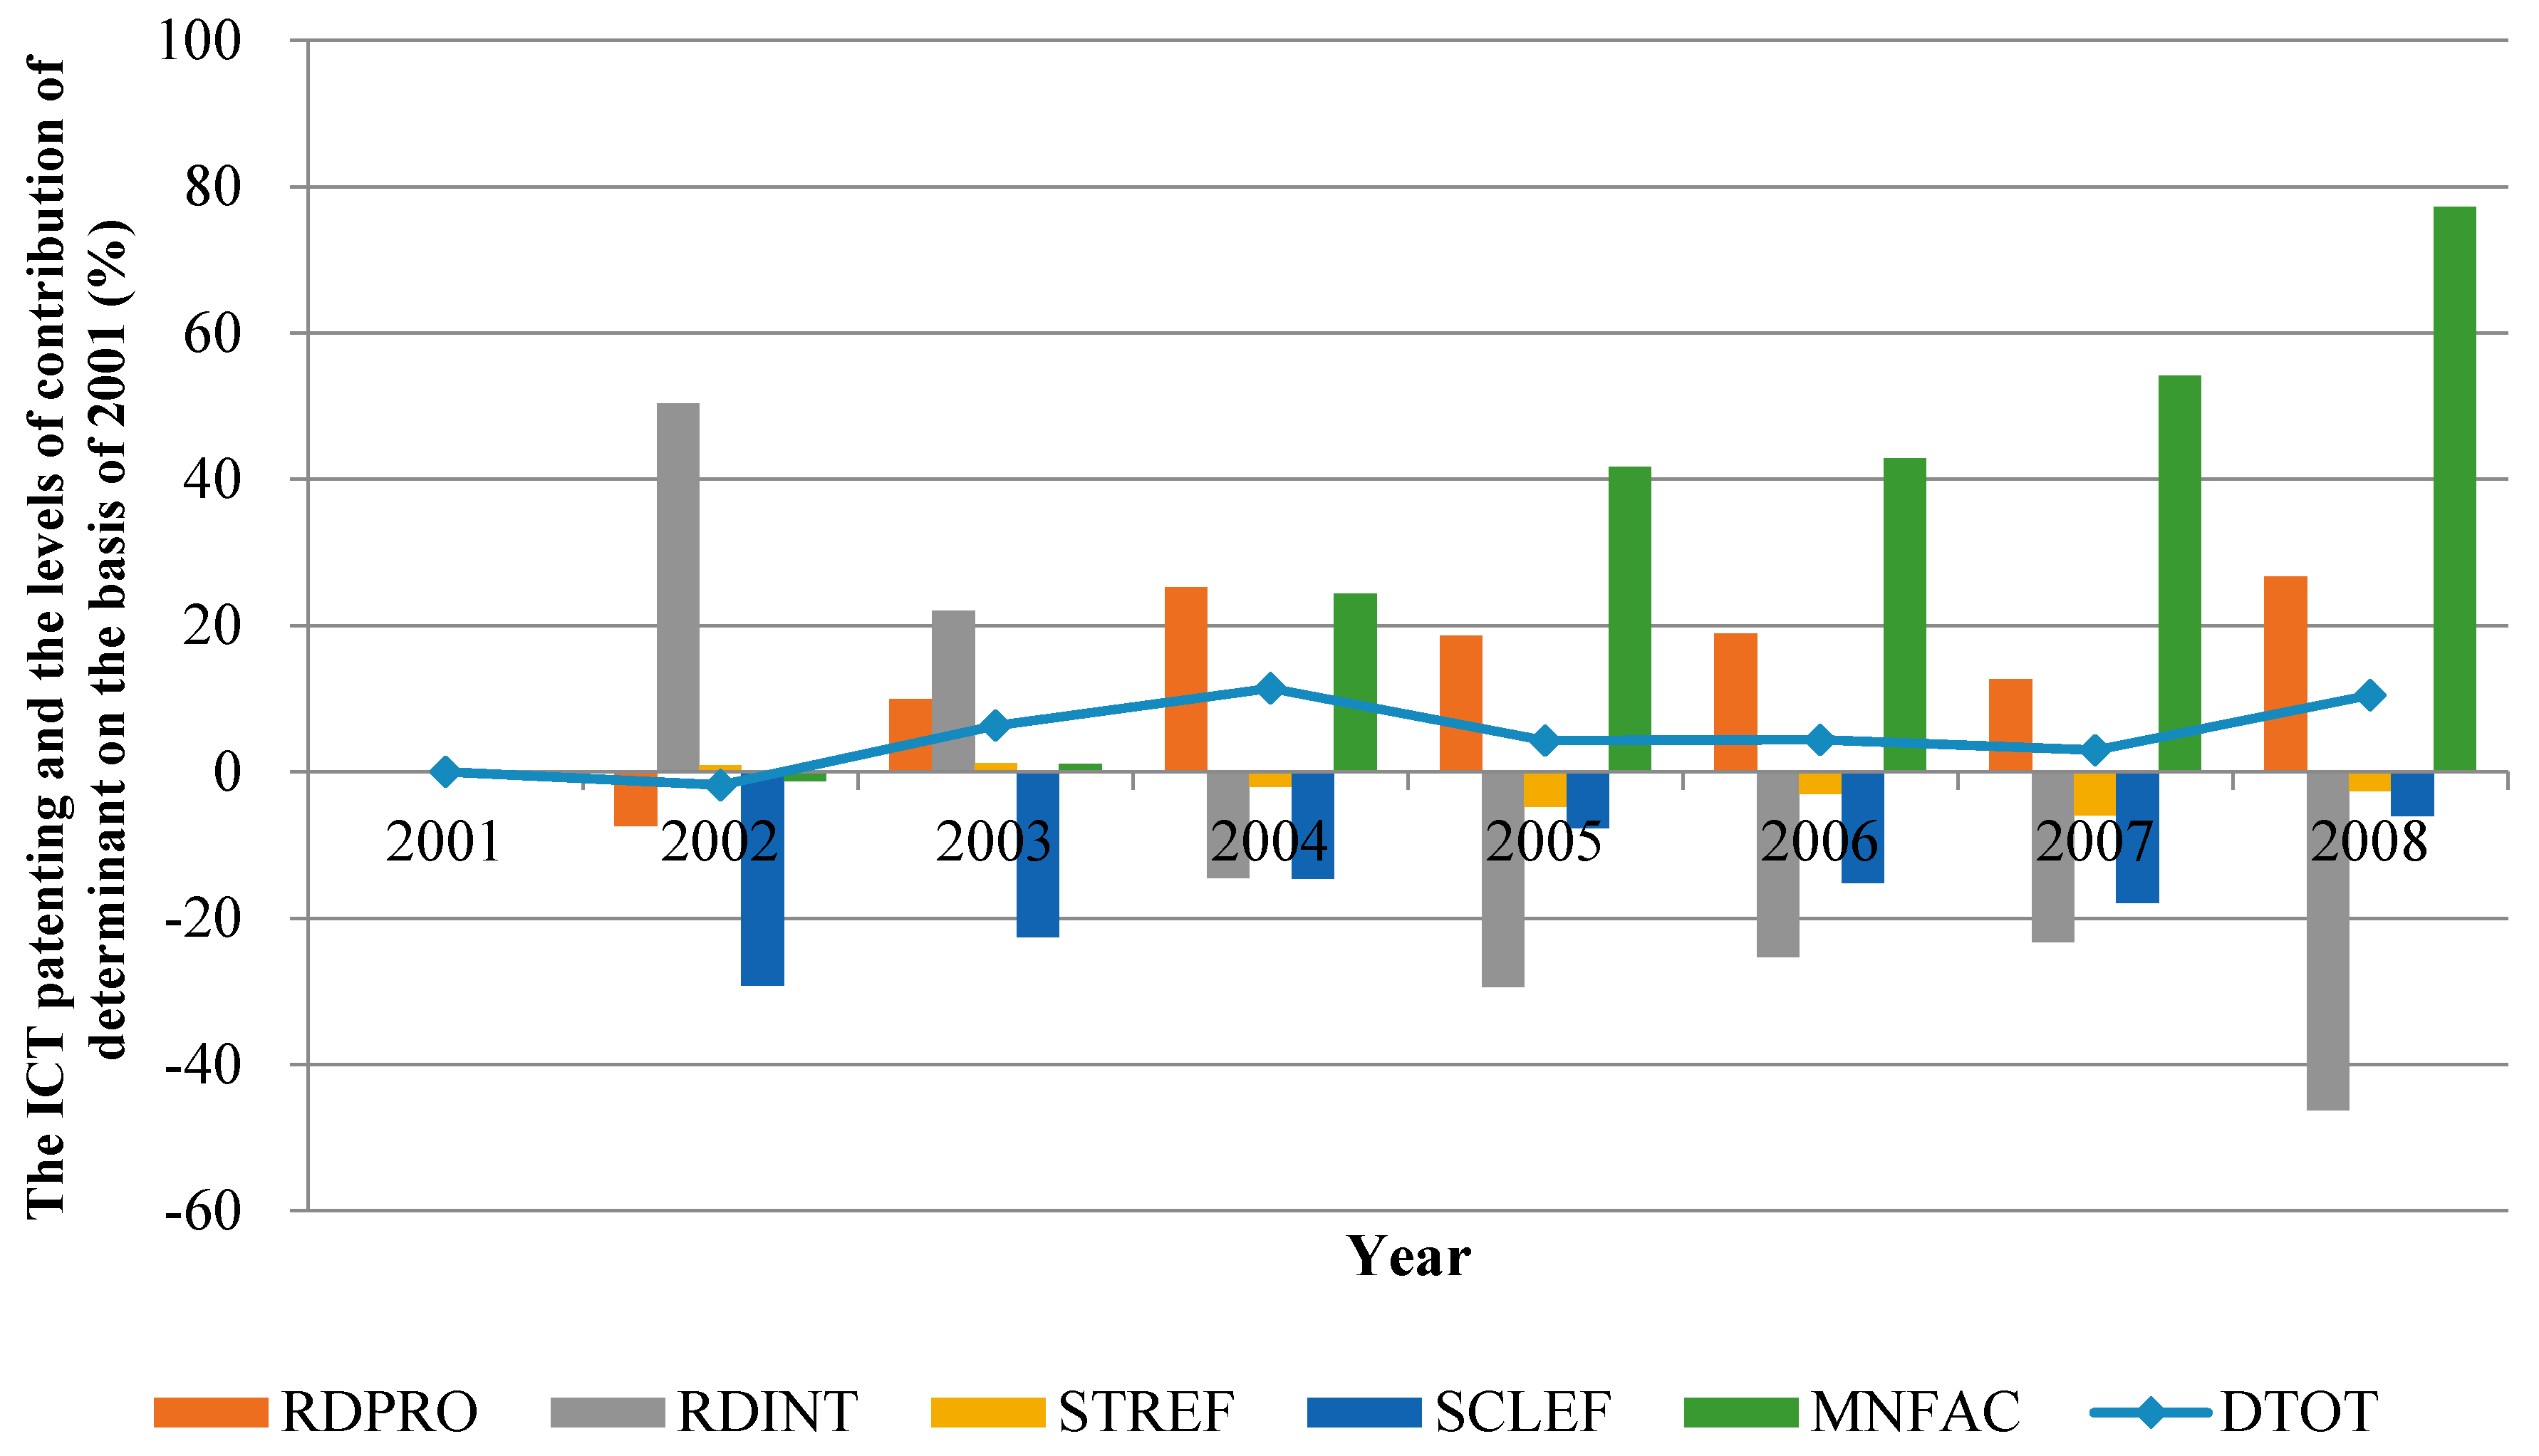
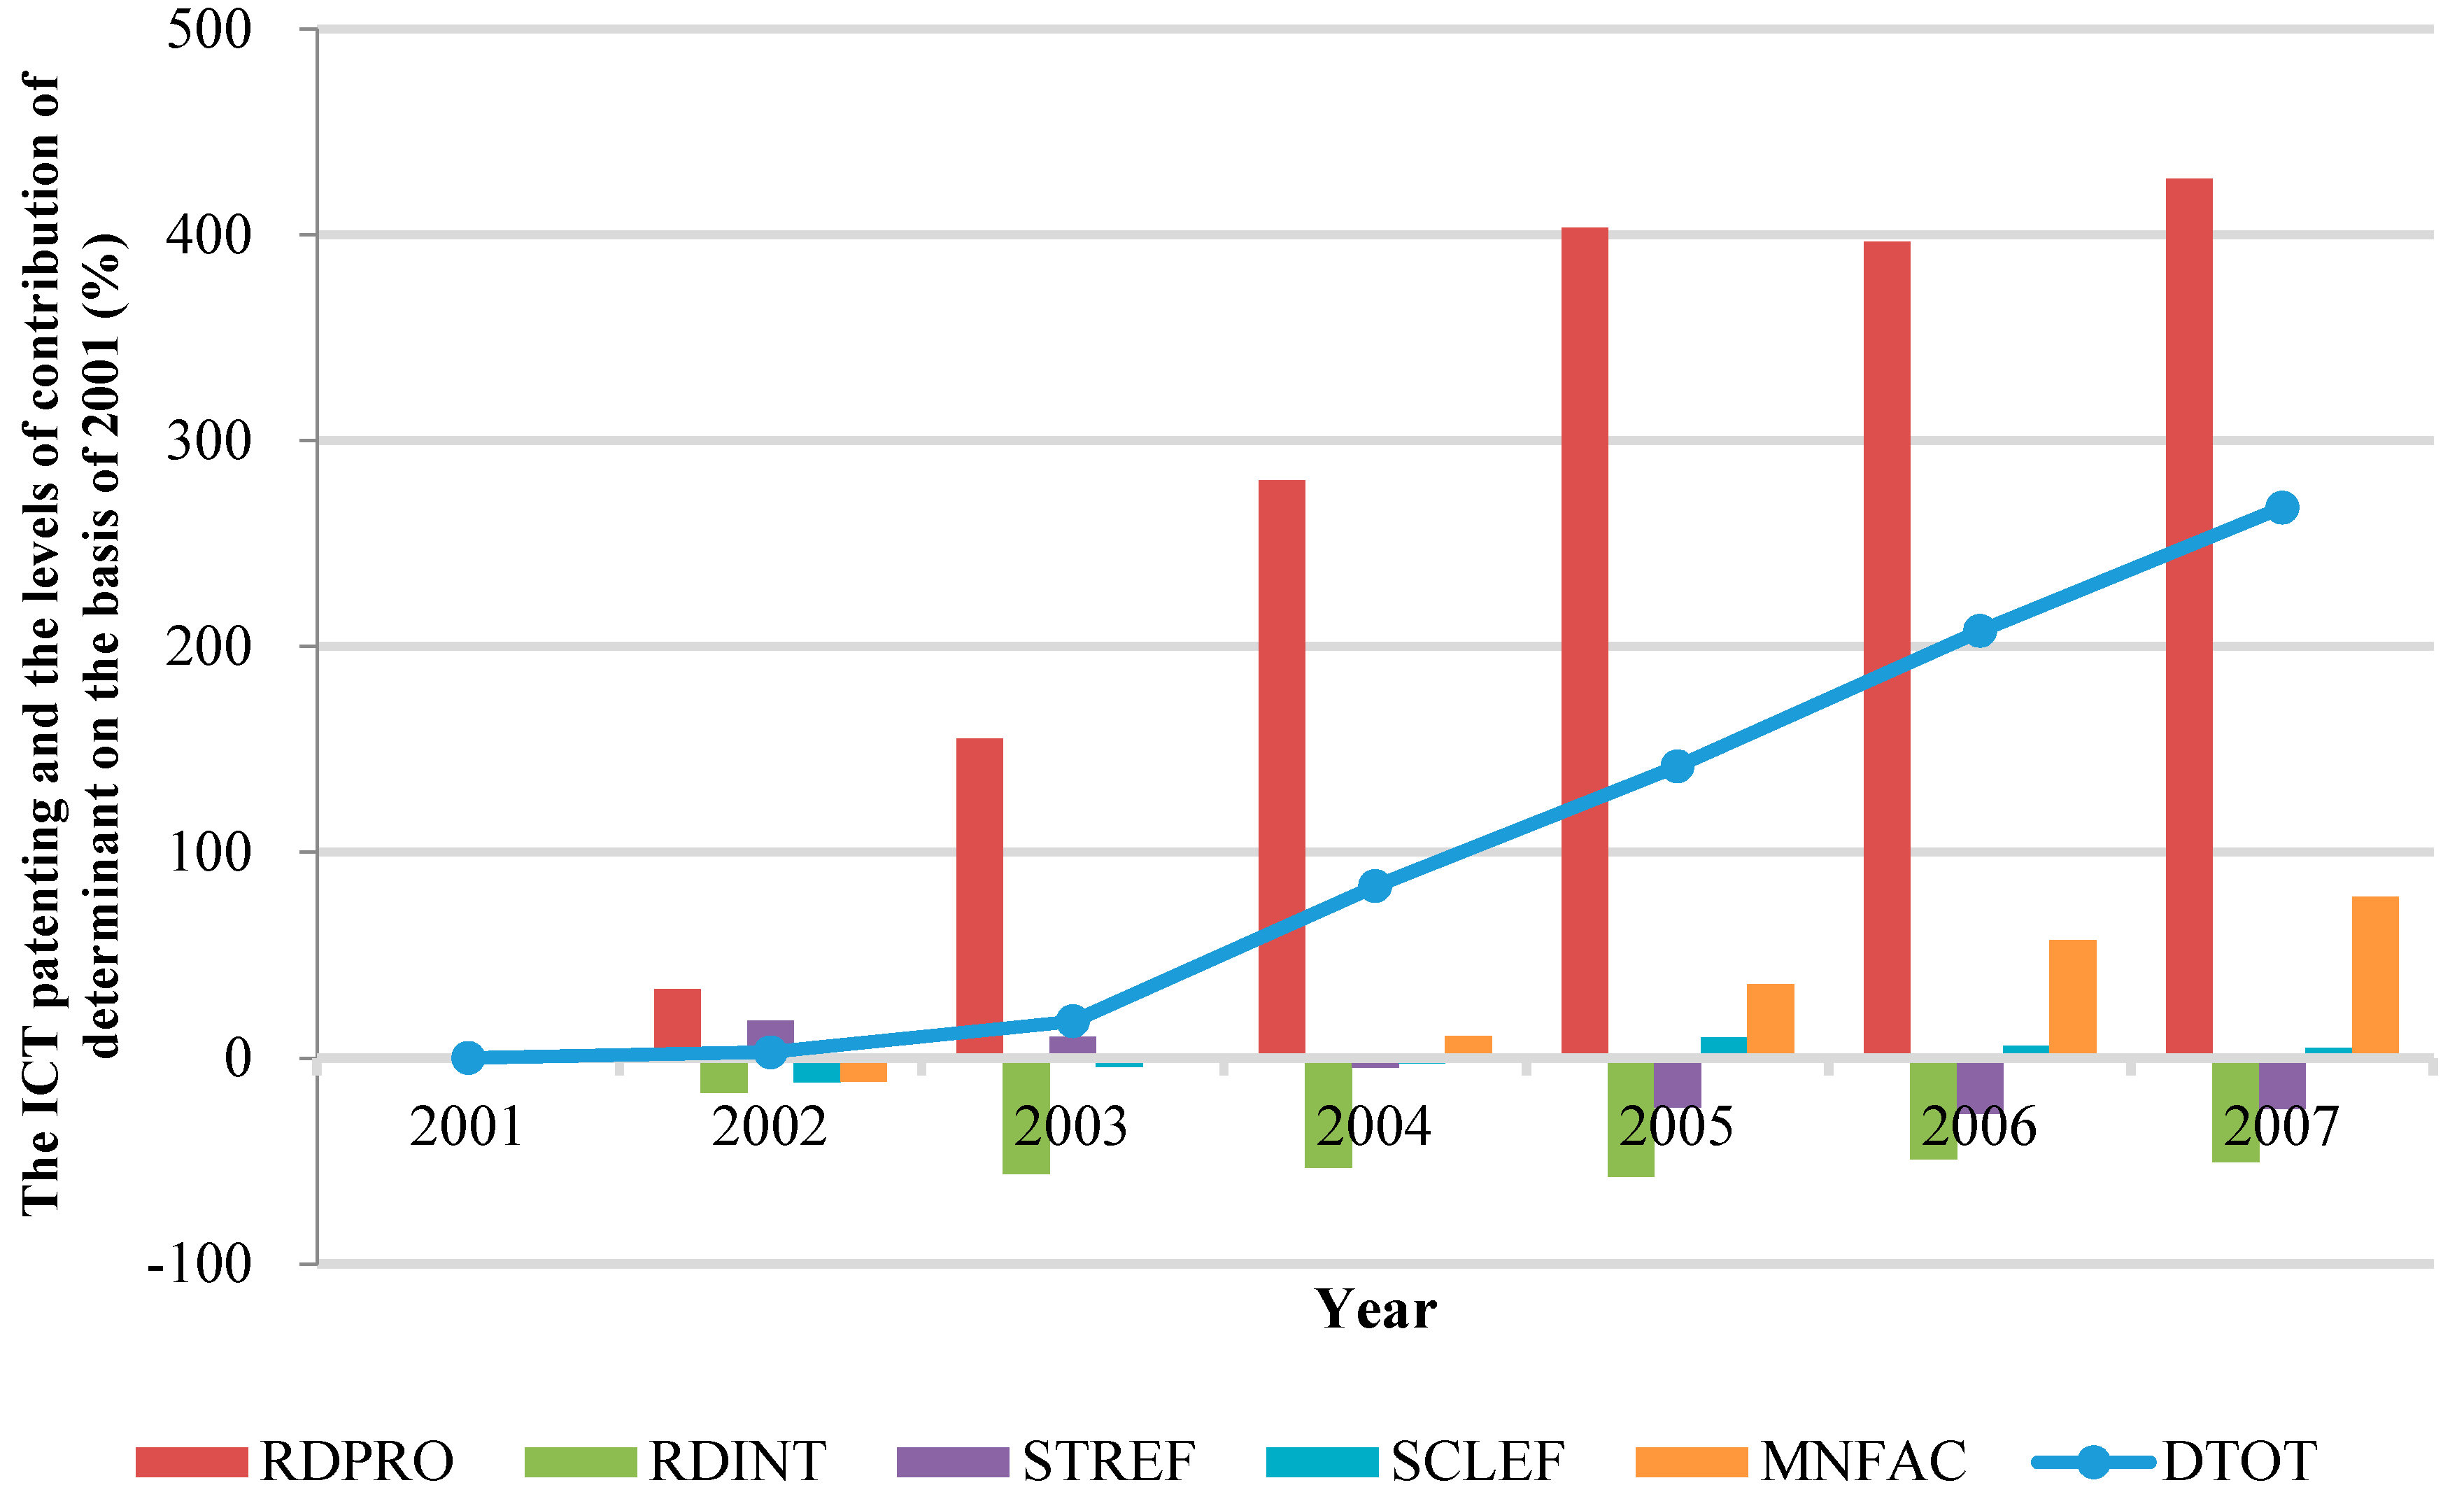
4.3. The Effects of Macro Level’s Contributors on ICT Patenting
5. Conclusions
Author Contributions
Conflicts of Interest
Appendix A. Theoretical Background of Decomposition Analysis
Appendix B. Linkage between the Unclassified IPC Codes and the Technology Field of FOS Concordance

| Code | Unclassified Code | Description of Code | Established Version or Date | Technology Field of FOS |
|---|---|---|---|---|
| A | A01P | BIOCIDAL, PEST REPELLENT, PEST ATTRACTANT OR PLANT GROWTH REGULATORY ACTIVITY OF CHEMICAL COMPOUNDS OR PREPARATIONS | Version 8 | 11 |
| A61Q | SPECIFIC USE OF COSMETICS OR SIMILAR TOILET PREPARATIONS | Version 8 | 13 | |
| B | B29K | INDEXING SCHEME ASSOCIATED WITH SUBCLASSES B29B, B29C OR B29D, RELATING TO MOULDING MATERIALS OR TO MATERIALS FOR REINFORCEMENTS, FILLERS OR PREFORMED PARTS, e.g., INSERTS | Version 4 | 17 |
| B29L | INDEXING SCHEME ASSOCIATED WITH SUBCLASS B29C, RELATING TO PARTICULAR ARTICLES | Version 4 | 17 | |
| B60W | CONJOINT CONTROL OF VEHICLE SUB-UNITS OF DIFFERENT TYPES OR FUNCTIONS; CONTROL SYSTEMS SPECIALLY ADAPTED FOR HYBRID VEHICLES; ROAD VEHICLE DRIVE CONTROL SYSTEMS FOR PURPOSES NOT RELATED TO THE CONTROL OF A PARTICULAR SUB-UNIT | Version 8 | 42 | |
| B82Y | SPECIFIC USES OR APPLICATIONS OF NANO-STRUCTURES; MEASUREMENT OR ANALYSIS OF NANO-STRUCTURES; MANUFACTURE OR TREATMENT OF NANO-STRUCTURES | 2011. 01 | 20 | |
| C | C07M | INDEXING SCHEME ASSOCIATED WITH SUBCLASSES C07B TO C07K, RELATING TO SPECIFIC PROPERTIES OF ORGANIC COMPOUNDS | Version 6 | 10 |
| C10N | INDEXING SCHEME ASSOCIATED WITH SUBCLASS C10M | Version 4 | 15 | |
| C12R | INDEXING SCHEME ASSOCIATED WITH SUBCLASSES C12C-C12Q, RELATING TO MICRO-ORGANISMS | Version 3 | 13 | |
| C13B | PRODUCTION OF SUCROSE; APPARATUS SPECIALLY ADAPTED THEREFORE | 2011. 01 | 25 | |
| C22K | - | - | ||
| C40B | COMBINATORIAL CHEMISTRY; LIBRARIES, e.g., CHEMICAL LIBRARIES, IN SILICO LIBRARIES | Version 8 | 15 | |
| F | F21W | INDEXING SCHEME ASSOCIATED WITH SUBCLASSES F21L, F21S and F21V, RELATING TO USES OR APPLICATIONS OF LIGHTING DEVICES OR SYSTEMS | Version 7 | 32 |
| F21Y | INDEXING SCHEME ASSOCIATED WITH SUBCLASSES F21L, F21S and F21V, RELATING TO THE FORM OF THE LIGHT SOURCES | Version 7 | 32 | |
| G | G01Q | SCANNING-PROBE TECHNIQUES OR APPARATUS; APPLICATIONS OF SCANNING-PROBE TECHNIQUES, e.g., SCANNING-PROBE MICROSCOPY | 2010. 01 | 38 |
| G06Q | DATA PROCESSING SYSTEMS OR METHODS, SPECIALLY ADAPTED FOR ADMINISTRATIVE, COMMERCIAL, FINANCIAL, MANAGERIAL, SUPERVISORY OR FORECASTING PURPOSES; SYSTEMS OR METHODS SPECIALLY ADAPTED FOR ADMINISTRATIVE, COMMERCIAL, FINANCIAL, MANAGERIAL, SUPERVISORY OR FORECASTING PURPOSES, NOT OTHERWISE PROVIDED FOR | Version 8 | 28 | |
| H | H04W | WIRELESS COMMUNICATION NETWORKS | 2009. 01 | 35 |
Appendix C. Each Country’s Time-Series Trend


Appendix D. Enforcement of Patent Protection
| Year | 2000 | 2005 | Average | |
|---|---|---|---|---|
| Country | ||||
| Belgium | 4.67 | 4.67 | 4.67 | |
| Czech Republic | 3.21 | 4.33 | 3.77 | |
| France | 4.67 | 4.67 | 4.67 | |
| Germany | 4.5 | 4.5 | 4.5 | |
| Italy | 4.67 | 4.67 | 4.67 | |
| Korea | 4.13 | 4.33 | 4.23 | |
| Spain | 4.33 | 4.33 | 4.33 | |
| United States | 4.88 | 4.88 | 4.88 | |
References
- Archibugi, D. Patenting as an indicator of technological innovation: A review. Sci. Public Policy 1992, 19, 357–368. [Google Scholar]
- Nadiri, M.I. Innovations and Technological Spillovers; NBER Working Paper #4423; National Bureau of Economic Research: New York, NY, USA, 1993. [Google Scholar]
- Coombs, R.; Narandren, P.; Richards, A. A literature-based innovation output indicator. Res. Policy 1996, 25, 403–413. [Google Scholar] [CrossRef]
- Jaffe, A.B. Technological opportunity and spillovers of R&D: Evidence from firms’ patents, profit, and market value. Am. Econ. Rev. 1986, 76, 984–1001. [Google Scholar]
- Griliches, Z. Patent statistics as economic indicators: A survey. J. Econ. Lit. 1990, 28, 1661–1707. [Google Scholar]
- Porter, M.E.; Stern, S. Measuring the “Ideas” Production Function: Evidence from International Patent Output; NBER Working Paper No. 7891; National Bureau of Economic Research: Cambridge, MA, USA, 2000. [Google Scholar] [CrossRef]
- Jaffe, A.; Trajtenberg, M. Patents, Citations and Innovations; The MIT Press: Cambridge, MA, USA, 2002. [Google Scholar]
- Popp, D. Lessons from patents: Using patents to measure technological change in environmental models. Ecol. Econ. 2005, 54, 209–226. [Google Scholar] [CrossRef]
- Johnstone, N.; Haščič, I.; Popp, D. Renewable Energy Policies and Technological Innovation: Evidence Based on Patent Counts. Environ. Resour. Econ. 2010, 45, 133–155. [Google Scholar] [CrossRef]
- Kim, K.; Kim, Y. Role of policy ininnovation and international trade of renewable energy technology: Empirical study of solar PV and wind power technology. Renew. Sustain. Energy Rev. 2015, 44, 717–727. [Google Scholar] [CrossRef]
- Kim, K.; Heo, E.; Kim, Y. Dynamic Policy Impacts on a Technological-Change System of Renewable Energy: An Empirical Analysis. Environ. Resour. Econ. 2017, 66, 205–236. [Google Scholar] [CrossRef]
- Scherer, F.M. Interindustry Technology Flows and Productivity Growth. Rev. Econ. Stat. 1982, 64, 627–634. [Google Scholar] [CrossRef]
- Scherer, F.M. Using Linked Patent and R&D Data to Measure Interindustry Technology Flows. In R&D, Patents and Productivity; University of Chicago Press: Chicago, IL, USA, 1984; pp. 417–464. Available online: http://www.nber.org/chapters/c10061 (accessed on 26 October 2016).
- Jaffe, A. Real Effects of Academic Research. Am. Econ. Rev. 1989, 79, 957–970. [Google Scholar]
- Lanjouw, J.O.; Schankerman, M. Patent Quality and Research Productivity: Measuring Innovation with Multiple Indicators. Econ. J. 2004, 114, 441–465. [Google Scholar] [CrossRef]
- Schmookler, J. Invention and Economic Growth; Harvard University Press: Cambridge, MA, USA, 1966. [Google Scholar]
- Binswanger, H. A microeconomic approach to induced innovation. Econ. J. 1974, 84, 940–958. [Google Scholar] [CrossRef]
- Teece, D.J. Firm organization, industrial structure, and technological innovation. J. Econ. Behav. Organ. 1966, 31, 193–224. [Google Scholar] [CrossRef]
- Scherer, F.M.; Harhoff, D. Technology policy for a world of skew-distributed outcomes. Res. Policy 2000, 29, 559–566. [Google Scholar] [CrossRef]
- Kwaku, A.G. Differential Potency of Factors Affecting Innovation Performance in Manufacturing and Services Firms in Australia. J. Prod. Innov. Manag. 2003, 13, 35–52. [Google Scholar]
- Jaumotte, F.; Pain, N. From Ideas to Development: The Determinants of R&D and Patenting; OECD Economics Department Working Paper #457; ECO/WKP 44; OECD Publishing: Paris, France, 2005. [Google Scholar]
- Howarth, R.B.; Schipper, L.; Duerr, P.A.; Strøm, S. Manufacturing energy use in eight OECD countries: Decomposing the impacts of changes in output, industry structure and energy intensity. Energy Econ. 1991, 13, 135–142. [Google Scholar] [CrossRef]
- Torvanger, A. Manufacturing sector carbon dioxide emissions in OECD countries, 1973–87: A Divisia index decomposition to changes in fuel mix, emissions coefficient industry structure energy intensities and international structure. Energy Econ. 1991, 13, 168–186. [Google Scholar] [CrossRef]
- Ang, B.W. Decomposition methodology in industrial energy demand analysis. Energy 1995, 20, 1081–1095. [Google Scholar] [CrossRef]
- Lin, S.J.; Chang, T.C. Decomposition of SO2, NOx and CO2 emissions from energy use of major economic sector in Taiwan. Energy J. 1996, 17, 1–17. [Google Scholar] [CrossRef]
- Greening, L.A.; Davis, W.B.; Schipper, L. Decomposition of aggregate carbon intensity for the manufacturing sector: Comparison of declining trends from 10 OECD countries for the period 1971–1991. Energy Econ. 1998, 20, 43–65. [Google Scholar] [CrossRef]
- Kim, Y.; Worrell, E. International comparison of CO2 emission trends in the iron and steel industry. Energy Policy 2002, 30, 827–838. [Google Scholar] [CrossRef]
- Paul, S.; Bhattacharya, R.N. CO2 emission from energy use in India: A decomposition analysis. Energy Policy 2004, 32, 585–593. [Google Scholar] [CrossRef]
- Nag, B.; Parikh, J.K. Carbon emission coefficient of power consumption in India: Baseline determination from the demand side. Energy Policy 2005, 33, 777–786. [Google Scholar] [CrossRef]
- Lise, W. Decomposition of CO2 emissions over 1980–2003 in Turkey. Energy Policy 2006, 34, 1841–1852. [Google Scholar] [CrossRef]
- Kalirajan, K.P.; Obwona, M.B.; Zhao, S. A Decomposition of Total Factor Productivity Growth: The Case of Chinese Agricultural Growth before and after Reforms. Am. J. Agric. Econ. 1996, 78, 331–338. [Google Scholar] [CrossRef]
- Oosterhaven, J.; Hoen, A.R. Preferences, technology, trade and real income changes in the European Union: An intercountry decomposition analysis for 1975–1985. Ann. Reg. Sci. 1998, 32, 505–524. [Google Scholar] [CrossRef]
- Kim, J.; Marschke, G. Accounting for the recent surge in U.S. patenting: Changes in R&D expenditures, patent yields, and the high tech sector. Econ. Innov. New Technol. 2004, 13, 543–558. [Google Scholar]
- Johnson, P. Differences in Regional Firm Formation Rates: A Decomposition Analysis. Entrep. Theory Pract. 2004, 28, 431–445. [Google Scholar] [CrossRef]
- Pietro, M.P.C.; Constantin, C.; Keith, S.; Alexander, T.; Mike, T. Does Europe perform too little corporate R&D? A comparison of EU and non-EU corporate R&D performance. Res. Policy 2010, 39, 523–536. [Google Scholar]
- Reinstaller, A.; Unterlass, F. Comparing business R&D across countries over time: A decomposition exercise using data for the EU27. Appl. Econ. Lett. 2012, 19, 1143–1148. [Google Scholar]
- Fujii, H. Decomposition analysis of green chemical technology inventions from 1971 to 2010 in Japan. J. Clean. Prod. 2016, 112, 4835–4843. [Google Scholar] [CrossRef]
- Fujii, H.; Managi, S. Research and development strategy for environmental technology in Japan: A comparative study of the private and public sectors. Technol. Forecast. Soc. Chang. 2016, 112, 293–302. [Google Scholar] [CrossRef]
- Fujii, H.; Yoshida, K.; Sugimura, K. Research and development strategy in biological technologies: Patent data analysis in Japanese manufacturing firms. Sustainability 2016, 8, 351. [Google Scholar] [CrossRef]
- Organization for Economic Cooperation and Development (OECD). Measuring the Information Economy; OECD: Paris, France, 2002. [Google Scholar]
- Schumpeter, J.A. Capitalism, Socialism and Democracy; McGraw-Hill: New York, NY, USA, 1942. [Google Scholar]
- Mansfield, E. The Economics of Technical Change; Norton: New York, NY, USA, 1968. [Google Scholar]
- Lundvall, B.A. National Systems of Innovation: Towards a Theory of Innovation and Interactive Learning; Pinter: London, UK, 1992. [Google Scholar]
- Nelson, R.R. National Systems of Innovation: A Comparative Study; Oxford University Press: Oxford, UK, 1993. [Google Scholar]
- Smith, K. The Systems Challenge to Innovation Policy. In Industrie und Glueck; Polt, W., Weber, B., Eds.; Paradigmenwechsel in der Industrie- und Technologiepolitik: Vienna, Austria, 1996. [Google Scholar]
- Freeman, C. The ‘National Innovation Systems’ in historical perspective. Camb. J. Econ. 1995, 19, 5–24. [Google Scholar]
- Organization for Economic Cooperation and Development (OECD). Managing National Innovation Systems; OECD: Paris, France, 1999. [Google Scholar]
- Popp, D. Pollution control innovations and the Clean Air Act of 1990. J. Policy Anal. Manag. 2003, 22, 641–660. [Google Scholar] [CrossRef]
- World Intellectual Property Organization (WIPO). World Intellectual Property Indicators; WIPO Economics & Statistics Series (WIPO Publication No. 941E); WIPO: Geneva, Switzerland, 2011. [Google Scholar]
- Cohen, W.M.; Levin, R.C.; Mowery, D.C. Firm Size and R&D Intensity: A Re-Examination; Working Paper No. 2205; National Bureau of Economic Research: New York, NY, USA, 1987. [Google Scholar]
- Sun, J.W. Decomposition of aggregate CO2 emissions in the OECD: 1960–1995. Energy J. 1999, 20, 147–155. [Google Scholar] [CrossRef]
- Ang, B.W.; Zhang, F.Q.; Choi, L.H. Factorizing changes in energy and environmental indicators through decomposition. Energy 1998, 23, 489–495. [Google Scholar] [CrossRef]
- Ang, B.W. The LMDI approach to decomposition analysis: A practical guide. Energy Policy 2005, 33, 867–871. [Google Scholar] [CrossRef]
- Cialani, C. Economic growth and environmental quality: An econometric and a decomposition analysis. Manag. Environ. Qual. Int. J. 2007, 18, 568–577. [Google Scholar] [CrossRef]
- Pakes, A.; Griliches, Z. Patents and R&D at the firm level: A first report. Econ. Lett. 1980, 5, 377–381. [Google Scholar]
- Hall, B.H.; Griliches, Z.; Hausman, J.A. Patents and R&D: Is There a Lag? Int. Econ. Rev. 1986, 27, 265–284. [Google Scholar]
- Evenson, R.; Putnam, J. The Yale-Canada patent Flow Concordance; Economic Growth Centre Working Paper; Yale University: New Haven, CT, USA, 1988. [Google Scholar]
- Schmoch, U.; Laville, F.; Patel, P.; Frietsch, R. Linking Technology Areas to Industrial Sectors; Final Report to the European Commission, DG Research; Fraunhofer ISI: Karlsruhe, Germany, 2003. [Google Scholar]
- Verspagen, B.; Morgastel, T.V.; Slabbers, M. MERIT Concordance Table: IPC-ISIC; Revision 2; MERIT Research Memorandum 2/94-004; MERIT: Maastricht, The Netherlands, 1994. [Google Scholar]
- World Intellectual Property Organization. World Intellectual Property Indicators; World Intellectual Property Organization: Geneva, Switzerland, 2009. [Google Scholar]
- OECD StatExtracts. Patent by Technology; OECD: Paris, France, 2014; Available online: http://stats.oecd.org/index.aspx (accessed on 10 December 2014).
- OECD StatExtracts. STAN R&D Expenditure in Industry ISIC; Revision 3; OECD: Paris, France, 2014; Available online: http:// stats.oecd.org/index.aspx (accessed on 10 December 2014).
- United Nations Industrial Development Organization (UNIDO). Industrial Statistics Database 2014 Edition at the 3- and 4-Digit Level of ISIC Rev. 3. 2014. Available online: http://www.unido.org/resources/stastics/statistics/indstat4-2015-edition.html (accessed on 10 December 2014).
- Park, W.G. International patent protection: 1960–2005. Res. Policy 2008, 37, 761–766. [Google Scholar] [CrossRef]
- Gilbert, R.; Newbery, D. Pre-emptive Patenting and the Persistence of Monopoly. Am. Econ. Rev. 1982, 74, 514–526. [Google Scholar]
- Vickers, J. The Evolution of market structure when there is a sequence of innovations. J. Indus. Econ. 1986, 35, 1–12. [Google Scholar] [CrossRef]
- Backer, S.; Mezzetti, C. Disclosure as a Strategy in the Patent Race. J. Law Econ. 2005, 48, 173–194. [Google Scholar] [CrossRef]
- Auerswald, P.; Branscomb, L.; Demos, N.; Min, B.K. Understanding Private-Sector Decision Making for Early-Stage Technology Development: A “Between Invention and Innovation Project”; Report No. NIST GCR 02-841A; National Institute of Standards and Technology, US Department of Commerce: Gaithersburg, MD, USA, 2005.
- Dalmarco, G.; Dewes, M.F.; Zawislak, P.A.; Padula, A.D. Universities’ Intellectual Property: Path for Innovation or Patent Competition? J. Technol. Manag. Innov. 2011, 6, 159–170. [Google Scholar] [CrossRef]
- Hall, B.H. Patents and patent policy. Oxf. Rev. Econ. Policy 2007, 23, 568–587. [Google Scholar] [CrossRef]
- Hall, B.H.; Ziedonis, R.H. The Patent Paradox Revisited: An Empirical Study of Patenting in the US Semiconductor Industry, 1979–1995. RAND J. Econ. 2001, 32, 101–128. [Google Scholar] [CrossRef]
- Lerner, J. Patent Policy Shifts and Innovation over 150 Years. Am. Econ. Rev. 2002, 92, 221–225. [Google Scholar] [CrossRef]
- Arora, A.; Merges, R.P. Specialized Supply Firms, Property Rights, and Firm Boundaries. Ind. Corp. Chang. 2004, 13, 451–475. [Google Scholar] [CrossRef]
- Arora, A.; Ceccagnoli, M.; Cohen, W. R&D and the Patent Premium. Int. J. Ind. Organ. 2008, 26, 1153–1179. [Google Scholar]
- Cohen, W.M.N.; Richard, R.; Walsh, J.P. Protecting Their Intellectual Assets: Appropriability Conditions and Why U.S. Manufacturing Firms Patent (or Not); National Bureau of Economic Research Working Paper Series No.7552; National Bureau of Economic Research: Cambridge, MA, USA, 2000. [Google Scholar]
- Bessen, J.; Maskin, E. Sequential innovation, patents, and imitation. RAND J. Econ. 2009, 40, 611–635. [Google Scholar] [CrossRef]
- Woo, S.K.; Jang, P.; Kim, Y. Effects of intellectual property rights and patented knowledge in innovation and industry value added: A multinational empirical analysis of different industries. Technovation 2015, 43–44, 49–63. [Google Scholar] [CrossRef]
- Gould, D.M.; Gruben, W.C. The role of intellectual property rights in economic growth. J. Dev. Econ. 1996, 48, 323–350. [Google Scholar] [CrossRef]
- Park, W.G.; Ginarte, J.C. Intellectual Property Rights and Economic Growth, Contemporary. Econ. Policy 1997, 15, 51–61. [Google Scholar]
- Kanwar, S.; Evenson, R. Does Intellectual Property Protection Spur Technical Change? Oxf. Econ. Pap. 2003, 55, 235–264. [Google Scholar] [CrossRef]
- Allred, B.B.; Park, W.G. The influence of patent protection on firm innovation investment in manufacturing industries. J. Int. Manag. 2007, 13, 91–109. [Google Scholar] [CrossRef]
- Von Graevenitz, G.; Wagner, S.; Harhoff, D. How to measure patent thickets-a novel approach. Econ. Lett. 2011, 111, 6–9. [Google Scholar] [CrossRef]
- Ang, B.W. Decomposition of industrial energy consumption. Energy Econ. 1994, 16, 163–174. [Google Scholar] [CrossRef]
- Zhang, F.Q.; Ang, B.W. Methodological issues in cross-country/region decomposition of energy and environment indicators. Energy Econ. 2001, 23, 179–190. [Google Scholar] [CrossRef]

| Parameter | Specific Substance |
|---|---|
| Total patent application of the ICT industry in period T | |
| Patent application of sub-sector i in the ICT industry in period T | |
| Business R&D expenditure of sub-sector i in the ICT industry in period T − 1 | |
| Total value added for 44 industries, including ICT, in period T − 1 | |
| Value added for the ICT industry in period T − 1 | |
| Value added for sub-sector i in the ICT industry in period T − 1 |
| Sub-Sector of ICT Industry by ISIC | ISIC Code | Field No. | Field Description of FOS Concordance |
|---|---|---|---|
| Office Machinery and Computers | 3000 | 28 | Office machinery and computers |
| Electronic Components | 3210 | 34 | Electronic components |
| Television, Radio, and Communications Equipment | 3220 | 35 | Signal transmission, telecommunications |
| 3230 | 36 | Television and radio receivers, audiovisual electronics |
| Country | Analysis Period (Based on Patent Data) | Average of ICT Patent Applications (No., Fractional Count) | Average of ICT R&D Expenditure (US $) | Average of Value-Added in ICT Industry (US $) | Average of Value-Added in Total Industry (US $) |
|---|---|---|---|---|---|
| Belgium | 2001–2009 | 118.00 | 4.59 ×10⁸ | 2.07 × 10⁹ | 4.92 × 10¹⁰ |
| Czech Republic | 2001–2007 | 12.12 | 6.00 × 10⁷ | 6.60 × 10⁸ | 1.91 × 10¹⁰ |
| France | 2001–2008 | 1302.42 | 3.24 × 10⁹ | 1.03 × 10¹⁰ | 2.29 × 10¹¹ |
| Germany | 2001–2008 | 2620.64 | 4.67 × 10⁹ | 1.62 × 10¹⁰ | 4.8 × 10¹¹ |
| Italy | 2001–2009 | 307.67 | 1.15 × 10⁹ | 5.88 × 10⁹ | 2.41 × 10¹¹ |
| Korea | 2001–2007 | 1522.62 | 9.52 × 10⁹ | 4.97 × 10¹⁰ | 2.41 × 10¹¹ |
| Spain | 2001–2009 | 151.78 | 3.09 × 10⁸ | 1.69 × 10⁹ | 1.40 × 10¹¹ |
| United States | 2001–2009 | 13,618.49 | 3.54 × 10¹⁰ | 1.49 × 10¹¹ | 2.10 × 10¹² |
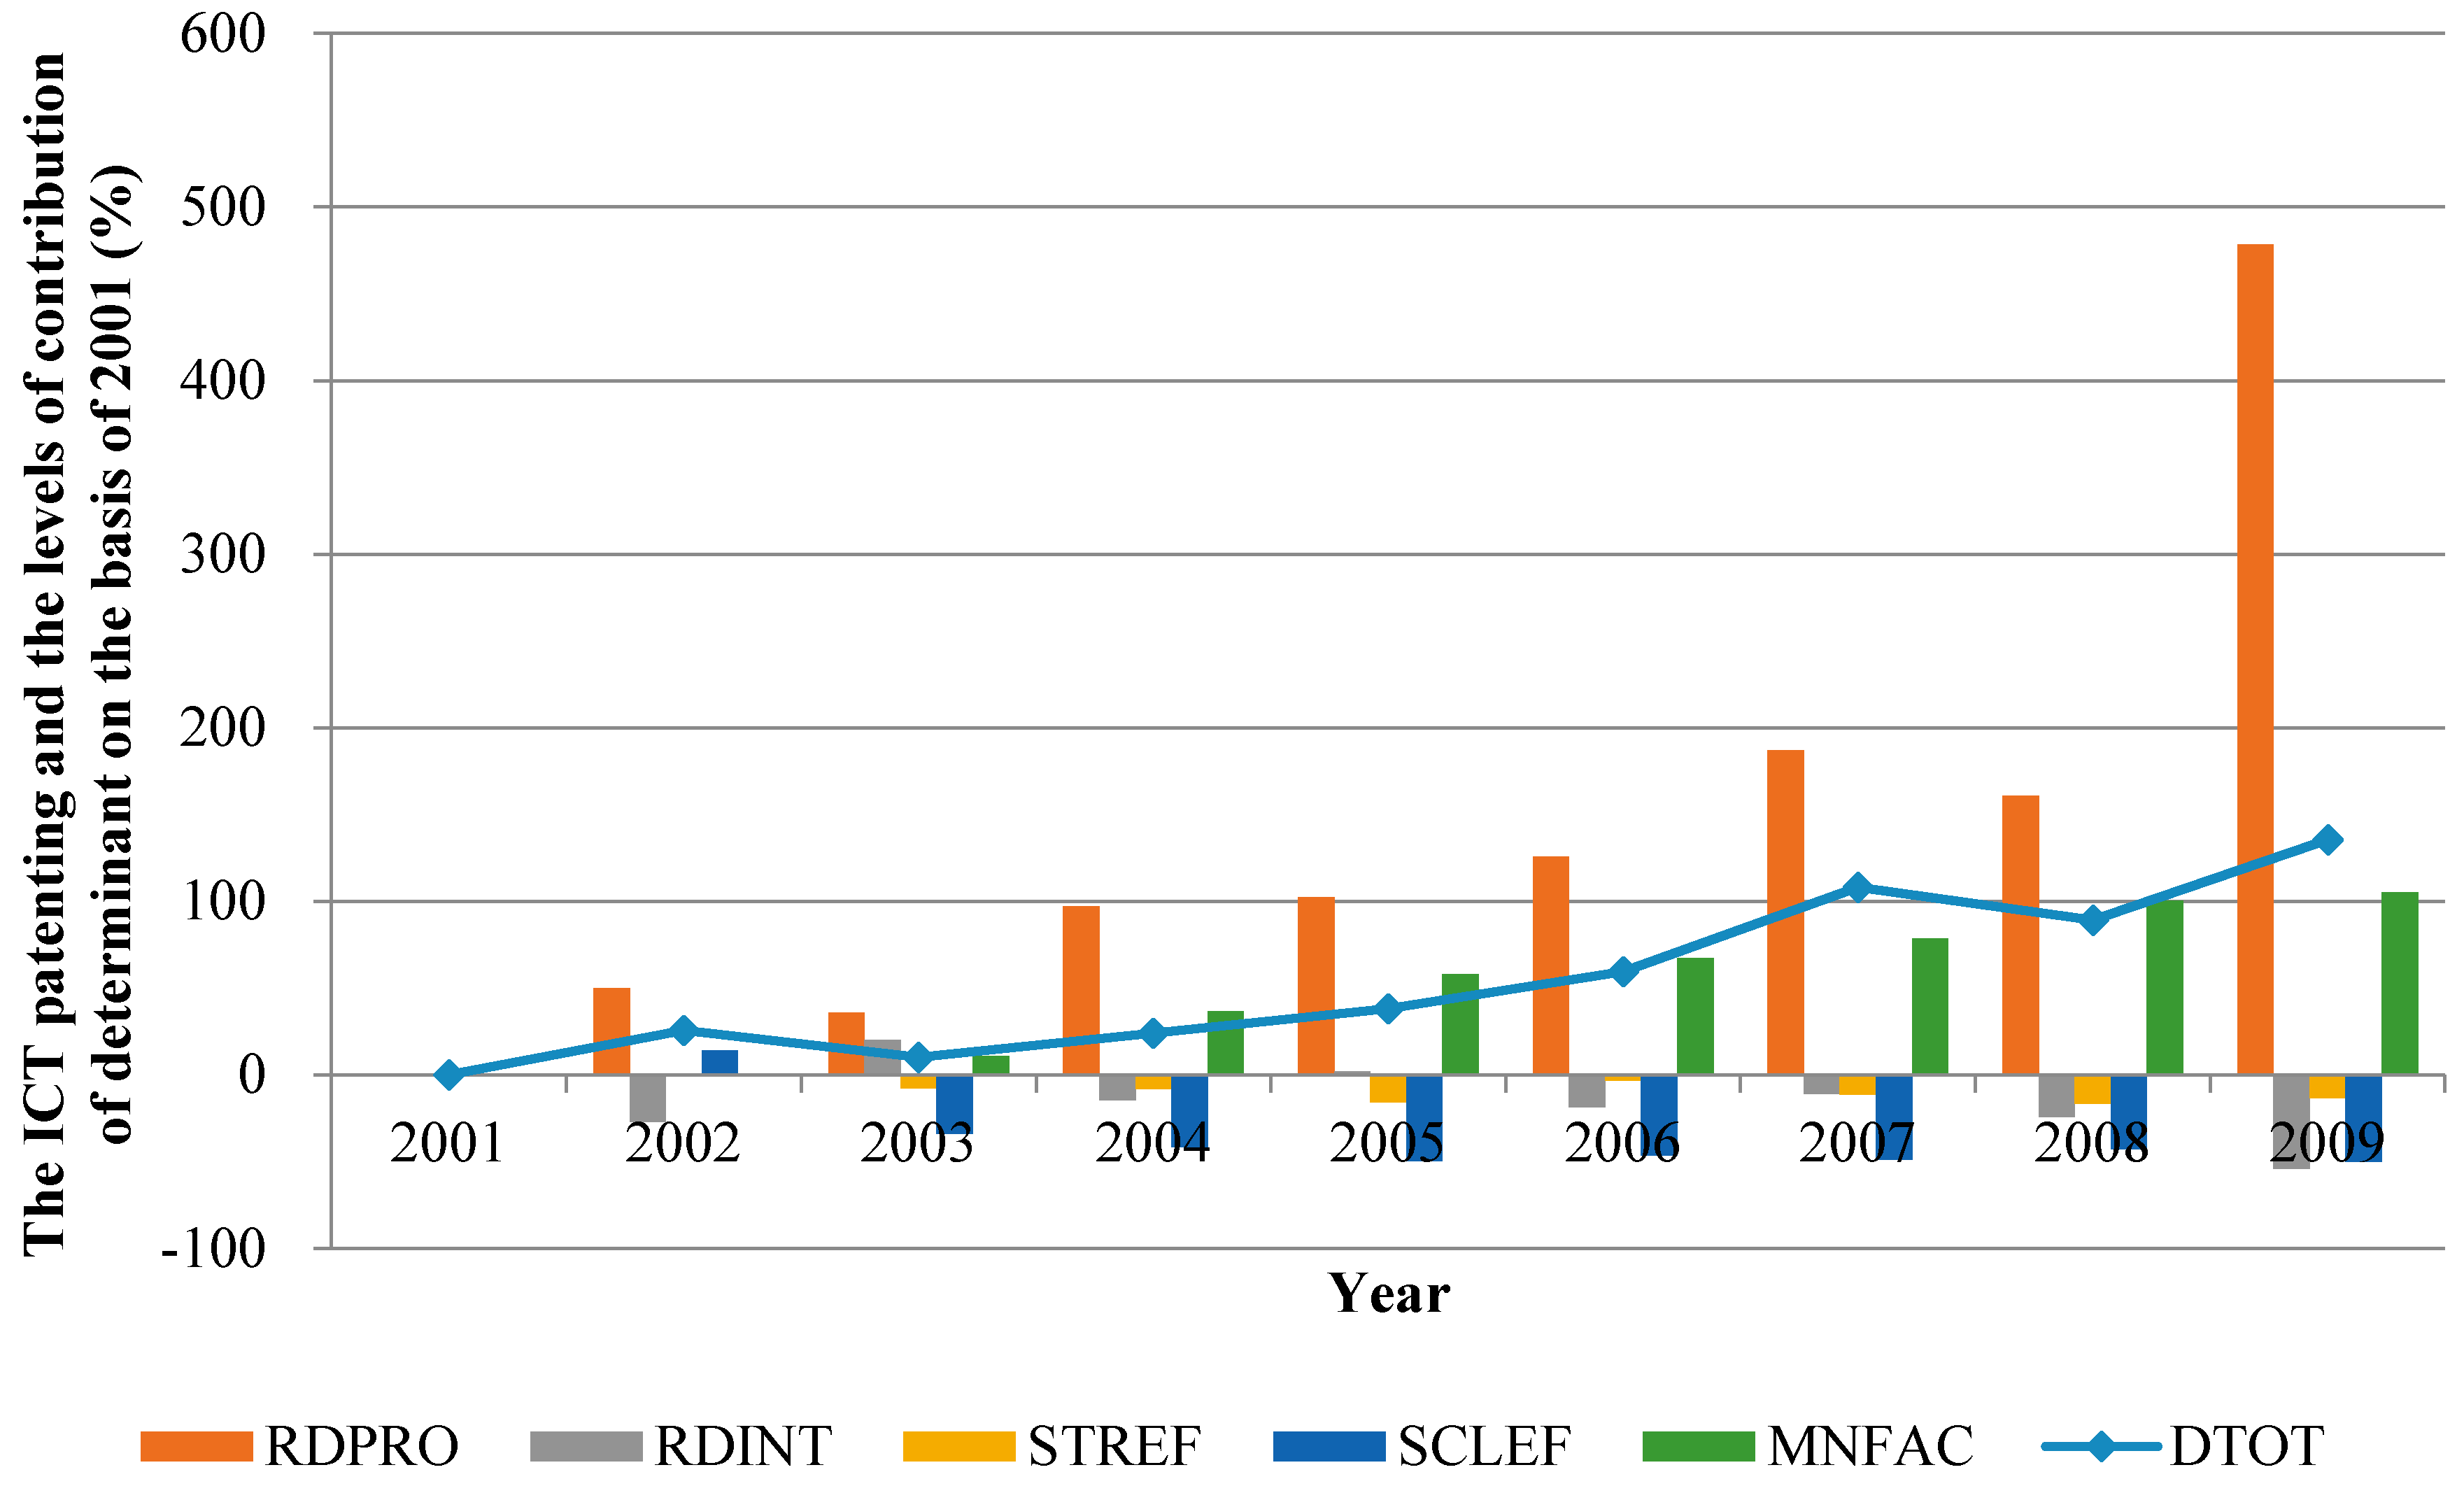
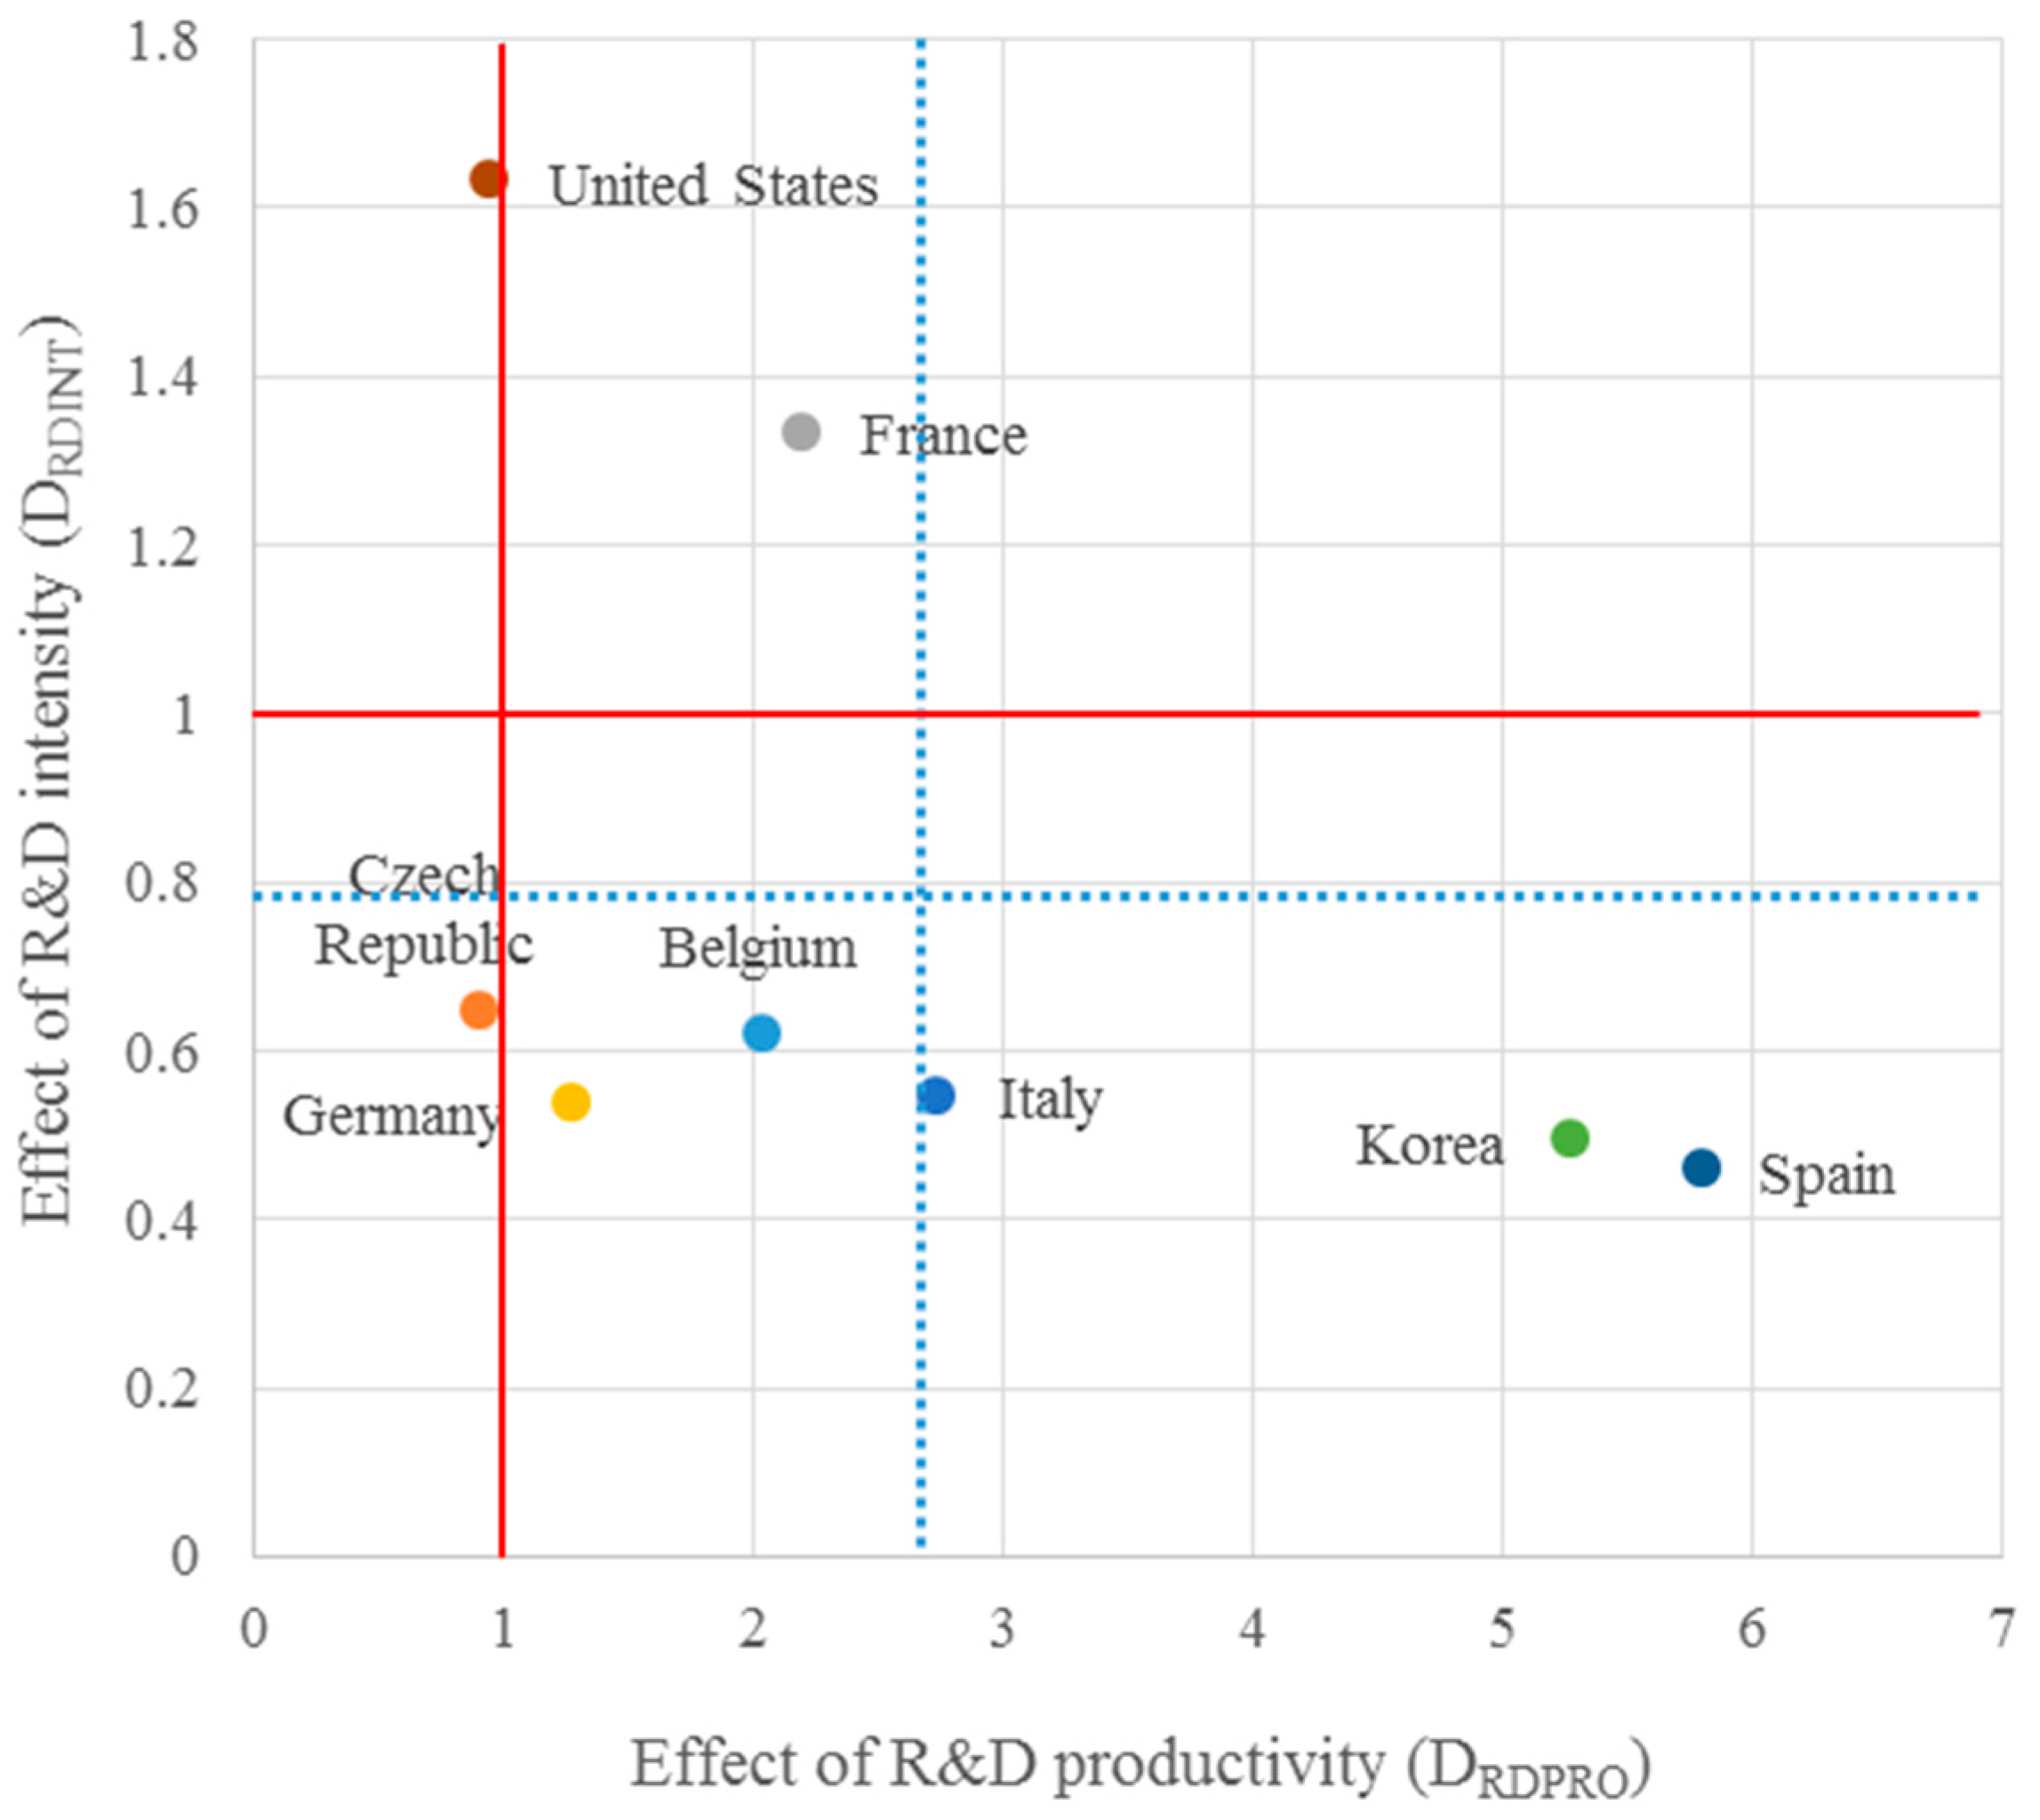
| Country | Period | Change in ICT Patenting (DTOT) | Effect of R&D Productivity (DRDPRO) | Effect of R&D Intensity (DRDINT) | Effect of Industrial Structure (DSTREF) | Effect of Industry Scale (DSCLEF) | Effect of Manufacturing Activity (DMNFAC) |
|---|---|---|---|---|---|---|---|
| Belgium | 2001–2009 | 2.1513 | 2.0240 | 0.6224 | 1.2636 | 0.7304 | 1.8504 |
| Czech Republic | 2001–2007 | 1.7624 | 0.9038 | 0.6499 | 0.9599 | 1.1010 | 2.8391 |
| France | 2001–2008 | 1.3943 | 2.1837 | 1.3365 | 0.6098 | 0.4934 | 1.5877 |
| Germany | 2001–2008 | 1.1051 | 1.2673 | 0.5375 | 0.9740 | 0.9400 | 1.7720 |
| Italy | 2001–2009 | 1.6486 | 2.7260 | 0.5486 | 1.0745 | 0.6191 | 1.6570 |
| Korea | 2001–2007 | 3.6744 | 5.2710 | 0.4951 | 0.7540 | 1.0482 | 1.7816 |
| Spain | 2001–2009 | 2.3553 | 5.7855 | 0.4599 | 0.8655 | 0.4989 | 2.0503 |
| United States | 2001–2009 | 0.9752 | 0.9375 | 1.6336 | 0.9937 | 0.5577 | 1.1489 |
| Average Effect of Determinants for the Eight Countries | 1.8833 | 2.6374 | 0.7854 | 0.9369 | 0.7486 | 1.8359 | |
© 2017 by the authors. Licensee MDPI, Basel, Switzerland. This article is an open access article distributed under the terms and conditions of the Creative Commons Attribution (CC BY) license (http://creativecommons.org/licenses/by/4.0/).
Share and Cite
Kim, K.; Shin, J.; Choi, J.Y. Impact Analysis of Economic Contributors on Knowledge Creation Activity by Using the Symmetric Decomposition Method. Symmetry 2017, 9, 251. https://doi.org/10.3390/sym9110251
Kim K, Shin J, Choi JY. Impact Analysis of Economic Contributors on Knowledge Creation Activity by Using the Symmetric Decomposition Method. Symmetry. 2017; 9(11):251. https://doi.org/10.3390/sym9110251
Chicago/Turabian StyleKim, Kyunam, Jungwoo Shin, and Jae Young Choi. 2017. "Impact Analysis of Economic Contributors on Knowledge Creation Activity by Using the Symmetric Decomposition Method" Symmetry 9, no. 11: 251. https://doi.org/10.3390/sym9110251
APA StyleKim, K., Shin, J., & Choi, J. Y. (2017). Impact Analysis of Economic Contributors on Knowledge Creation Activity by Using the Symmetric Decomposition Method. Symmetry, 9(11), 251. https://doi.org/10.3390/sym9110251