You are currently viewing a new version of our website. To view the old version click .
Symmetry
  • Article
  • Open Access

1 September 2016

Social Content Recommendation Based on Spatial-Temporal Aware Diffusion Modeling in Social Networks

and
School of Electronics and Information Engineering, Korea Aerospace University, Deogyang-gu, Goyang-si, Gyeonggi-do 412-791, Korea
*
Author to whom correspondence should be addressed.
This article belongs to the Special Issue Symmetry in Complex Networks II

Abstract

User interactions in online social networks (OSNs) enable the spread of information and enhance the information dissemination process, but at the same time they exacerbate the information overload problem. In this paper, we propose a social content recommendation method based on spatial-temporal aware controlled information diffusion modeling in OSNs. Users interact more frequently when they are close to each other geographically, have similar behaviors, and fall into similar demographic categories. Considering these facts, we propose multicriteria-based social ties relationship and temporal-aware probabilistic information diffusion modeling for controlled information spread maximization in OSNs. The proposed social ties relationship modeling takes into account user spatial information, content trust, opinion similarity, and demographics. We suggest a ranking algorithm that considers the user ties strength with friends and friends-of-friends to rank users in OSNs and select highly influential injection nodes. These nodes are able to improve social content recommendations, minimize information diffusion time, and maximize information spread. Furthermore, the proposed temporal-aware probabilistic diffusion process categorizes the nodes and diffuses the recommended content to only those users who are highly influential and can enhance information dissemination. The experimental results show the effectiveness of the proposed scheme.

1. Introduction

Recommender systems are web-based applications, tools, techniques, and programs that are used to provide suggestions for items and products of interest; they do this by analyzing user interactions and consumed content histories [1,2]. Social content recommendations use social networks and user interactions to model recommendation processes. At present, online social networks (OSNs) are increasing in importance and have become a fundamental medium to diffuse information to a large number of people. The surge of social networking sites (SNSs) has enabled user interactions from anywhere and has opened a new era of social interaction, collaboration, preference collection, and tagging for personalization. Information exchange is the keystone of a structured society, and OSNs play important roles in propagating information and enabling users to receive information of interest across many areas, including interest-based community detection [3], political influence [4,5], and economic networks [5,6,7]. SNSs such as Facebook, Twitter, and LinkedIn enable users to share opinions and status updates (newsfeeds) effortlessly with masses of people on any topic. A recent Facebook study [8] showed that the average separation between users was 4.7 hops. Increasing friends, followers, and acquaintances provides constant information updates, which increases the information overload problem. Koroleva et al. regarded constant information updates as a double-edged sword [9]. On the one hand, the increasing number of users helped to maximize the contagion process to spread information to a large number of OSN users. On the other hand, a user receives hundreds or even thousands of newsfeeds, and most of them are non-newsworthy. User frustration increases when receiving the same newsfeed with non-newsworthy updates at the top of their SNSs walls. Figure 1 shows a newsfeed with updates at different times on a Facebook wall. Figure 1a shows the updated newsfeed after 2 h, and Figure 1b is the same newsfeed with updates after 8 h on the top of the wall. However, there is not much newsworthy information. As a user’s network of friends expands, their continuous newsfeed updates increase the probability that a user will miss important newsfeeds. This paper proposes a selective diffusion based recommendation technique that incorporates spatial-temporal information and user specific information to identify whether or not to recommend specific information to a user.
Figure 1. The same newsfeed with updates at the top of a Facebook wall at different times: (a) status of newsfeed after 2 h; and (b) same newsfeed after 8 h with some non-newsworthy updates.
A social network (SN) is modeled as a graph of people (nodes) connected by friendship or mutual interests (links/edges). OSNs not only provide a meeting point and facilitate the building of social relations among a large number of people, they also play important roles in spreading information, news, ideas, and innovations. The link between nodes may be directed or undirected and provides a “word-of-mouth” communication channel [10,11]. The Oxford dictionary [12] defines diffusion as the spreading of something more widely. Connected nodes spread information in OSNs, and a network with high connectivity maximizes the information spread. In 1969, Milgram [13] requested 240 people to write a letter to a stockbroker in Boston. The participants did not know the stockbroker or his address. Nevertheless, 60 letters reached the target destination. It took an average of 6.2 hops for this to happen, creating the six-degrees-of-separation adage. Cheng [14] analyzed 5.2 billion Twitter friendships and discovered five degrees of separation within the Twitter network. These studies only provided a degree of separation for the diffusion of information. They did not determine which pieces of information diffused more frequently, or how and through which path they diffused. Typically, it is unnecessary to diffuse messages to an entire network. Groups such as service providers, politicians, security analysts, and crime prevention services are keenly interested in identifying people in society that are effective at spreading information. This knowledge helps these groups to maximize their own information dissemination.
Influence is the capacity to have an effect on the character, development, or behavior of someone or something, or the effect itself [12]. Social influence is a phenomenon in which an individual impels his connection to behave in a similar way [15]. The flow of information in OSNs is only possible if individuals can influence one another. Teo [16] analyzed demographic and motivation variables associated with Internet usage activities and showed that individuals with similar demographics and behaviors tended to engage in similar activities. Social influence involves a three steps process: (i) a set of nodes that can exert influence; (ii) the method of contagion of the influence; and (iii) the set of nodes that can adapt the influence. In social influence maximization, a small set of nodes is considered that can maximize information diffusion. However, selecting these in a large network is an NP-hard problem [5]. In this work, we model the social ties relationship considering multicriteria information. There are four categories of information—user spatial information, user interactions and activity history for social trust, user opinions on similar items, and user demographics. We rank the nodes considering friends and friends-of-friends to select the most influential nodes for diffusion.
The ubiquity of smart devices, communication technologies, and online social media enables people to be connected all the time, and this in turn makes it possible for information to be diffused at anytime from anywhere. Spatial and temporal circumstances no longer constrain information diffusion. Individuals receive information in a continuous stream over time, merging small pieces of information at different spatial locations and then conveying them to the masses over OSNs. Several mathematical models have been proposed to model the distribution of information in OSNs, but none of them is comprehensive [17]. The heterogeneity of user interactions and mobility concerning links, the dynamic structure of OSNs, and the merging of information over time and space have opened a new era of research on information diffusion and user behaviors in OSNs. This article explores how a piece of information diffuses temporally and provides a mathematical model to control the diffusion process in OSNs.
The rest of the paper is organized as follows. Section 2 explains the related work and background knowledge regarding social networks and information diffusion. Section 3 introduces the proposed scheme, which incorporates a spatial-temporal approach with selective diffusion-based social content recommendations. In Section 4, our approaches are compared to various state-of-the-art ranking and diffusion techniques using simulation results. Finally, the conclusion is presented in Section 5.

3. Social Content Recommendations Based on Spatial-Temporal Aware Diffusion in Social Networks

This section presents the proposed spatial-temporal aware selective flooding-based information diffusion in OSNs. Focus is placed on algorithms that are able to model the multicriteria-based social ties relationships between users, rank nodes to find the most influential individuals from whom the users can accept information, and provide temporal aware probabilistic diffusion-based content recommendations. In OSNs, spatial and temporal information are two important factors along with network topology and user interactions when attempting to understand information dissemination in SNs. We model multicriteria-based social ties relationships between users considering each user’s spatial information, their interactions with respect to content sharing, the extent to which friends share the same content with other users in the SNS, opinions on various items and products, and user demographics. We rank the nodes using the proposed SocNodeRank ranking algorithm to select the Top K nodes as seeds to maximize the information distribution in the SNs. The diffusion process is modeled as a temporal aware probabilistic diffusion model that maximizes the information distribution (i.e., recommendations).

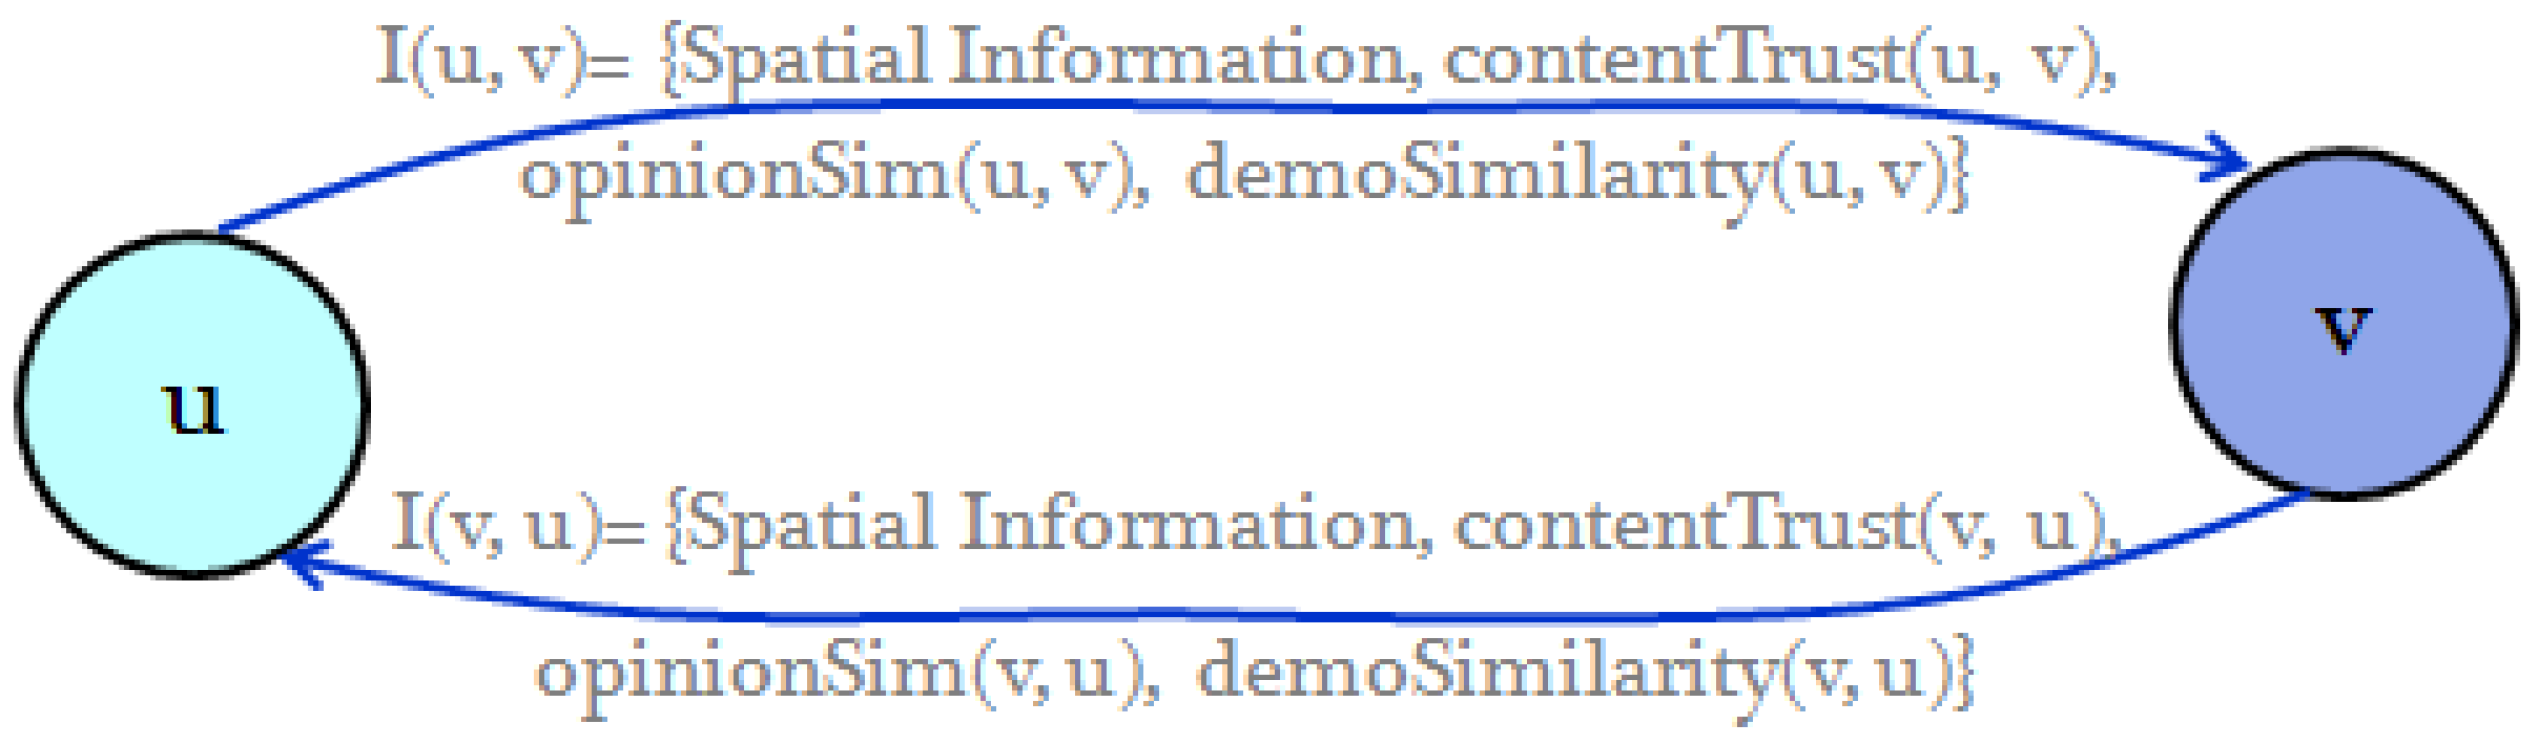
3.1. Multicriteria-Based Social Ties Relationship (Influence) Modeling

The SNS graph will be either directed or undirected. In an undirected network, edges do not have direction and the relationship from either of the nodes remains the same (symmetric). In reality, the heterogeneous nature of user interactions causes OSNs to be directed networks in nature, and the two neighboring users have different levels of influence (asymmetric) on one another. Figure 2 gives a pictorial representation of the proposed social ties relationship modeling considering two direct neighbor users, u and v .
Figure 2. Pictorial overview of multicriteria-based social ties relationship (influence) modeling.
An SNS provides the location of a user, and we use each user’s position (GPS coordinates) to determine spatial similarity. Equation (1) finds the spatial similarity of two users using the cosine similarity normalized by the geo-distance between the users.
s p S i m ( u , v ) = 1 [ 1 + d i s t ( u , v ) 1000 ] ( C u . C v | | C u | | | | C v | | )
where d i s t ( u , v ) is the geo-distance between the users and can be found by Equation (2) using the Haversine formula [57,58].
{ a = s i n 2 ( Δ 2 ) + c o s ( C u ) c o s ( C v ) s i n 2 ( Δ φ 2 ) ; w h e r e   Δ = | C u C v | ,   Δ φ = | φ C u φ C v | c = 2 arctan ( a 1 a ) d i s t ( u , v ) = R   × c ;   where   R   is   the   radius   of   the   Earth
where C u and C v are the GPS coordinates of users u and v , respectively. Each GPS point has latitude ( ) and longitude ( φ ) coordinates. C u and φ C u are the latitude and longitude of user u GPS coordinate ( C u ), and C v and φ C v are the latitude and longitude of user v GPS coordinate ( C v ). R is the radius of earth, 6371 km.
In OSNs, social relationships vary based on the acceptance and adoption of content by other users. Users like to recommend and share message with people who easily accept that information and share it with other users. In this paper, we consider that users only accept and adopt content from individuals who shared that content with other users. Figure 3 shows the overview of content acceptance by a user, and that content being shared to the walls of other users. Figure 3a shows content being shared by user u to user v , and v shares part of that content to his directly neighboring users. Content acceptance (contentTrust) between users u and v in Figure 4a will be c o n t e n t T r u s t ( u , v ) = 1 3 ( ( 2 + 0 + 1 ) 3 ) = 1 3 . In Figure 3b, it will be c o n t e n t T r u s t ( u , v ) = 1 3 ( 3 + 3 + 3 3 ) = 1 . Mathematically, the c o n t e n t T r u s t between any two users such as u and v can be found by Equation (3).
c o n t e n t T r u s t ( u , v ) = 1 | C S e t | c C S e t | n v , c | | N v |
where | C S e t | is the set of content user u shared to user v , | N v | is the number of neighbors of user v and | n v , c | are the users from N v diffused by content c .
Figure 3. Content sharing by friends and friends-of-friends in an SNS: (a) content sharing by user u to v and v share partial content to his friends; and (b) content sharing by user u to w and w share all content to his friends.
Figure 4. Overview of proposed social node rank (SocNodeRank): (a) SocNodeRank in an undirected network; and (b) SocNodeRank in the directed network.
In OSNs, users easily adopt content from users who experienced content in the past. Recommender systems mostly recommend user content to active users with similar content histories. In this paper, we consider experienced content similarity as a factor to find the influence between users. The content similarity between users u and v can be found by Equation (4)
o p i n i o n S i m ( u , v ) = 1 i ( C S e t u C S e t v ) | R u , i R v , i | R m a x   | C S e t u   C S e t v |
where C S e t u and C S e t v are the sets of content experienced by users u and v , respectively; R m a x is the maximum rating; and i is the content experienced by both users u and v .
Users with similar demographic characteristics in OSNs are most likely to connect with each other. In reality, most businesses and service providers treat service consumers unequally, and they segment consumers based on demographics such as age, gender, and income for various smart services. This paper considers age, gender, and occupation to find similarities between users using the cosine similarity technique in Equation (5).
d e m o S i m ( u , v ) = i = 1 D u i v i i = 1 D u i 2 i = 1 D v i 2
where i are the demographic attributes of users u and v , and D is the total of the demographics attributes. The influence, I ( u , v ) , of user u on v , is depicted in Figure 3, and it can be calculated using Equation (6).
I ( u , v ) =   α   s p S i m ( u , v ) +   β   c o n t e n t T r u s t ( u ,   v ) +   γ   o p i n i o n S i m ( u ,   v ) +   ω   d e m o S i m ( u ,   v )
where α ,   β ,   γ ,   and   ω are the real numbers from interval [ 0 , 1 ] such that α + β + γ + ω = 1 . We adjust the coefficients by considering the contributions and importance of the criteria in Equation (6).

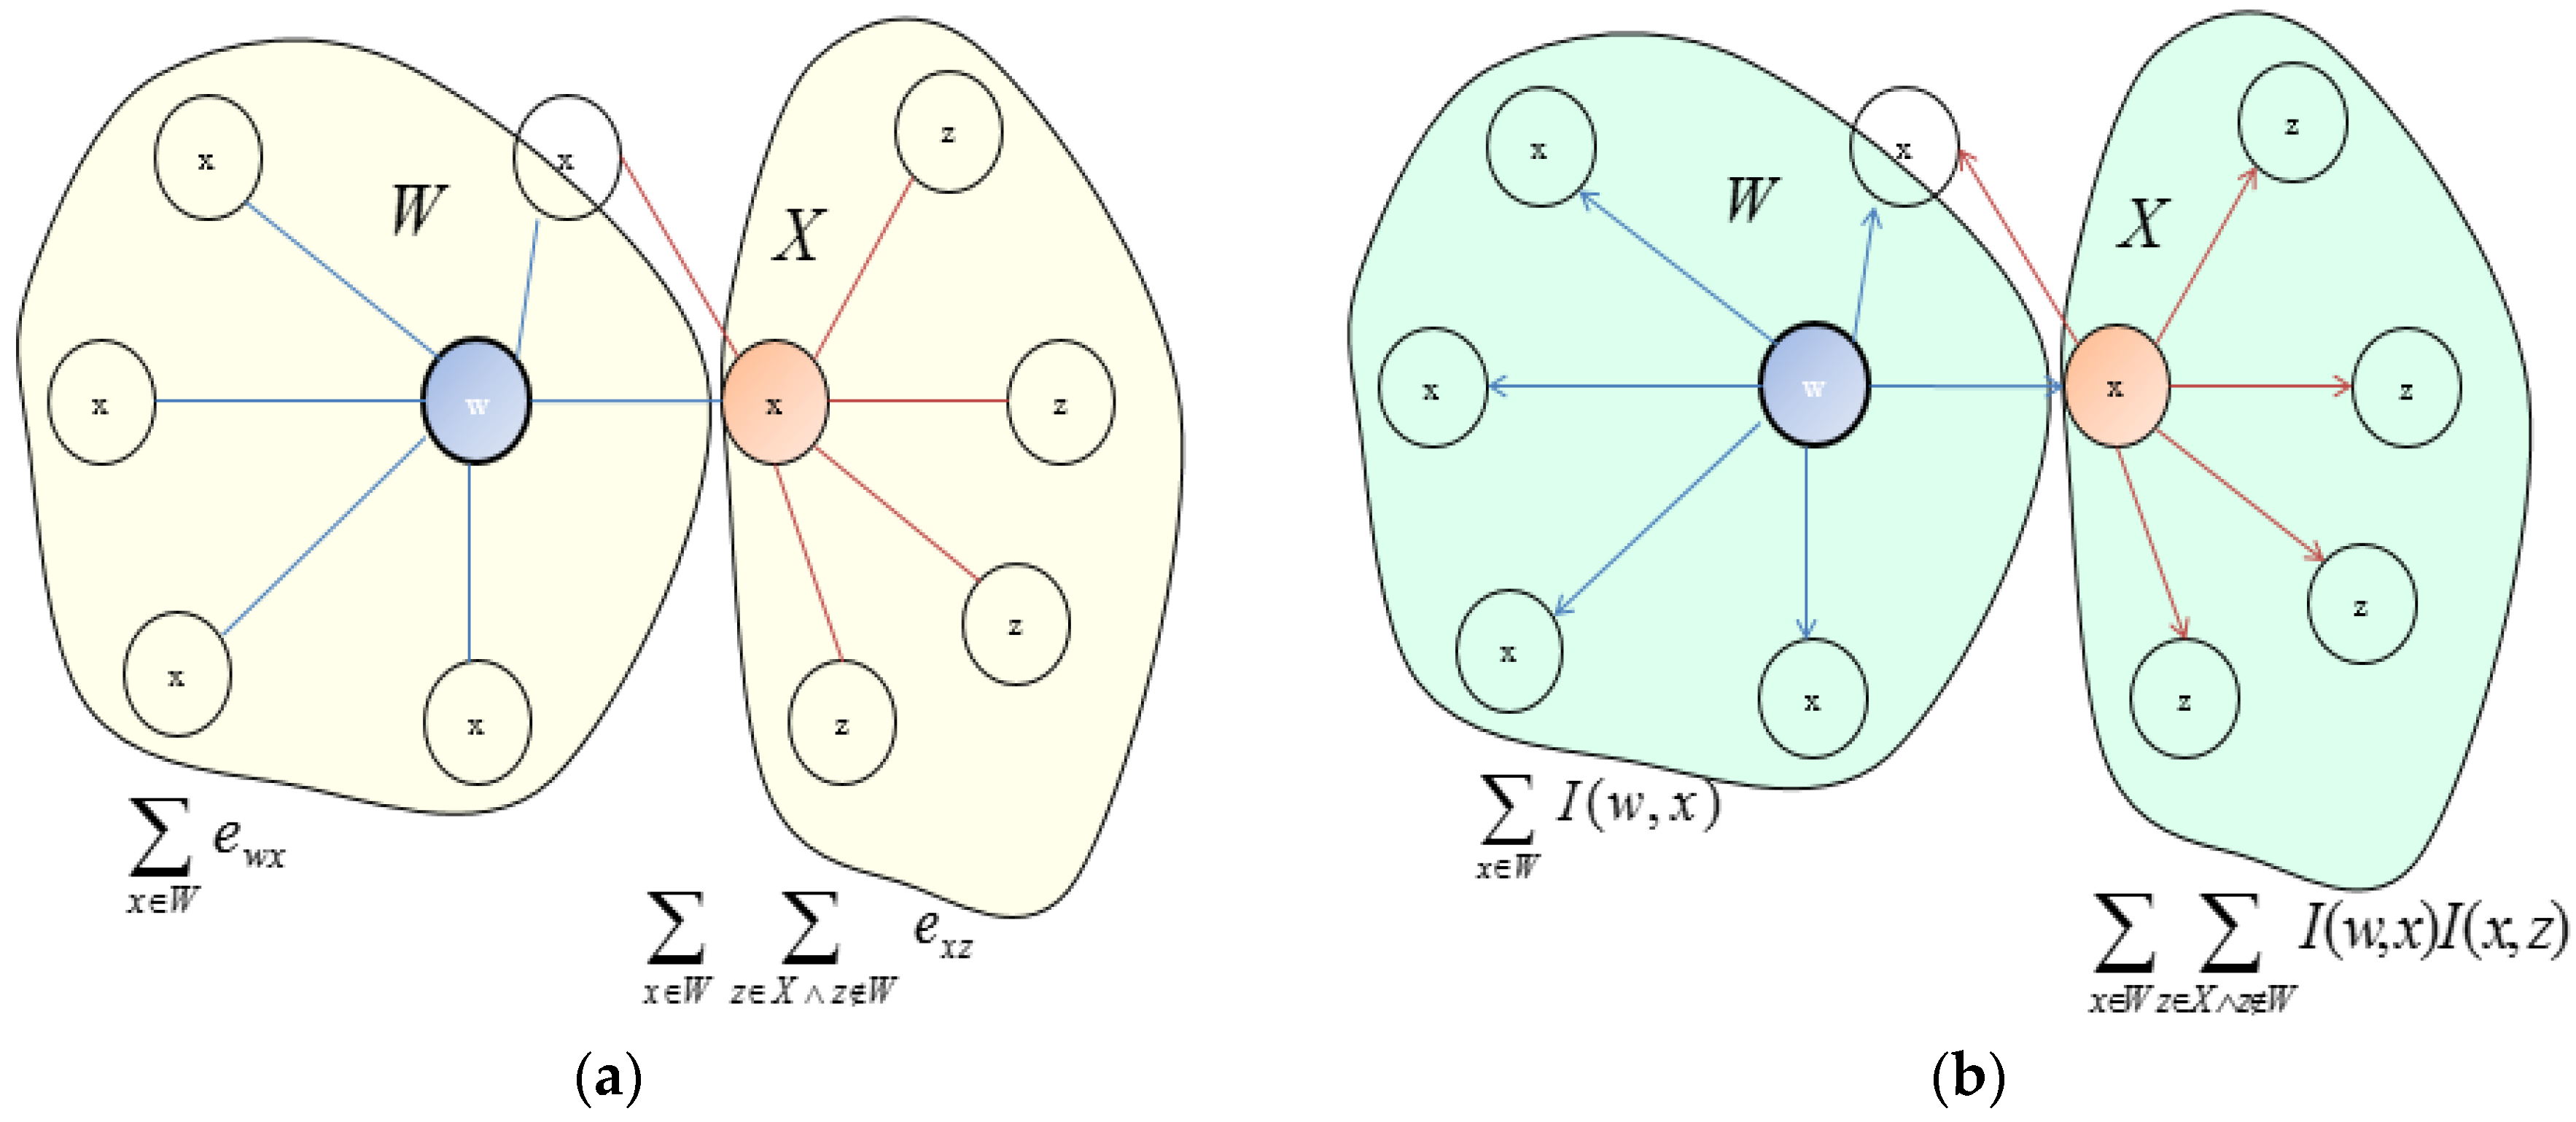
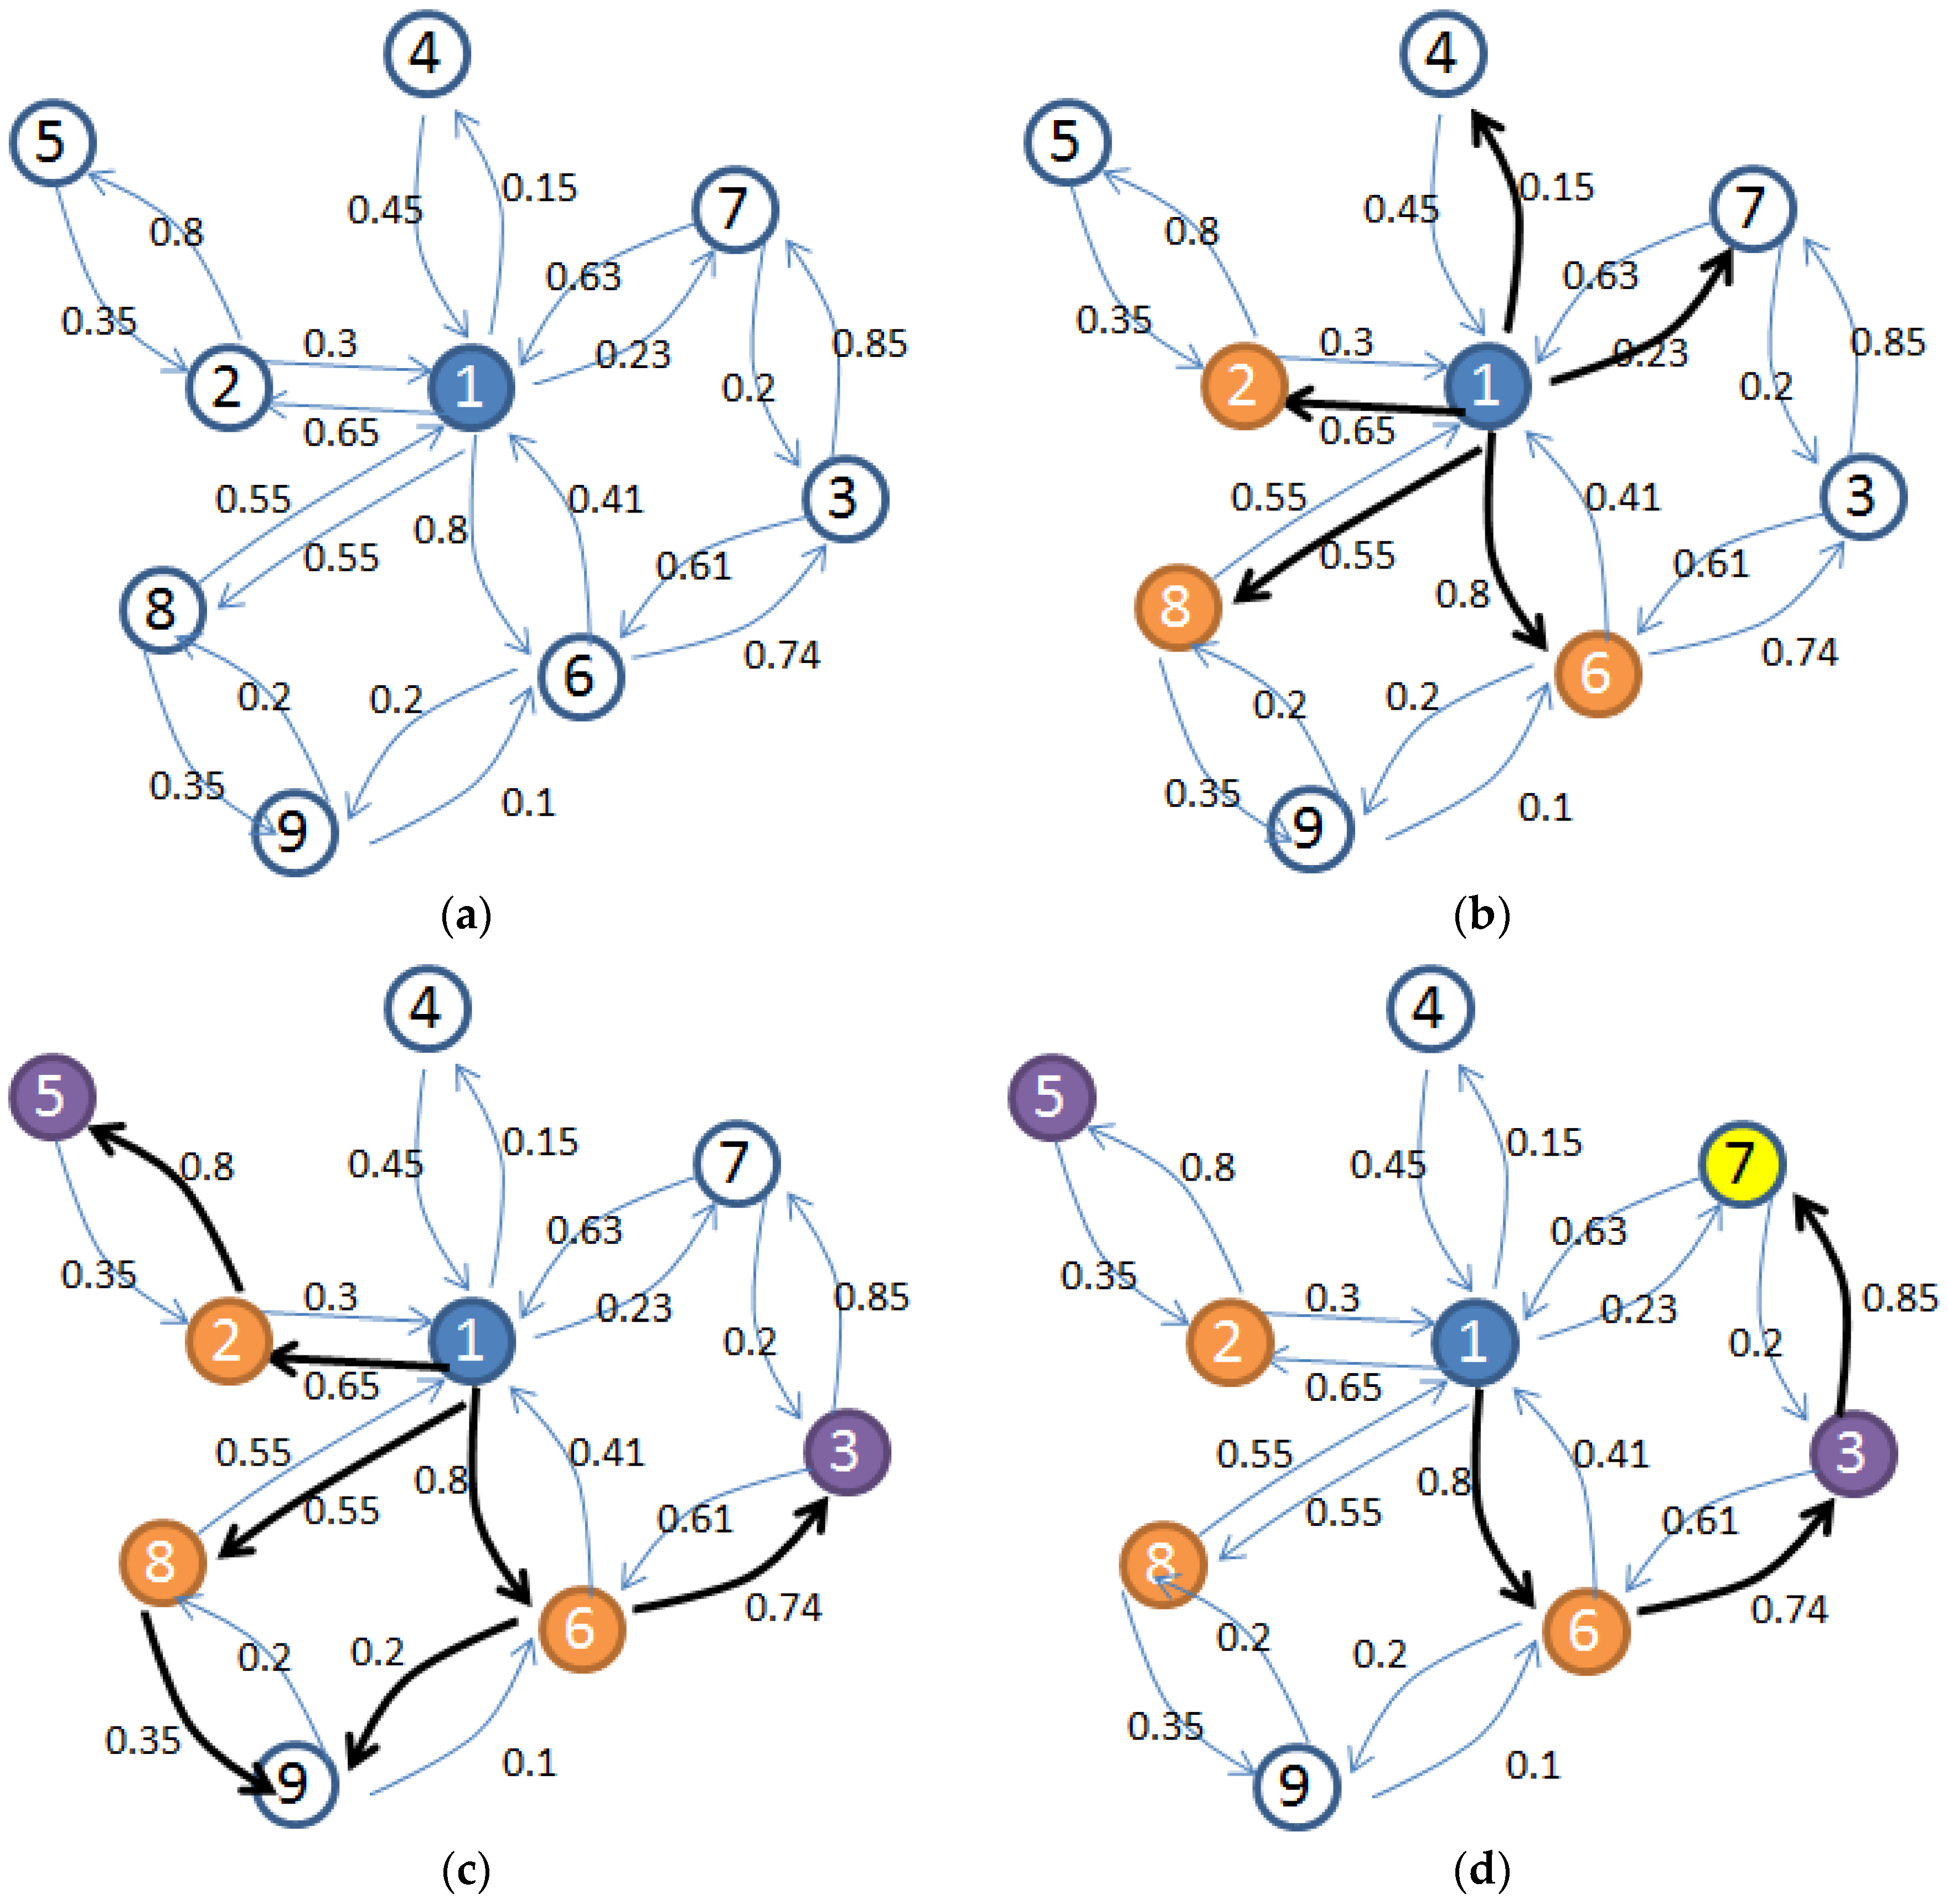
3.2. Ranking Algorithm for the Selection of the Most Influential Nodes to Initialize the Diffusion Process in an OSN

In this subsection, we introduce the proposed social node ranking algorithm, which is called SocNodeRank, to select the most influential nodes to initialize the information dissemination process. The proposed algorithm considers the user’s direct friends and friends-of-friends to compute the node rank. Numerous ranking algorithms have been proposed, including degree centrality, betweenness centrality and closeness centrality [59,60]. Degree centrality considers the number of edges; a user will be more central if he is more connected. Degree centrality ignores network structure information and instead only considers the ties to direct neighbors. Closeness centrality measures how close a node is to other nodes in the network. The betweenness of a node refers to the number of node pairs passing through a node with the minimum number of edges. Closeness and betweenness consider the network structure, but they lack efficiency in large scale networks.
The SocNodeRank algorithm considers user directed friends and friends-of-friends to determine a ranking value. A network can be directed or undirected, but this paper focuses on directed graph-based social networks. However, we also provide a mechanism to rank the nodes in an undirected network. SocNodeRank considers the direct friends and friends-of-friends. However, if a node is common between the user and his friends, then it will be considered only once, as depicted in Figure 4. Equation (7) finds the rank of the node in an undirected SNS graph.
S o c N o d e R a n k u n d i r e c t e d ( w ) = x W e w x +   x W z X     z W e x z
where W is a neighbor set of w , x is one of the neighbors of w , and X is a neighbor set of x . e is the edge between two users, which is 1 if present and 0 otherwise. Figure 4 shows the SocNodeRank algorithm, and Figure 4a is the ranking mechanism of an undirected graph (SNS).
A social relationship between friends is asymmetric in directed networks. In Section 3.1, we introduced the influence modeling and the multicriteria factors that affect influence. We consider the weighted out degree (outgoing edge) to rank nodes in directed networks. The rank of the node in the directed SNS is given by Equation (8), where I ( w , x ) is the influence of user w on user x .
S o c N o d e R a n k d i r e c t e d ( w ) = x W I ( w , x ) +   x W z X z W I ( w , x ) I ( x , z )
We consider the direct influence of the user on his friends and the propagation of influence to his friends-of-friends. Figure 4b depicts the ranking mechanism of the proposed scheme in the directed graph. The proposed scheme needs less time to rank the nodes in an SNS because it considers only 2-hops neighbors of user compared to most ranking algorithms such as betweenness, closeness and PageRank except the degree centrality. The proposed algorithm also captures the properties of the betweenness centrality- and degree centrality-based schemes.

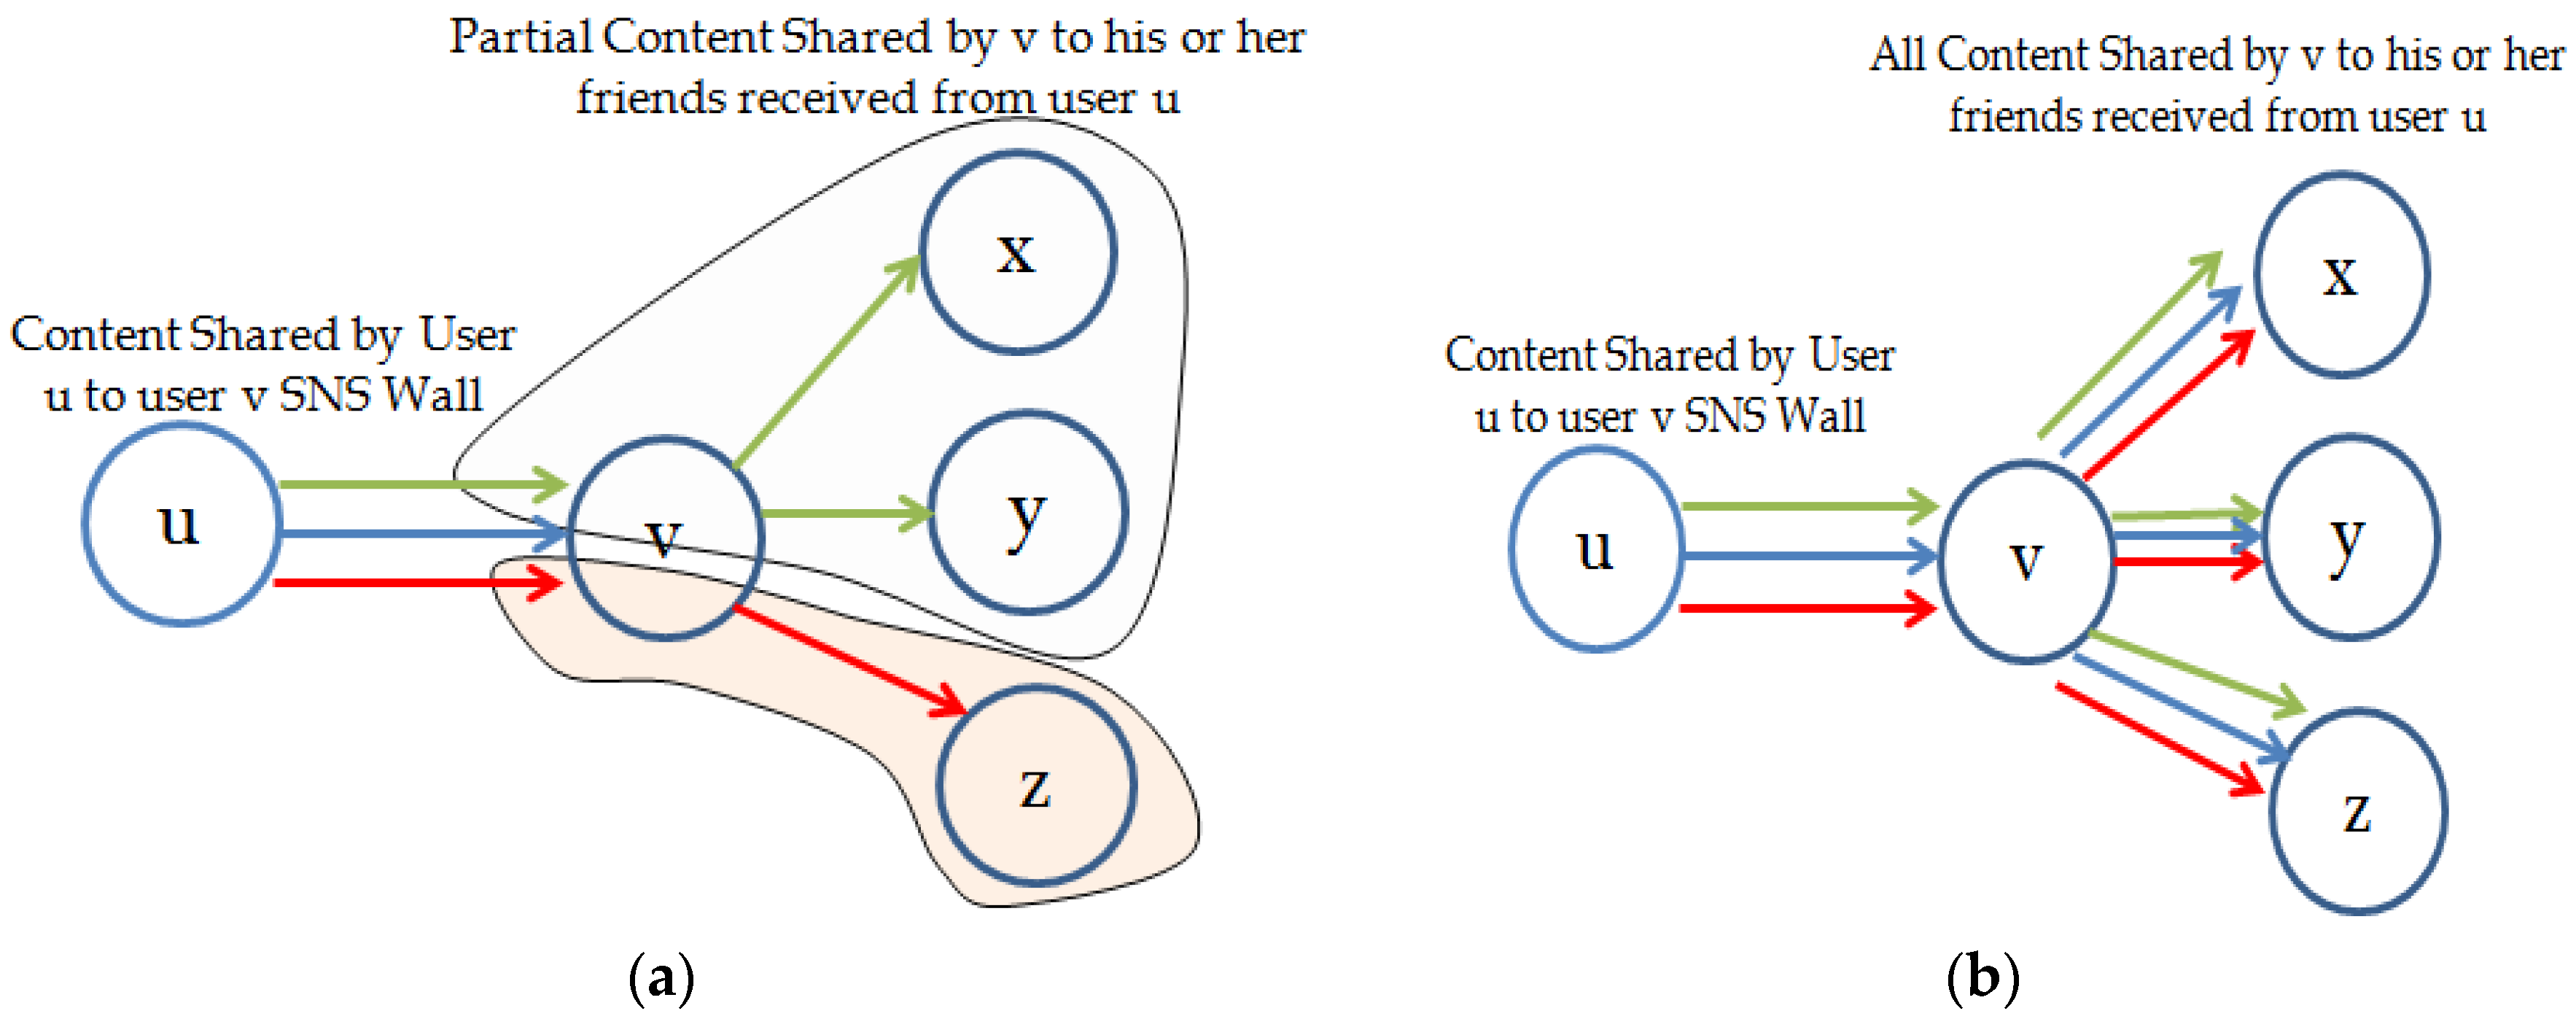
3.3. Temporal Aware Probabilistic Diffusion-Based Social Content Recommendations in OSNs

The growth of SNSs and user interactions helps disseminate information. However, the density of users creates an information overload problem. In this subsection, we introduce the probabilistic diffusion model to model the social content recommendation process. This model operates in a controlled manner that considers the recommended message temporal information, network topology, and user multicriteria influence. In SNSs, users can receive the same diffused messages from many users or with minor information updates, which does not happen with biological diffusion. We place diffusing messages into two categories—one in which the user accepts the message and the other in which the user does not accept the message. We model the influence between users based on multicriteria, and then we rank the nodes and select the most influential (initial spreader) K-nodes to initialize the diffusion process. We extend the concept of the continuous-time Markov chain model in [40] and the social influence diffusion model presented in [61] to control the diffusion process and overcome the information overload problem.
In the diffusion process, a node can be inactive or active. At time t   =   1 , K influential nodes are selected to start the diffusion process. At t   =   2 , neighbors of the diffusing nodes only become active when the incoming influence from the diffusing node is greater than the outgoing influence and the recommendation (diffusion acceptance threshold). Suppose u is the diffusing node and v might be the accepting (diffusion adopting) node. The activation state of v at t   =   2 is given by Equation (9).
P D i f f t = 2 ( v ) = { I ( u , v ) ;   where   I ( u , v ) I ( v , u )   and   I ( u , v ) R A T 1   0 ;   otherwise
where P D i f f t = 2 ( v ) determines whether node v at time t = 2 will be diffused or not. R A T 1 is the acceptance threshold of diffusion (recommendation) from direct friends. In this paper, we consider two different thresholds— R A T 1 is the threshold of the content recommendation acceptance from the direct friends at t   =   2 , and R A T 2 is the threshold for friends-of-friends and so on for t   >   2 .
At t   =   1 in Figure 5a, the highest value of K (influential nodes) is selected using the mechanism of Section 3.2, and for simplicity, K   =   1 is considered to explain the procedure. At t   =   2 of Figure 5b, the neighboring nodes { 2 ,   4 ,   6 ,   7 ,   8 } of { 1 } are selected for diffusion, but according to Equation (9), only nodes { 2 ,   6 ,   8 } are diffused because node { 1 } has a higher influence on them and the diffusion acceptance threshold R A T 1 = 0.4 . The active node continues to diffuse if the outgoing influence is greater than the incoming influence. The diffusing node accepts only the diffused message if the diffusion contagion probability is greater than the diffusion acceptance threshold. Suppose the threshold of diffusion acceptance is R A T 2 0.5 for t   >   2 in Figure 5c. Nodes { 3 } and { 5 } are diffused because ( 0.8 × 0.74 ) R A T 2 and ( 0.65 × 0.8 ) R A T 2 , while node { 9 } is not diffused because ( 0.55 × 0.35 + 0.8 × 0.2 ) < R A T 2 . Similarly, at t   =   4 in Figure 5d, node { 7 } is diffused because ( 0.8 × 0.74 × 0.85 ) R A T 2 . Mathematically, the nodes activation probability for ( t + 1 ) 3 can be given by Equation (10).
P D i f f t + 1 ( w ; V ) = { v = 1 V I ( v , w )   P D i f f t ( v | V )   ;   I ( v , w ) I ( w , v )   and   P D i f f t + 1 ( w ; V ) R A T 2 0 ;   otherwise
where V is the set of neighboring nodes of node w that can diffuse u at time t where ( t + 1 ) 3 . The equation shows that users accept recommendations when a large number of higher similarity friends and friends-of-friends recommend the content.
Figure 5. Overview of the proposed temporal aware probabilistic information diffusion process: (a) diffusion process start (t = 1); (b) diffused node at (t = 2); (c) diffusion status at (t = 3); and (d) Information Diffusion at (t = 4).

4. Simulation Results and Discussion

In this section, different real-world publicly available datasets used for this paper are introduced, and a comparison of the proposed schemes with various previous rankings and diffusion algorithms is provided.

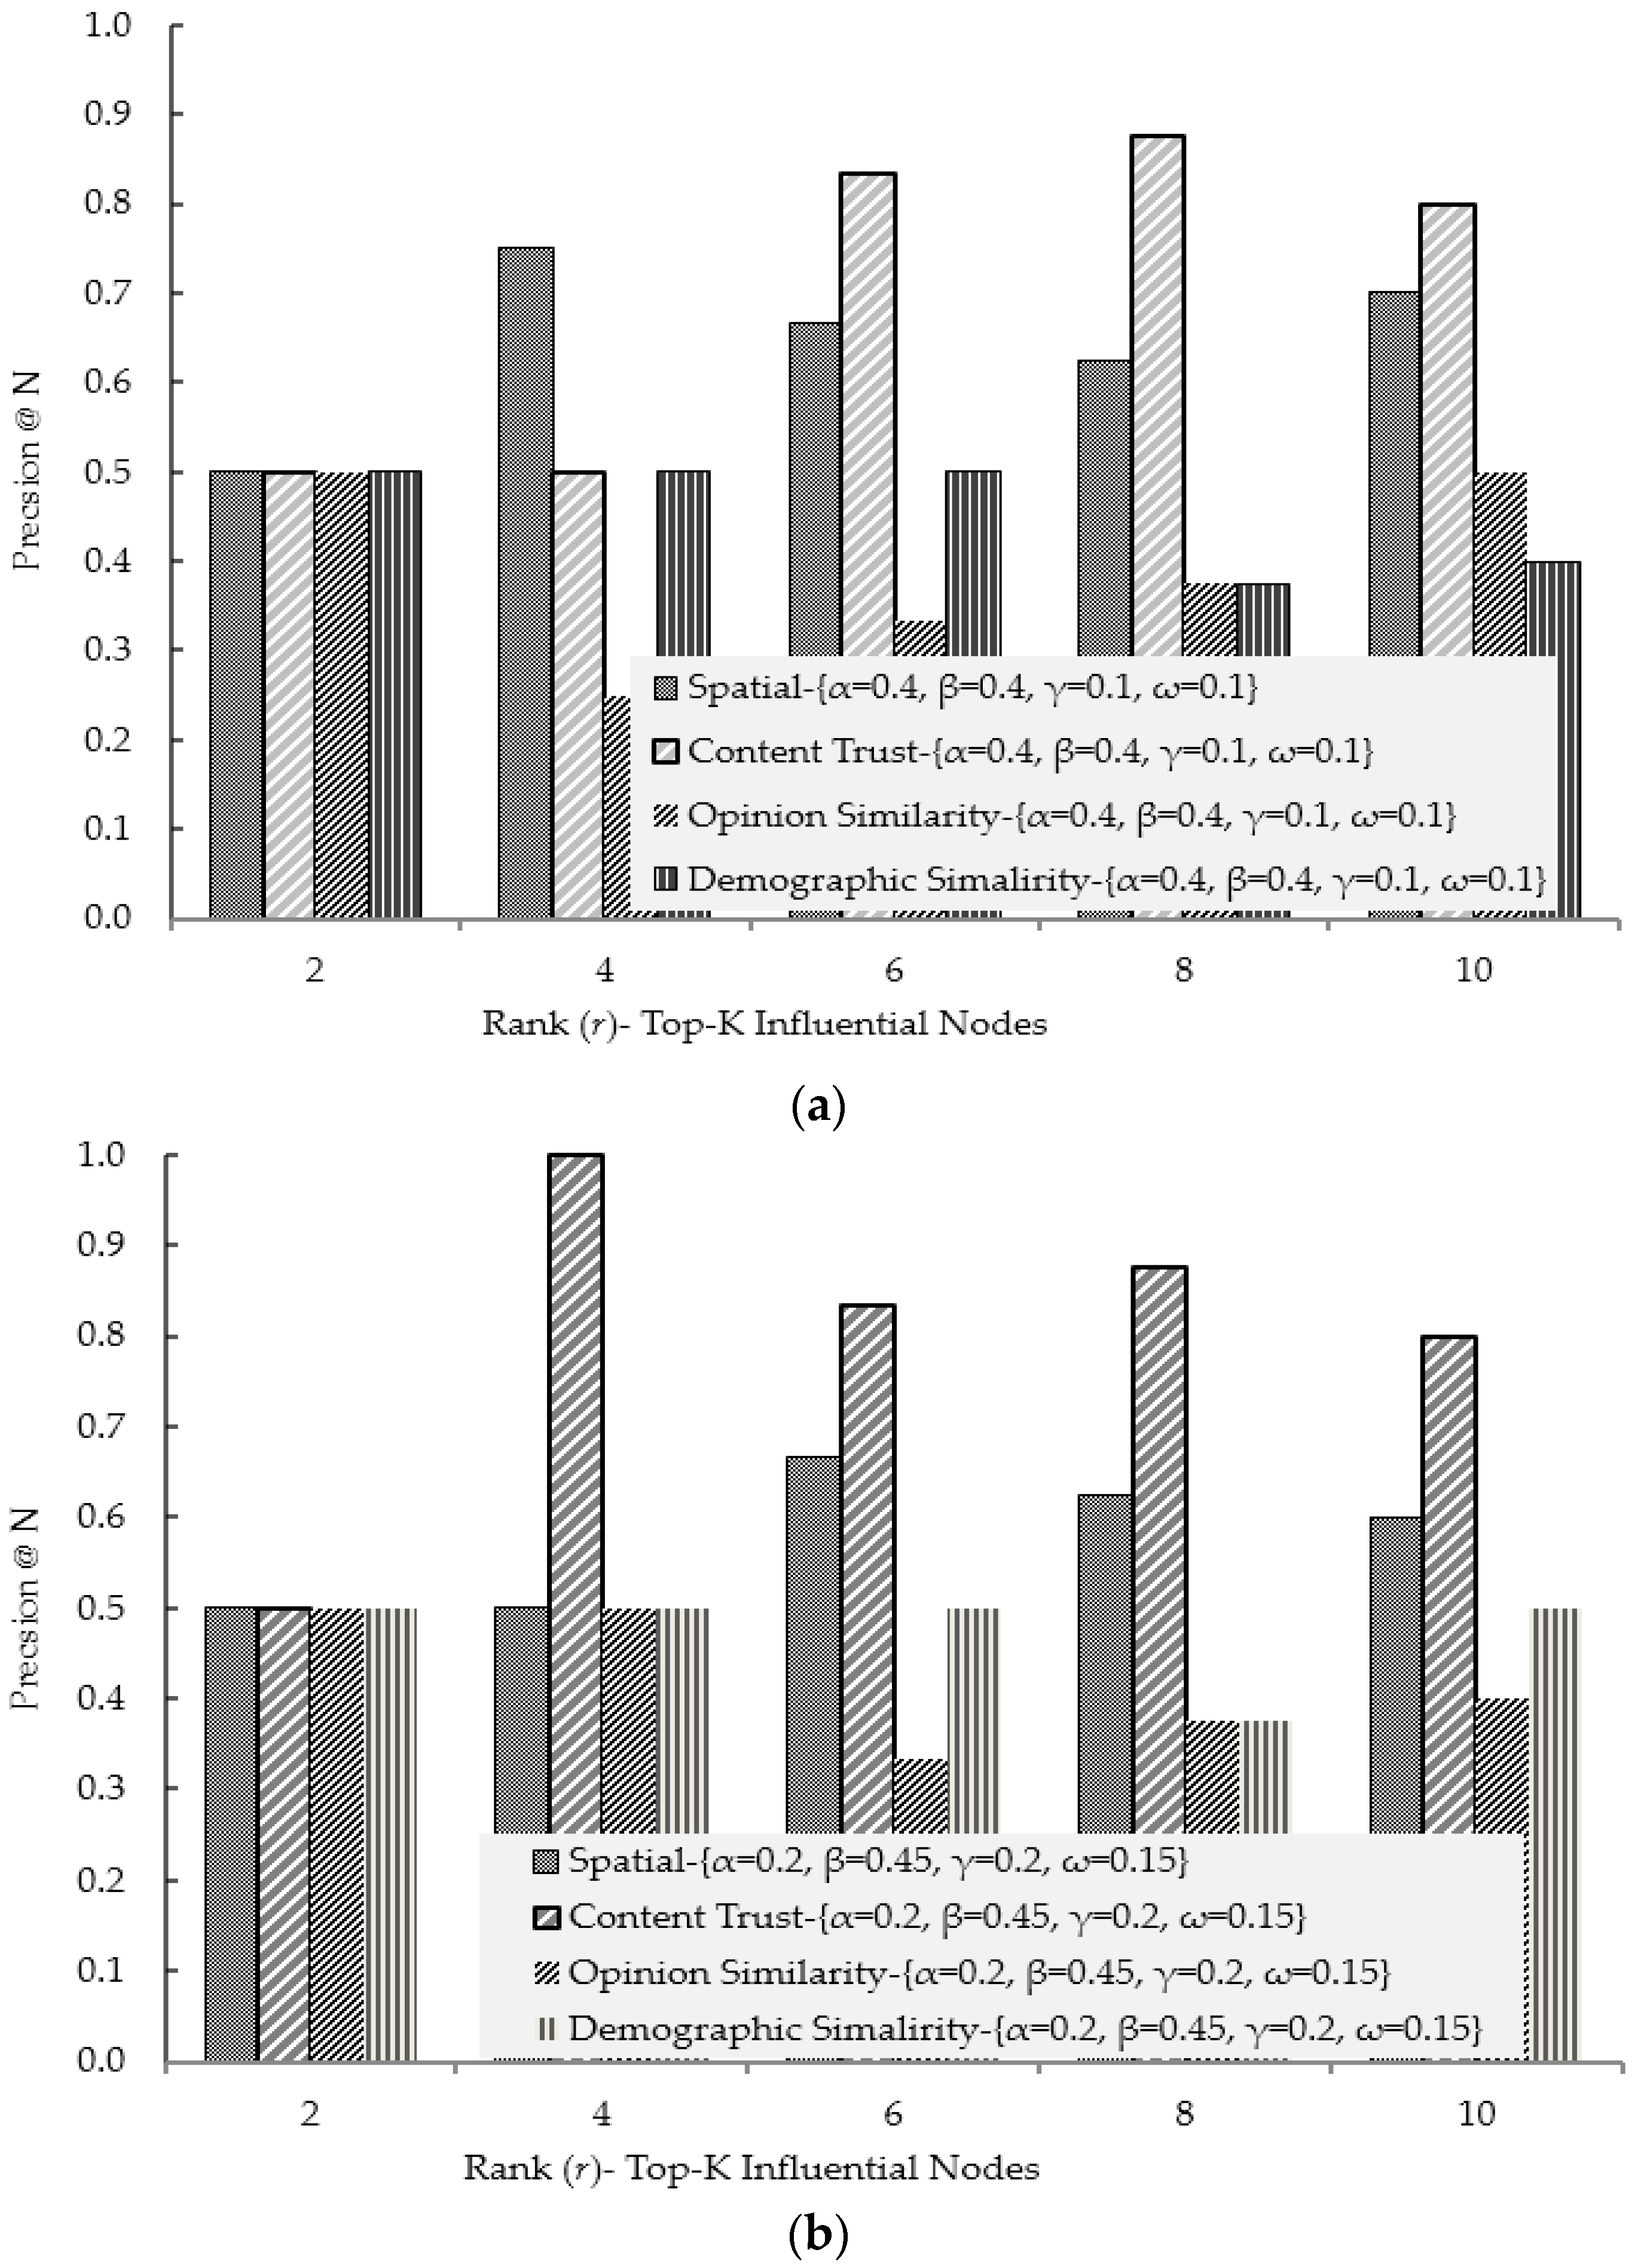
4.1. Experimental Results for Social Ties Relationship (Influence) Factors

To the best of our knowledge, there is no single dataset network that contains all of the required attributes to determine influence among users and evaluate the proposed influence modeling scheme. To build a single compilation of network data, we extract user spatial information from [62], Advotago user social trust data from [63], and demographics and user ratings from MovieLens [64]. Table 1 shows the attributes of the dataset used for the evaluation of influence scheme. Finally, the dataset used for the multicriteria relationship modeling has an average degree of 3.345 and network diameter of 9 .
Table 1. Description of dataset for multicriteria-based influence modeling.
In order to evaluate the different influential factors, Table 2 shows the Top 10 most influential nodes in the multicriteria dataset of Table 1. Extensive simulations are carried out to determine the optimal values of α , β , γ , and ω to calculate the actual influence between users using the multicriteria. The nodes are ranked using weighted out-degree for each attribute separately and also for combined using the various coefficient criteria in Equation (6). Selecting the coefficient values, the precision is used to compare the node rankings by individual attribute-based influence with node rankings by multicriteria-based influence. Figure 6 shows the precision comparison of the single attribute and the multicriteria influence-based ranked nodes. The coefficients { α = 0.20 ,   β = 0.45 ,   γ = 0.20 ,   ω = 0.15 } are selected because they extract most of the influential nodes of each single attribute.
Table 2. Top-10 influential nodes in the multicriteria influential dataset using weighted out degree.
Figure 6. Precision comparison for the selection of multicriteria influence coefficients: (a) precision comparison of the individual attribute based influential node selection with multicriteria consider coefficients { α = 0.4 ,   β = 0.4 ,   γ = 0.1 ,   ω = 0.1 } ; and (b) precision comparison of the individual attribute based influential node selection with multicriteria consider coefficients { α = 0.2 ,   β = 0.45 ,   γ = 0.2 ,   ω = 0.15 } .

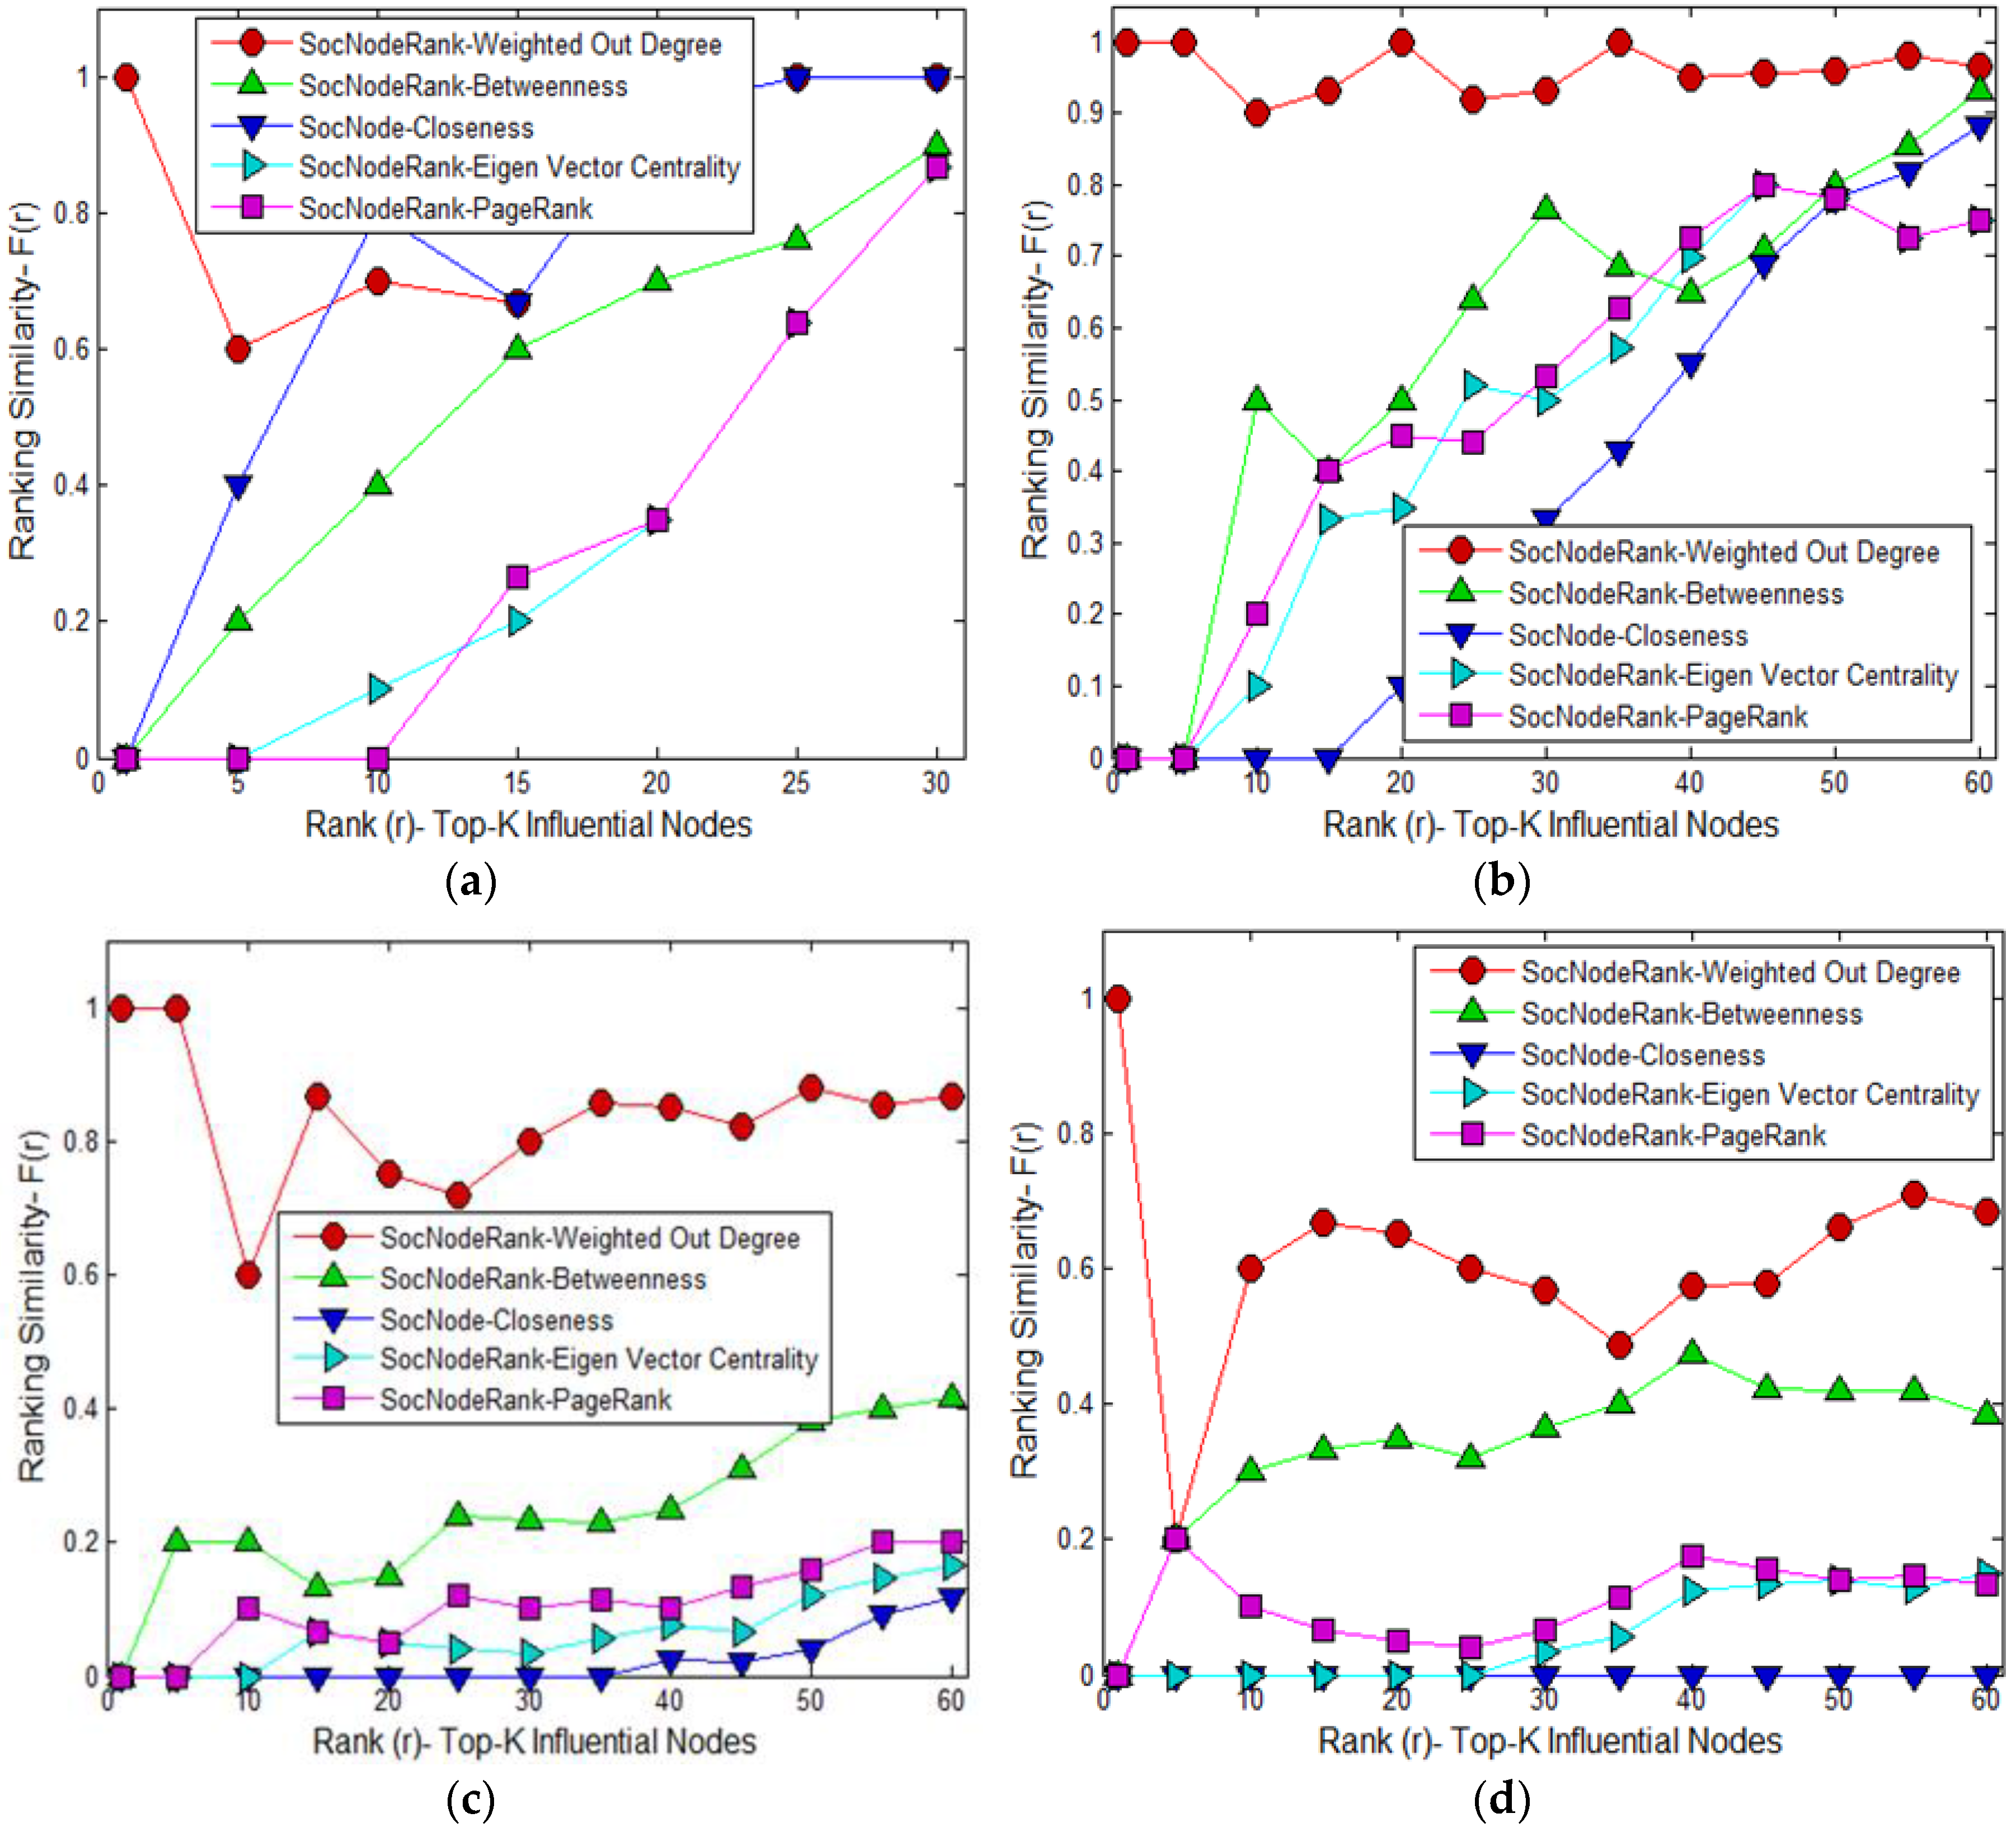
4.2. Results of Proposed Social Node Ranking Algorithm (Selection of Highest Influential Nodes)

The results of the proposed SocNodeRank are compared with three state-of-art ranking algorithms—weighted out-degree centrality, closeness centrality, and betweenness centrality. We used the directed weighted networks publicly available datasets for results comparison. The details of the datasets are as follows.
Zachary’s Karate Network [65]: The small-sized karate network is used as a directed network, but the edge weight (1) is the same between users. The dataset consists of 34 members and 78 friend relationships. The karate club was started at an American university in the late 1970s.
Coauthorships in Network Science [66]: This is a weighted directed coauthors network with 1589 nodes and 2742 edges.
Political Blogs of US Elections [4]: This is a directed network of hyperlinks between 2004 US election weblogs. The dataset consists of 1490 nodes and 19,025 edges.
Coappearance network of characters [67]: The co appearance network of characters in the novel Les Miserables is a weighted network with 77 nodes and 254 edges.
To compare the proposed SocNodeRank with other schemes, the ranking similarity metric from [68] is employed. The ranking similarity F(r) of two schemes at rank r can be given by Equation (11).
F ( r ) = | L ( r ) L ( r ) | | r |
where L ( r ) and L ( r ) are the two sets of nodes of two different ranking schemes at rank r .
Figure 7 shows the simulation and comparison results of ranking similarity F ( r ) for the above specified networks at various r ranking. The figure clearly depicts that the proposed algorithm has higher ranking similarity with the weighted out degree and betweenness. We used Gephi [69] as open source software for most of the ranking algorithm simulation. In the simulation setting for PageRank, we considered (probability = 0.5, Epsilon = 0.1 and use edge weights) and for Eignvector centrality directed and 100 number of iterations. The experimental results show that as the network becomes denser in term of nodes and especially edges (interactions), the proposed SocNodeRank differs from the other schemes. The ranking similarities in Figure 7a (the karate network) and Figure 7b (the coappearance of characters in Les Miserables) are quite alike, whereas the network size increases in Figure 7c (coauthors in Network Science) and Figure 7d (the political blogs of the 2004 US election). SocNodeRank extracts some important potential nodes that can maximize the information diffusion. In addition, it extracts nodes that for the most part have the highest values of betweenness for the 1-edge neighbor friends.
Figure 7. Ranking similarity of the proposed SocNodeRank with weighted out degree, betweenness, and closeness: (a) Zachary’s Karate Network; (b) coappearance network of characters in the novel Les Miserables; (c) coauthorships in Network Science; and (d) political blogs.
Table 3 and Table 4 show the Top 10 highly influential nodes from the coauthorships in Network Science and the 2004 US election political blogs, respectively. In the Top 10 rankings of the coauthorships network, SocNodeRank extracts nodes such as { 1087 ,   132 ,   133 } , which is not extracted by other schemes. Crucially, these nodes for the most part have the highest degree of betweenness and edge centrality for the direct neighbors. Similarly, in the Top 10 rankings of the 2004 US election political blogs, it extracts nodes { 1047 ,   980 ,   1384 ,   615 } . Node { 980 } has a high level of betweenness nodes { 1051 , 1041 ,   1101 ,   1479 } in the direct friends. Therefore, the proposed SocNodeRank scheme captures the properties of edge centrality and betweenness simultaneously, but it takes less time to rank the nodes as compared to the betweenness-only scheme because it considers only the direct friends and friends-of-friends.
Table 3. Top-10 ranked influential nodes (Nodes IDs) in the directed network of coauthorships in network science.
Table 4. Top-10 ranked influential nodes (Nodes IDs) in the political blogs of 2004 US election.

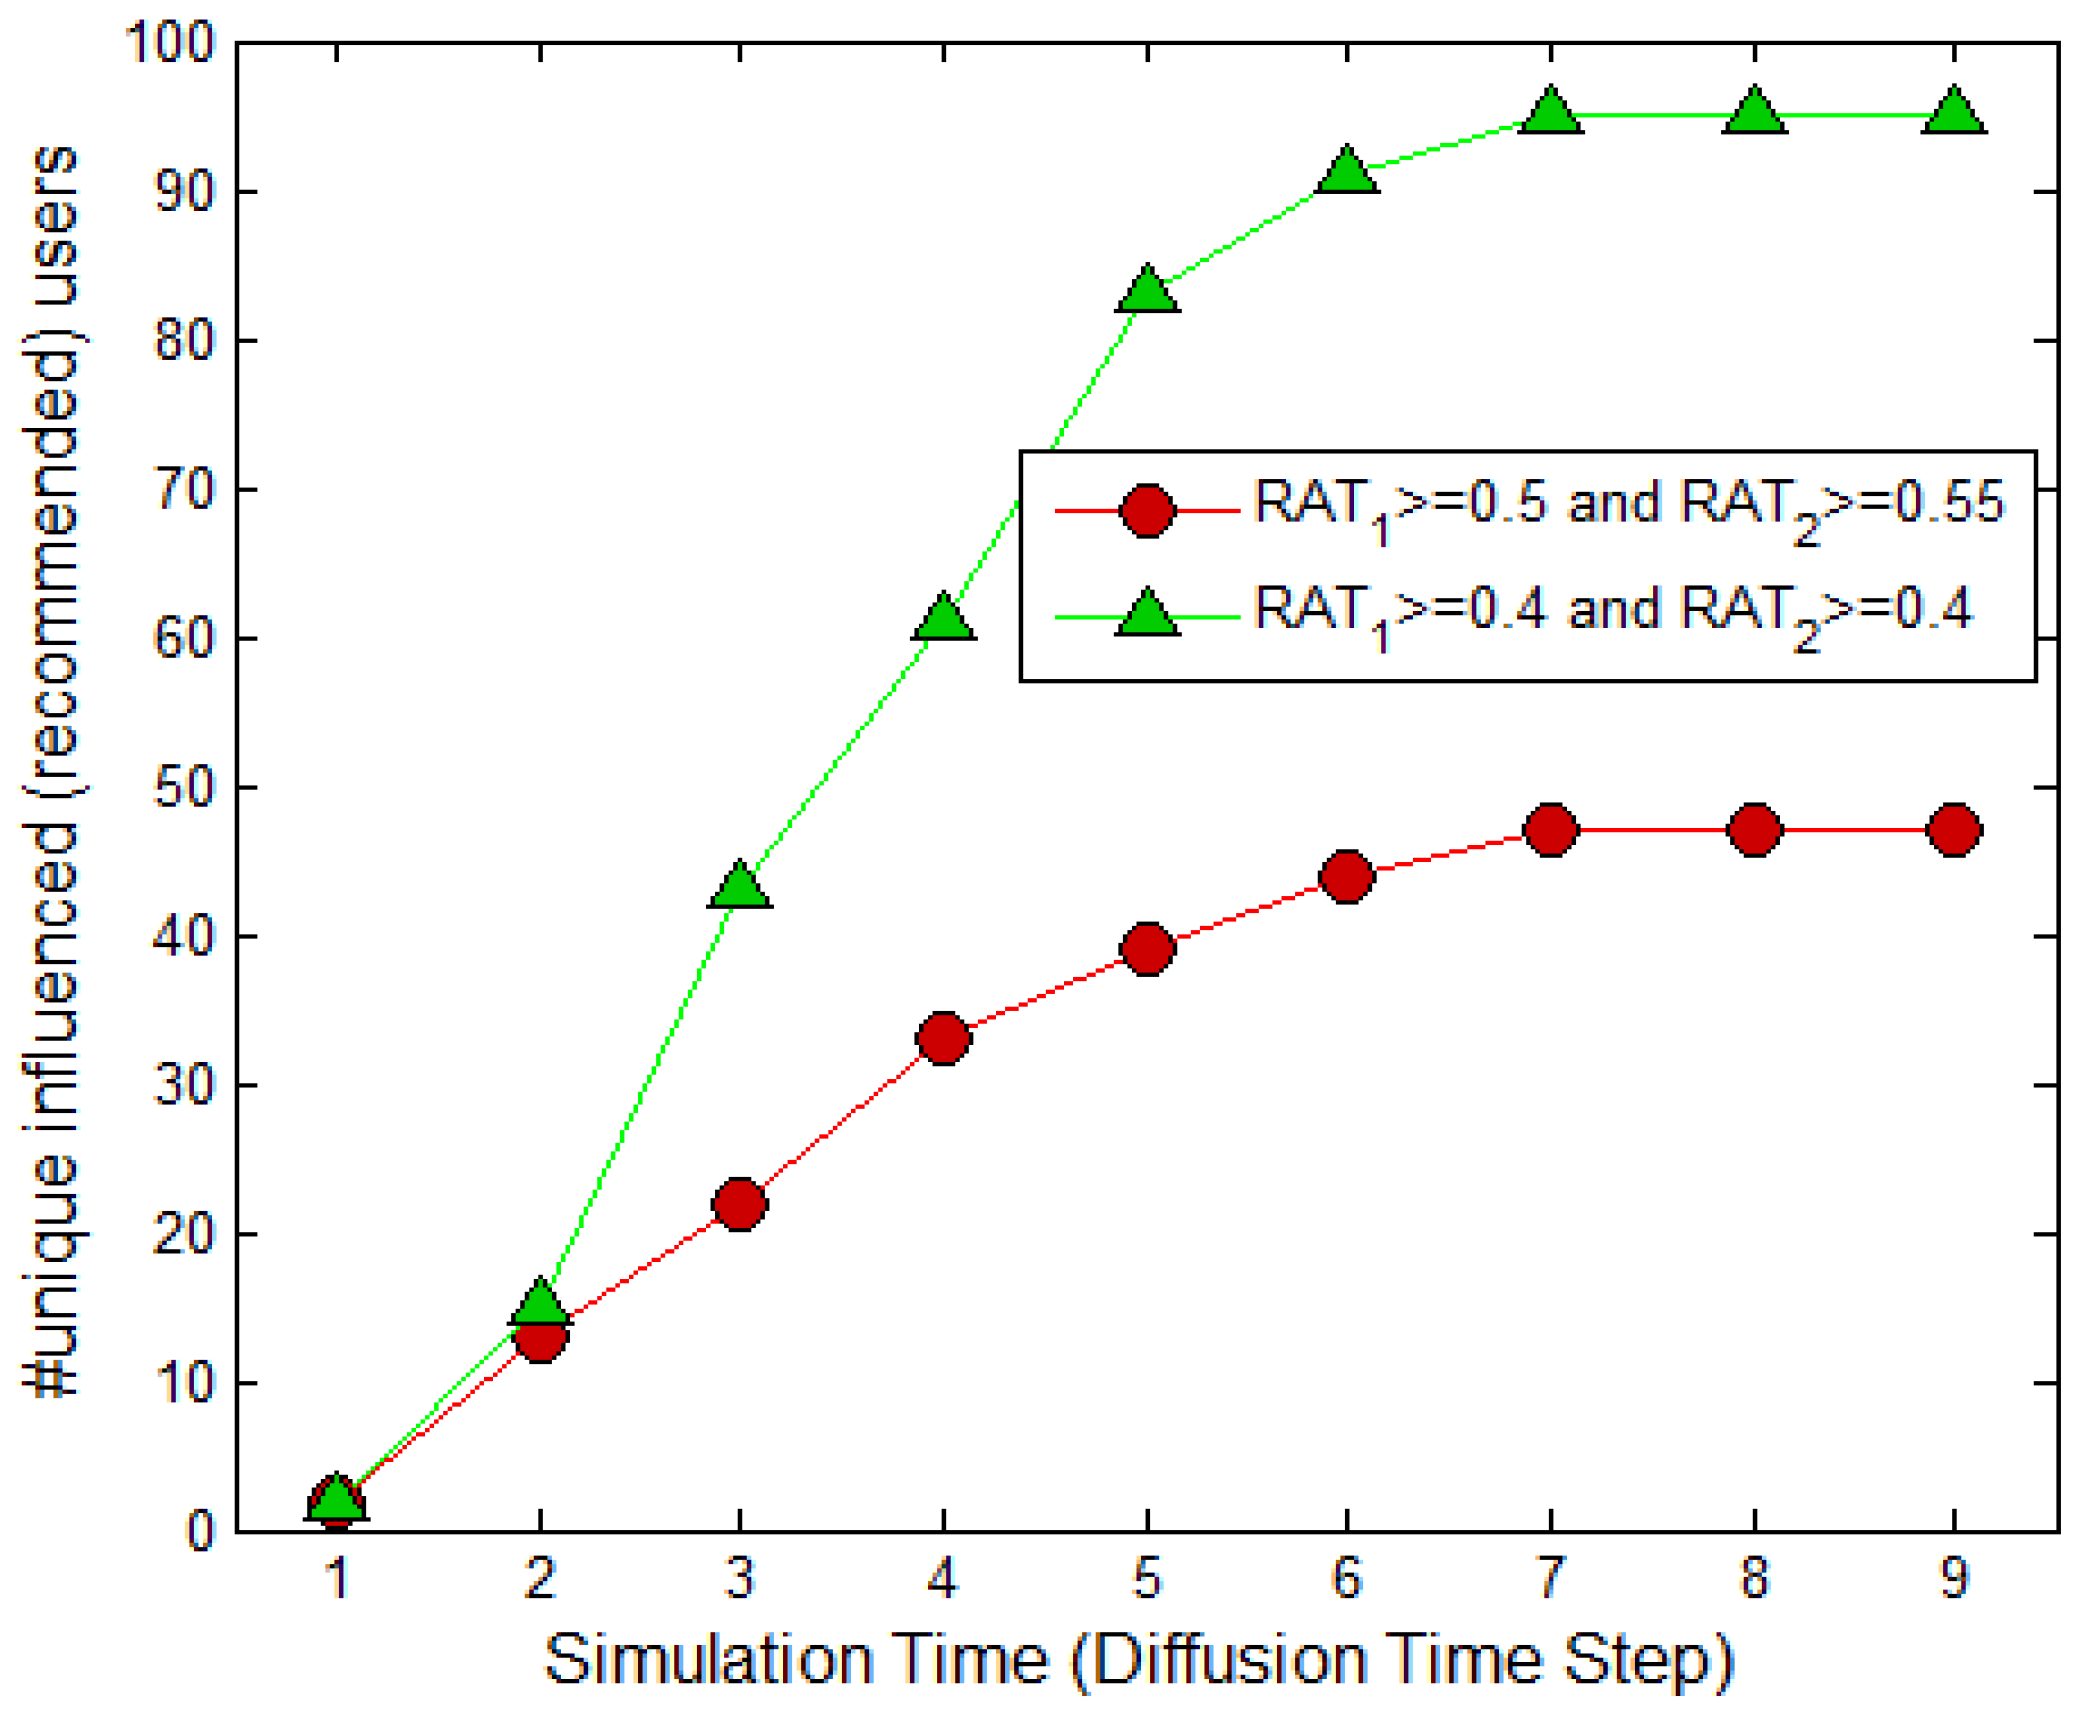
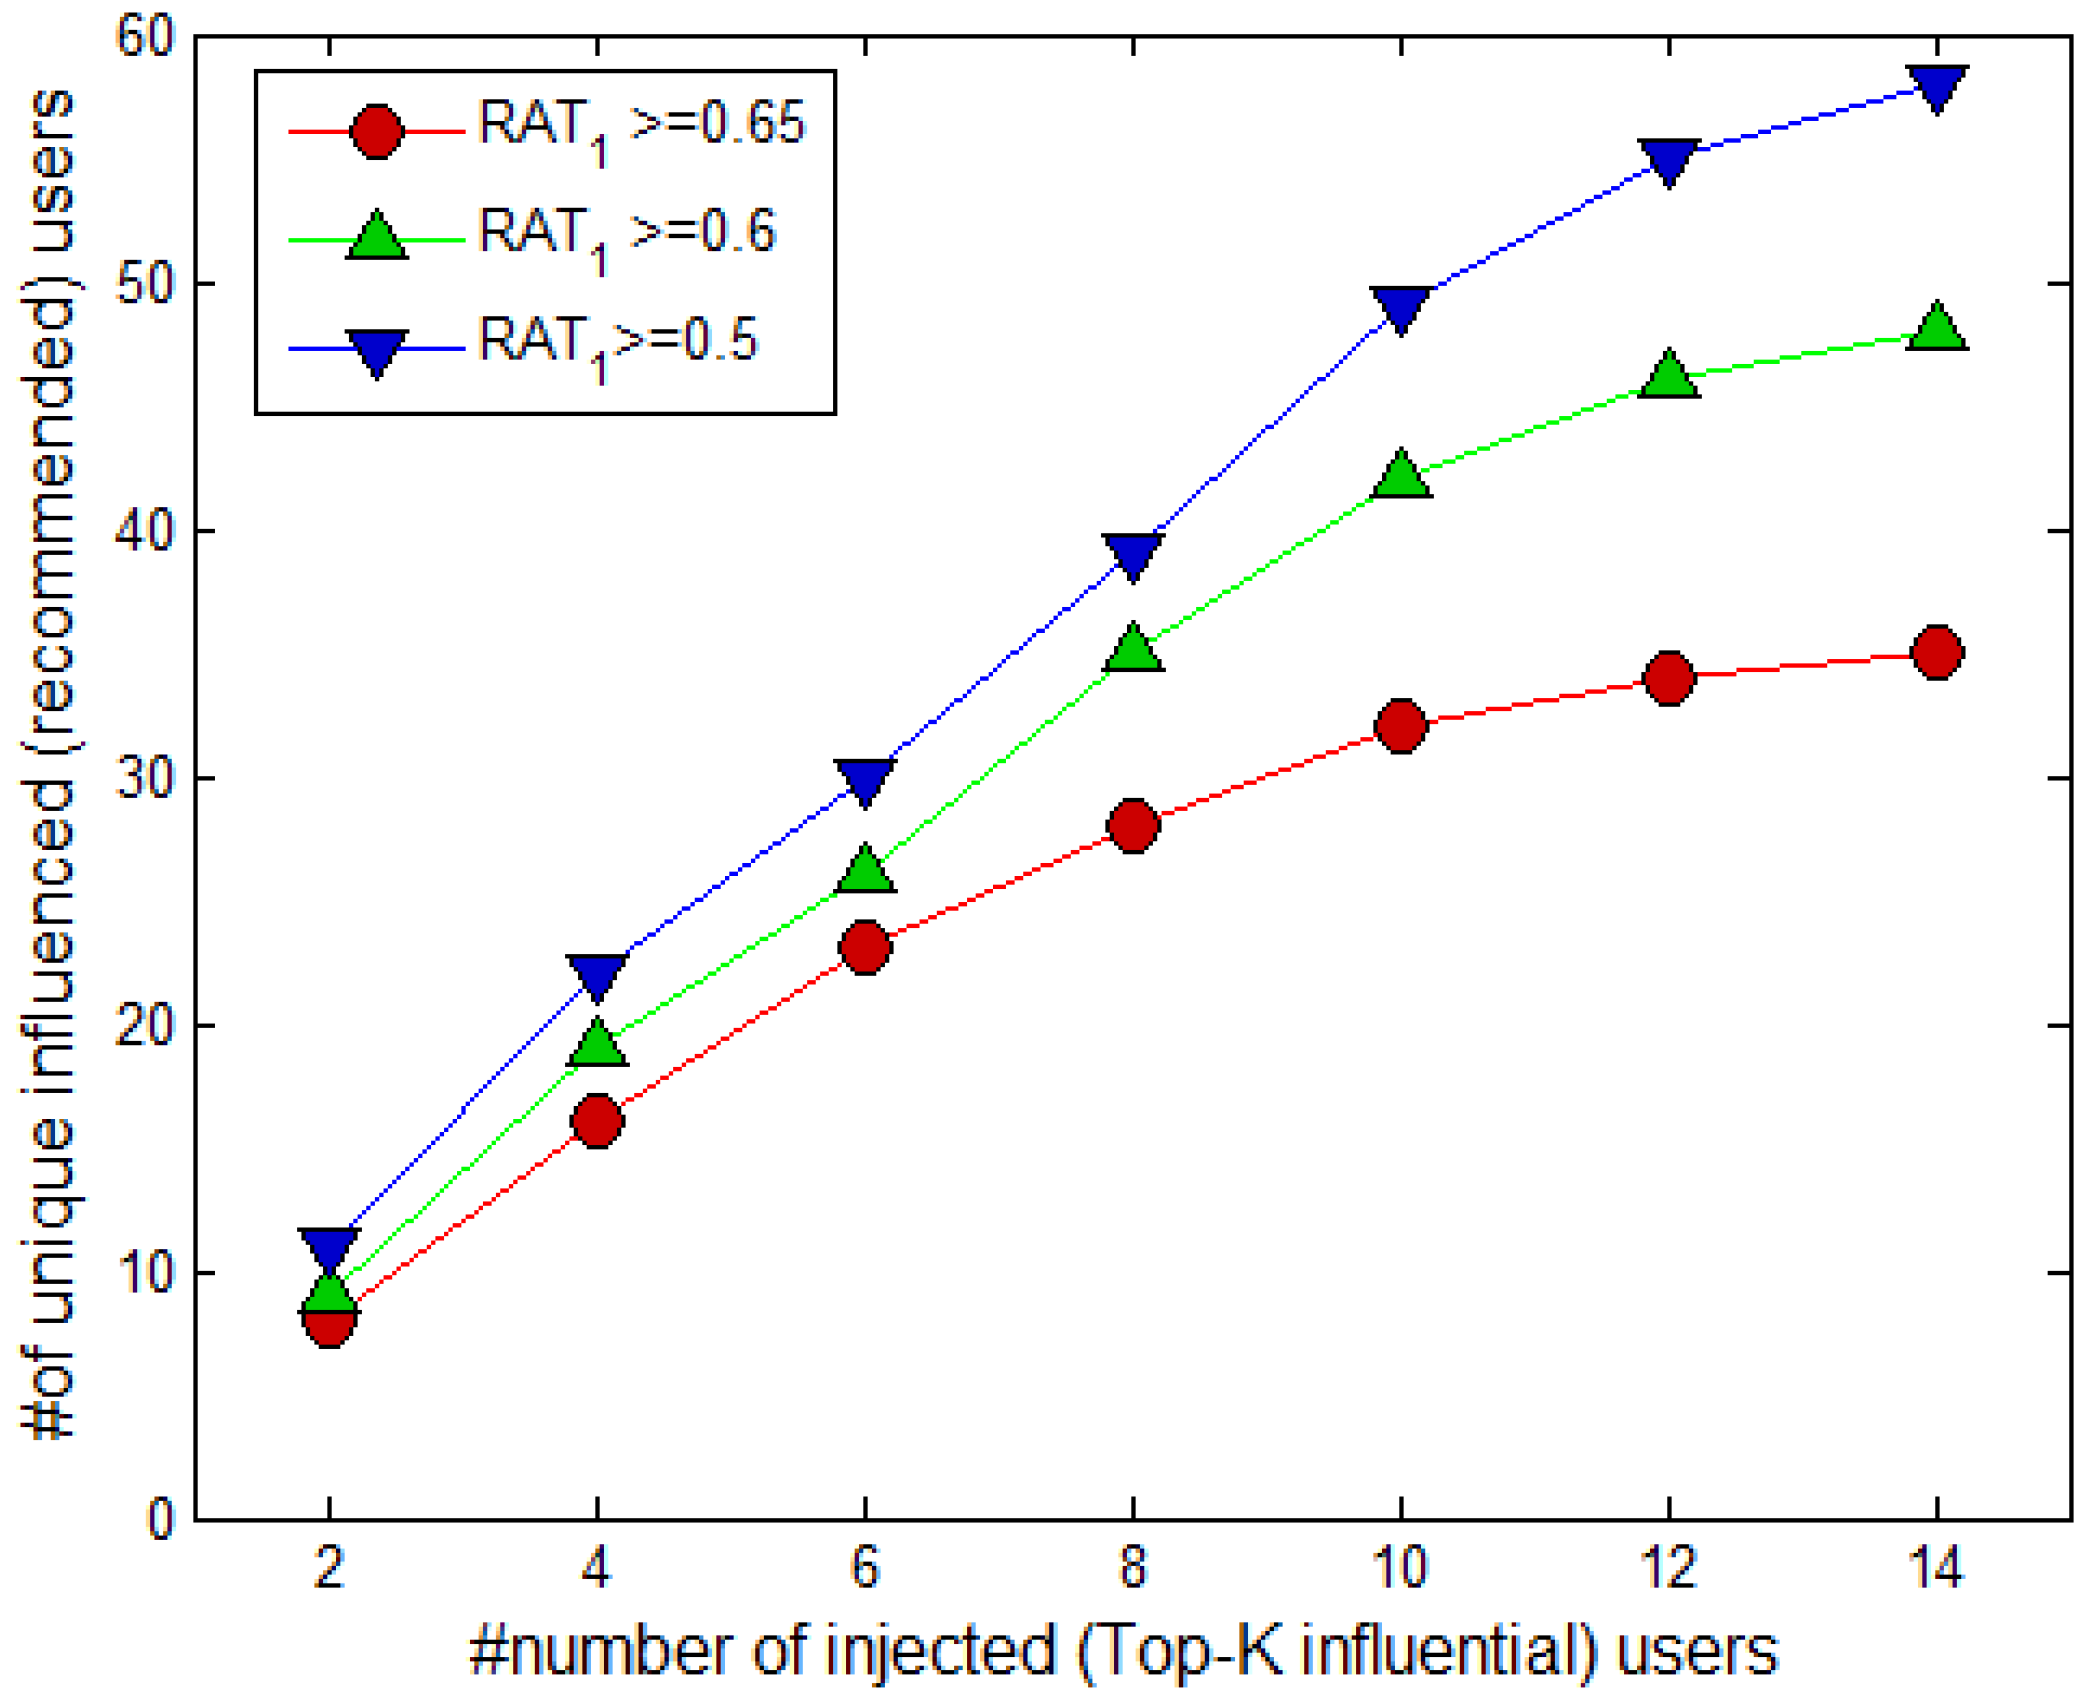
4.3. Results of the Temporal Aware Probabilistic Diffusion-Based Social Content Recommendations in OSNs

In this subsection, the simulation results are introduced for users influenced with the diffusion time and number of Top-K (rank-r) initially diffused nodes for the multicriteria dataset introduced in Section 4.1. The proposed SocNodeRank algorithm is used to select highly influential users that can increase the diffusion process. Figure 8 shows the number of influenced users over the simulation (diffusion) time, and it shows that the diffusion rate is higher at the start, but slows as time progresses. The suggested temporal aware probabilistic diffusion model controls the diffusion process and diffuses only those nodes with high levels of similarity. It is able to diffuse the information further. The recommendation acceptance thresholds ( R A T 1 and R A T 2 ) have a greater impact on the nodes activation process. If the threshold values are higher, then most of the nodes are excluded from diffusion.
Figure 8. Effect of diffusion time on number of influenced (recommendation accepted) users.
Figure 9 shows the effects of the Top K influential users and the R A T 1 on the number of influenced (recommended) users. The Top K influential users help to diffuse and increase the number of diffused nodes. However, after a certain value of K , the influence of the Top K users decreases, and it does not improve the diffusion process.
Figure 9. Effect on #number of influenced users by various Top-K influential users and R A T 1 .

5. Conclusions

In this paper, we have presented a method of providing social content recommendations using multicriteria-based relationship modeling between social ties and temporal aware probabilistic diffusion model. We modeled the relationship between social ties to identify users with higher levels of relationship similarity based on multicriteria incorporating user spatial information, content trust, opinion similarity, and demographics. We assigned different weights to each attribute of the multicriteria. We suggested a ranking algorithm for selection of the Top-K most influential nodes considering the influence of friends and friends-of-friends to maximize the information spread. The proposed ranking algorithm has higher ranking similarity with the weight out degree and betweenness. However, it needs less processing time to rank the nodes because it only considers the two hops neighbors of a user compared to betweenness which considers the entire network. Furthermore, the suggested temporal-aware probabilistic diffusion process categorized the nodes based on whether or not they were able to recommend and diffuse content. This enabled the process to overcome the information overload problem. We used different publically available datasets to verify the effectiveness of the proposed social content recommendation scheme. We introduced different thresholds in the proposed probabilistic diffusion model, so the inactive node will be activated if it has highest influential diffused nodes and the higher number of diffused nodes. The proposed scheme scaled well with a large number of nodes and links, and it controlled the diffusion process to recommend content to users with high levels of relationship similarity to overcome the information overload problem.

Acknowledgments

This work was supported through Research Program by the National Research Foundation (NRF) of Korea (Grant No. 2014R1A1A2056357).

Author Contributions

Farman Ullah conceived the idea, and performed the experiment and analysis. Sungchang Lee finalized the idea and supervised the research.

Conflicts of Interest

The authors declare no conflict of interest.

References

  1. Ricci, F.; Rokach, L.; Shapira, B. Introduction to Recommender Systems Handbook; Springer: Berlin, Germany, 2011; pp. 1–35. [Google Scholar]
  2. Ullah, F.; Sarwar, G.; Lee, S. N-screen aware multicriteria hybrid recommender system using weight based subspace clustering. Sci. World J. 2014, 2014, 679849. [Google Scholar]
  3. Wang, Z.; Zhou, X.; Zhang, D.; Yang, D.; Yu, Z. Cross-domain community detection in heterogeneous social networks. Pers. Ubiquitous Comput. 2014, 18, 369–383. [Google Scholar]
  4. Adamic, L.A.; Glance, N. The political blogosphere and the 2004 US election: Divided they blog. In Proceedings of the 3rd International Workshop on Link Discovery, Chicago, IL, USA, 21–24 August 2005; pp. 36–43.
  5. Doo, M. Spatial and Social Diffusion of Information and Influence: Models and Algorithms; Georgia Institute of Technology: Atlanta, GA, USA, 2012. [Google Scholar]
  6. Cowan, R.; Jonard, N. Network structure and the diffusion of knowledge. J. Econ. Dyn. Control 2004, 28, 1557–1575. [Google Scholar]
  7. Dolde, W.; Tirtiroglu, D. Temporal and spatial information diffusion in real estate price changes and variances. Real Estate Econ. 1997, 25, 539–565. [Google Scholar]
  8. Ugander, J.; Karrer, B.; Backstrom, L.; Marlow, C. The anatomy of the Facebook Social Graph. 2011. arXiv:1111.4503. arXiv Preprint. Available online: http://arxiv.org/pdf/1111.4503v1.pdf (accessed on 8 June 2016).
  9. Koroleva, K.; Krasnova, H.; Günther, O. ‘STOP SPAMMING ME!’—Exploring Information Overload on Facebook. In Proceedings of the 16th Americas Conference on Information Systems, Lima, Peru, 12–15 August 2010; p. 447.
  10. Goldenberg, J.; Libai, B.; Muller, E. Talk of the network: A complex systems look at the underlying process of word-of-mouth. Mark. Lett. 2001, 12, 211–223. [Google Scholar]
  11. Jansen, B.J.; Zhang, M.; Sobel, K.; Chowdury, A. Twitter power: Tweets as electronic word of mouth. J. Am. Soc. Inf. Sci. Technol. 2009, 60, 2169–2188. [Google Scholar]
  12. Oxford dictionaries. Available online: http://www.oxforddictionaries.com/definition/english (accessed on 8 June 2016).
  13. Travers, J.; Milgram, S. An experimental study of the small world problem. Sociometry 1969, 32, 425–443. [Google Scholar]
  14. Cheng, A. Six Degrees of Separation, Twitter Style. 1969, Volume 5. Available online: http://www.sysomos.com/insidetwitter/sixdegrees/ (accessed on 8 June 2016).
  15. Guille, A.; Hacid, H.; Favre, C.; Zighed, D.A. Information diffusion in online social networks: A survey. ACM SIGMOD Rec. 2013, 42, 17–28. [Google Scholar]
  16. Teo, T.S. Demographic and motivation variables associated with Internet usage activities. Internet Res. 2001, 11, 125–137. [Google Scholar]
  17. Broecheler, M.; Shakarian, P.; Subrahmanian, V.S. A scalable framework for modeling competitive diffusion in social networks. In Proceedings of the IEEE Second International Conference on Social Computing (SocialCom), Minneapolis, MN, USA, 20–22 August 2010; pp. 295–302.
  18. Simmel, G. The Metropolis and Mental Life, 1903. Available online: https://books.google.com/books?hl=zh-CN&lr=&id=-mk5rOctXtEC&oi=fnd&pg=PA1999-IA2&dq=The+Metropolis+and+Mental+Life&ots=J_cSXCMc01&sig=qeTE6ihpClC6jjhu5ZkHswrlZ5s#v=onepage&q=The%20Metropolis%20and%20Mental%20Life&f=false (accessed on 8 June 2016).
  19. Moreno, J.L. Who Shall Survive; ASGPP: Washington, DC, USA, 1934; Volume 58. [Google Scholar]
  20. Barnes, J.A. Class and committees in a Norwegian island parish. Hum. Relat. 1954, 7, 39–58. [Google Scholar]
  21. Ellison, N.B. Social network sites: Definition, history, and scholarship. J. Comput. Med. Commun. 2007, 13, 210–230. [Google Scholar]
  22. Garrido, A. Symmetry in complex networks. Symmetry 2011, 3, 1–15. [Google Scholar]
  23. Chung, K.S.K.; Piraveenan, M.; Hossain, L. Topology of online social networks. In Encyclopedia of Social Network Analysis and Mining; Springer: New York, NY, USA, 2014; pp. 2191–2202. [Google Scholar]
  24. Haythornthwaite, C. Social networks and Internet connectivity effects. Inf. Community Soc. 2005, 8, 125–147. [Google Scholar]
  25. Jaeger, P.T.; Shneiderman, B.; Fleischmann, K.R.; Preece, J.; Qu, Y.; Wu, P.F. Community response grids: E-government, social networks, and effective emergency management. Telecommun. Policy 2007, 31, 592–604. [Google Scholar]
  26. Zappen, J.P.; Harrison, T.M.; Watson, D. A new paradigm for designing e-government: Web 2.0 and experience design. In Proceedings of the International Conference on Digital Government Research, Montreal, QC, Canada, 18–21 May 2008.
  27. Ho, J.Y.; Dempsey, M. Viral marketing: Motivations to forward online content. J. Bus. Res. 2010, 63, 1000–1006. [Google Scholar]
  28. Richardson, M.; Domingos, P. Mining knowledge-sharing sites for viral marketing. In Proceedings of the Eighth ACM SIGKDD International Conference on Knowledge Discovery and Data Mining, Edmonton, AB, Canada, 23–25 July 2002; pp. 61–70.
  29. Pan, Y.; Cong, F.; Chen, K.; Yu, Y. Diffusion-aware personalized social update recommendation. In Proceedings of the 7th ACM Conference on Recommender Systems, Hong Kong, China, 12–16 October 2013; pp. 69–76.
  30. Coleman, J.S.; Katz, E.; Menzel, H. Medical Innovation: A Diffusion Study; Bobbs-Merrill Co.: Indianapolis, IN, USA, 1966. [Google Scholar]
  31. Saulwick, A.; Trentelman, K. Towards a formal semantics of social influence. Knowl.-Based Syst. 2014, 71, 52–60. [Google Scholar]
  32. Kasthurirathna, D.; Harre, M.; Piraveenan, M. Influence modelling using bounded rationality in social networks. In Proceedings of the IEEE/ACM International Conference on Advances in Social Networks Analysis and Mining, Paris, France, 25–28 August 2015; pp. 33–40.
  33. Katona, Z.; Zubcsek, P.P.; Sarvary, M. Network effects and personal influences: The diffusion of an online social network. J. Mark. Res. 2011, 48, 425–443. [Google Scholar]
  34. Tang, J.; Sun, J.; Wang, C.; Yang, Z. Social influence analysis in large-scale networks. In Proceedings of the 15th ACM SIGKDD International Conference on Knowledge Discovery and Data mining, Paris, France, 28 June–1 July 2009; pp. 807–816.
  35. Bonacich, P.; Lloyd, P. Eigenvector-like measures of centrality for asymmetric relations. Soc. Netw. 2001, 23, 191–201. [Google Scholar]
  36. Freeman, L.C. A set of measures of centrality based on betweenness. Sociometry 1977, 40, 35–41. [Google Scholar]
  37. Piraveenan, M.; Prokopenko, M.; Hossain, L. Percolation Centrality: Quantifying Graph-Theoretic Impact of Nodes during Percolation in Networks. PLoS ONE 2013, 8. [Google Scholar] [CrossRef]
  38. Page, L.; Brin, S.; Motwani, R.; Winograd, T. The PageRank Citation Ranking: Bringing Order to the Web. Available online: http://ilpubs.stanford.edu:8090/422/1/1999-66.pdf (accessed on 8 June 2016).
  39. Brin, S.; Page, L. Reprint of: The anatomy of a large-scale hypertextual web search engine. Comput. Netw. 2012, 56, 3825–3833. [Google Scholar]
  40. Zhu, T.; Wang, B.; Wu, B.; Zhu, C. Maximizing the spread of influence ranking in social networks. Inf. Sci. 2014, 278, 535–544. [Google Scholar]
  41. Xiang, B.; Liu, Q.; Chen, E.; Xiong, H.; Zheng, Y.; Yang, Y. PageRank with Priors: An Influence Propagation Perspective. In Proceedings of the Twenty-Third International Joint Conference on Artificial Intelligence (IJCAI), Beijing, China, 3–9 August 2013.
  42. Luarn, P.; Yang, J.C.; Chiu, Y.P. The network effect on information dissemination on social network sites. Comput. Hum. Behav. 2014, 37, 1–8. [Google Scholar]
  43. Danchin, É.; Giraldeau, L.A.; Valone, T.J.; Wagner, R.H. Public information: From nosy neighbors to cultural evolution. Science 2004, 305, 487–491. [Google Scholar] [PubMed]
  44. Delre, S.A.; Jager, W.; Bijmolt, T.H.; Janssen, M.A. Will it spread or not? The effects of social influences and network topology on innovation diffusion. J. Product Innov. Manag. 2010, 27, 267–282. [Google Scholar]
  45. Kempe, D.; Kleinberg, J.; Tardos, É. Maximizing the spread of influence through a social network. In Proceedings of the Ninth ACM SIGKDD International Conference on Knowledge Discovery and Data Mining, Washington, DC, USA, 24–27 August 2003; pp. 137–146.
  46. Kempe, D.; Kleinberg, J.; Tardos, É. Maximizing the spread of influence through a social network. Theory Comput. 2015, 11, 105–147. [Google Scholar]
  47. Goyal, A.; Lu, W.; Lakshmanan, L.V. Simpath: An efficient algorithm for influence maximization under the linear threshold model. In Proceedings of the 2011 IEEE 11th International Conference on Data Mining, Vancouver, BC, Canada, 11–14 December 2011; pp. 211–220.
  48. Chen, W.; Collins, A.; Cummings, R.; Ke, T.; Liu, Z.; Rincon, D.; Yuan, Y. Influence Maximization in Social Networks When Negative Opinions May Emerge and Propagate. In Proceedings of the SIAM International Conference on Data Mining (SDM ’2011), Mesa, AZ, USA, 28–30 April 2011; Volume 11, pp. 379–390.
  49. Bakshy, E.; Rosenn, I.; Marlow, C.; Adamic, L. The role of social networks in information diffusion. In Proceedings of the 21st International Conference on World Wide Web, Lyon, France, 16—20 April 2012; pp. 519–528.
  50. Kim, M.; Newth, D.; Christen, P. Modeling dynamics of diffusion across heterogeneous social networks: News diffusion in social media. Entropy 2013, 15, 4215–4242. [Google Scholar]
  51. Kasthurirathna, D.; Piraveenan, M.; Harré, M. Influence of topology in the evolution of coordination in complex networks under information diffusion constraints. Eur. Phys. J. B 2014, 87, 1–15. [Google Scholar]
  52. Ullah, F.; Sarwar, G.; Lee, S.C.; Park, Y.K.; Moon, K.D.; Kim, J.T. Hybrid recommender system with temporal information. In Proceedings of the 26th International Conference on Advanced Information Networking and Applications, Fukuoka, Japan, 26–29 March 2012; pp. 421–425.
  53. Nicosia, V.; Tang, J.; Mascolo, C.; Musolesi, M.; Russo, G.; Latora, V. Graph metrics for temporal networks. In Temporal Networks; Springer: Berlin/Heidelberg, Germany, 2013; pp. 15–40. [Google Scholar]
  54. Holme, P.; Saramäki, J. Temporal networks. Phys. Rep. 2012, 519, 97–125. [Google Scholar]
  55. Barthélemy, M. Spatial networks. Phys. Rep. 2011, 499, 1–101. [Google Scholar]
  56. Liu, S.; Meng, X. A Location-Based Business Information Recommendation Algorithm. Math. Probl. Eng. 2015, 2015, 345480. [Google Scholar]
  57. Sinnott, R.W. Virtues of the Haversine. Sky Telesc. 1984, 68, 158. [Google Scholar]
  58. Palmer, M.C. Calculation of distance traveled by fishing vessels using GPS positional data: A theoretical evaluation of the sources of error. Fish. Res. 2008, 89, 57–64. [Google Scholar]
  59. Borgatti, S.P. Centrality and network flow. Soc. Netw. 2005, 27, 55–71. [Google Scholar]
  60. Nocera, A.; Ursino, D. PHIS: A system for scouting potential hubs and for favoring their “growth” in a Social Internetworking Scenario. Knowl.-Based Syst. 2012, 36, 288–299. [Google Scholar]
  61. Doo, M.; Liu, L. Probabilistic Diffusion of Social Influence with Incentives. IEEE Trans. Serv. Comput. 2014, 7, 387–400. [Google Scholar]
  62. Kurant, M.; Gjoka, M.; Wang, Y.; Almquist, Z.W.; Butts, C.T.; Markopoulou, A. Coarse-grained topology estimation via graph sampling. In Proceedings of the 2012 ACM Workshop on Workshop on Online Social Networks, Helsinki, Finland, 13–17 August 2012; pp. 25–30.
  63. Rossi, R.; Ahmed, N. The Network Data Repository with Interactive Graph Analytics and Visualization. In Proceedings of the Twenty-Ninth AAAI Conference on Artificial Intelligence (AAAI-15), Austin, TX, USA, 25–30 January 2015; Volume 15, pp. 4292–4293.
  64. GroupLens Dataset (ml-100k). Available online: http://grouplens.org/datasets/movielens/ (accessed on 8 June 2016).
  65. Zachary, W.W. An information flow model for conflict and fission in small groups. J. Anthropol. Res. 1977, 33, 452–473. [Google Scholar]
  66. Newman, M.E. Who is the best connected scientist? A study of scientific coauthorship networks. In Complex Networks; Springer: Berlin/Heidelberg, Germany, 2004; pp. 337–370. [Google Scholar]
  67. Knuth, D.E. The Stanford GraphBase: A Platform for Combinatorial Computing; Addison-Wesley: Reading, PA, USA, 1993; Volume 37. [Google Scholar]
  68. Kimura, M.; Saito, K. Tractable models for information diffusion in social networks. In Proceedings of the European Conference on Principles of Data Mining and Knowledge Discovery, Berlin, Germany, 18–22 September 2006; Springer: Berlin/Heidelberg, Germany, 2006; pp. 259–271. [Google Scholar]
  69. Bastian, M.; Heymann, S.; Jacomy, M. Gephi: An open source software for exploring and manipulating networks. In Proceedings of the Third International AAAI Conference on Weblogs and Social Media, San Jose, CA, USA, 17–20 May 2009; Volume 8, pp. 361–362.

Article Metrics

Citations

Article Access Statistics

Multiple requests from the same IP address are counted as one view.