1. Introduction
With the rapid development of smart TVs, these are being used for various functionalities such as TV broadcasting, social network service (SNS), video on demand (VOD), television-commerce (T-commerce), and teleconferencing services. Recently, the applications of smart TV have been diversified for viewers’ usability, and many commercialized smart TVs are equipped with a camera to provide intelligent services and high convenience to viewers [
1,
2,
3]. In particular, user identification is required for some services such as T-commerce and T-banking in a smart TV environment. Considering the convenience of the viewers, biometrics can be used to provide user identification. As a typical example of biometric techniques, face recognition is a reasonable solution in a smart TV environment because it does not require the viewer to come in contact with the special sensor on the TV but can be executed only by the camera of the smart TV. Therefore, this can easily facilitate the use of face recognition in many applications with high convenience. However, the viewer can have various facial poses, illumination, and expression variations while watching TV, and the performance of face recognition is inevitably degraded due to these factors. There have been many studies focusing on these problems.
Two main approaches for face recognition that are robust to illumination changes have been proposed. One of them is to represent images with features that are insensitive to illumination changes [
4,
5]. The other approach is to construct a low-dimensional linear subspace for face images by considering different lighting conditions [
6,
7]. Pose variability is usually regarded as the most challenging problem in the field of face recognition. There are different algorithms for dealing with the pose variation problem [
8]. In general, they can be categorized as follows: (1) the approach of extracting invariant features; (2) the multiview-based approach; and (3) the approach of using a three-dimensional (3D) range image. The approach of extracting invariant features uses some features in a face image that do not change under pose variation [
9,
10,
11]. The multiview-based approach stores a variety of view images in the database to handle the pose variation problem or to synthesize new view images from a given image. Recognition is then carried out using both the given image and the synthesized images [
12,
13,
14]. Face recognition from 3D range images is another approach being vividly studied by researchers. Because the 3D shape of a face is not affected by illumination and pose variations, the face recognition approach based on 3D shape has evolved as a promising solution for dealing with these variations.
The above approaches can handle some variations on face but still have drawbacks that restrict their application. That is, since some features invariant to one variation can be sensitive to other variations, it is difficult to extract features that are completely immune to all kinds of variation. Thus, it is unsafe to heavily rely on the selection of invariant features for a particular variation. These limitations of single image-based face recognition have motivated the development of video-based face recognition [
15,
16].
There are some major advantages of video-based face recognition. First, spatial and temporal information of faces in a video sequence can be used to improve the performance of single image-based face recognition. Second, recent psychophysical and neural researches have shown that dynamic information is very important for the human face recognition process [
17]. Third, with additional information of various poses and face size, we can acquire more effective representations of faces such as a 3D face model [
18] or super-resolution images [
19], which can be used to improve the recognition performance. Fourth, video-based face recognition can adopt online learning techniques to update the model over time [
20]. Even though there are obvious advantages of video-based recognition, there are some disadvantages such as the successive face images captured can have the factors of poor video quality, low image resolution, and pose, illumination, and expression variations. In spite of all these advantages and disadvantages, various kinds of approaches for video-based face recognition have been implemented.
A simple way to process the faces in a video sequence is to keep and use all the images in the sequence for face recognition. However, the use of all images of the video sequence can incur steep computational costs and does not guarantee optimal performance. Moreover, parts of these face images in the sequence are useless because of motion blur, non-frontal pose, and non-uniform illumination. Therefore, a method that chooses the best face images in terms of quality is required for a video sequence. This is based on face quality assessment (FQA), and the set of high-quality face images is denoted as Face Log [
21]. Since the performance of face recognition is affected by multiple factors, the detection of one or two quality measures (QMs) is insufficient for FQA. An approach to simultaneously detect multiple QMs is the use of a fusion of QMs for FQA. Hsu
et al. proposed a framework to fuse individual quality scores into an overall score, which is shown to be correlated to the genuine matching score (the matching score when an input face image is correctly matched with the enrolled one of the same person) of face recognition engine [
22]. Many studies adopted a weighted quality fusion approach to combine QMs, and these weighted values for fusion were experimentally determined or obtained through training [
23,
24,
25,
26,
27]. In addition, Anantharajah
et al. used a neural network to fuse QM scores, where the neural network was trained to produce a high score for a high-quality face image [
28]. On the other hand, Nasrollahi
et al. proposed a method that uses a fuzzy combination of QMs instead of a linear combination [
21]. A fuzzy inference engine was adopted for improving the performance without training, but a few fixed QMs were used in this method. In addition, they provided only the accuracy of quality assessment by their method, not showing the performance enhancement of face recognition.
All the previous studies used a few fixed QMs, and their measures are difficult to reflect primary factors that influence the performance of face recognition. For example, although some QMs that can assess facial pose and illumination variation are selected in a face recognition system, if other factors (such as blurring and expression variation) occur in the system, the performance of face recognition degrades.
Therefore, in this study, QMs are adaptively selected by comparing variance values obtained from candidate QMs within a video sequence, where the higher the variance value by a QM, the more meaningful is the QM in terms of a distinction between images. Therefore, the selected QMs can reflect primary factors that influence the performance, and the fusion of QMs is carried out by a symmetrical fuzzy system. Based on the selected high-quality images (Face Log), the performance of the proposed method is enhanced by fusing matching scores.
Table 1 shows a summary of comparisons between methods discussed in previous research and the proposed method.
Table 1.
Comparison of previous and proposed methods.
Table 1.
Comparison of previous and proposed methods.
| Category | Method | Strength | Weakness |
|---|
| Single image- based method | - •
Using the features of a single image for face recognition [ 4, 5, 6, 7, 8, 9, 10, 11, 12, 13, 14]
| - •
Less time for image acquisition and processing
| - •
Features invariant to one variation can be sensitive to other variations
|
| Video-based method | Not using image selection | - •
Using spatial and temporal information of faces in a video sequence [ 18, 19, 20]
| - •
With redundant information, more sophisticated representations of faces can be reconstructed, which can be applied to improve recognition performance
| - •
Using all images of the video sequence can incur steep computational costs and does not guarantee optimal performance - •
Parts of face images are useless because of motion blur, non-frontal pose, and non-uniform illumination
|
| Selecting Face Log based on QMs | Using fixed QMs | Training for fusion [22,23,27,28] | - •
Optimal performance of face recognition can be obtained
| - •
The performance of face recognition depends on the training set; therefore, it is difficult to select the training data with wide variations
|
| No training for fusion [21,24,25,26] | - •
Higher accuracy than the video-based method not using image selection and the single image-based method
| - •
The performance improvement is limited because the fusion is experimentally or empirically determined with fixed QMs
|
| Adaptive selection of QMs and fusion of quality score without training (proposed method) | - •
QMs can be adaptively selected, and they can reflect primary factors that influence performance
| - •
Additional processing time is required for the adaptive selection of QMs
|
The remainder of this paper is organized as follows: in
Section 2, the proposed method is described. Experimental results and conclusions are presented in
Section 3 and
Section 4, respectively.
3. Experimental Results and Analyses
The proposed method for face recognition was tested on a desktop computer with an Intel Core™ I7 3.5-GHz CPU and 8-GB RAM. The algorithm was developed using Microsoft Foundation Class (MFC)-based C++ programming and the Direct X9.0 software development kit (SDK).
Although there are a lot of face databases such as FEI [
47], PAL [
48], AR [
49], JAFFE [
50], YouTube Faces [
51], Honda/UCSD video database [
52], and IIT-NRC facial video database [
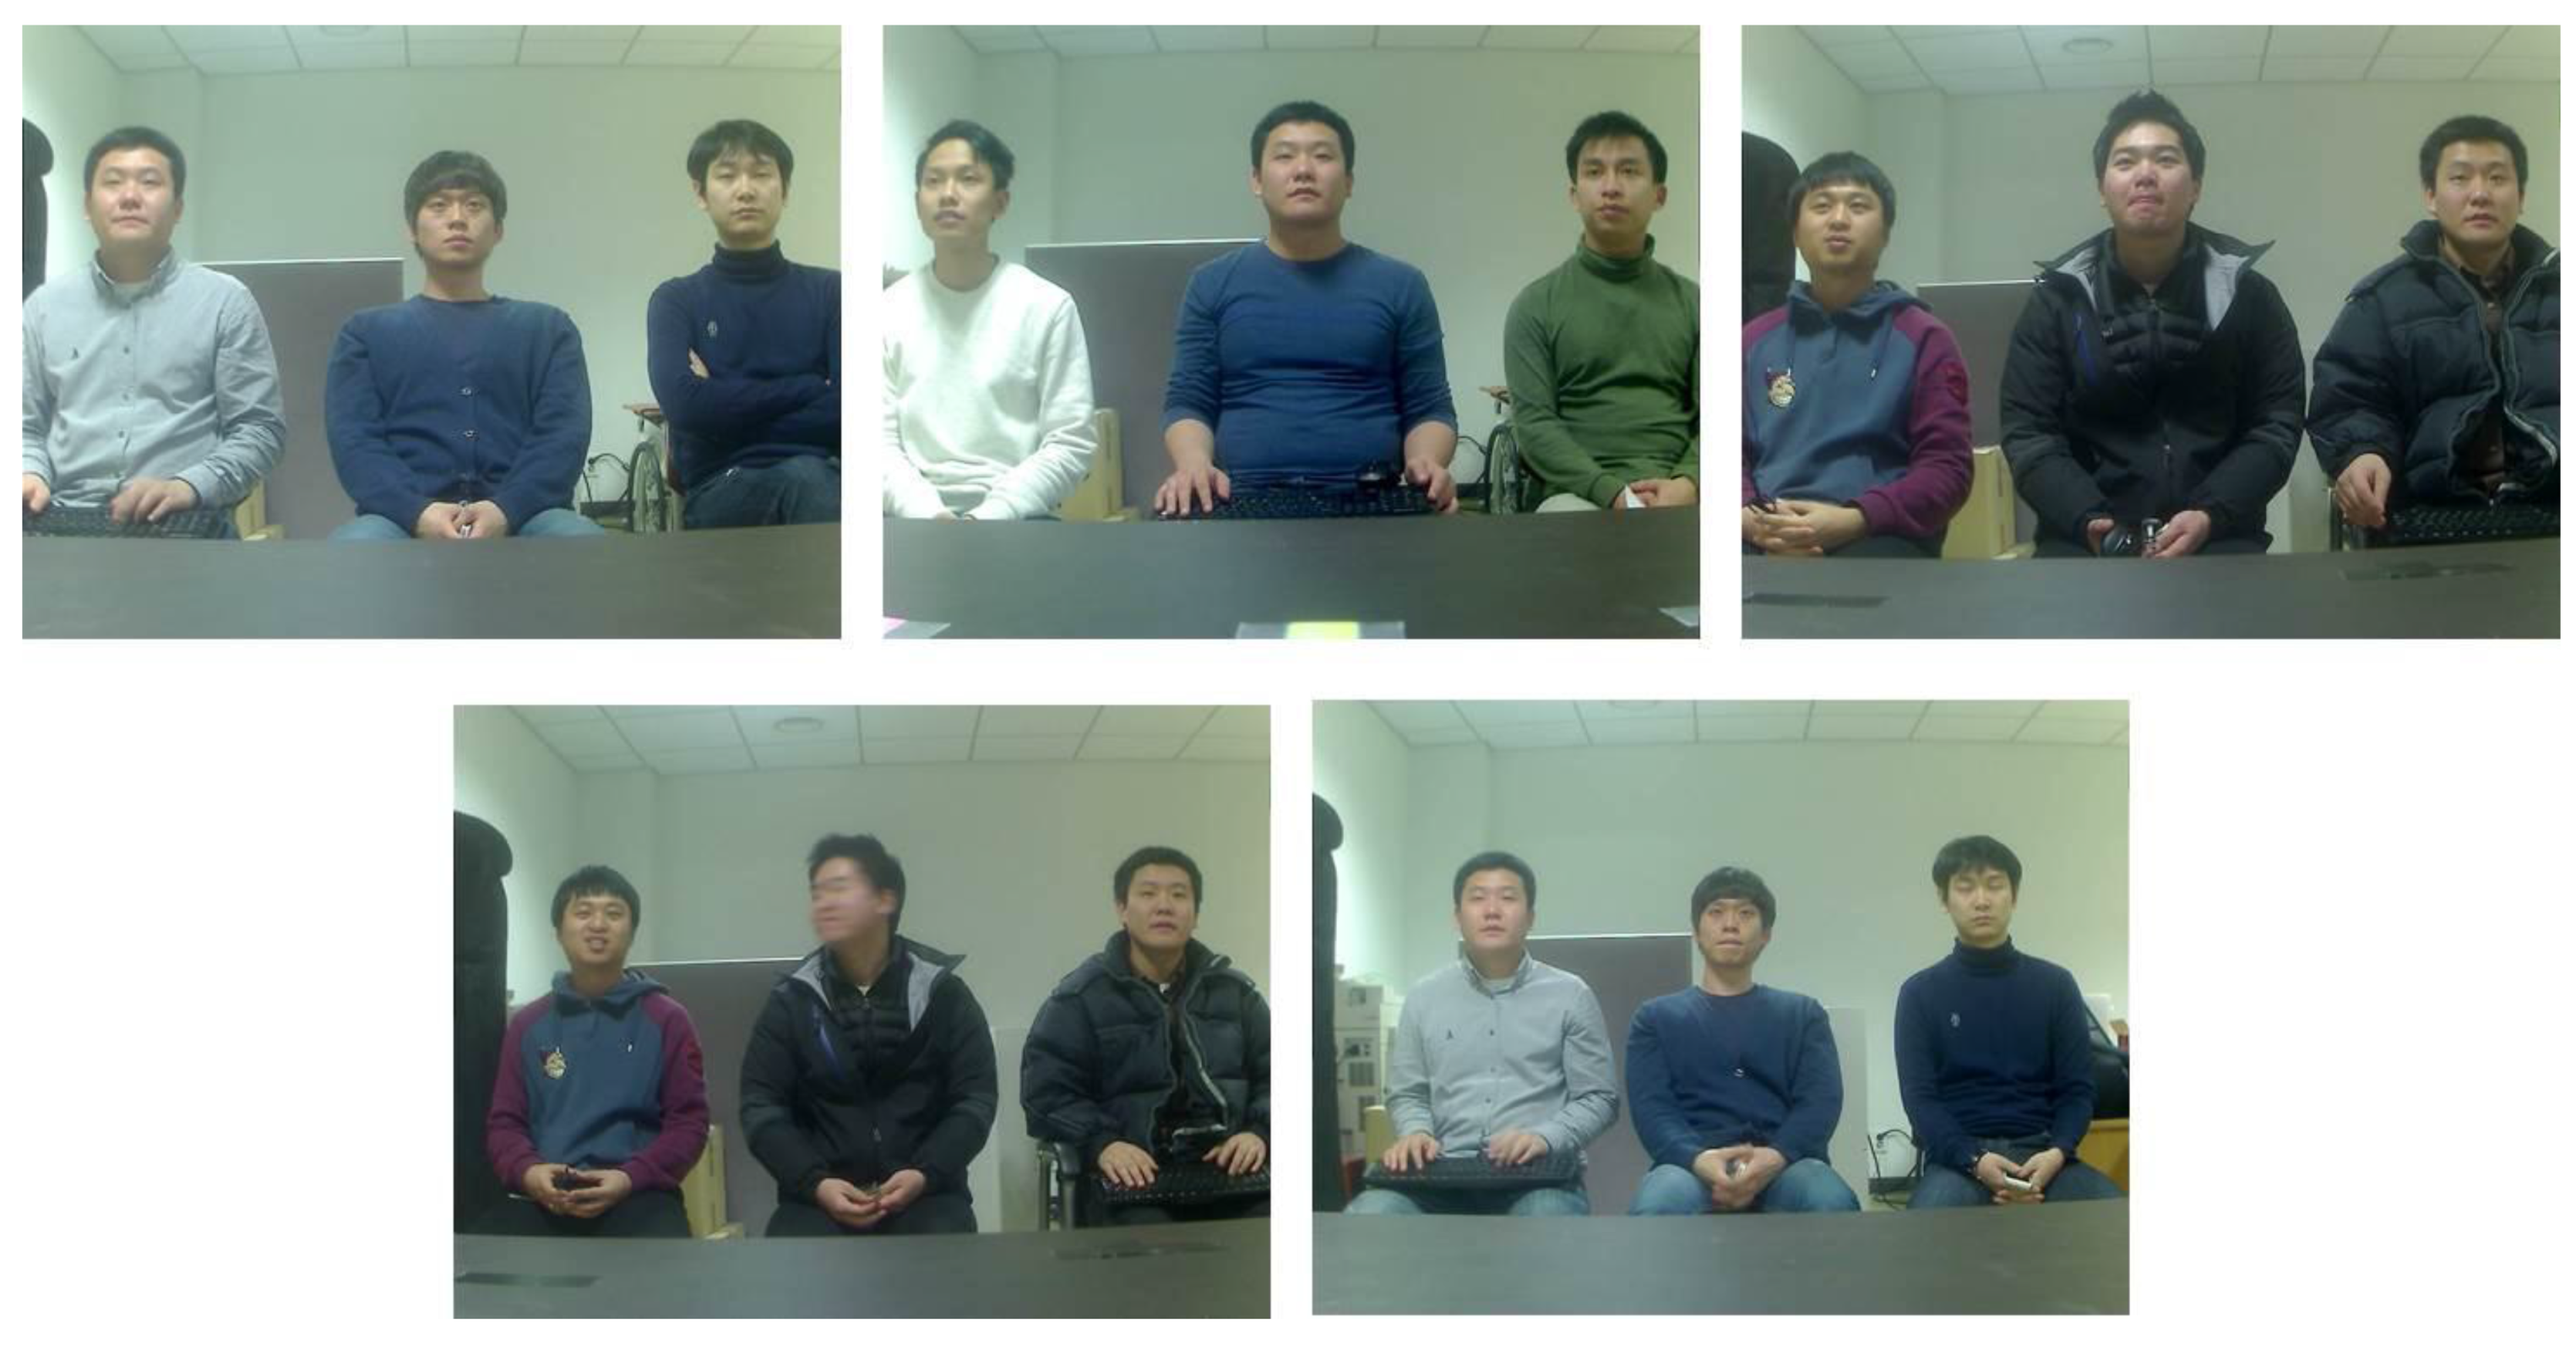
53], most of them do not include all the factors such as the variations of head pose, illumination, sharpness, openness of eyes, contrast, and image resolutions in the video sequences of the database. Therefore, we constructed our own database (Database I), which includes all of these factors in the video sequences for the experiments.
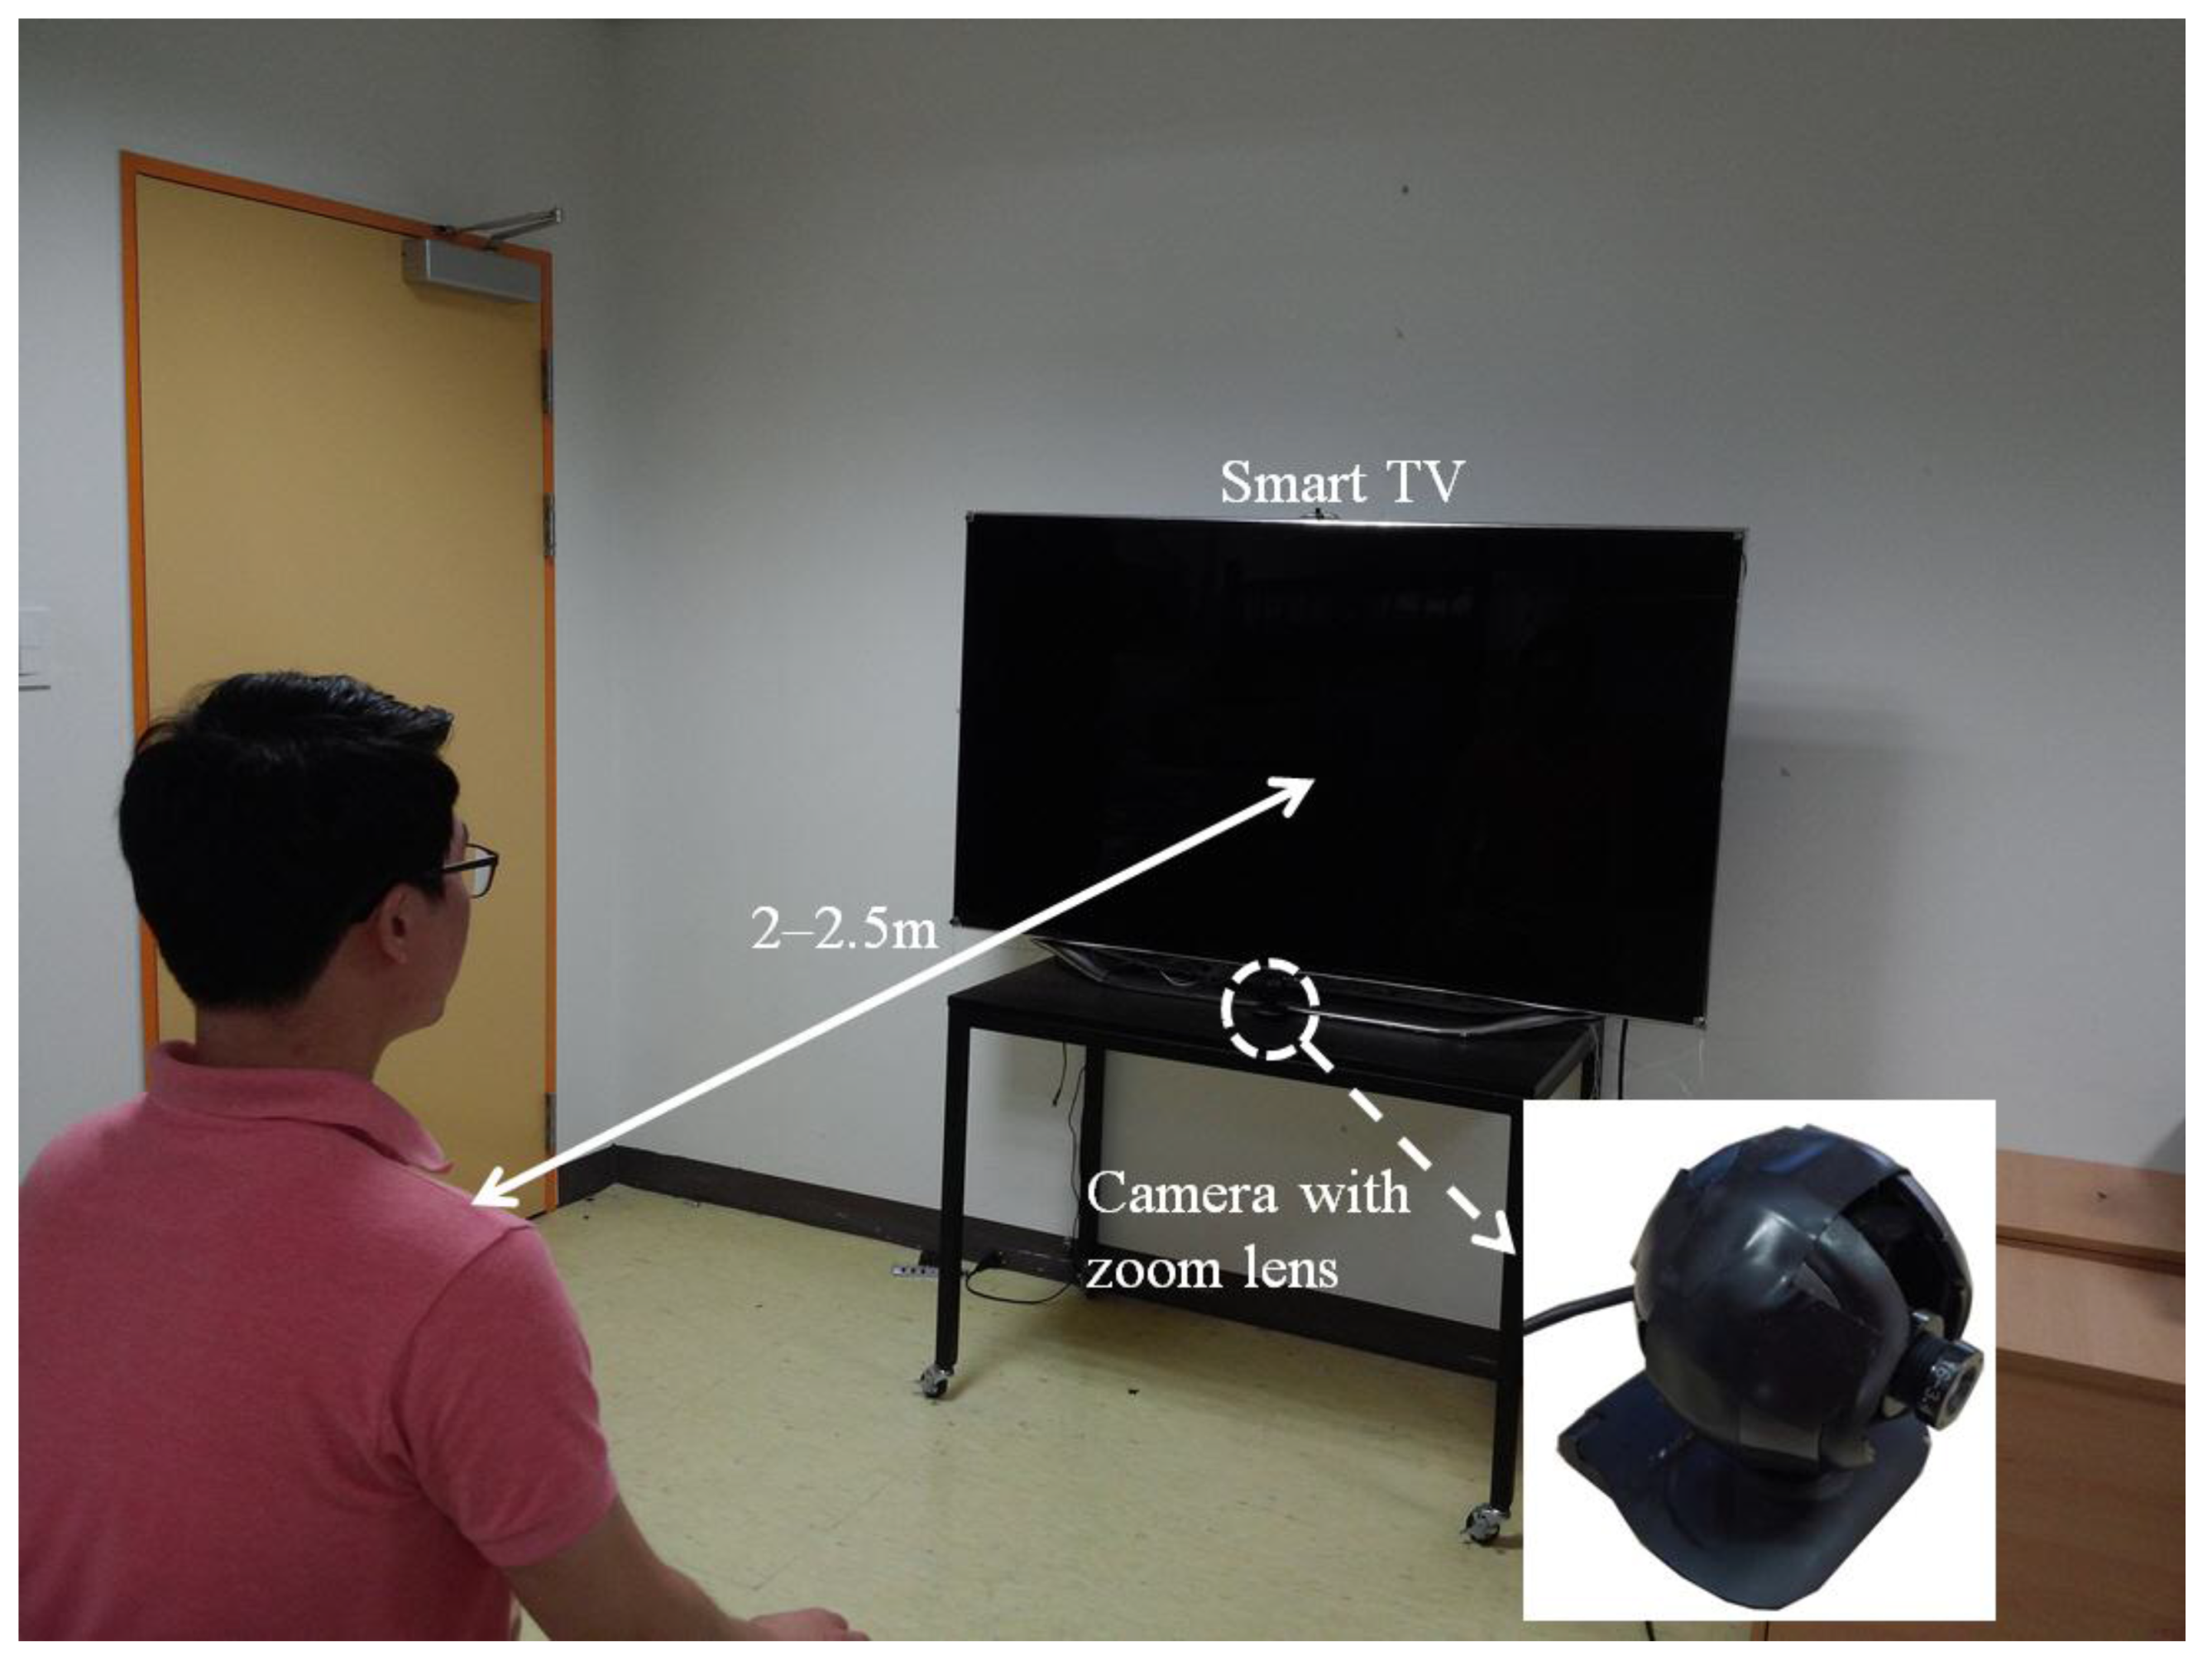
When constructing our database, we defined 20 groups based on 20 people who participated in the test. The three people in each group carried out three trials using the proposed system by varying the Z distance (2, 2.5 m) and the sitting positions (left, middle, and right). Participants randomly and naturally looked at any point on the TV screen with their eyes blinking as if they were watching TV. During this period, successive images were acquired. The database contained a total of 31,234 images for measuring the performance of the proposed method. In addition, an additional five images per person in each group were obtained at the distance Z of 2 m at the enrollment stage.
Figure 13 shows the examples of images captured for the experiments.
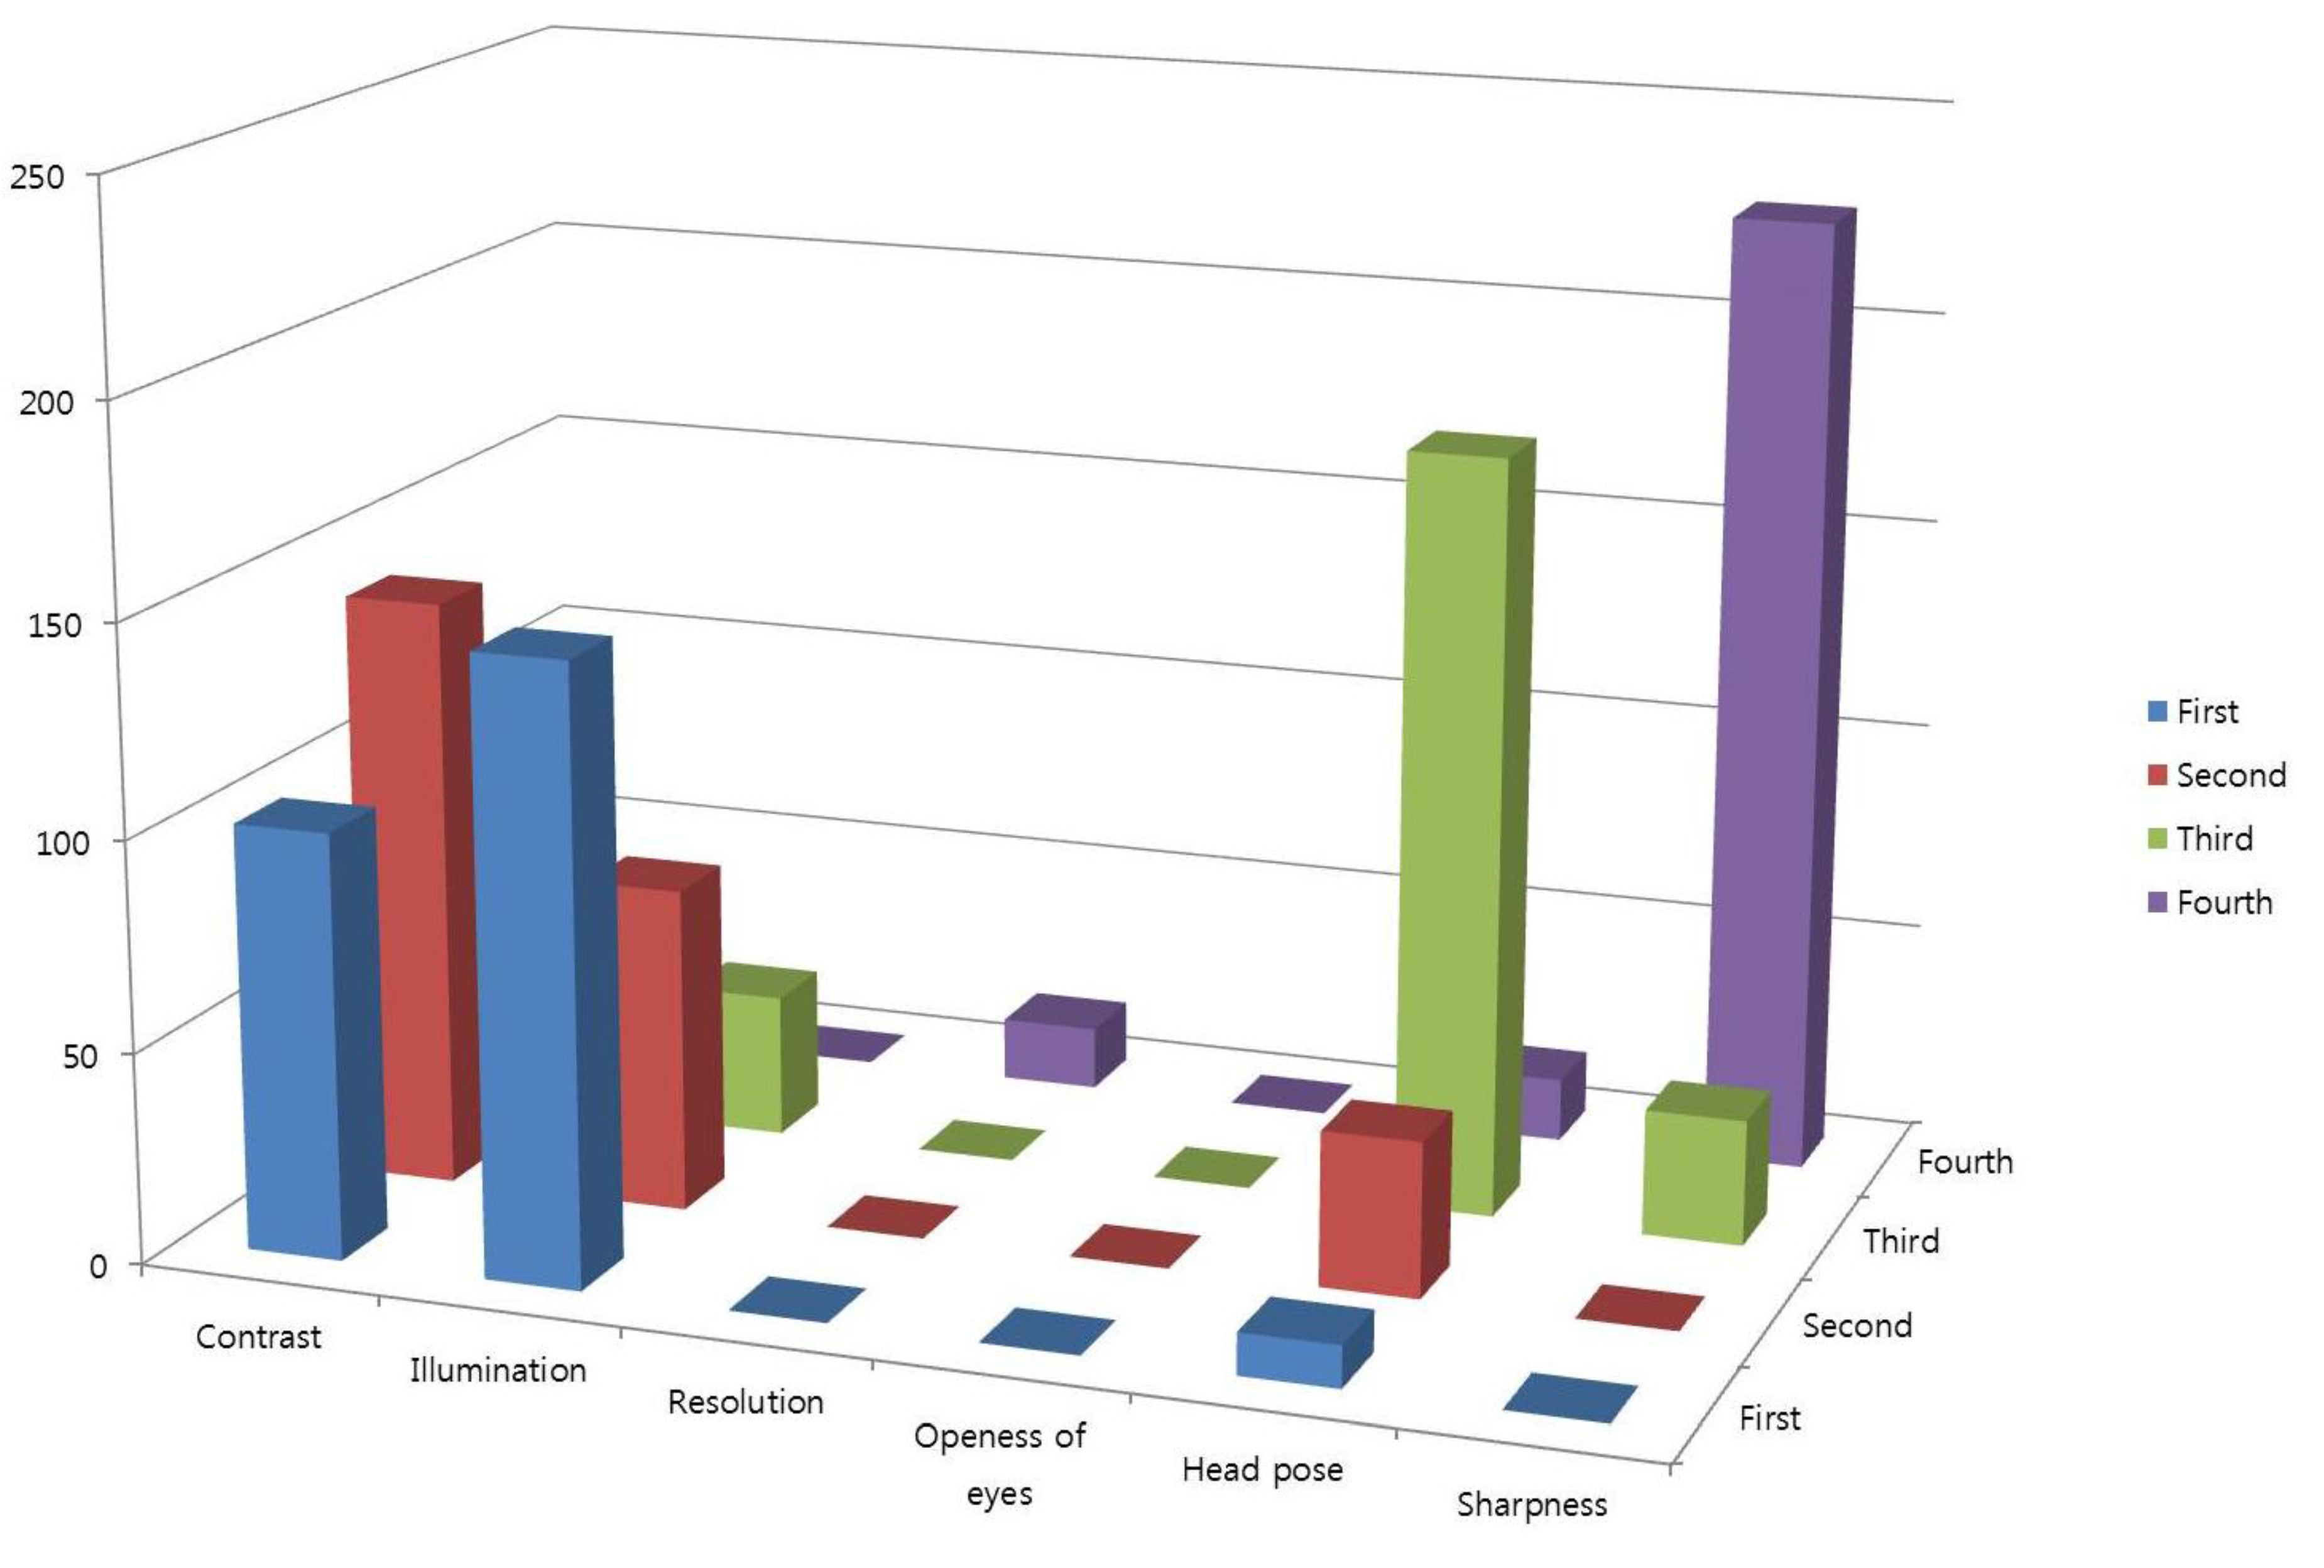
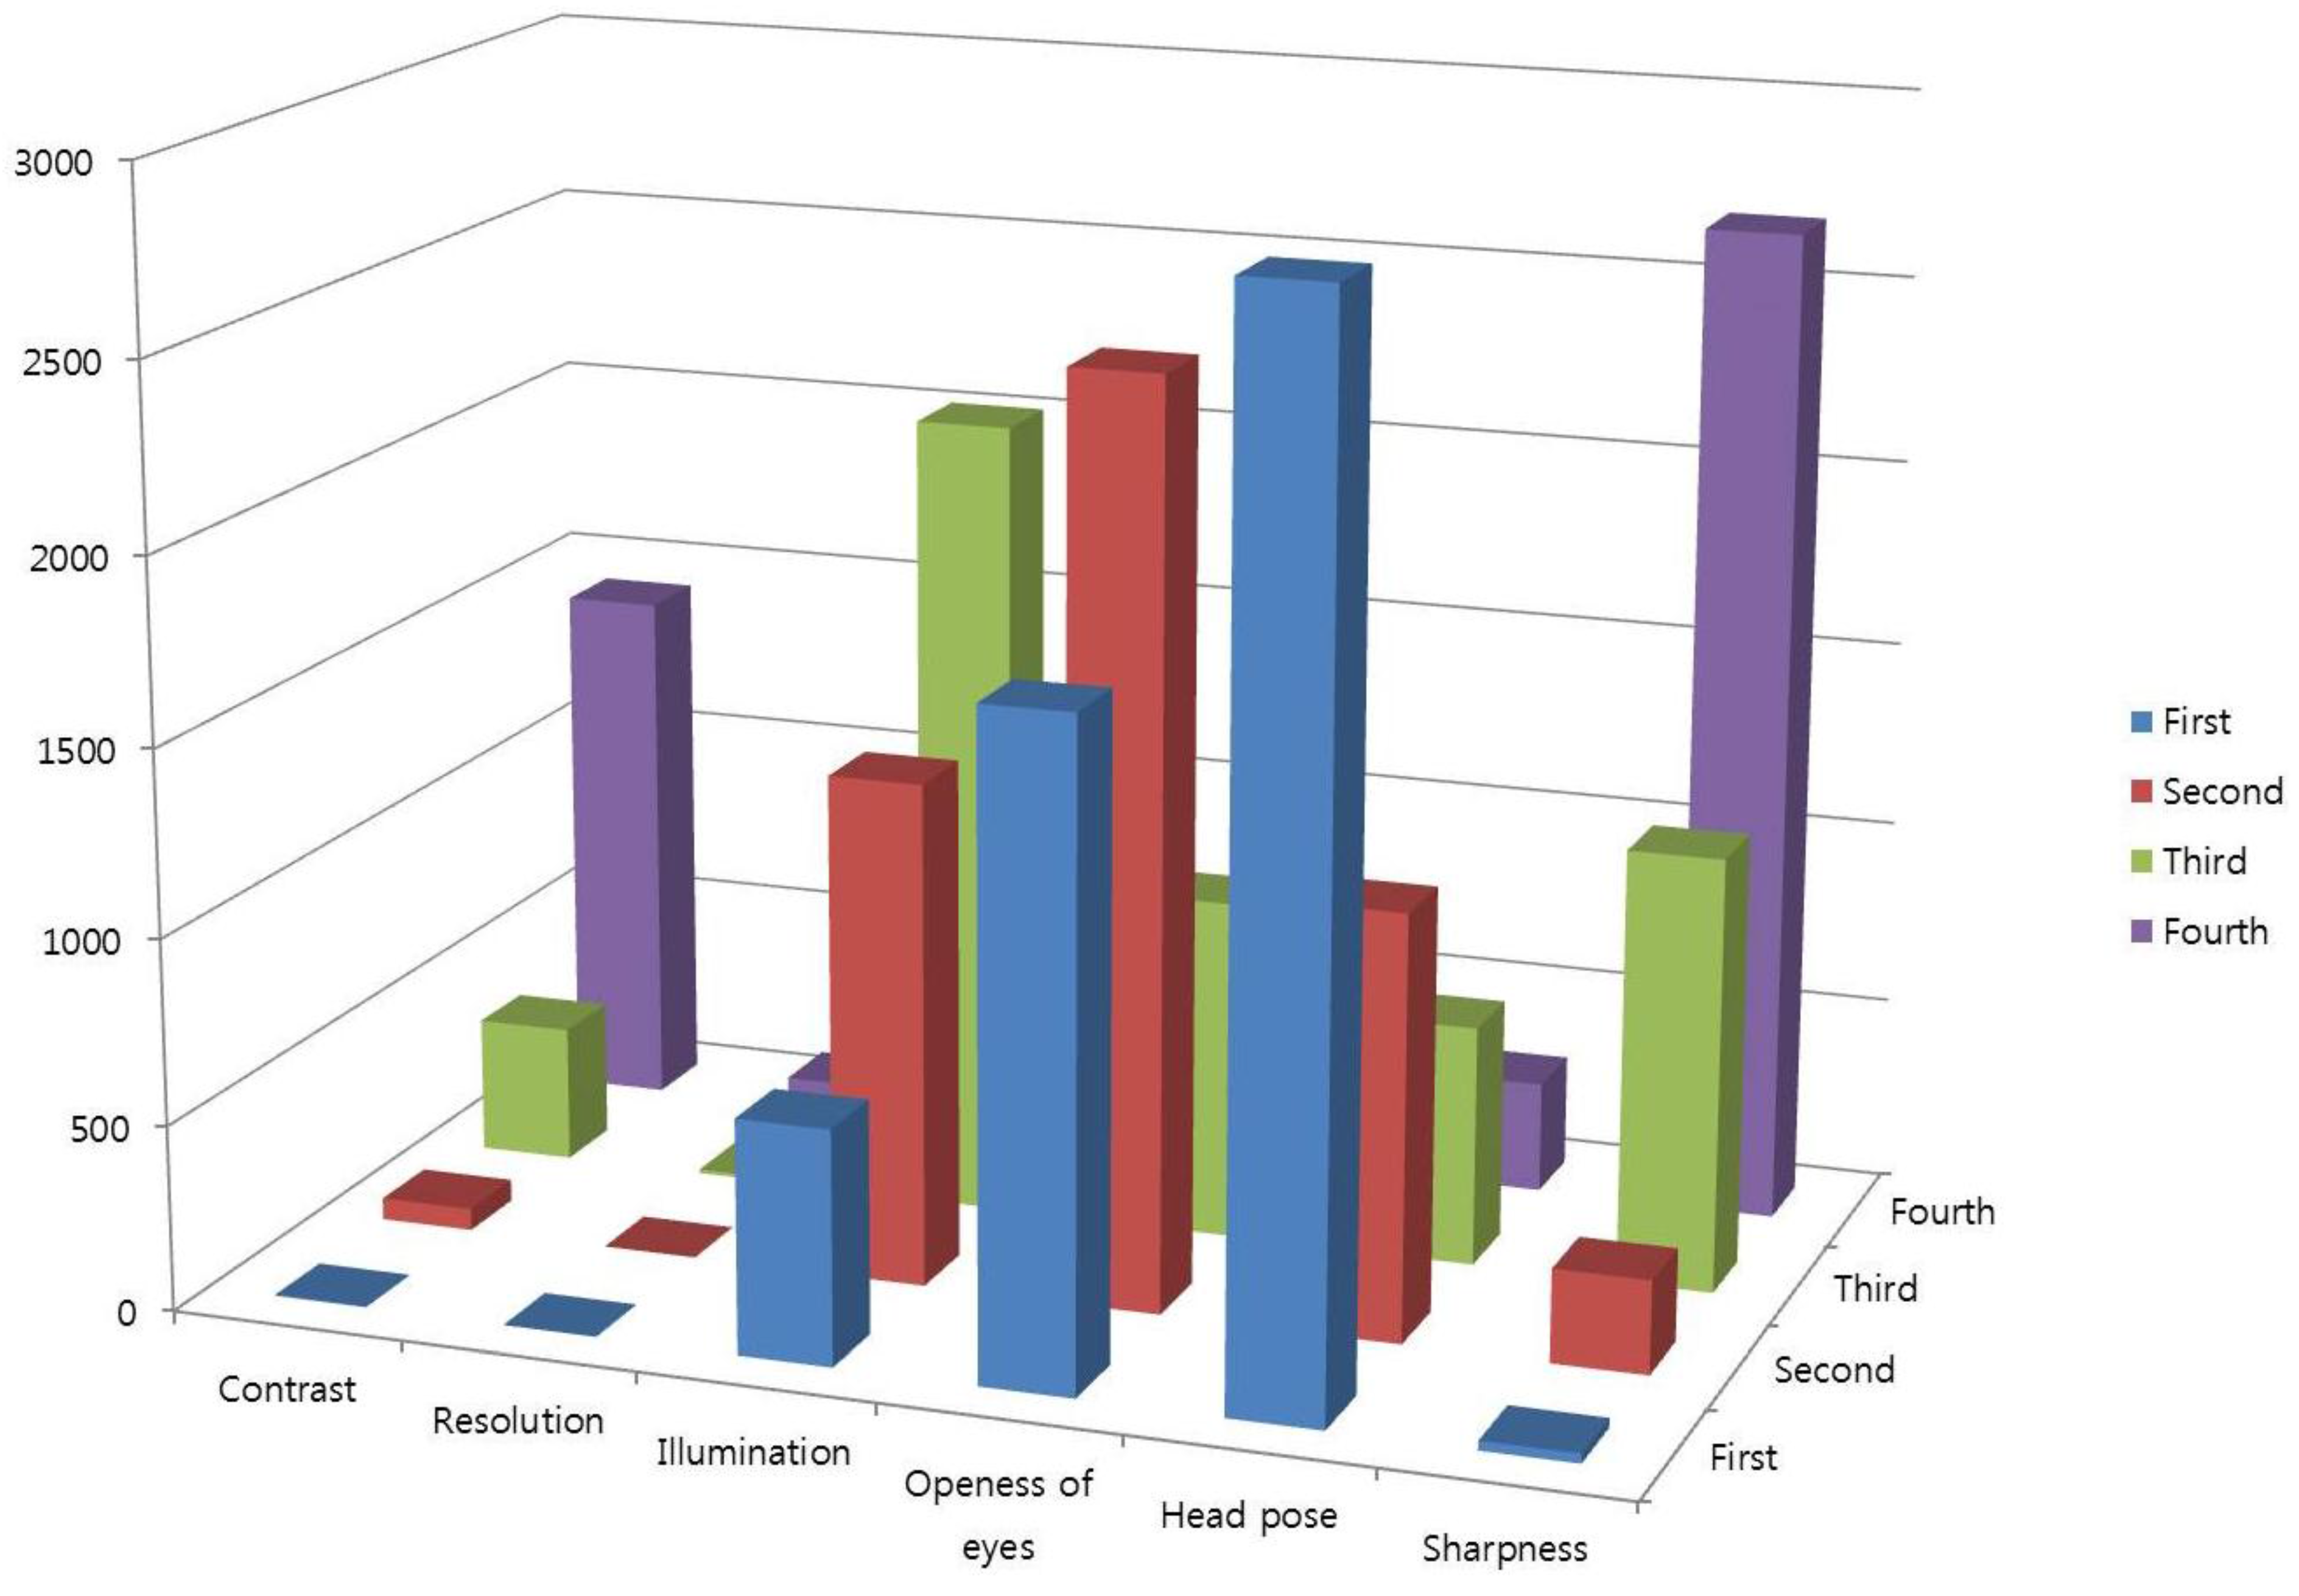
This database contains the variations in head pose, illumination, sharpness, and openness of the eyes, as shown in
Figure 14. It is observed that the head pose is the most influential quality measure to construct the Face Log, whereas image resolution has no influence as a QM because participants have few Z-distance variations. In
Figure 14, the bar in the first (row) denotes the number of selected QMs as the first order. Similarly, the bar in the fourth (row) denotes the number of selected QMs as the fourth order. The vertical axis of
Figure 14 shows the number of selected QMs.
Figure 13.
Captured images for the experiments.
Figure 13.
Captured images for the experiments.
Figure 14.
Results of adaptively selected quality measures.
Figure 14.
Results of adaptively selected quality measures.
In the first experiment, we measured the accuracy of the face recognition method based on genuine acceptance rate (GAR) where we set the number of enrolled persons to three. As explained in
Section 2.4, either the MIN or MAX method can be chosen for obtaining the IV. Further, the final output score can be obtained by using one of the five defuzzification methods (FOM, LOM, MOM, MeOM, or COG). Therefore, we compared the accuracies of face recognition using the MIN or MAX methods and compared them according to the defuzzification method, as shown in
Table 3. Here, the number of face images in a video sequence is 10; we also measured the accuracies of face recognition by changing the number of selected images in the Face Log. In
Table 3, no fusion means all the matching scores (
MS1, …,
MSm) of Equation (9) are used for calculating the GAR not using the fusion method of Equation (8). Fusion of
Table 3 means our method, and therefore, the
FMS of Equation (9) is used for calculating GAR.
Experimental results showed that the methods based on MIN and COG generally show higher face recognition accuracies than the other methods. The best accuracy (92.94%) was obtained with the Fuzzy MIN rule and COG in the case of fusing five selected images.
Table 3.
Comparison of face recognition accuracies using the MIN or MAX methods according to the defuzzification method (unit: %).
Table 3.
Comparison of face recognition accuracies using the MIN or MAX methods according to the defuzzification method (unit: %).
| Method | Number of Selected m Images |
|---|
| 1 | 2 | 3 | 4 | 5 |
|---|
| No Fusion | No Fusion | Fusion | No Fusion | Fusion | No Fusion | Fusion | No Fusion | Fusion |
|---|
| Fuzzy MIN rule | FOM | 92.05 | 89.74 | 91.95 | 91.35 | 92.3 | 91.36 | 92.42 | 91.32 | 92.44 |
| LOM | 91.61 | 91.05 | 91.78 | 91.3 | 91.95 | 91.28 | 92.17 | 91.33 | 92.23 |
| MOM | 92.29 | 91.35 | 91.88 | 91.43 | 92.05 | 91.45 | 92.38 | 91.45 | 92.45 |
| MeOM | 92.23 | 91.54 | 92.29 | 91.53 | 92.63 | 91.48 | 92.92 | 91.41 | 92.82 |
| COG | 92.27 | 91.61 | 92.42 | 91.63 | 92.73 | 91.63 | 92.89 | 91.58 | 92.94 |
| Fuzzy MAX rule | FOM | 92.12 | 91.49 | 91.74 | 91.49 | 91.98 | 91.46 | 92.1 | 91.45 | 92.16 |
| LOM | 92.31 | 91.38 | 91.9 | 91.41 | 92.18 | 91.36 | 92.2 | 91.36 | 92.46 |
| MOM | 91.77 | 91.31 | 92.01 | 91.53 | 92.43 | 91.46 | 92.4 | 91.43 | 92.42 |
| MeOM | 92.43 | 91.47 | 92.09 | 91.52 | 92.68 | 91.51 | 92.72 | 91.47 | 92.72 |
| COG | 92.37 | 91.4 | 92.33 | 91.58 | 92.77 | 91.42 | 92.72 | 91.54 | 92.86 |
In the next experiment, we performed the additional experiments for measuring the accuracies of face recognition in terms of GAR according to the number of QMs as shown in
Table 4. Since we use the fuzzy system to combine the values obtained by the selected QMs and to obtain the final quality score of the image, the number of QMs should be at least two. Therefore, we compared the accuracies of face recognition according to the number of QMs and defuzzification method. Experimental results showed that the greater the number of QMs, the higher the accuracy of face recognition becomes.
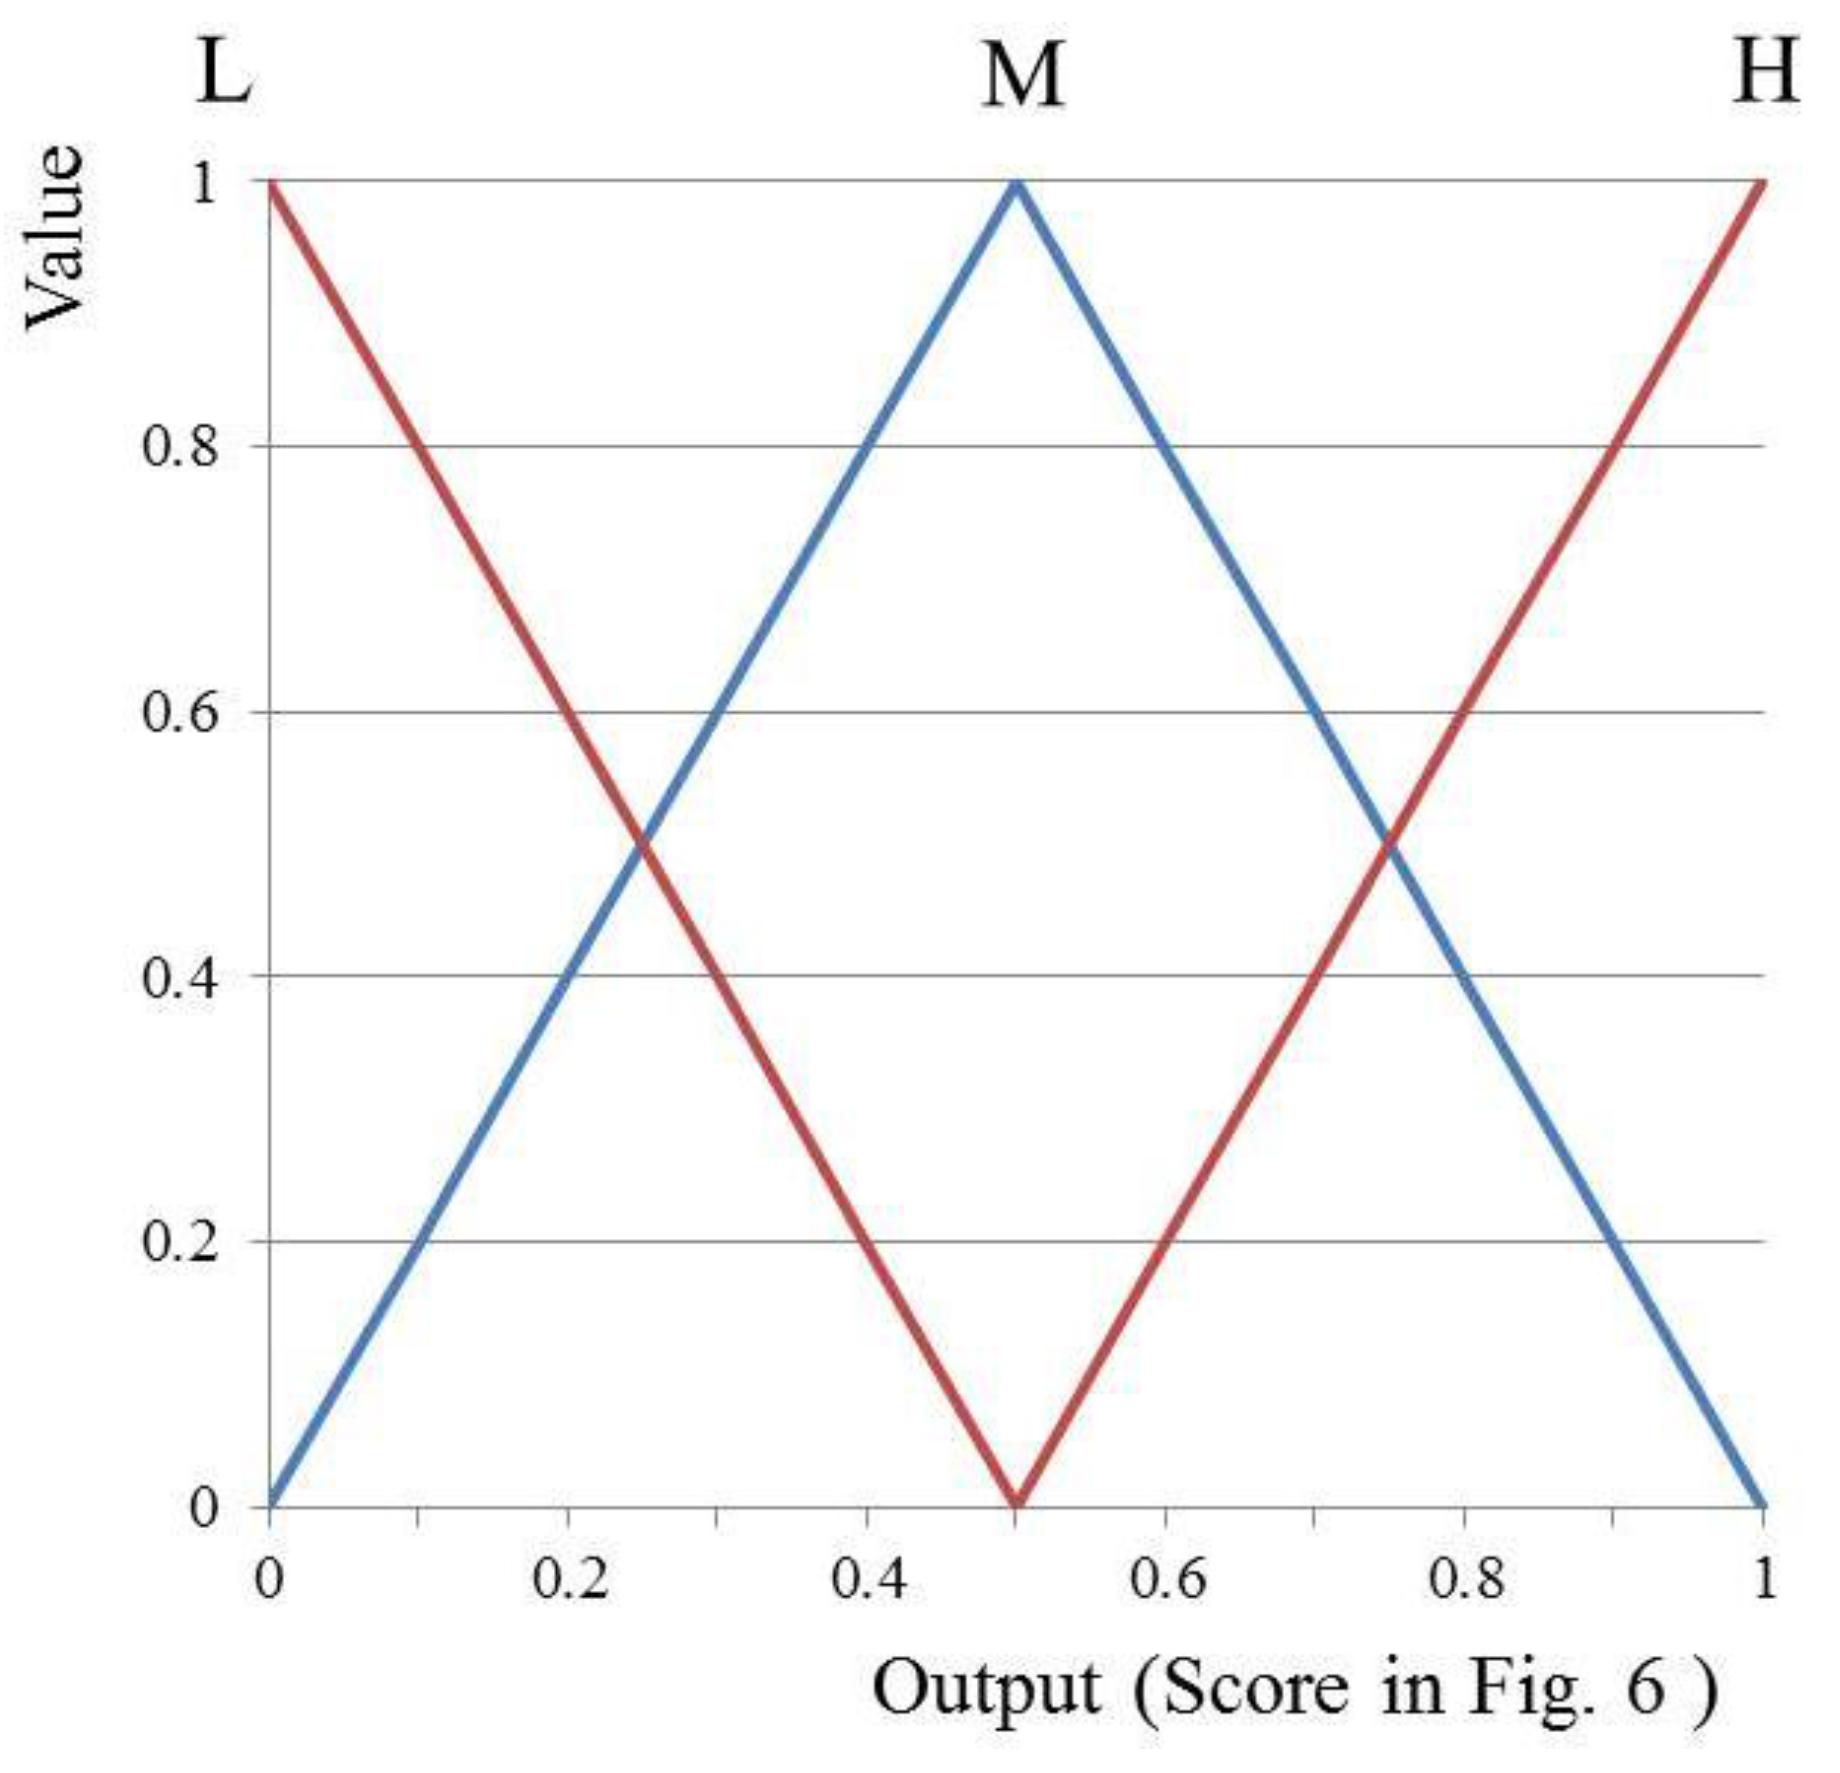
In the third experiment, in order to show the accuracy changes of face recognition according to the membership function, the accuracy of symmetric input and output membership functions (SIMF and SOMF (
Figure 7 and
Figure 8)) is compared with asymmetric ones (
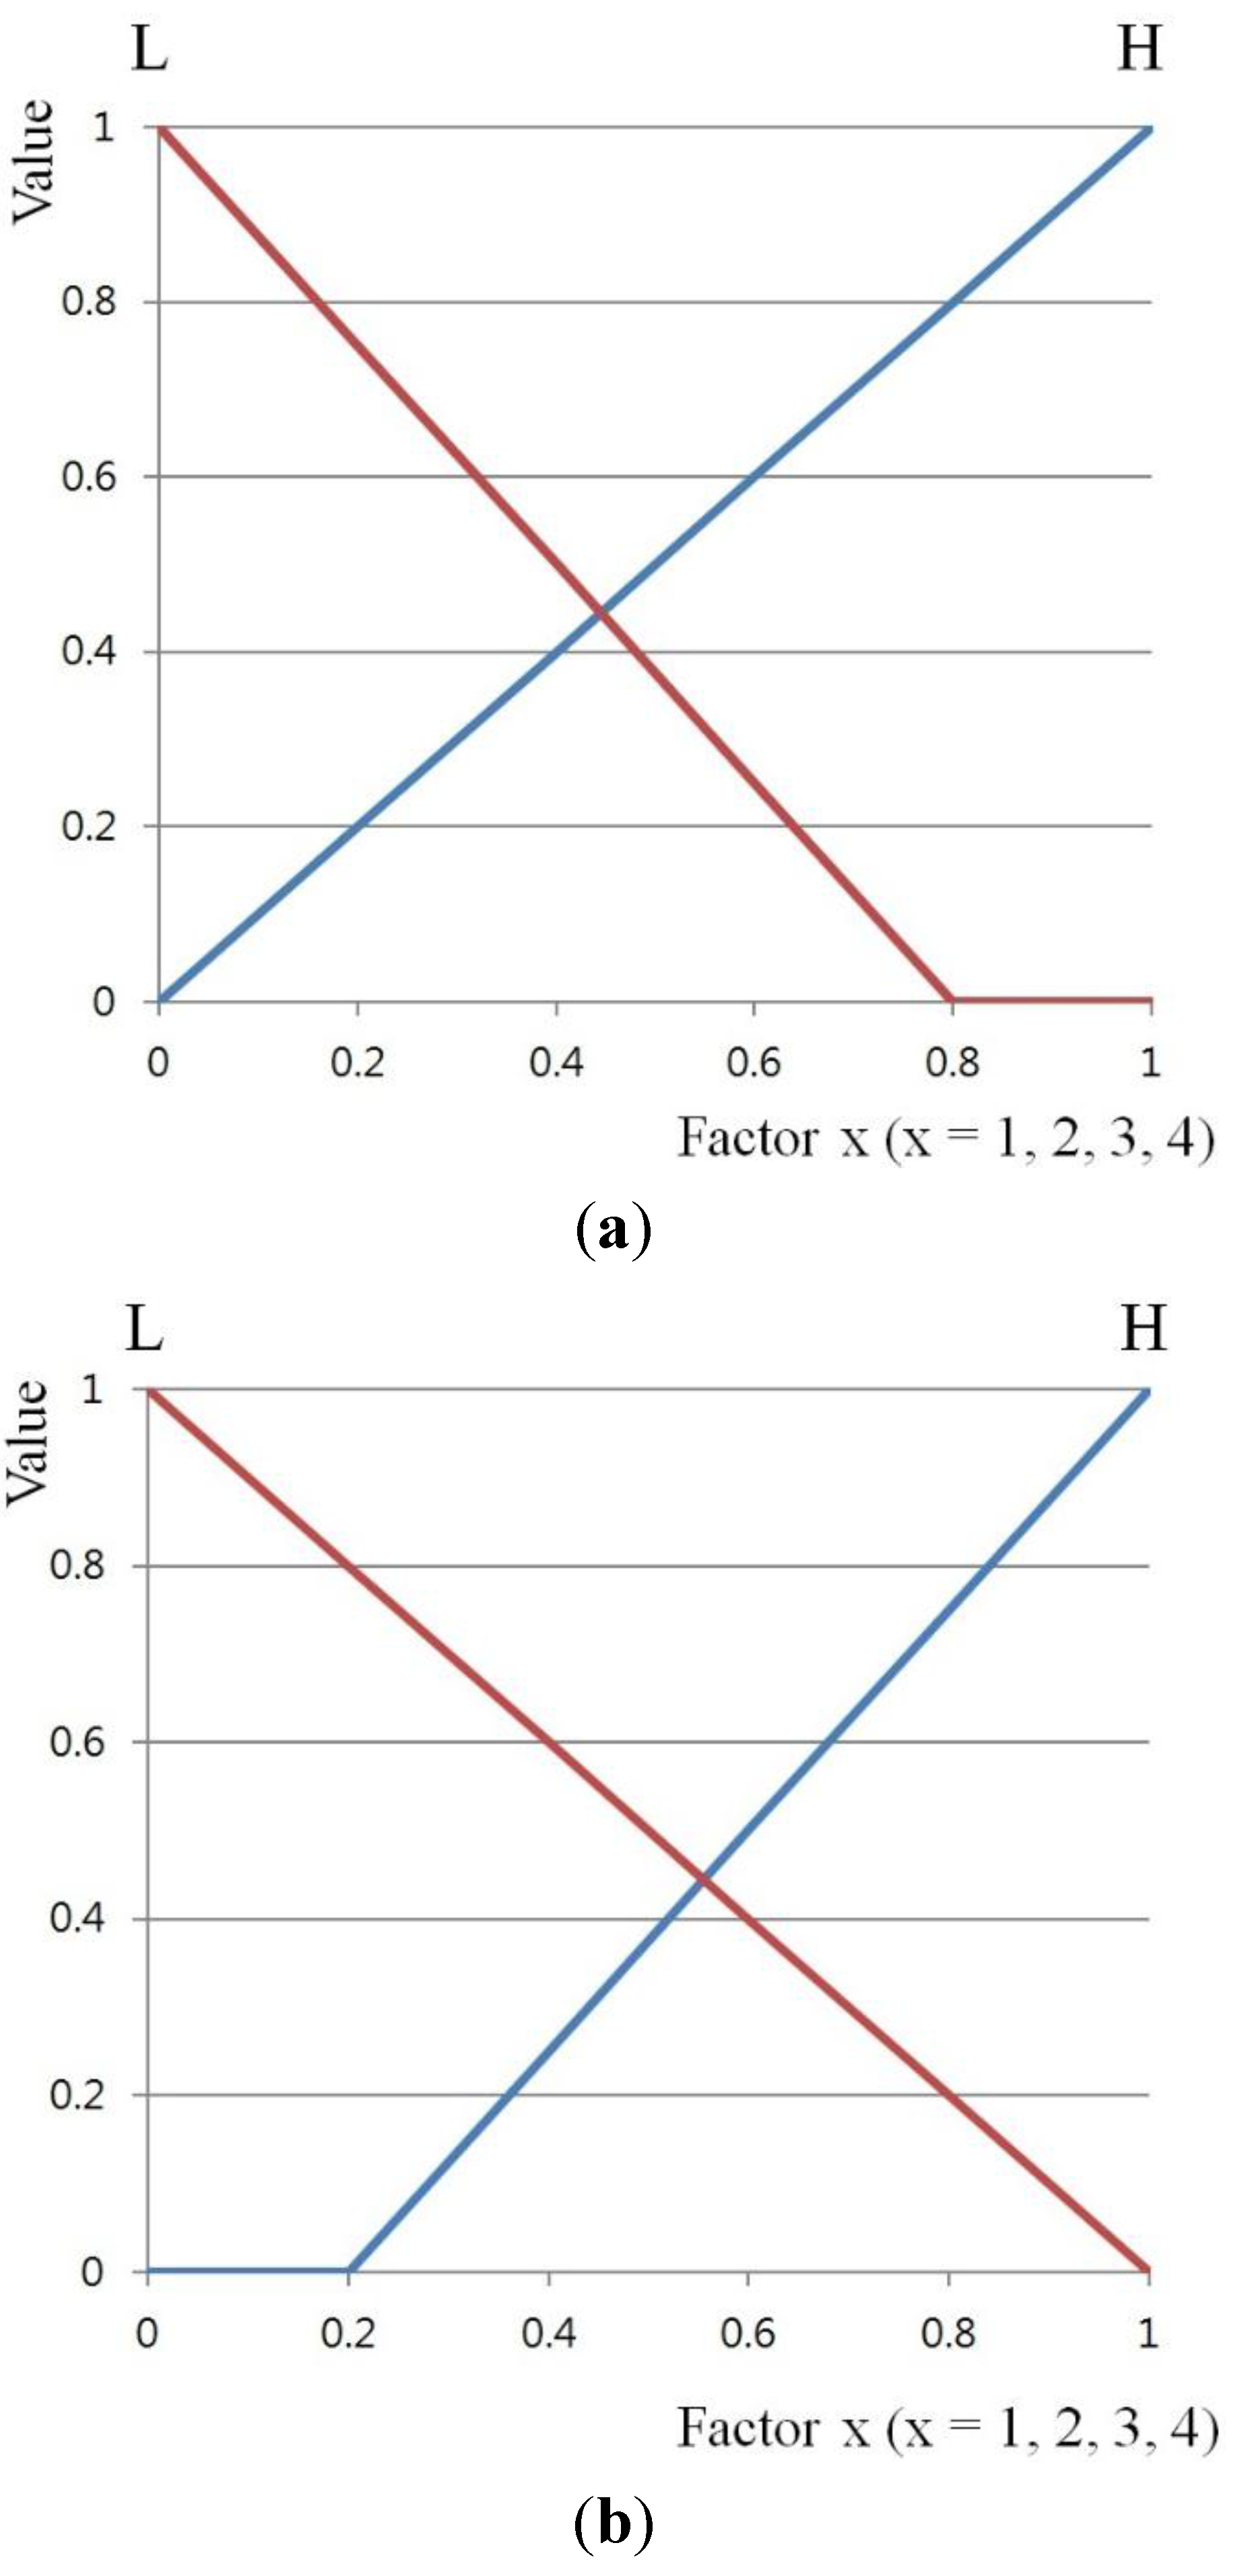
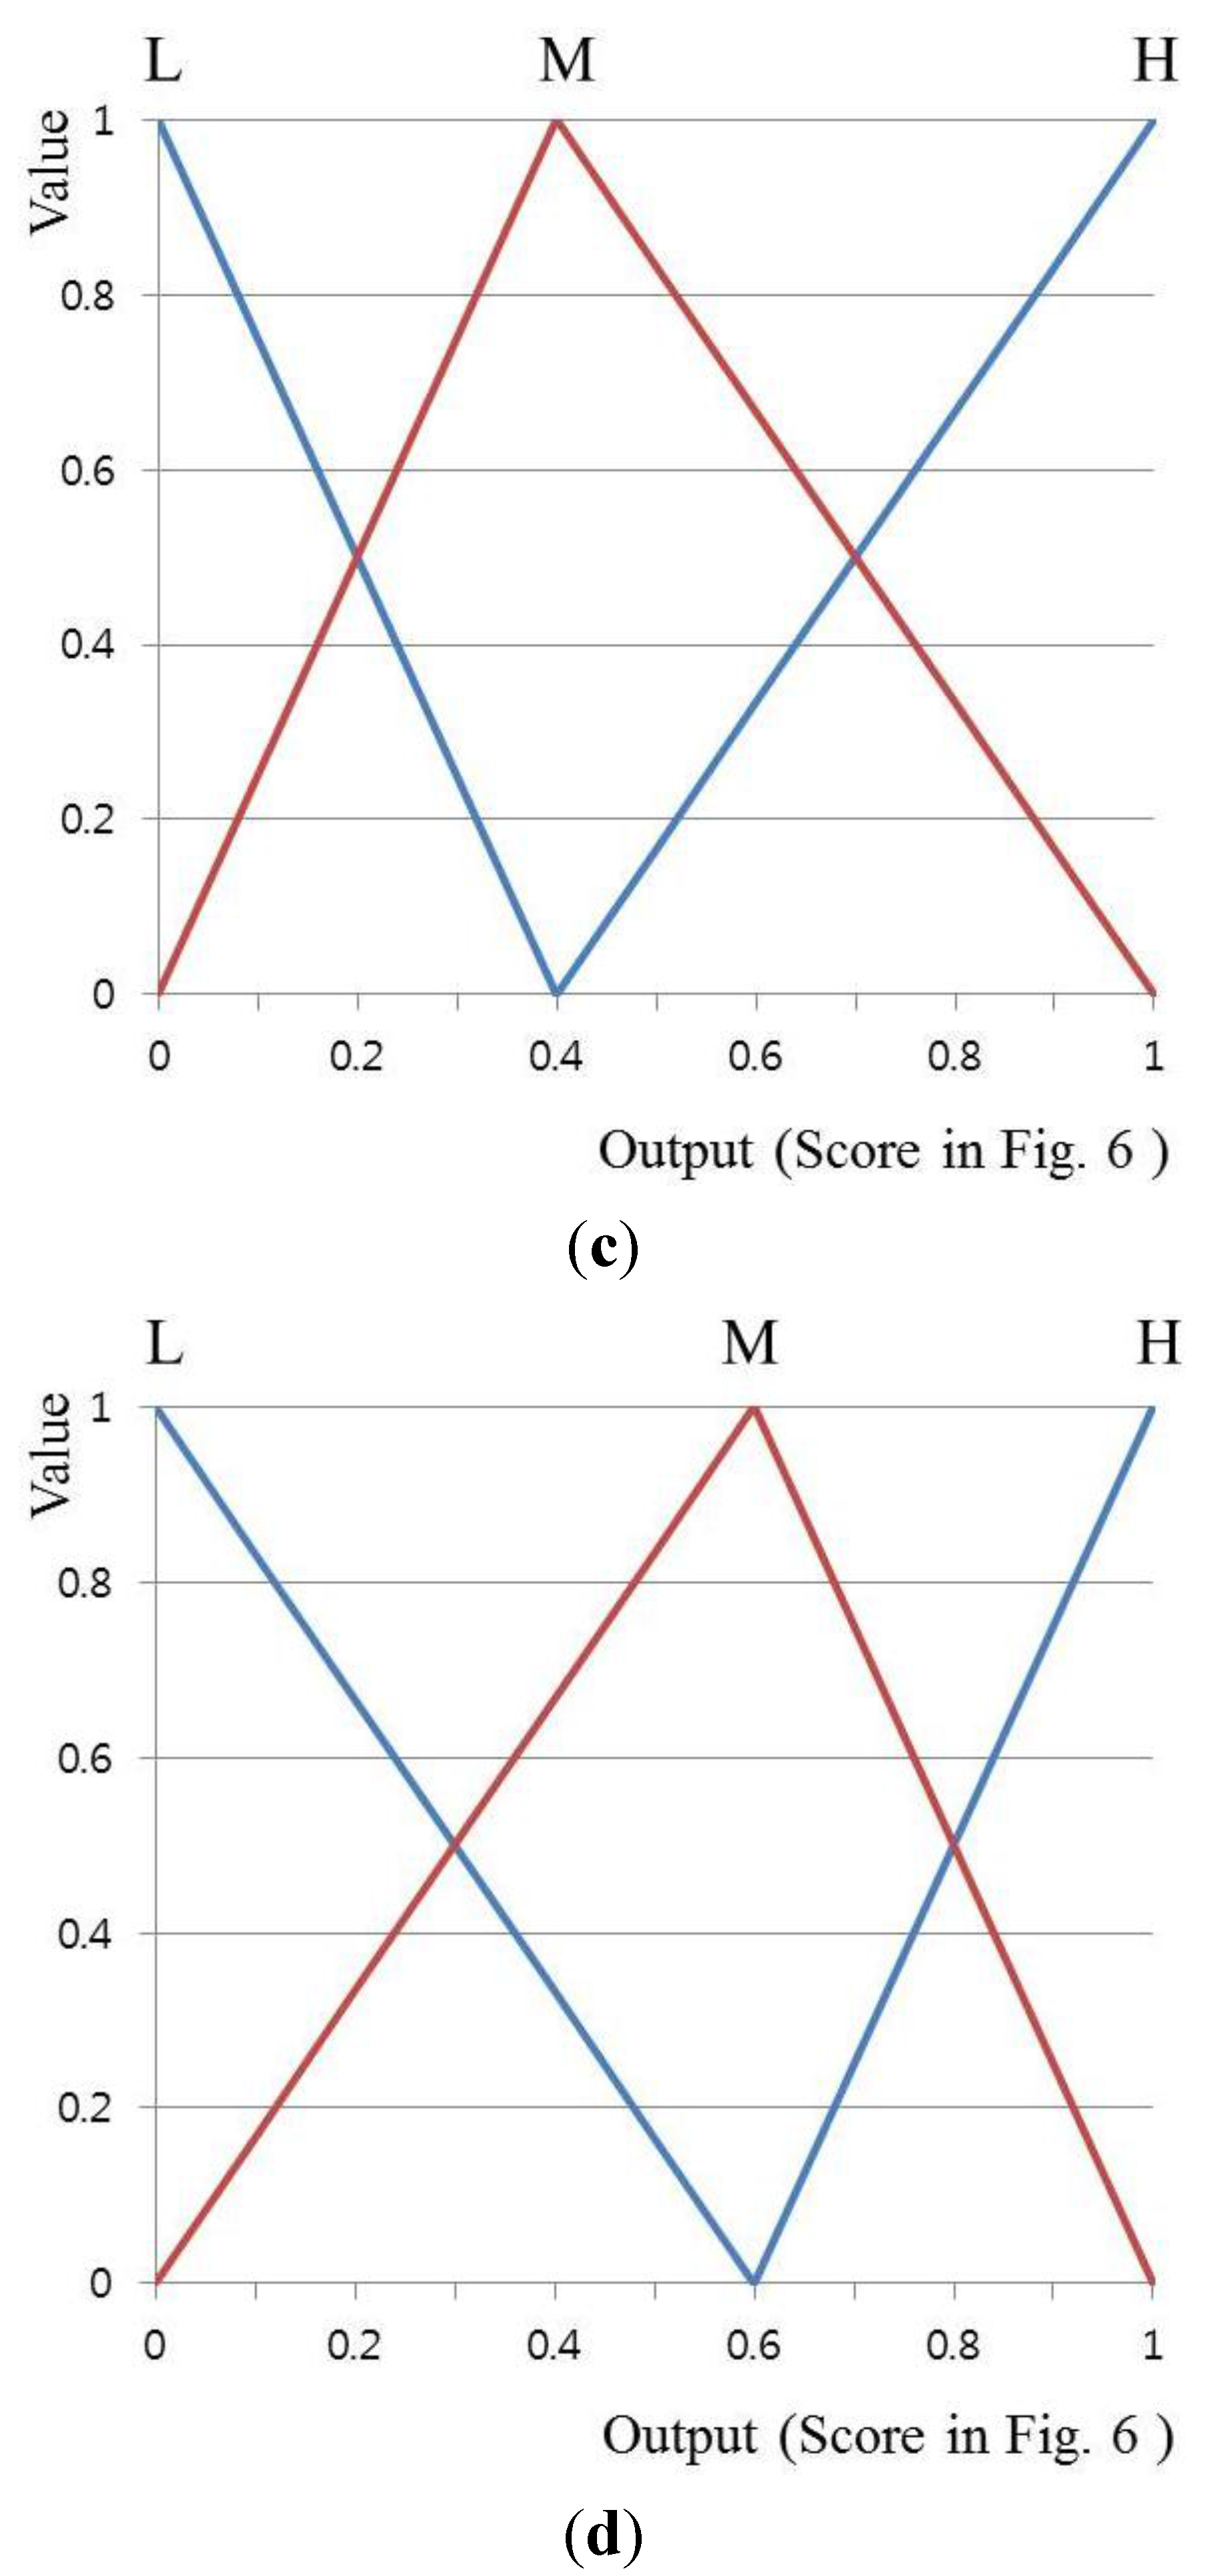
Figure 15). Here, asymmetric input membership functions (AsIMF 1 and 2) are defined based on each cutoff point at input value, respectively, as shown in
Figure 15a,b. Similarly, asymmetric output membership functions (AsOMF 1 and 2) are defined based on each cutoff point at output value, respectively, as shown in
Figure 15c,d.
Table 4.
Comparison of the accuracies of the proposed method according to the number of quality measures (QMs) (unit: %).
Table 4.
Comparison of the accuracies of the proposed method according to the number of quality measures (QMs) (unit: %).
| Method | Number of QMs |
|---|
| 2 | 3 | 4 |
|---|
| Fuzzy MIN rule | FOM | 92.14 | 92.22 | 92.44 |
| LOM | 92.05 | 92.17 | 92.23 |
| MOM | 91.95 | 92.10 | 92.45 |
| MeOM | 92.10 | 92.25 | 92.82 |
| COG | 92.58 | 92.84 | 92.94 |
| Fuzzy MAX rule | FOM | 91.40 | 92.02 | 92.16 |
| LOM | 92.14 | 92.35 | 92.46 |
| MOM | 92.20 | 92.63 | 92.42 |
| MeOM | 92.31 | 92.74 | 92.72 |
| COG | 92.16 | 92.86 | 92.86 |
Figure 15.
Asymmetrical triangular membership functions: (a) asymmetric input membership function (AsIMF) 1; (b) AsIMF 2; (c) AsOMF 1; (d) AsOMF 2.
Figure 15.
Asymmetrical triangular membership functions: (a) asymmetric input membership function (AsIMF) 1; (b) AsIMF 2; (c) AsOMF 1; (d) AsOMF 2.
Table 5 shows the accuracies of face recognition according to the membership function and defuzzification method. It is observed that the accuracy of symmetric membership functions is slightly higher but very similar to that of the others (based on asymmetric membership function). On the basis of these results, it can be shown that the symmetric triangular shape for the membership function is more considerable than others in terms of not only accuracy but also implementation (explained in
Section 2.4).
In the next experiment, as shown in
Table 6, we measured the accuracies of face recognition according to the number of face images in a video sequence in terms of GAR. In
Table 6, fusion means our method, and therefore, the
FMS of Equation (9) is used for calculating GAR. It is observed that the accuracy of face recognition improves with an increase in the number of face images.
Table 5.
Comparison of the accuracies of the proposed method according to the shape of the membership function (unit: %).
Table 5.
Comparison of the accuracies of the proposed method according to the shape of the membership function (unit: %).
| Method | Membership Function |
|---|
| SIMF and SOMF (Figure 7 and Figure 8) | AsIMF 1 and SOMF (Figure 15a and Figure 8) | AsIMF 2 and SOMF (Figure 15b and Figure 8) | SIMF and AsOMF 1 (Figure 7 and Figure 15c) | SIMF and AsOMF 2 (Figure 7 and Figure 15d) |
|---|
| Fuzzy MIN rule | FOM | 92.44 | 92.55 | 92.31 | 92.27 | 92.44 |
| LOM | 92.23 | 92.53 | 92.56 | 92.56 | 92.74 |
| MOM | 92.45 | 92.39 | 92.23 | 92.42 | 92.59 |
| MeOM | 92.82 | 92.47 | 92.44 | 92.49 | 92.67 |
| COG | 92.94 | 92.71 | 92.51 | 92.60 | 92.88 |
| Fuzzy MAX rule | FOM | 92.16 | 92.07 | 92.33 | 92.17 | 92.37 |
| LOM | 92.46 | 92.68 | 92.44 | 92.59 | 92.87 |
| MOM | 92.42 | 92.65 | 92.56 | 92.44 | 92.71 |
| MeOM | 92.72 | 92.58 | 92.47 | 92.59 | 92.60 |
| COG | 92.86 | 92.75 | 92.45 | 92.45 | 92.84 |
Table 6.
Comparison of the accuracies of the proposed method according to the number of face images in a video sequence (unit: %).
Table 6.
Comparison of the accuracies of the proposed method according to the number of face images in a video sequence (unit: %).
| Number of Selected m Images | Number (n) of Face Images in a Video Sequence |
|---|
| 10 | 15 | 20 | 25 |
|---|
| Fusion | 2 | 92.42 | 93.12 | 93.63 | 93.92 |
| 3 | 92.73 | 93.59 | 93.89 | 94.33 |
| 4 | 92.89 | 93.57 | 94.06 | 94.59 |
| 5 | 92.94 | 93.72 | 94.18 | 94.71 |
In addition, the accuracy of the proposed method was compared with a fixed quality measure-based approach [
21]. Using the results from
Figure 14, we selected four influencing QMs (head pose, illumination, sharpness, and openness of eyes) for a fixed quality measure-based approach. In this experiment,
and
are set to 25 and 5, respectively. As described in
Section 2.4, since the fixed quality measure-based approach cannot assess other quality measures that affect the accuracy of face recognition, its accuracy is lower than that of the proposed method. Furthermore, we compared the accuracy of a previous method that uses all images in a video sequence [
40], and the accuracy of fixed quality measure-based approach [
21] to the accuracy of our method, the results of which are shown in
Table 7. Experimental results showed that the proposed method has a higher face recognition accuracy than the other methods.
Table 7.
Comparison of the accuracy of the proposed method with that of the other methods (unit: %).
Table 7.
Comparison of the accuracy of the proposed method with that of the other methods (unit: %).
| Method | Using all Images in a Video Sequence [46] | Fixed Quality Measures-Based Approach [21] | Adaptive Quality Measure-Based Approach (Proposed Method) |
|---|
| Accuracy | 89.74 | 93.09 | 94.71 |
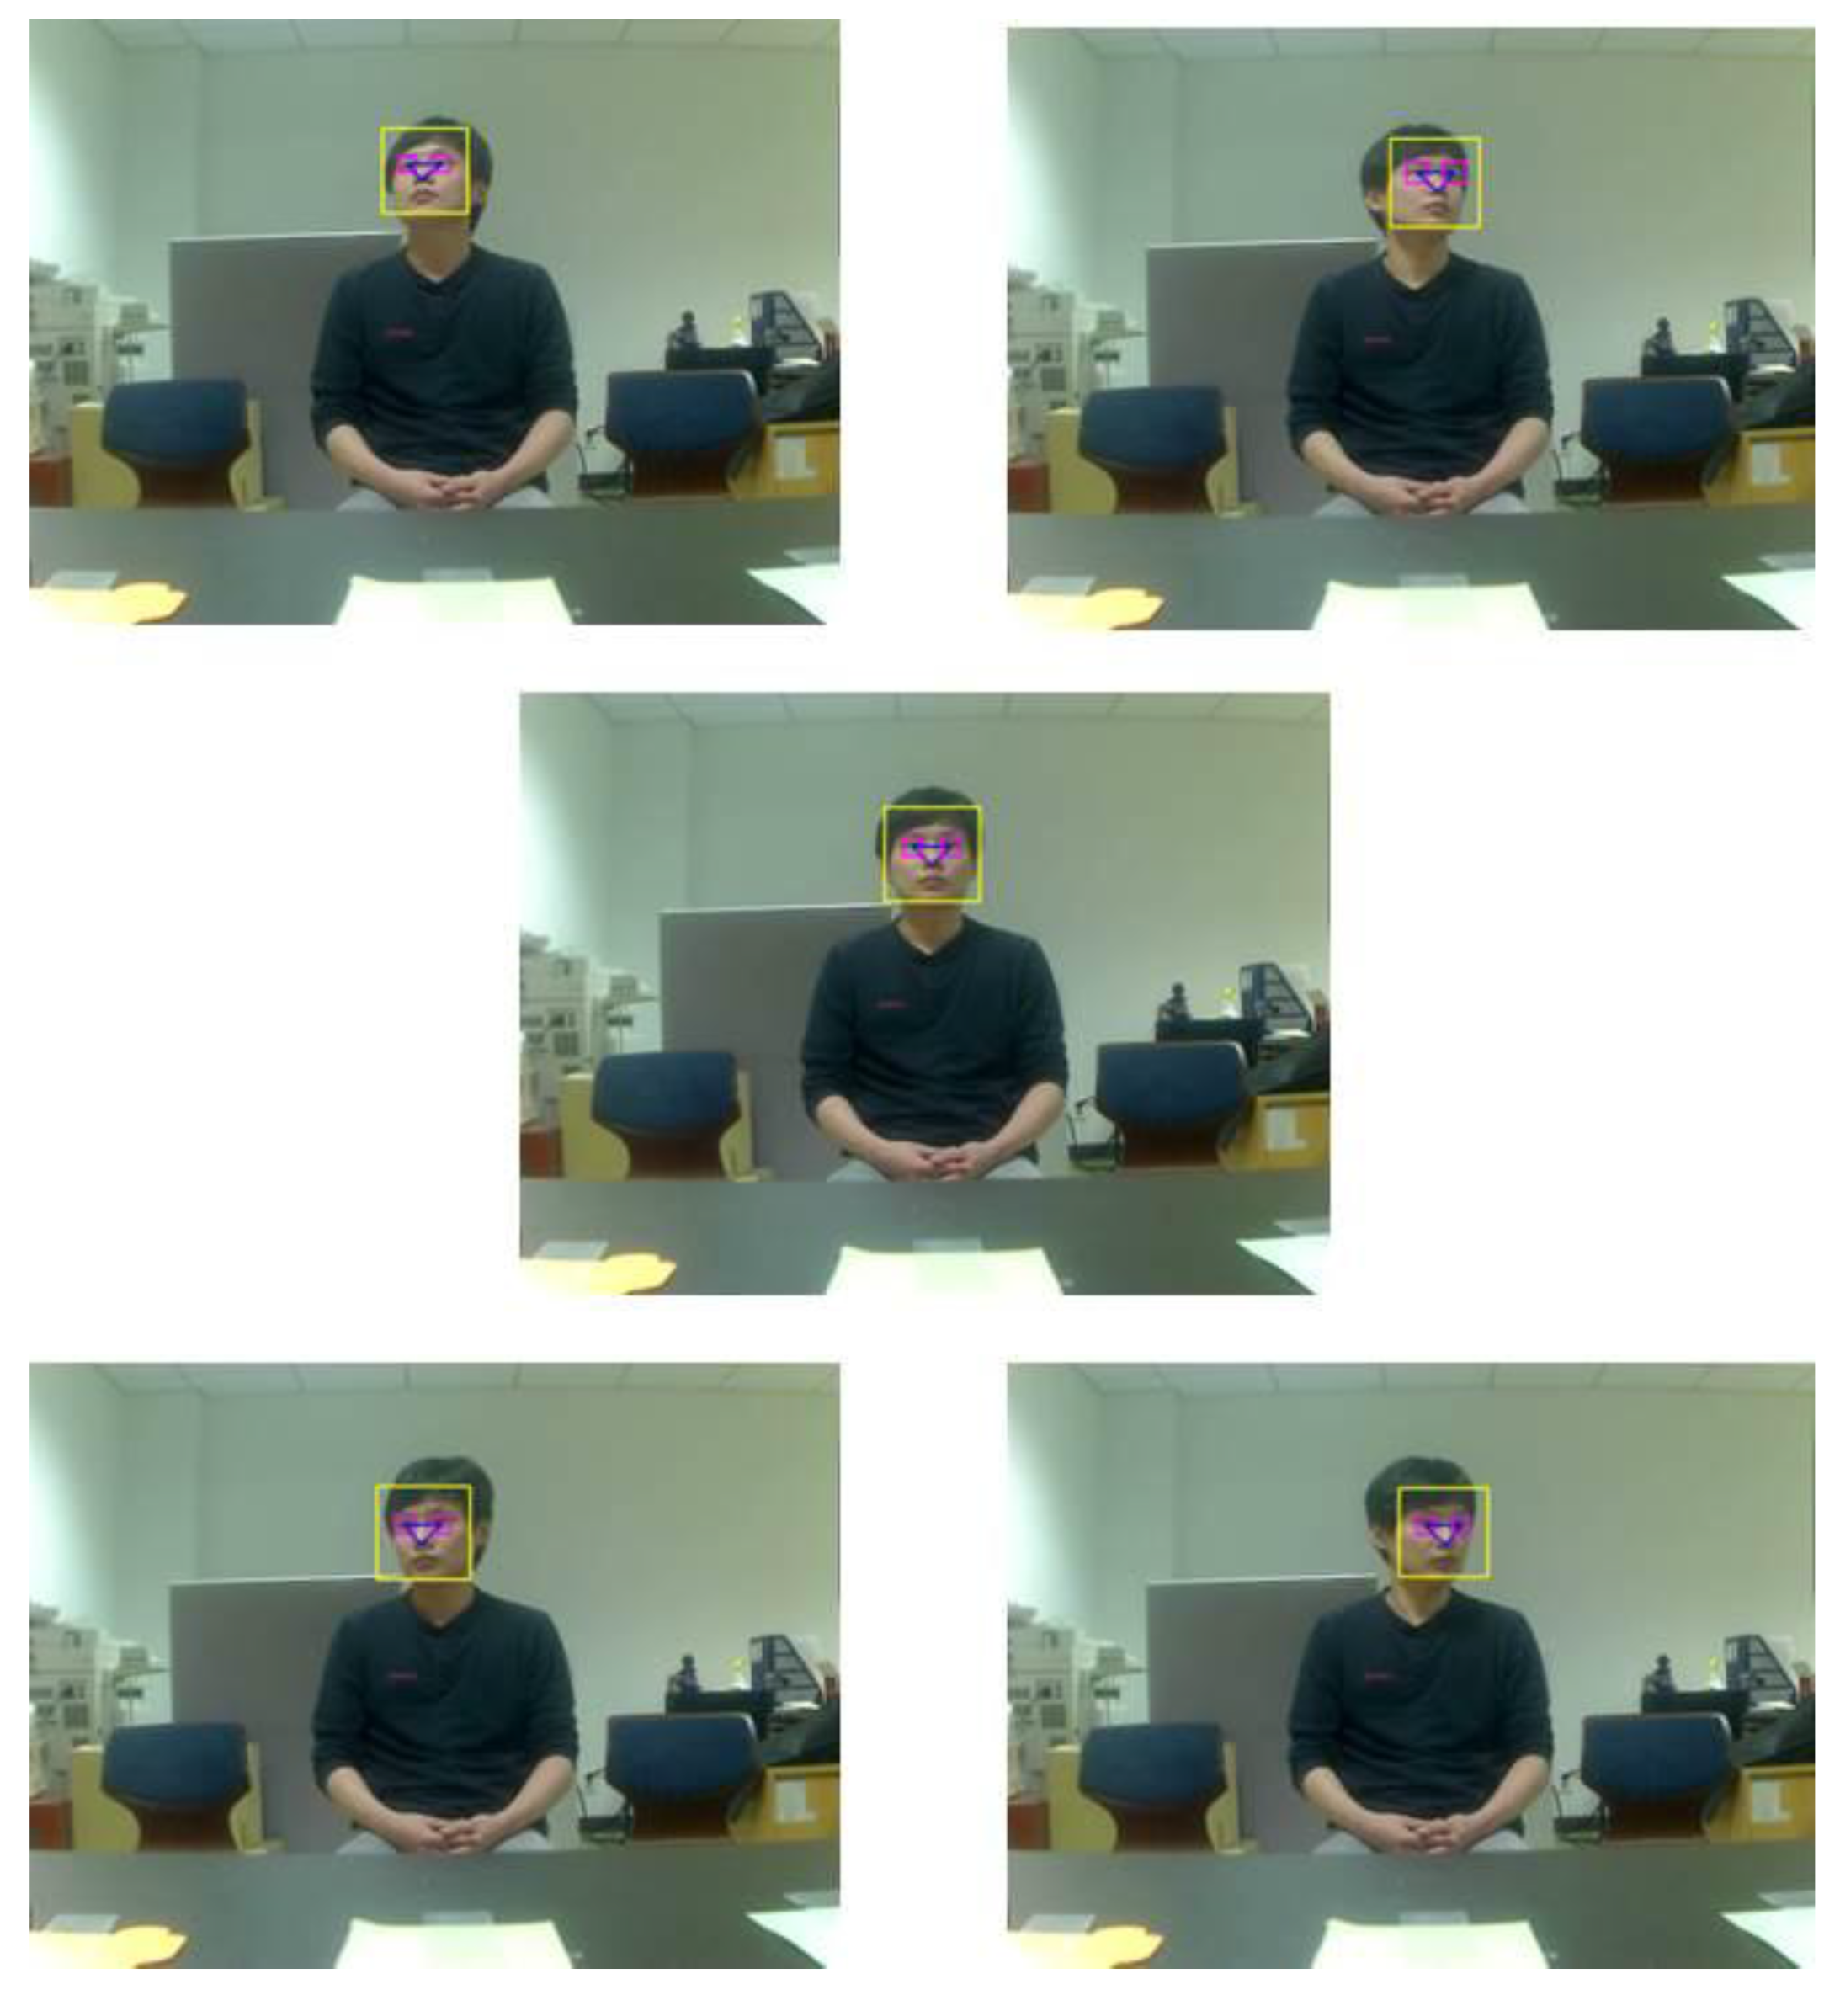
In
Figure 16 and
Figure 17, we show the face images of correctly recognized results. As shown in
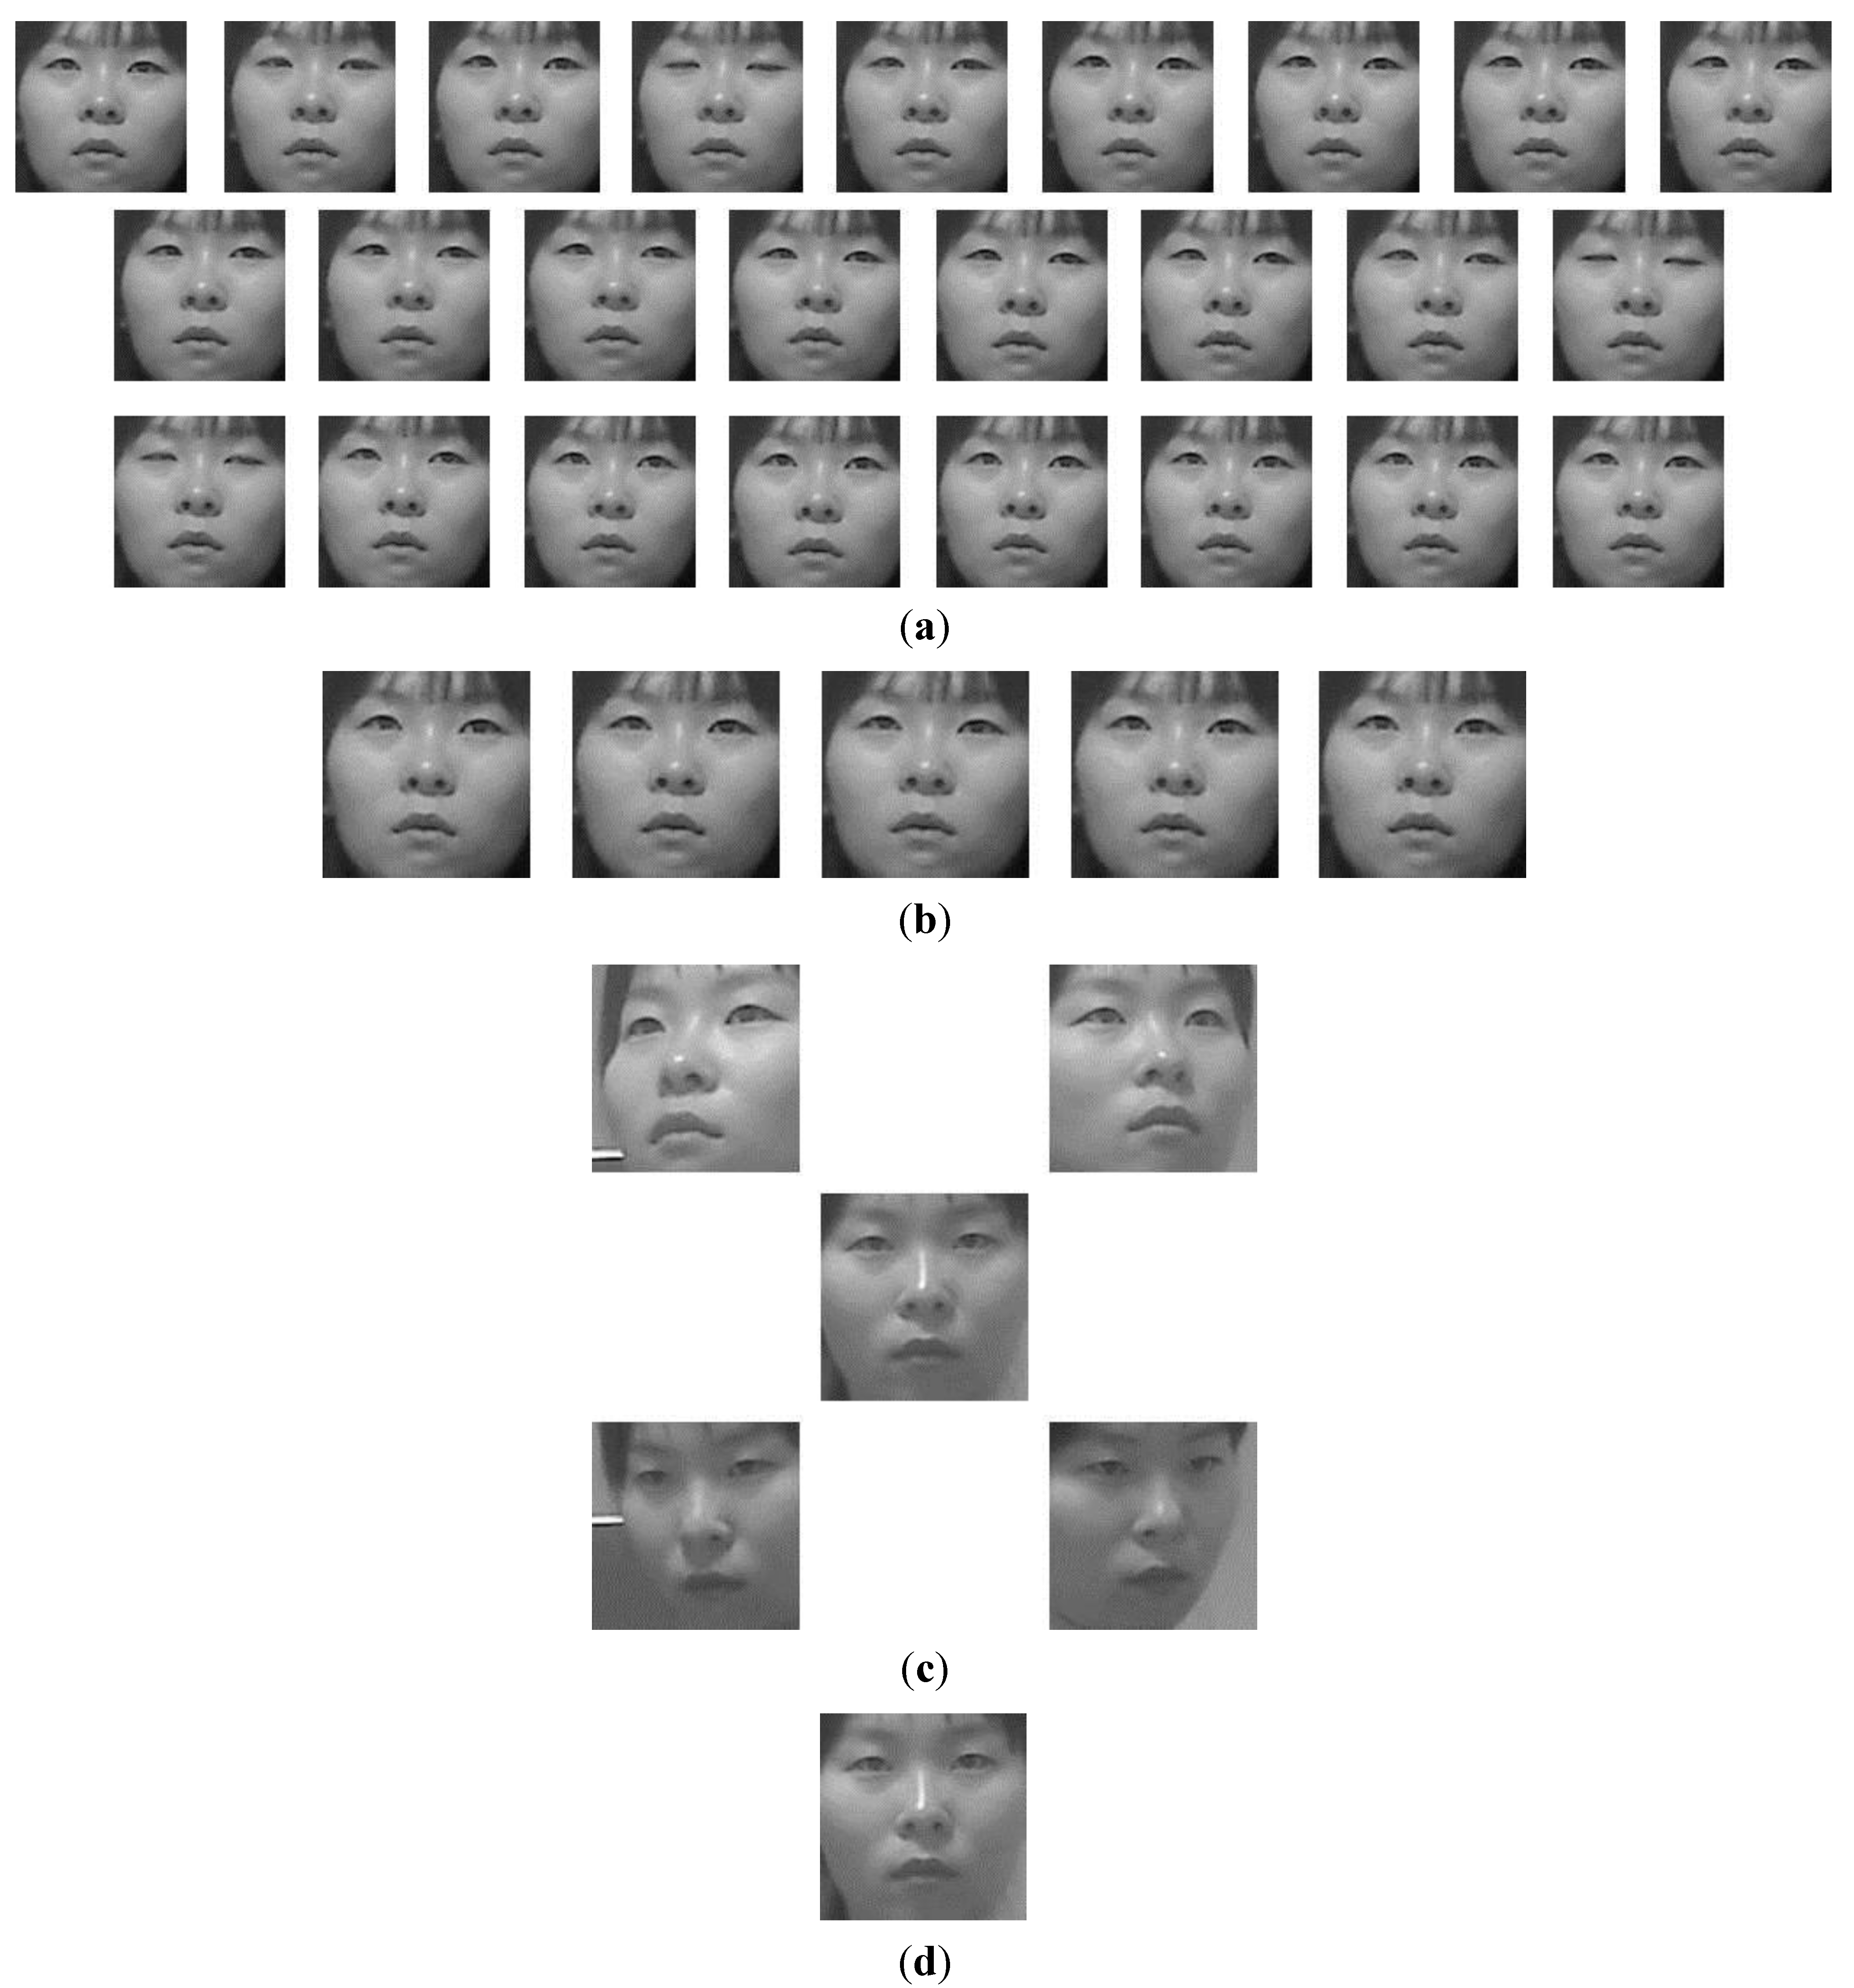
Figure 16a,b, although there exist the images where hand occludes a part of face, face area is not correctly detected, or eyes are closed, our method can exclude these bad-quality images. On the basis of these results, we can confirm that good-quality images are correctly selected by our method and that they are correctly matched with the enrolled face image of the same person.
Figure 16.
Example of correctly recognized results: (a) a sequences of 25 images; (b) selected five images; (c) enrolled face images (gazing at five positions of TV); (d) correctly matched face image among face images of enrolled persons.
Figure 16.
Example of correctly recognized results: (a) a sequences of 25 images; (b) selected five images; (c) enrolled face images (gazing at five positions of TV); (d) correctly matched face image among face images of enrolled persons.
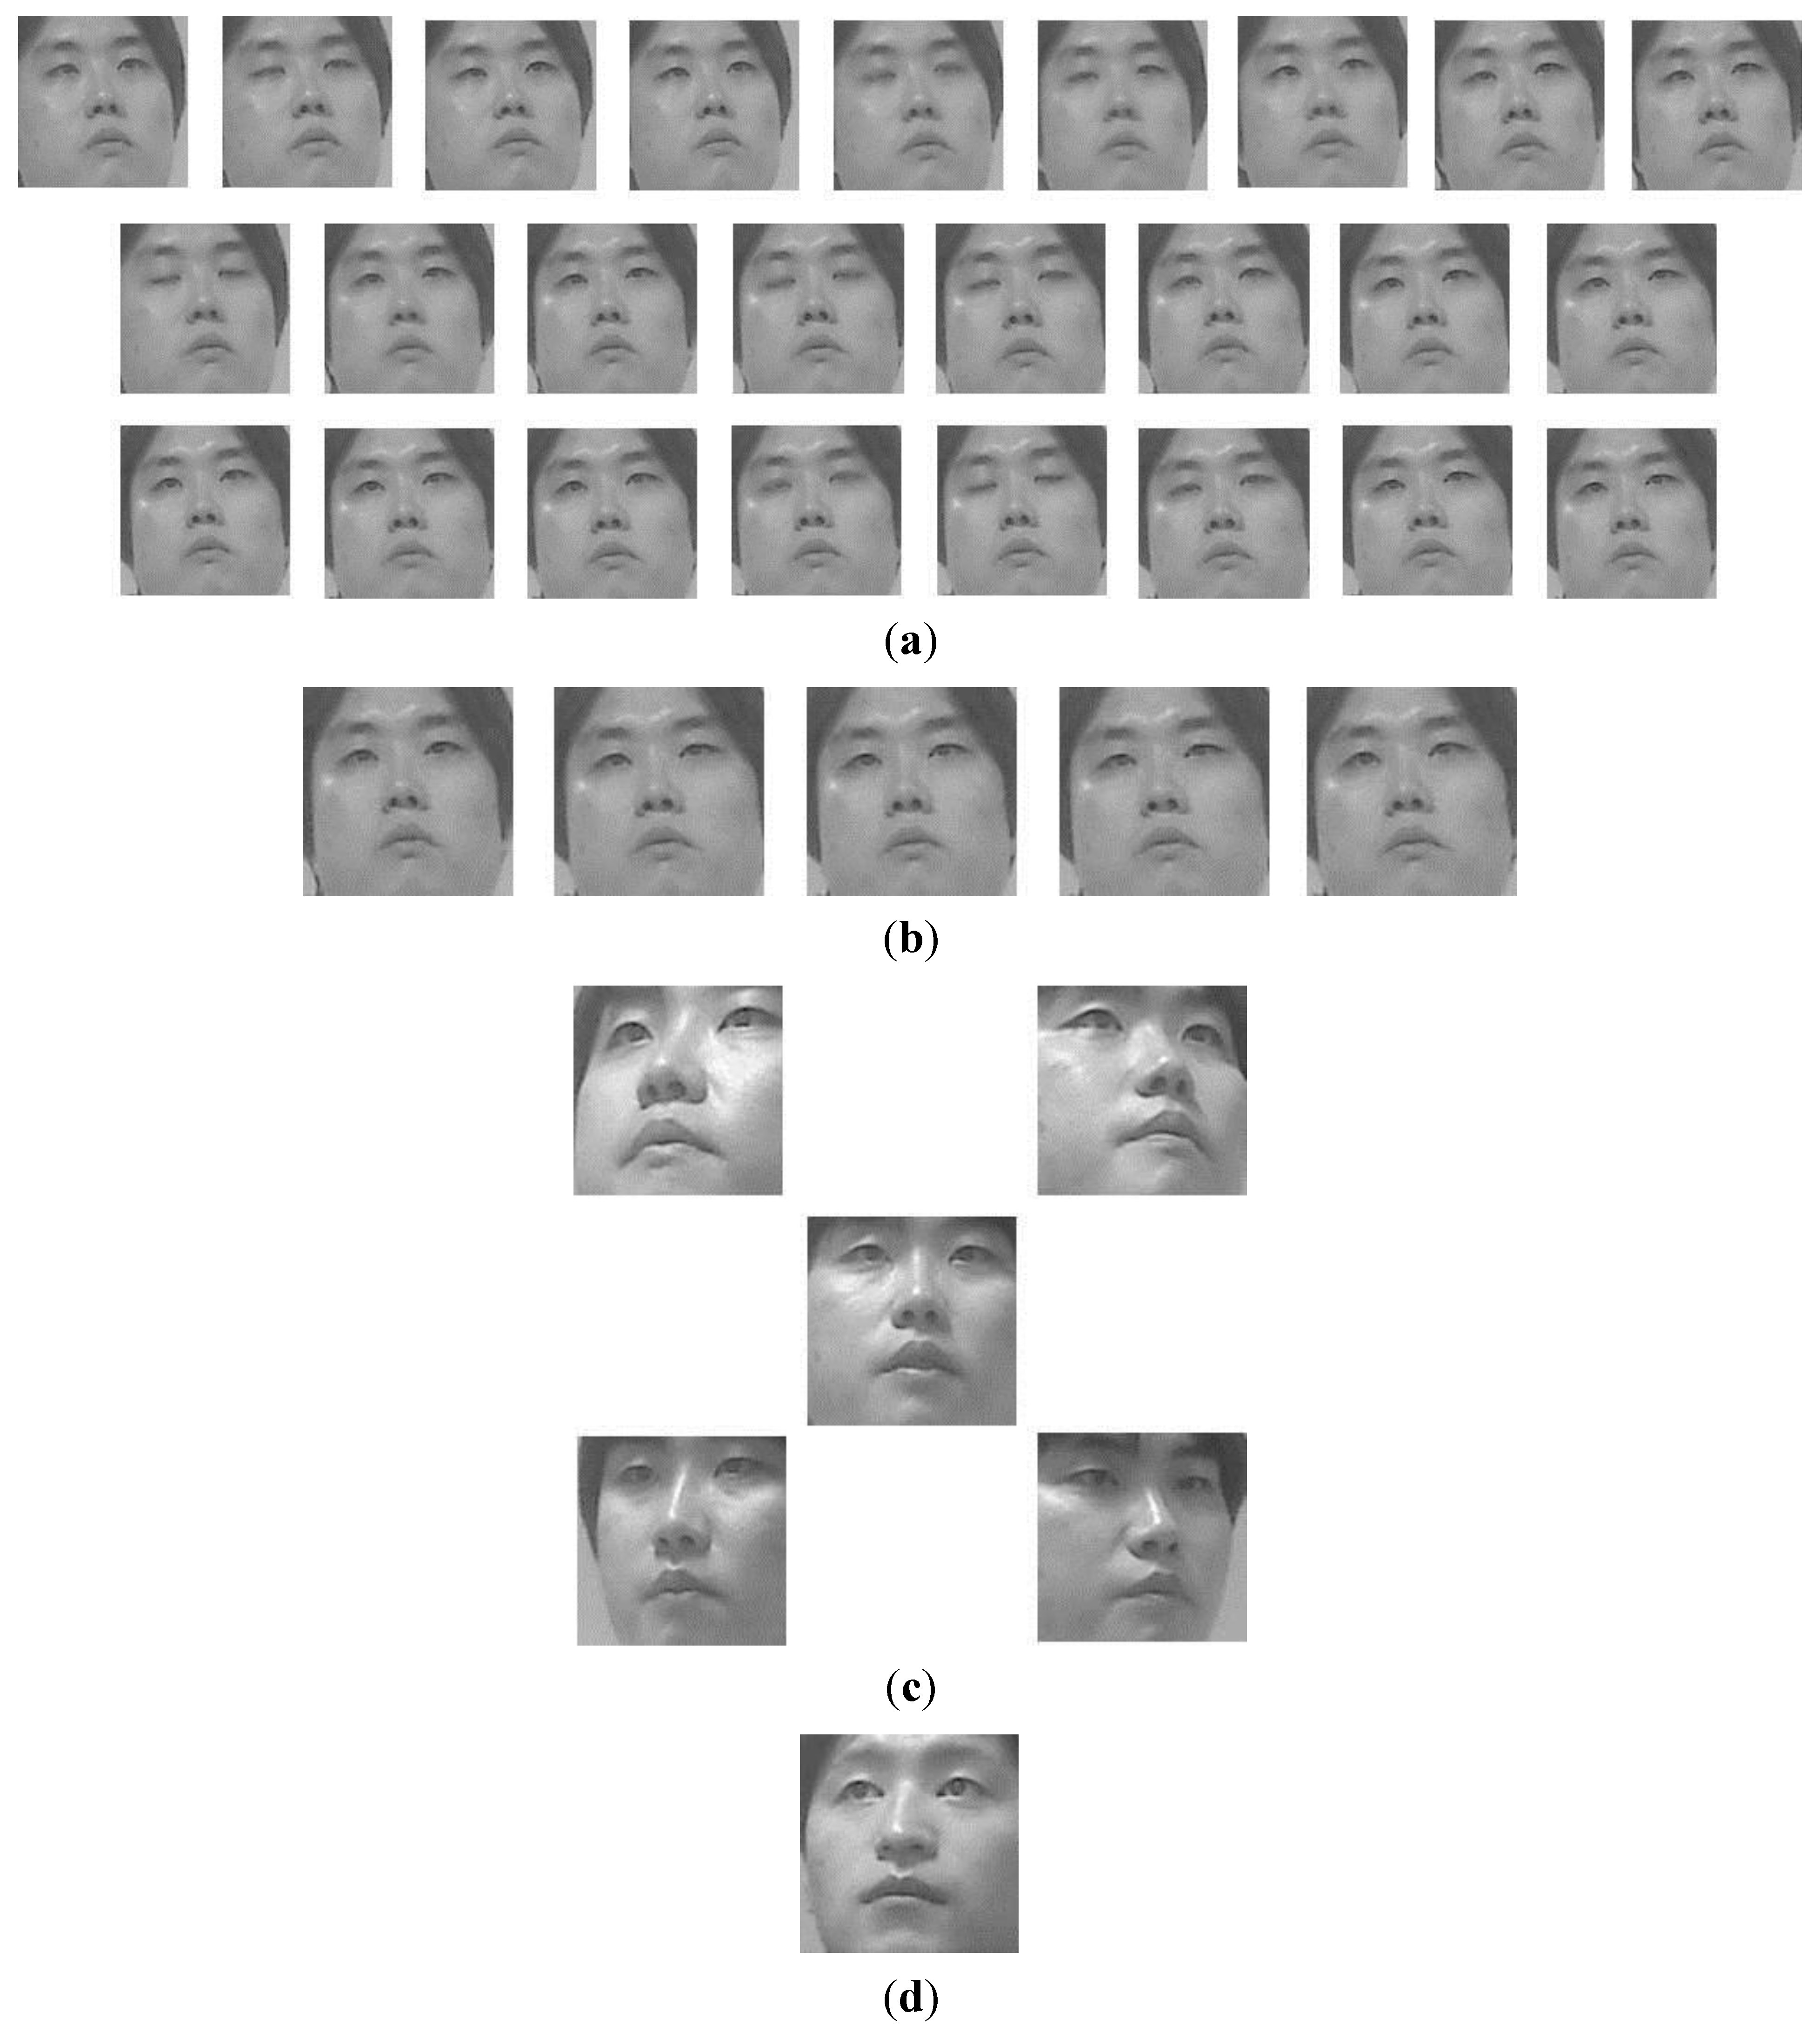
Figure 17.
Example of correctly recognized results: (a) a sequences of 25 images; (b) selected five images; (c) enrolled face images (gazing at five positions of TV); (d) correctly matched face image among face images of enrolled persons.
Figure 17.
Example of correctly recognized results: (a) a sequences of 25 images; (b) selected five images; (c) enrolled face images (gazing at five positions of TV); (d) correctly matched face image among face images of enrolled persons.
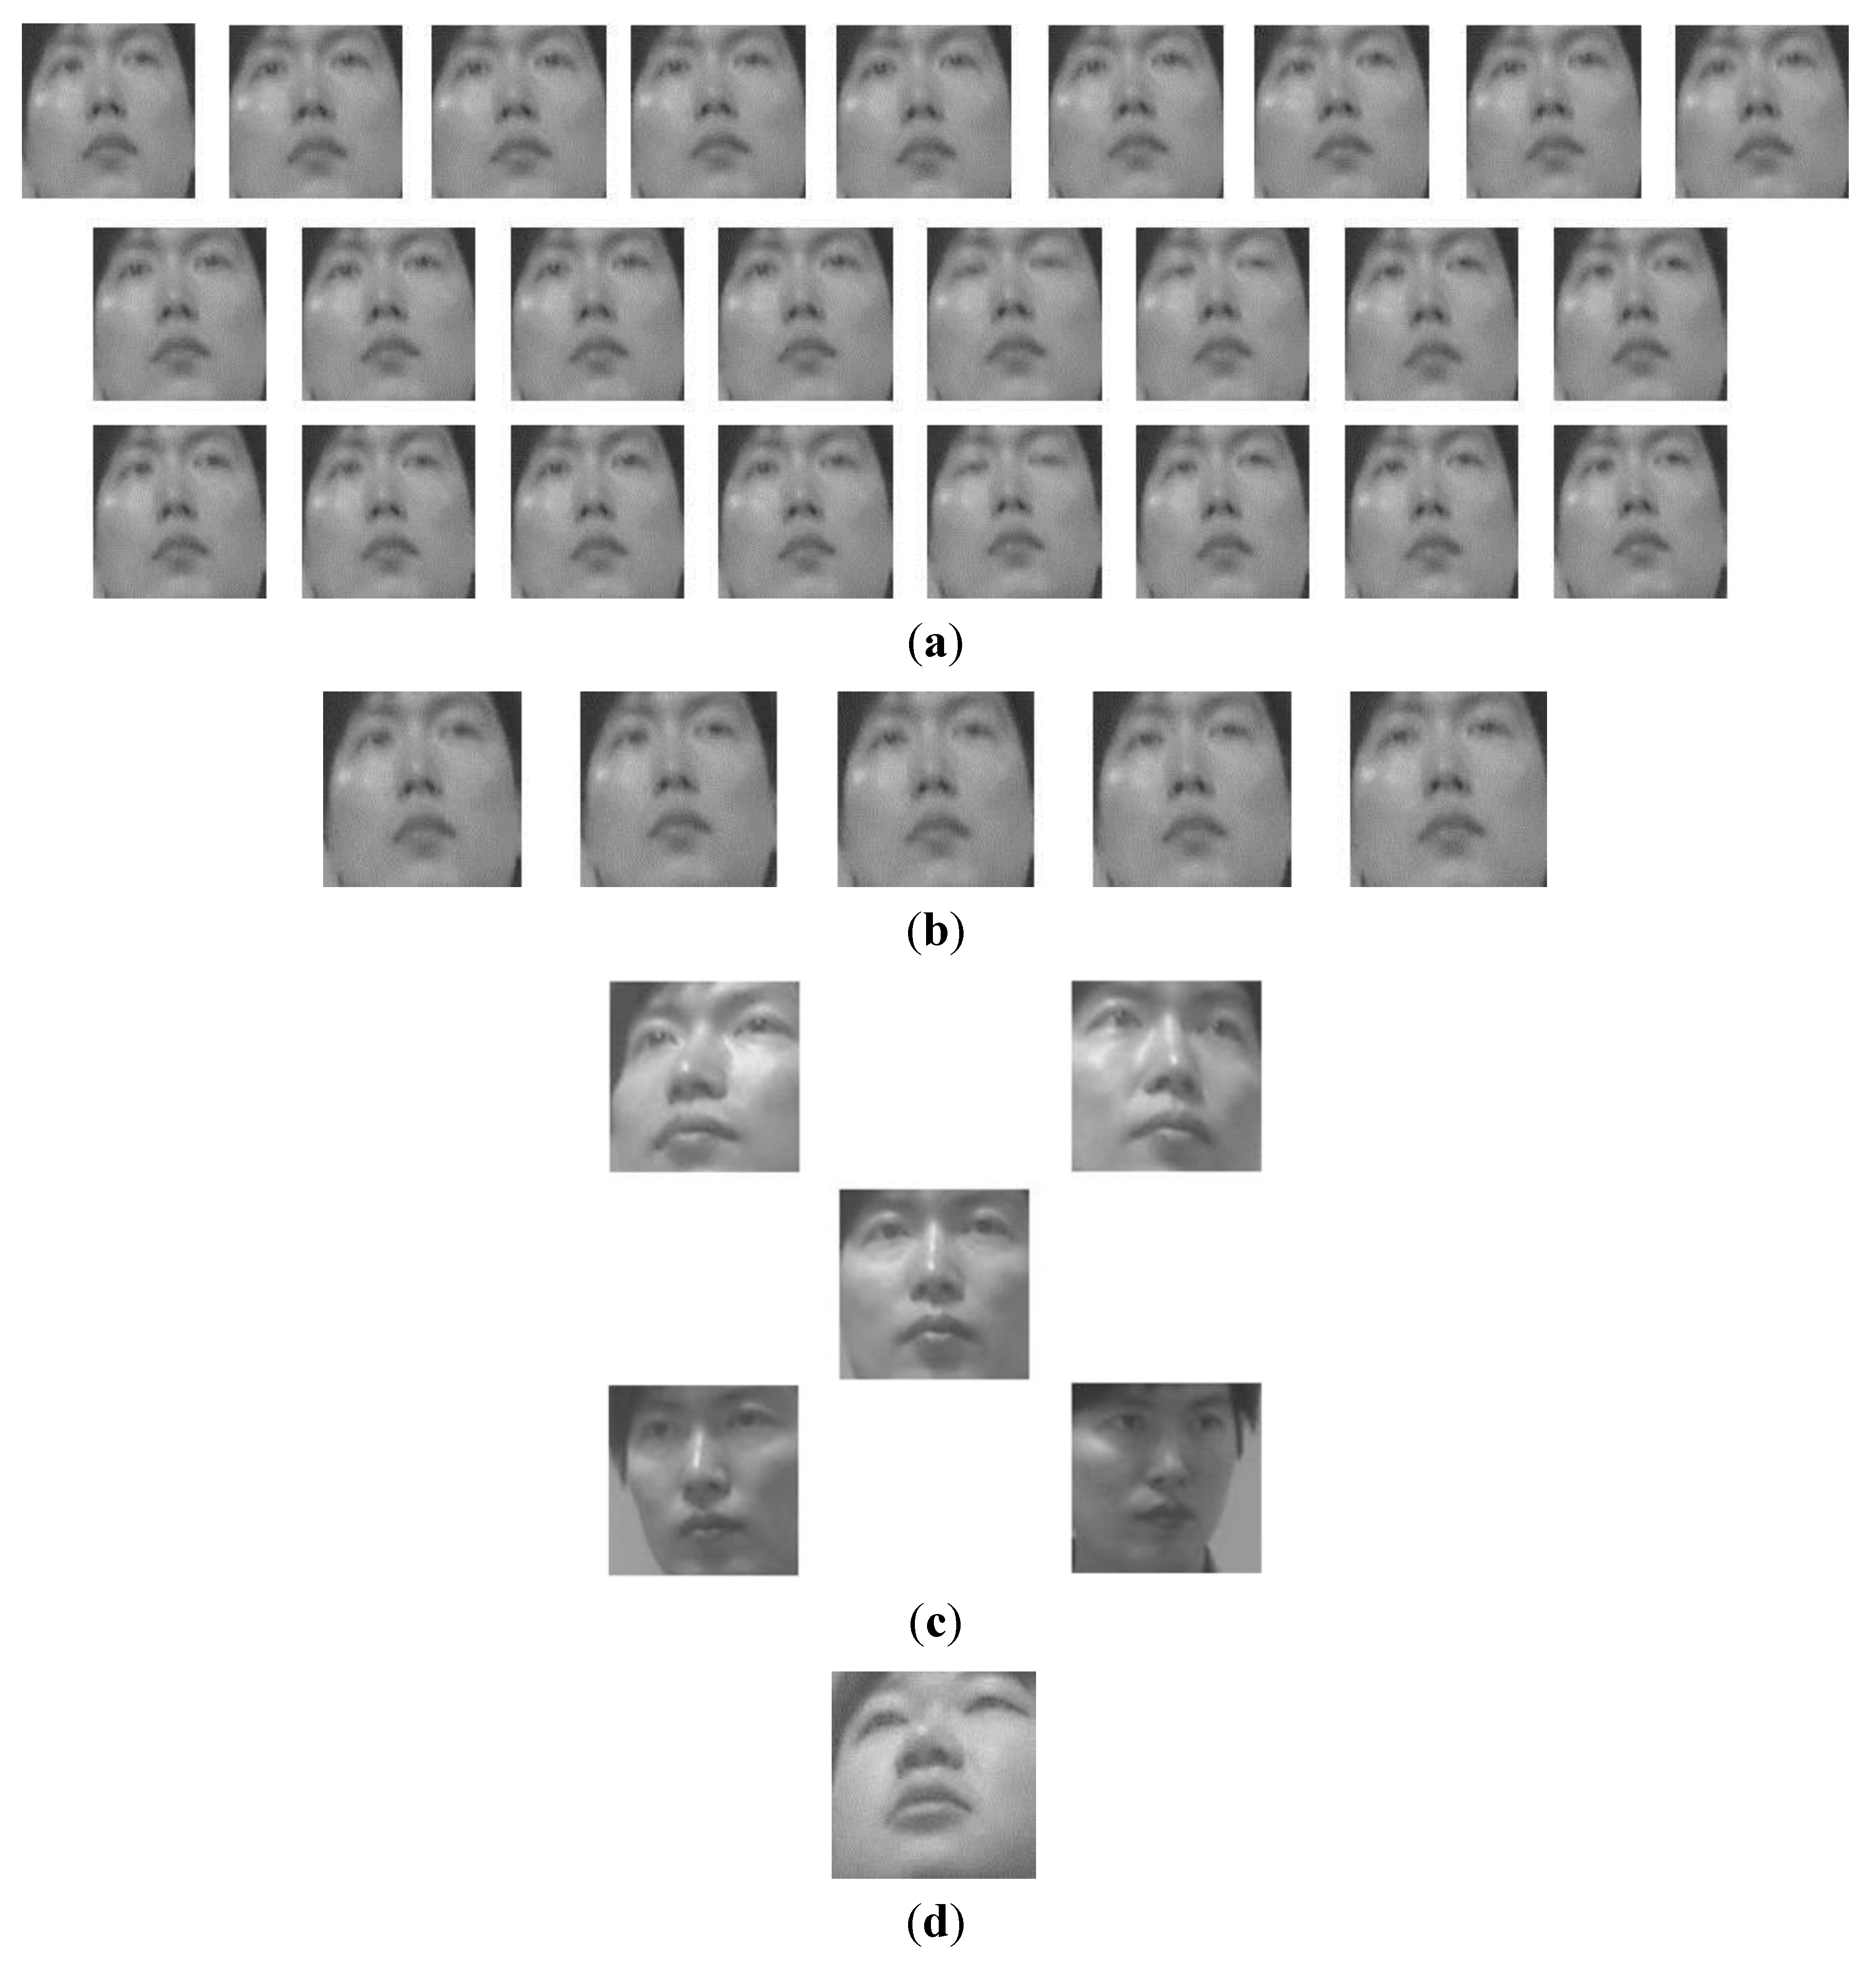
In
Figure 18 and
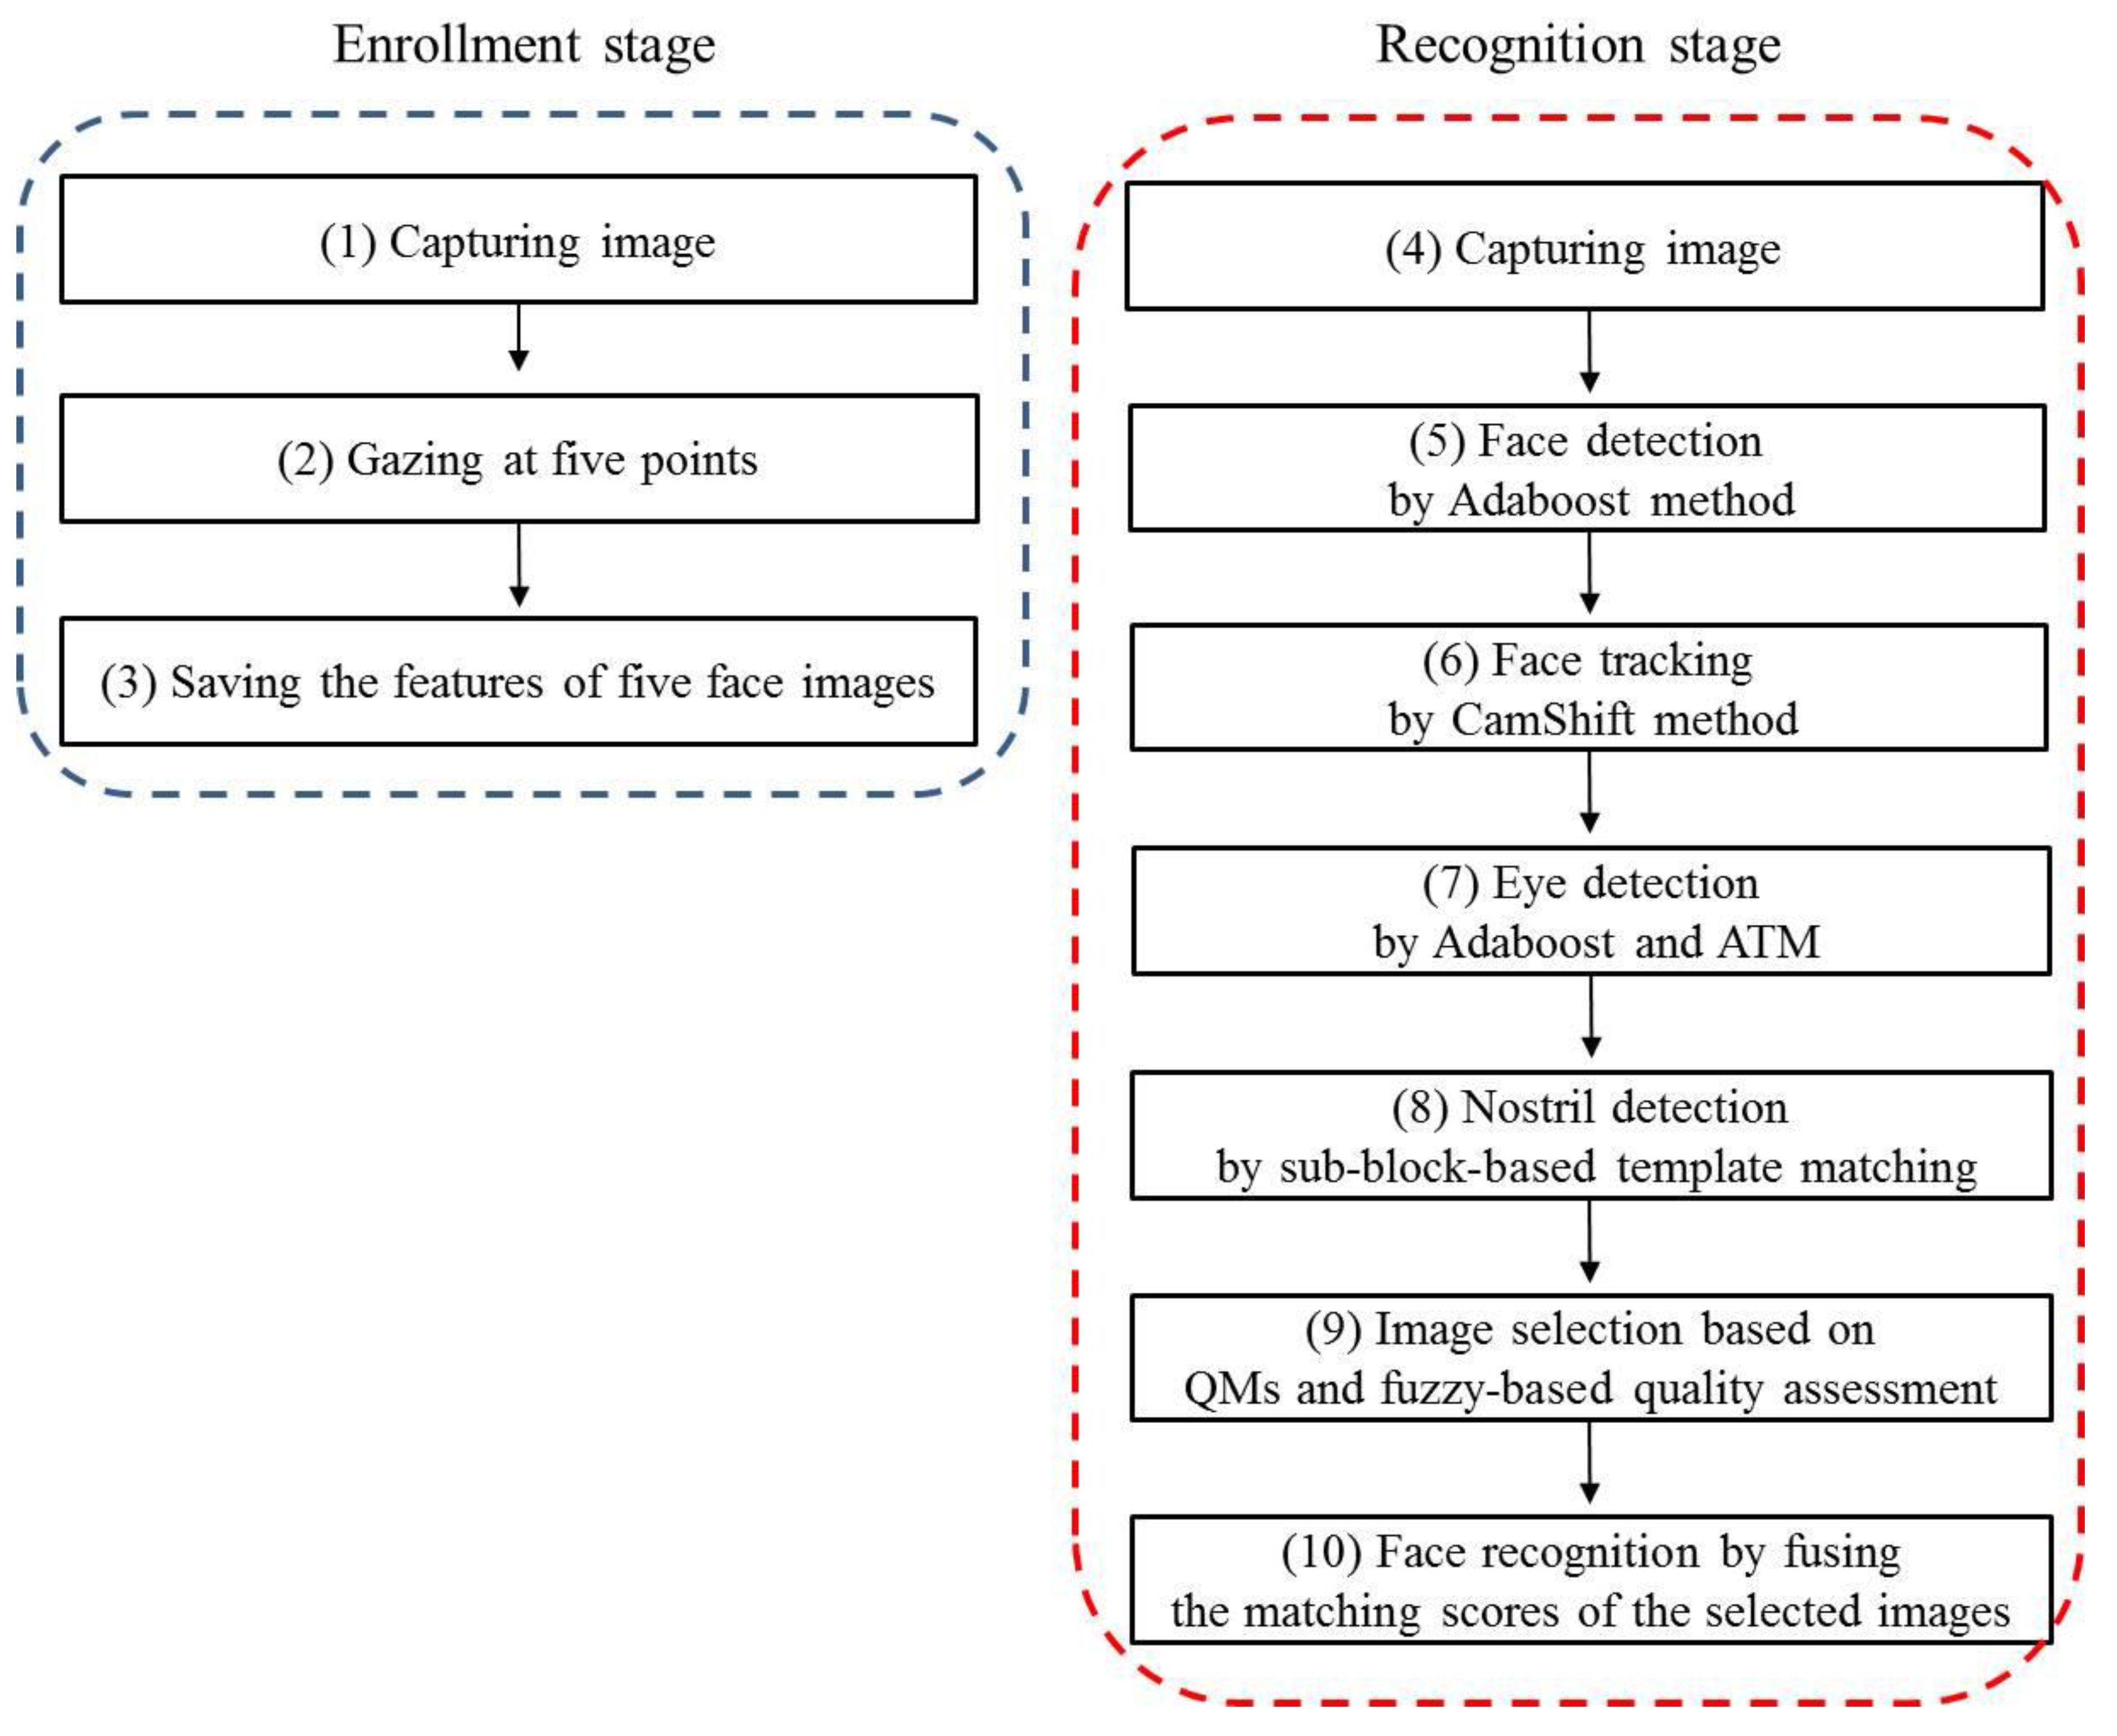
Figure 19, we show the face images of incorrectly recognized results. As shown in these Figures, although there exist the images where eyes are closed, our method can exclude these bad-quality images, and the face images of good quality are correctly selected. However, they are incorrectly matched with other person’s enrolled face image. This is because there exists a size difference between the face areas of enrolled image and input one due to the incorrect detection of face and eye region (Steps 6 and 7 of
Figure 2), which leads to misrecognition. These can be solved by increasing the accuracy of re-definition of face area based on more accurate detection algorithm. Because our research is not focused on accurate detection, but focused on correctly selecting the face images of good quality, this research of accurate detection would be studied as a future work.
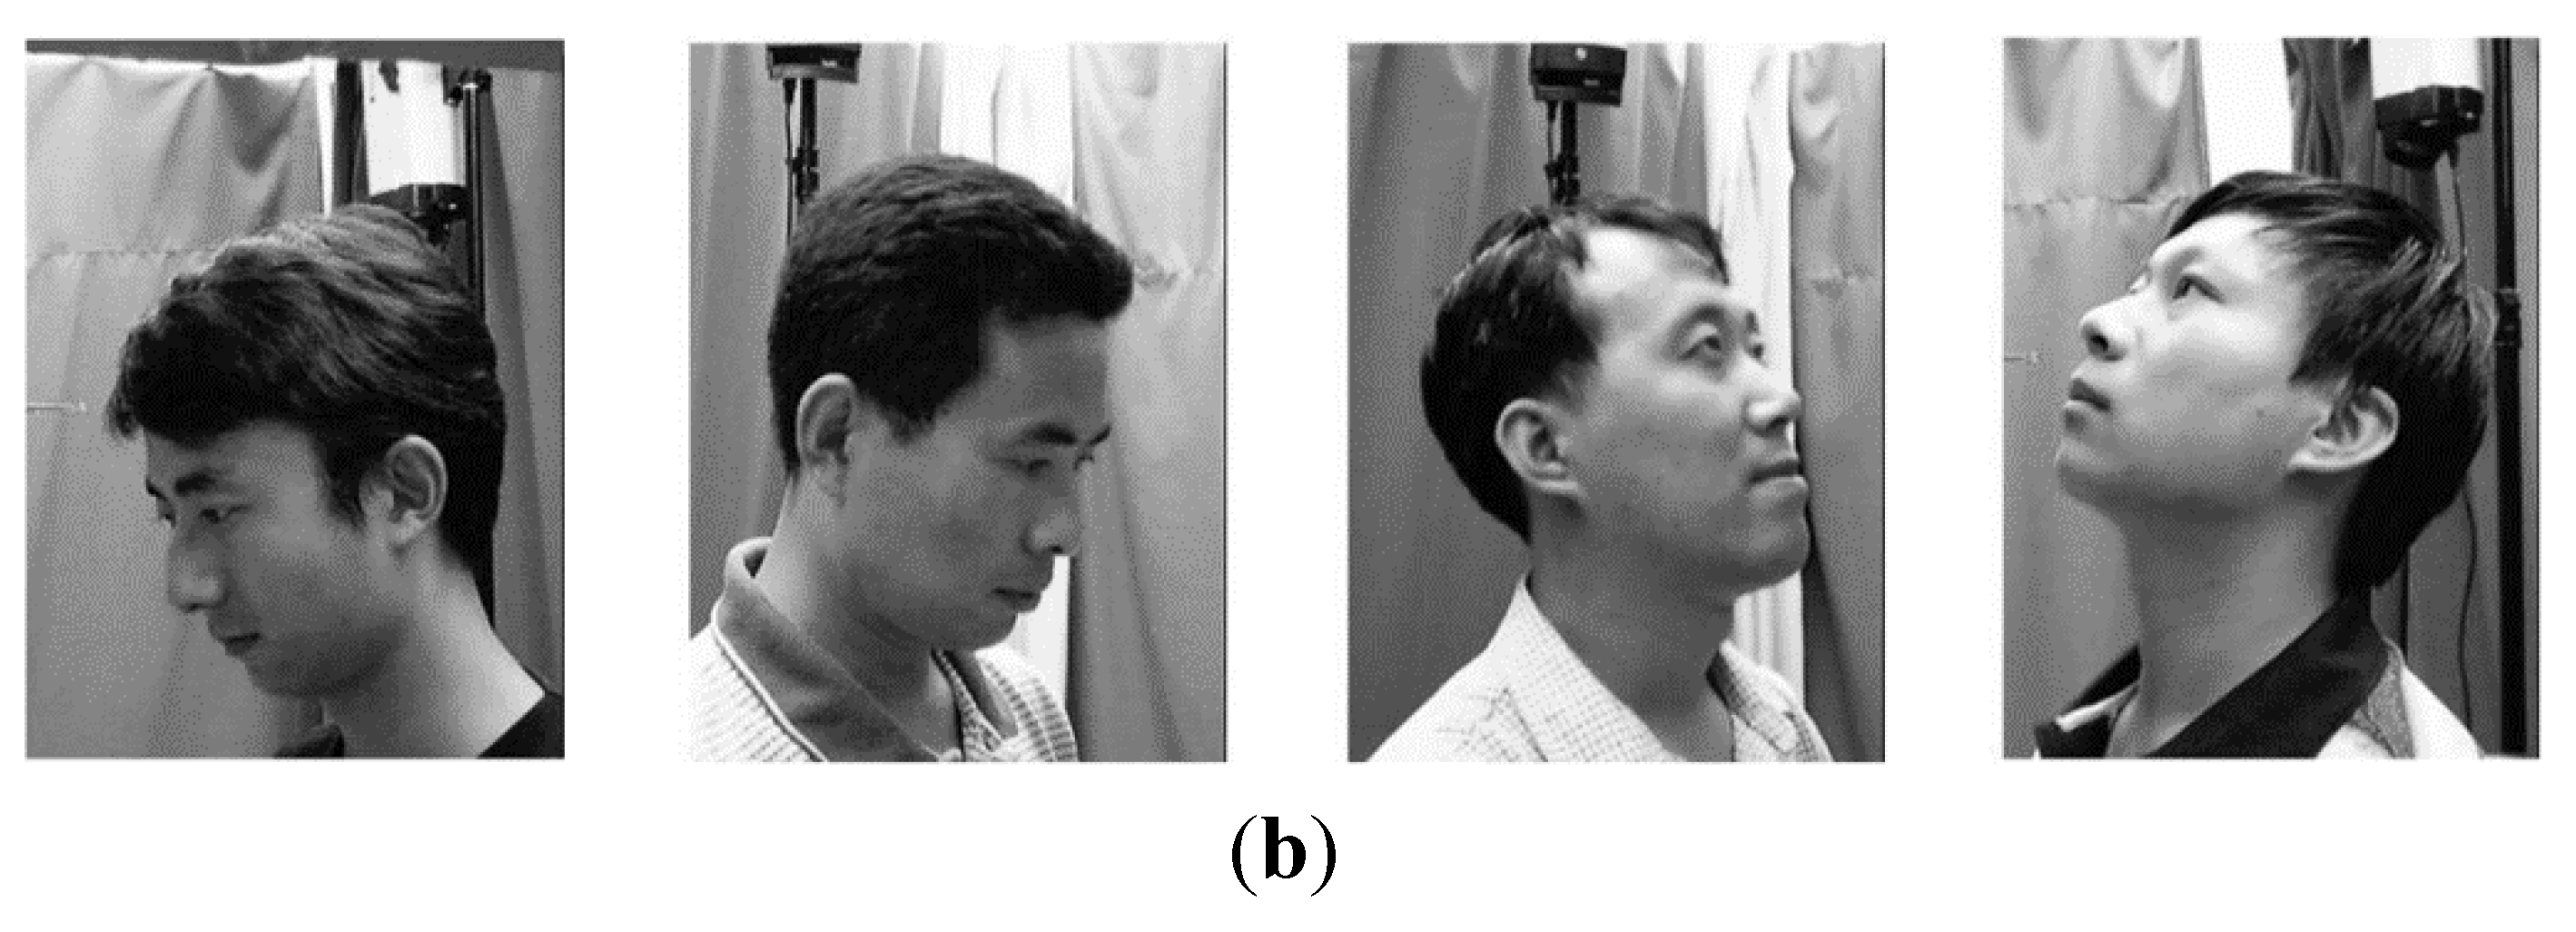
We used the images which were acquired while each user naturally watches TV as shown in
Figure 3 for our experiments. In case of the severe rotation of head as shown in
Figure 20, the face and facial features are difficult to be detected. In addition, because these cases do not happen when a user looks at a TV normally, we did not use these images for our experiments.
Figure 18.
Example of incorrectly recognized results: (a) a sequences of 25 images; (b) selected five images; (c) enrolled face images (gazing at five positions of TV); (d) incorrectly matched face image among face images of enrolled persons.
Figure 18.
Example of incorrectly recognized results: (a) a sequences of 25 images; (b) selected five images; (c) enrolled face images (gazing at five positions of TV); (d) incorrectly matched face image among face images of enrolled persons.
Figure 19.
Example of incorrectly recognized results: (a) a sequences of 25 images; (b) selected five images; (c) enrolled face images (gazing at five positions of TV); (d) incorrectly matched face image among face images of enrolled persons.
Figure 19.
Example of incorrectly recognized results: (a) a sequences of 25 images; (b) selected five images; (c) enrolled face images (gazing at five positions of TV); (d) incorrectly matched face image among face images of enrolled persons.
Figure 20.
Examples of severe rotation of head: (
a) Images captured by our system; (
b) images from CAS-PEAL-R1 database [
54,
55].
Figure 20.
Examples of severe rotation of head: (
a) Images captured by our system; (
b) images from CAS-PEAL-R1 database [
54,
55].
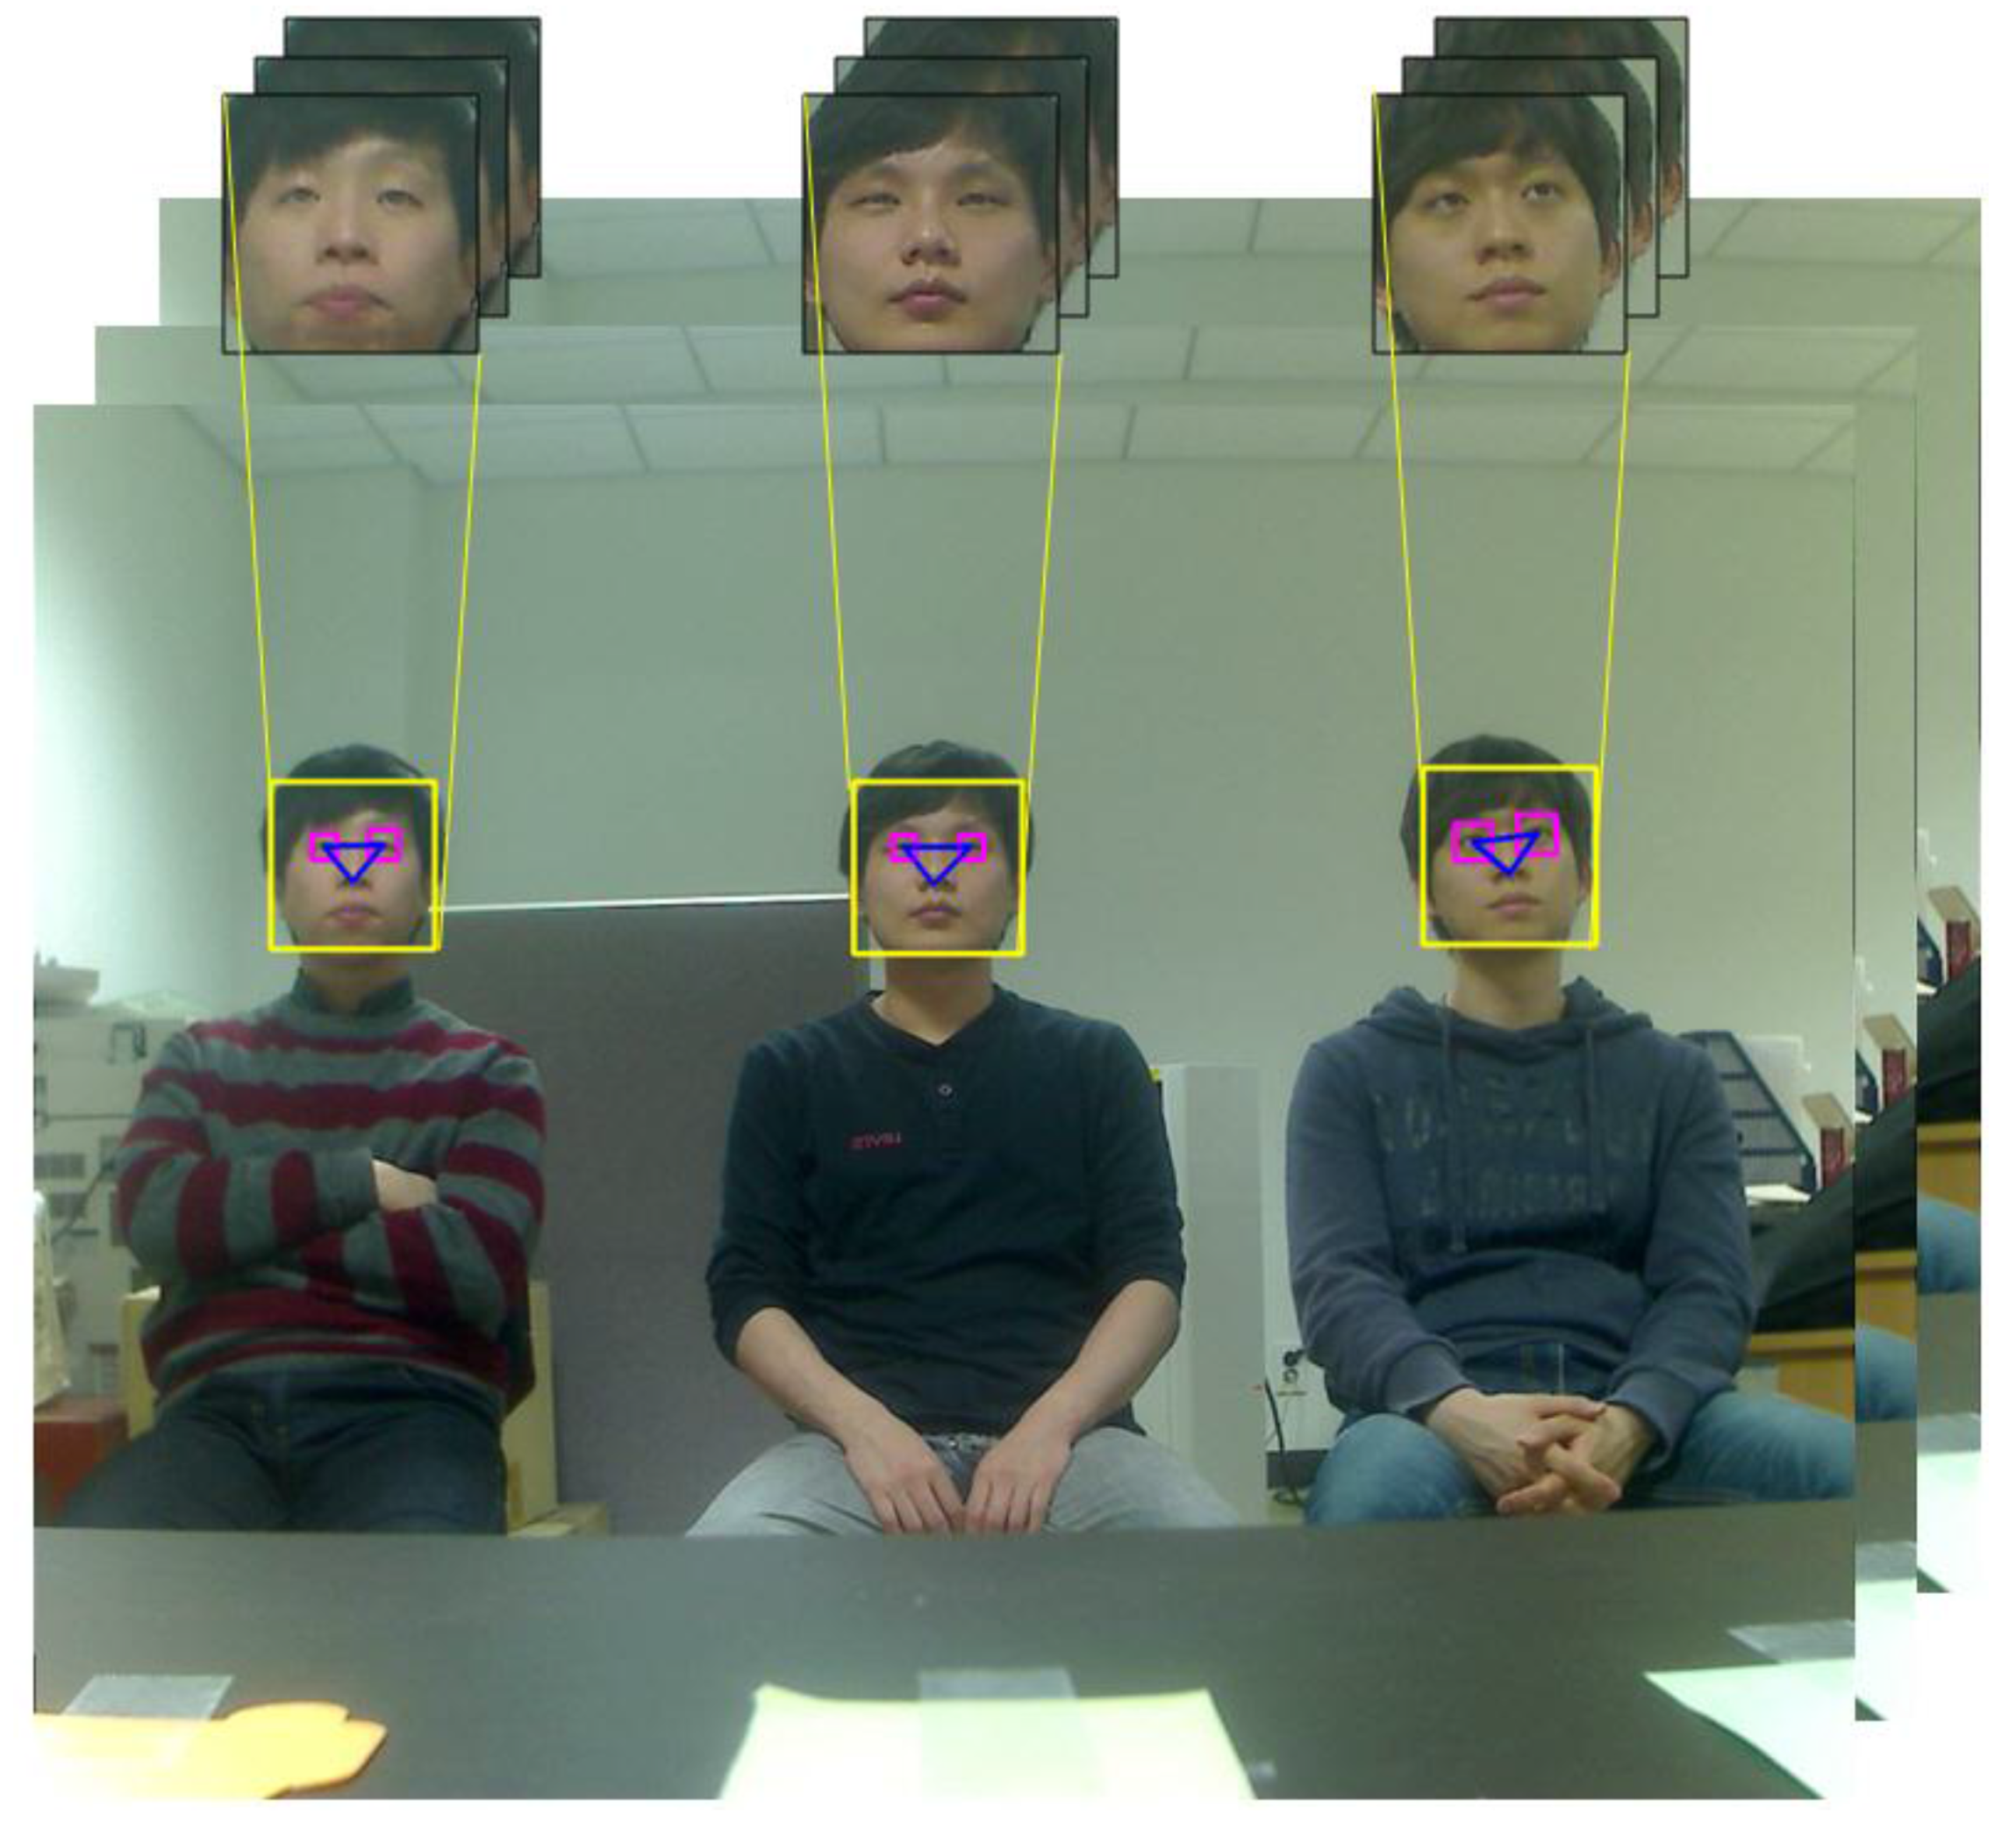
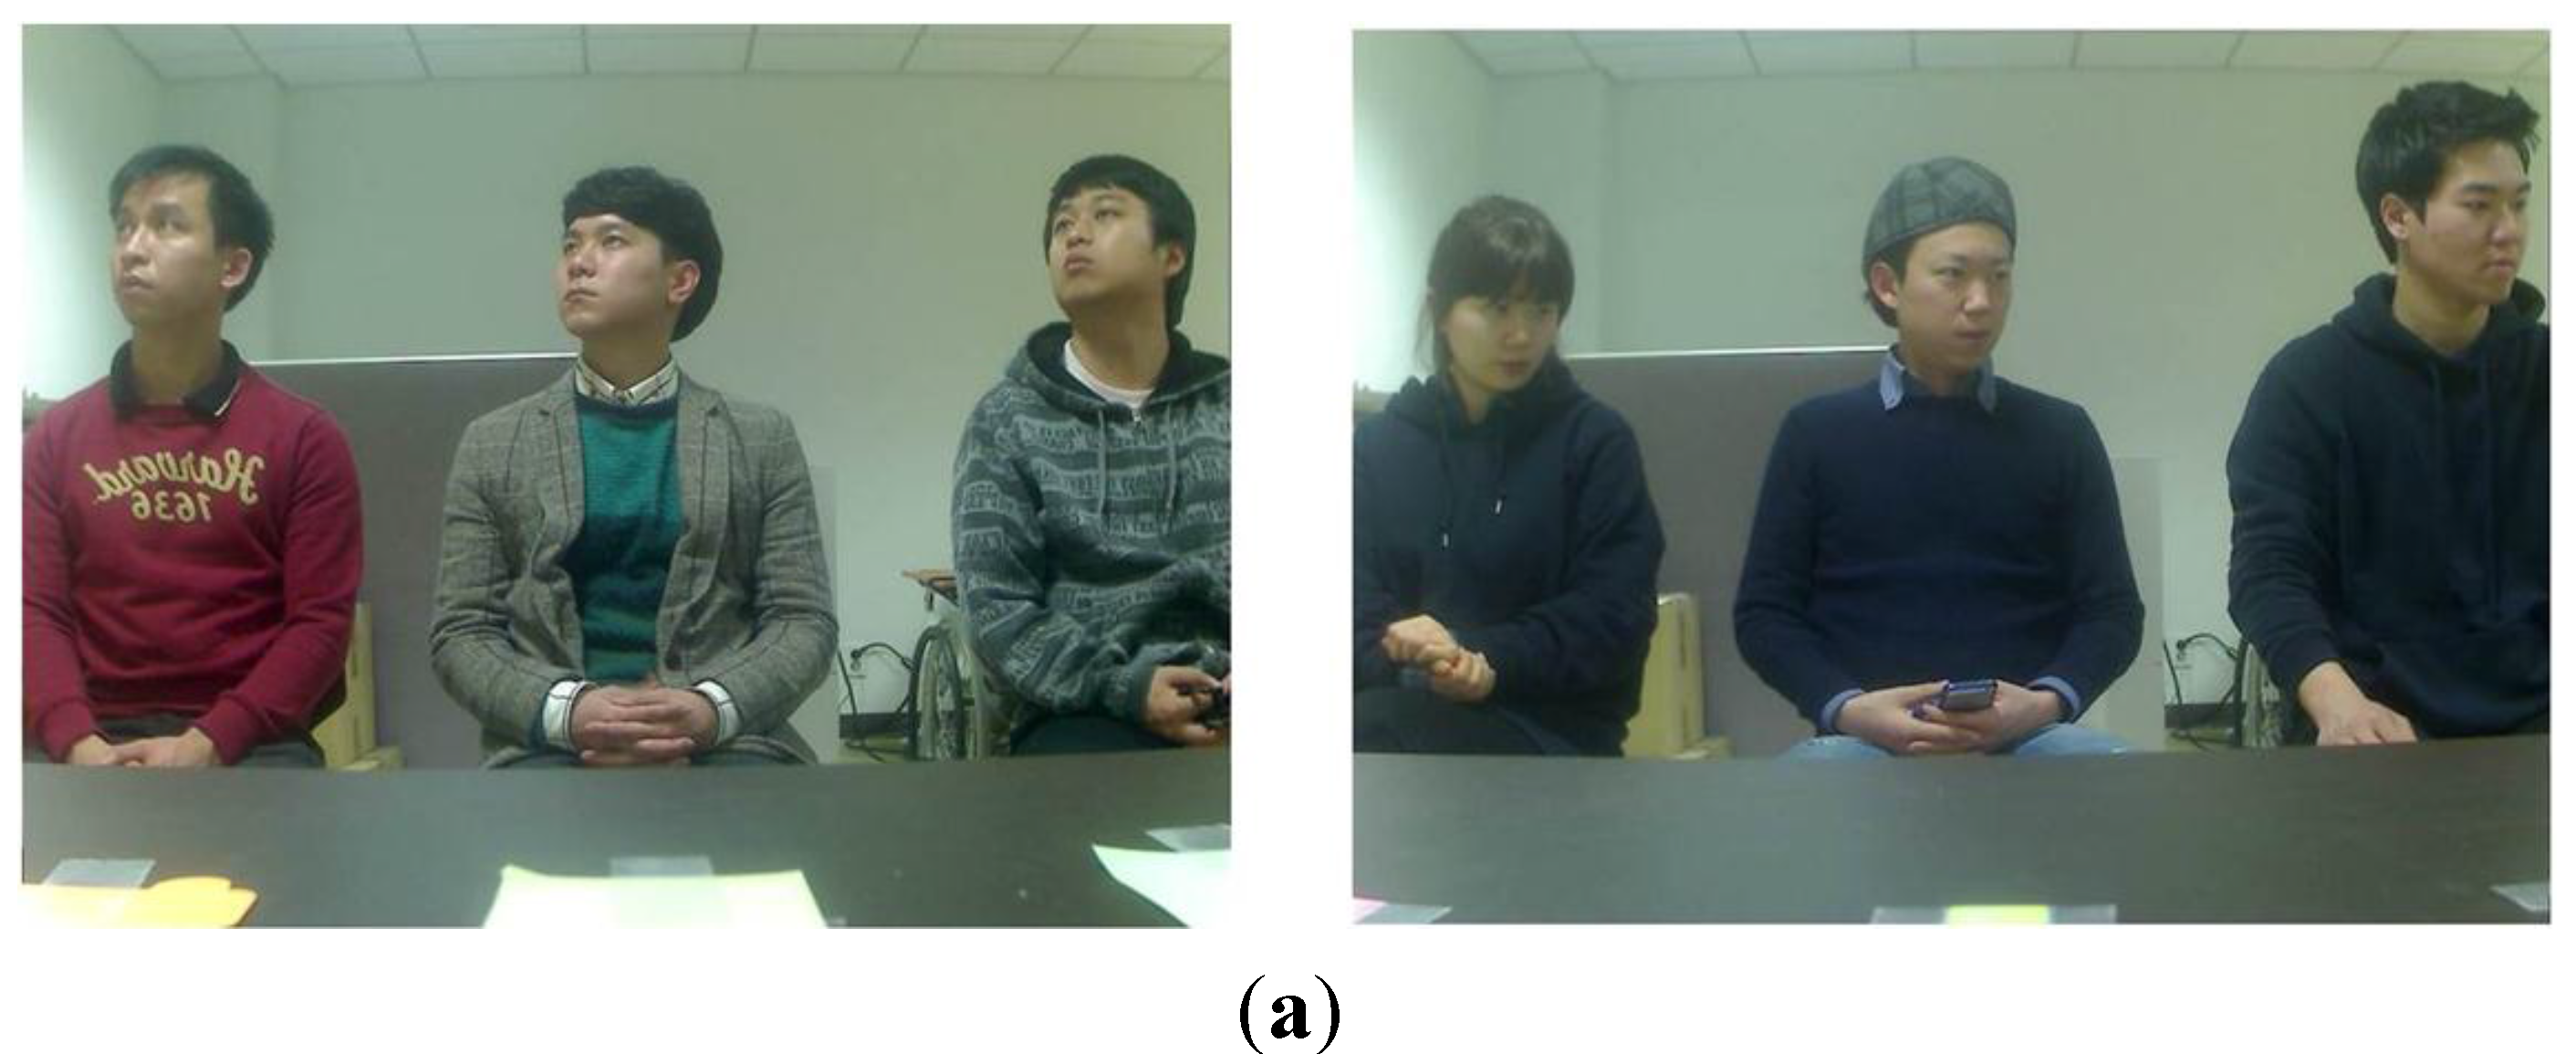
When a user looks at a TV normally, the primary factors for determining degree of head pose change are the size of the TV and viewing distance between the user and TV. The relationship between the TV size and optimal viewing distance is already defined in [
56]. That is, the larger the TV size is, the farther the optimal viewing distance should be. Moreover, the smaller the TV size is, the nearer the optimal viewing distance should be.
Based on this [
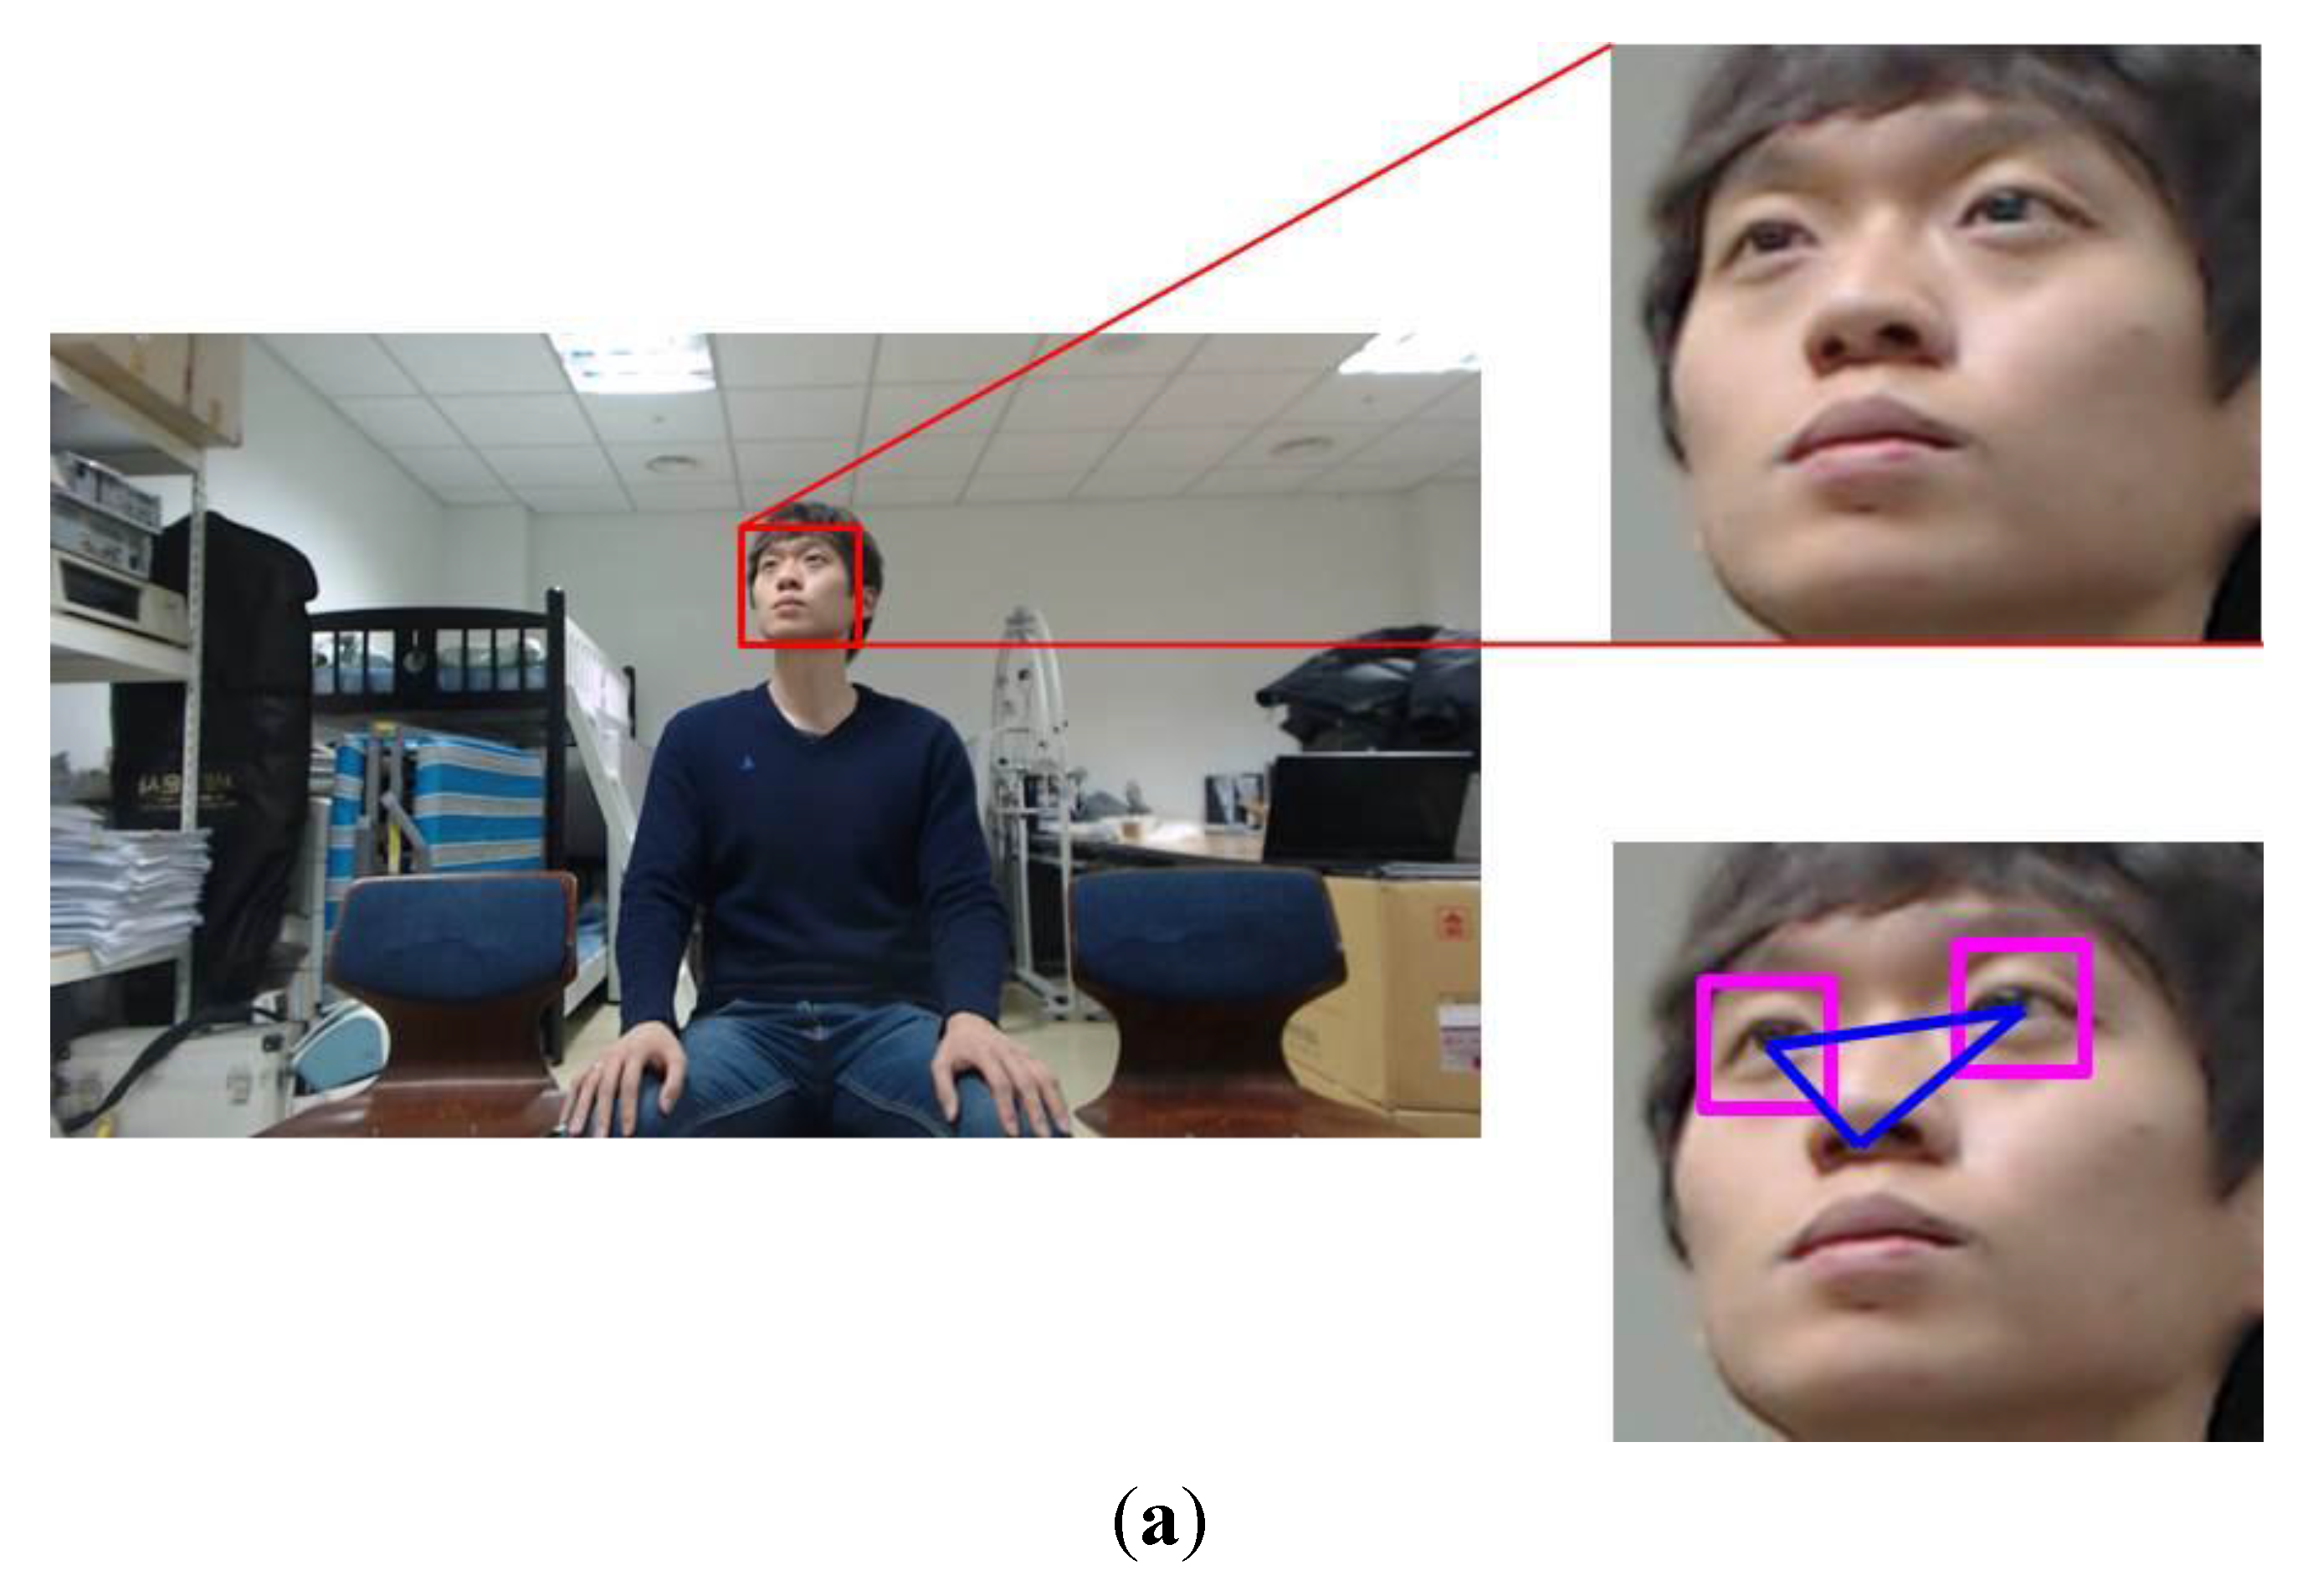
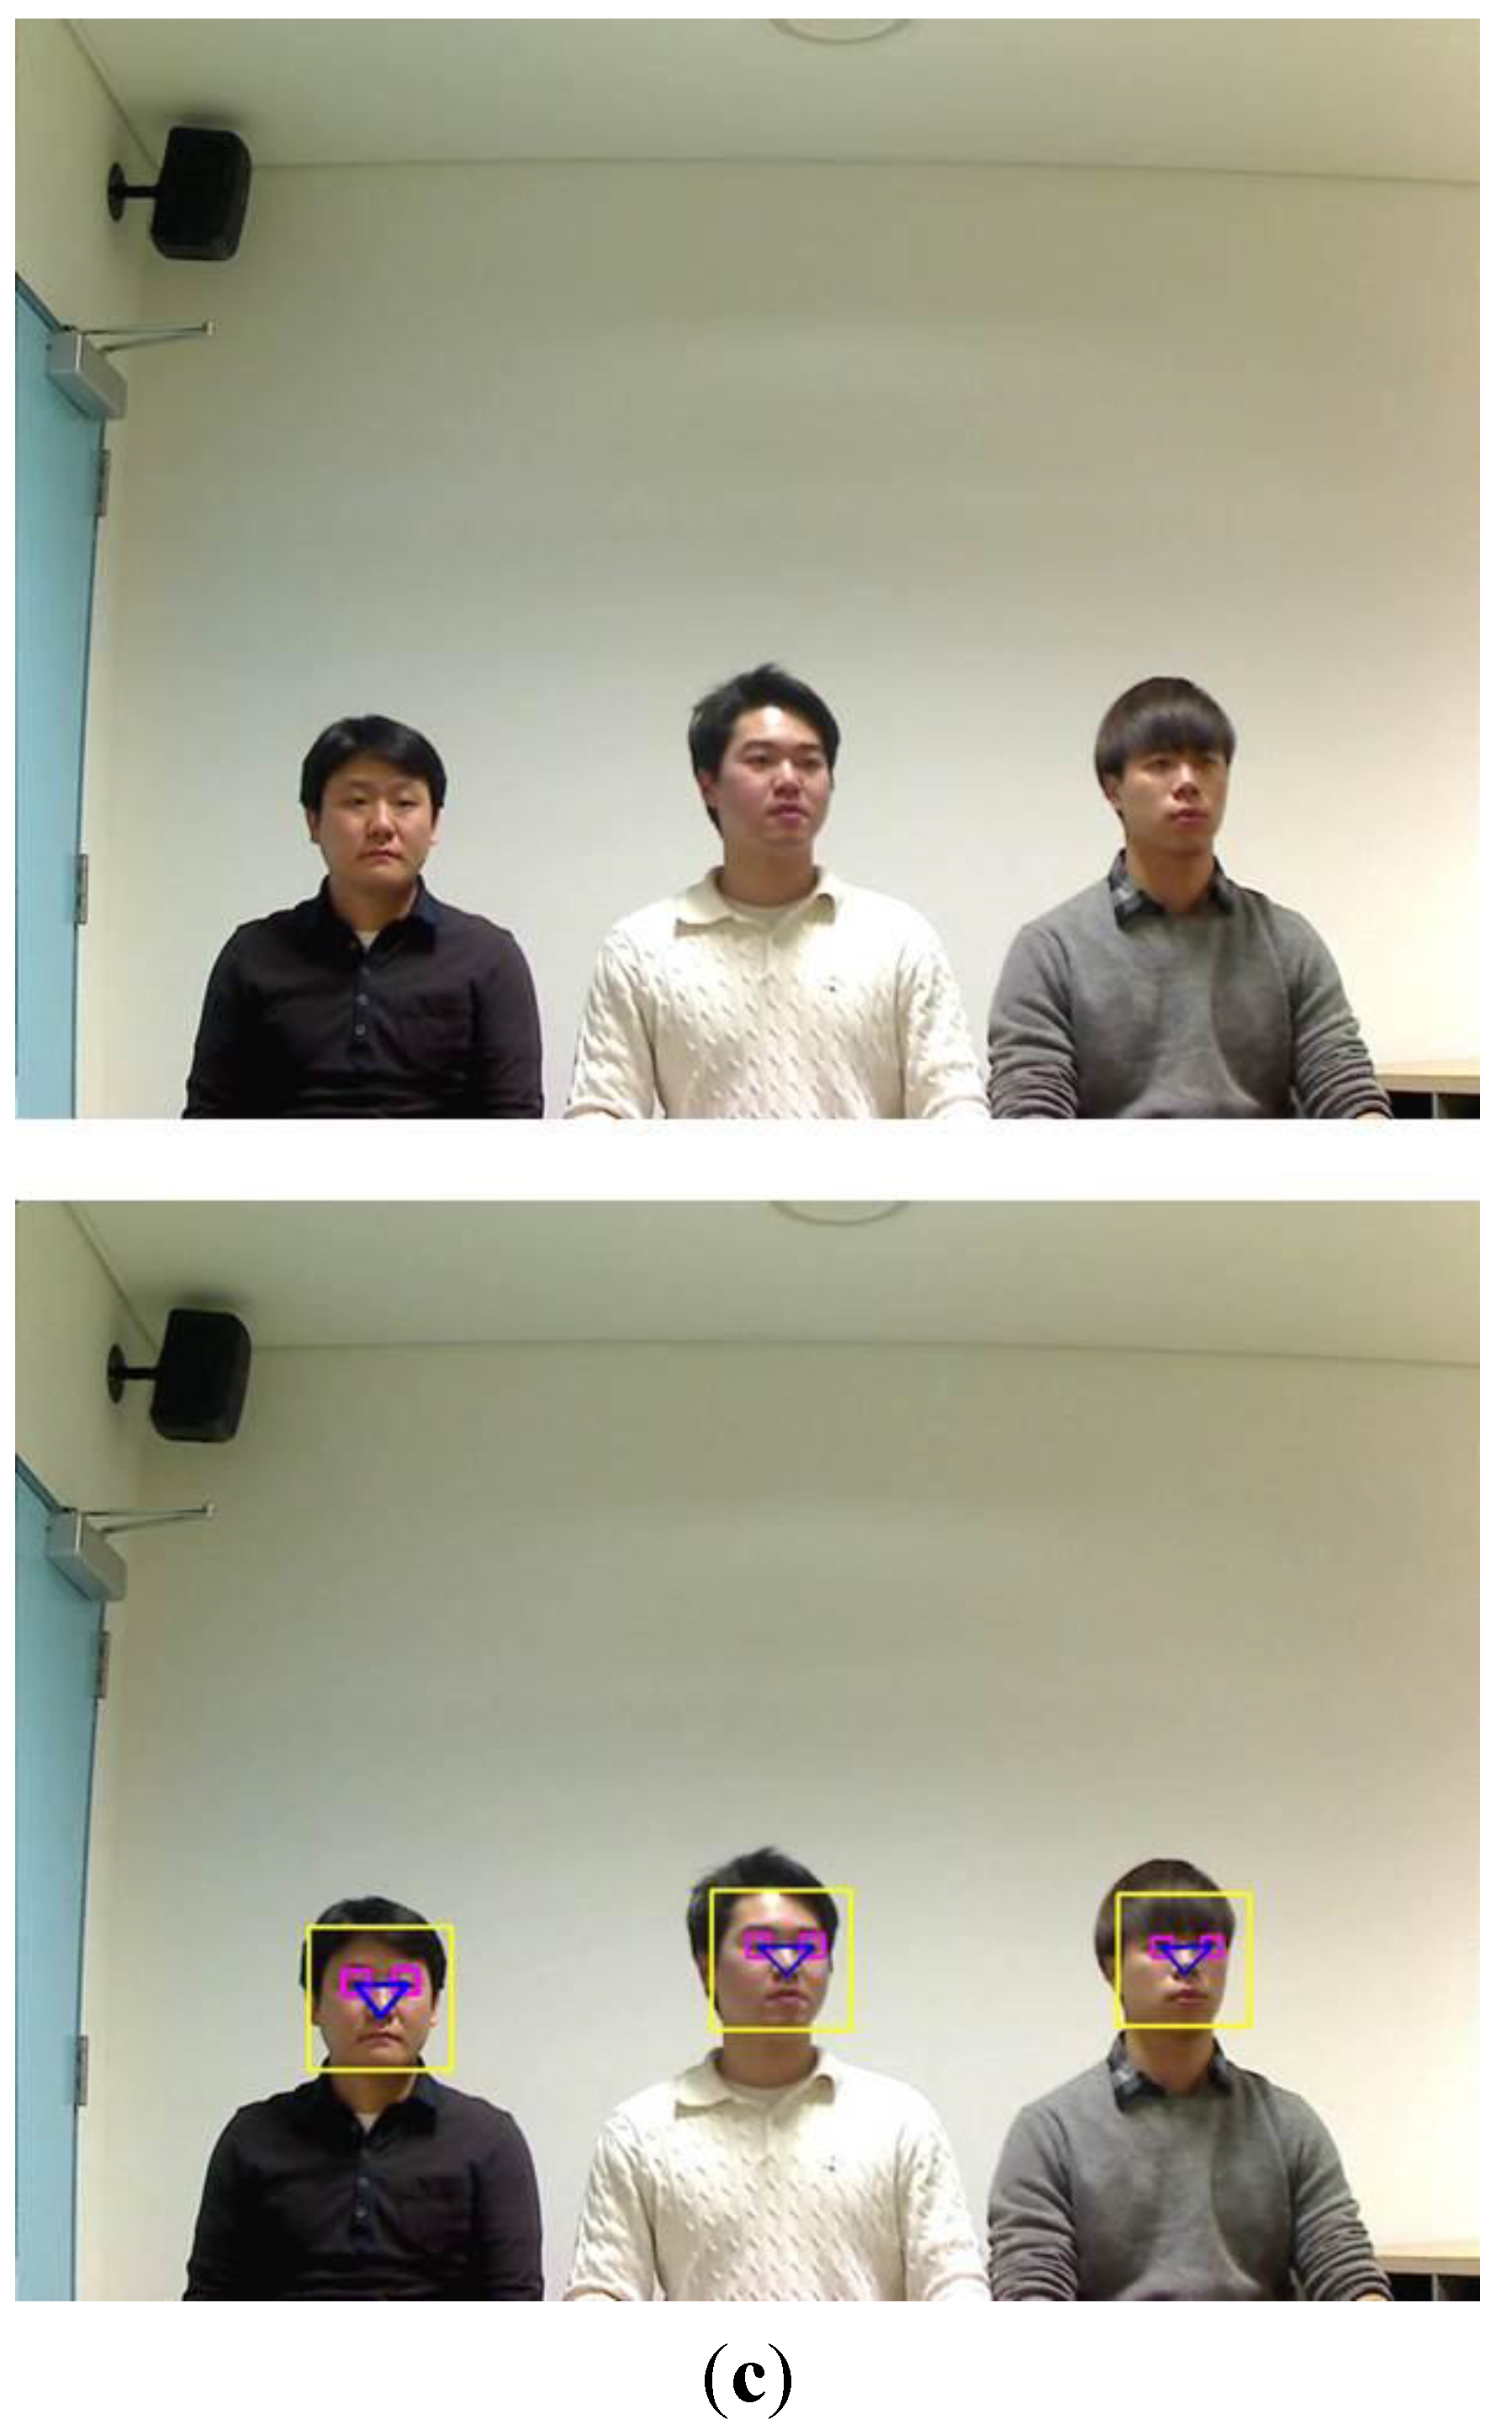
56], we show the three cases, (a) when users are watching TV of 50 inches at the viewing distance of about 2 m; (b) when users are watching TV of 60 inches at the viewing distance of about 2.4 m; and (c) when users are watching TV of 70 inches at the viewing distance of about 2.8 m as shown in
Figure 21a–c, respectively. As shown in the upper images of
Figure 21a–c, the degrees of head pose change are almost similar all in these cases when each user gazes at the same (lower-left) position on the TV although the image resolution of each user decreases according to the increase of the viewing distance. As shown in the lower images of
Figure 21a–c, the correct regions of face and facial features are detected by our method, and our method of measuring the quality of face image is also working successfully, which shows that the performance of our method is not affected by using the smaller or larger sized TV if considering the optimal viewing distance.
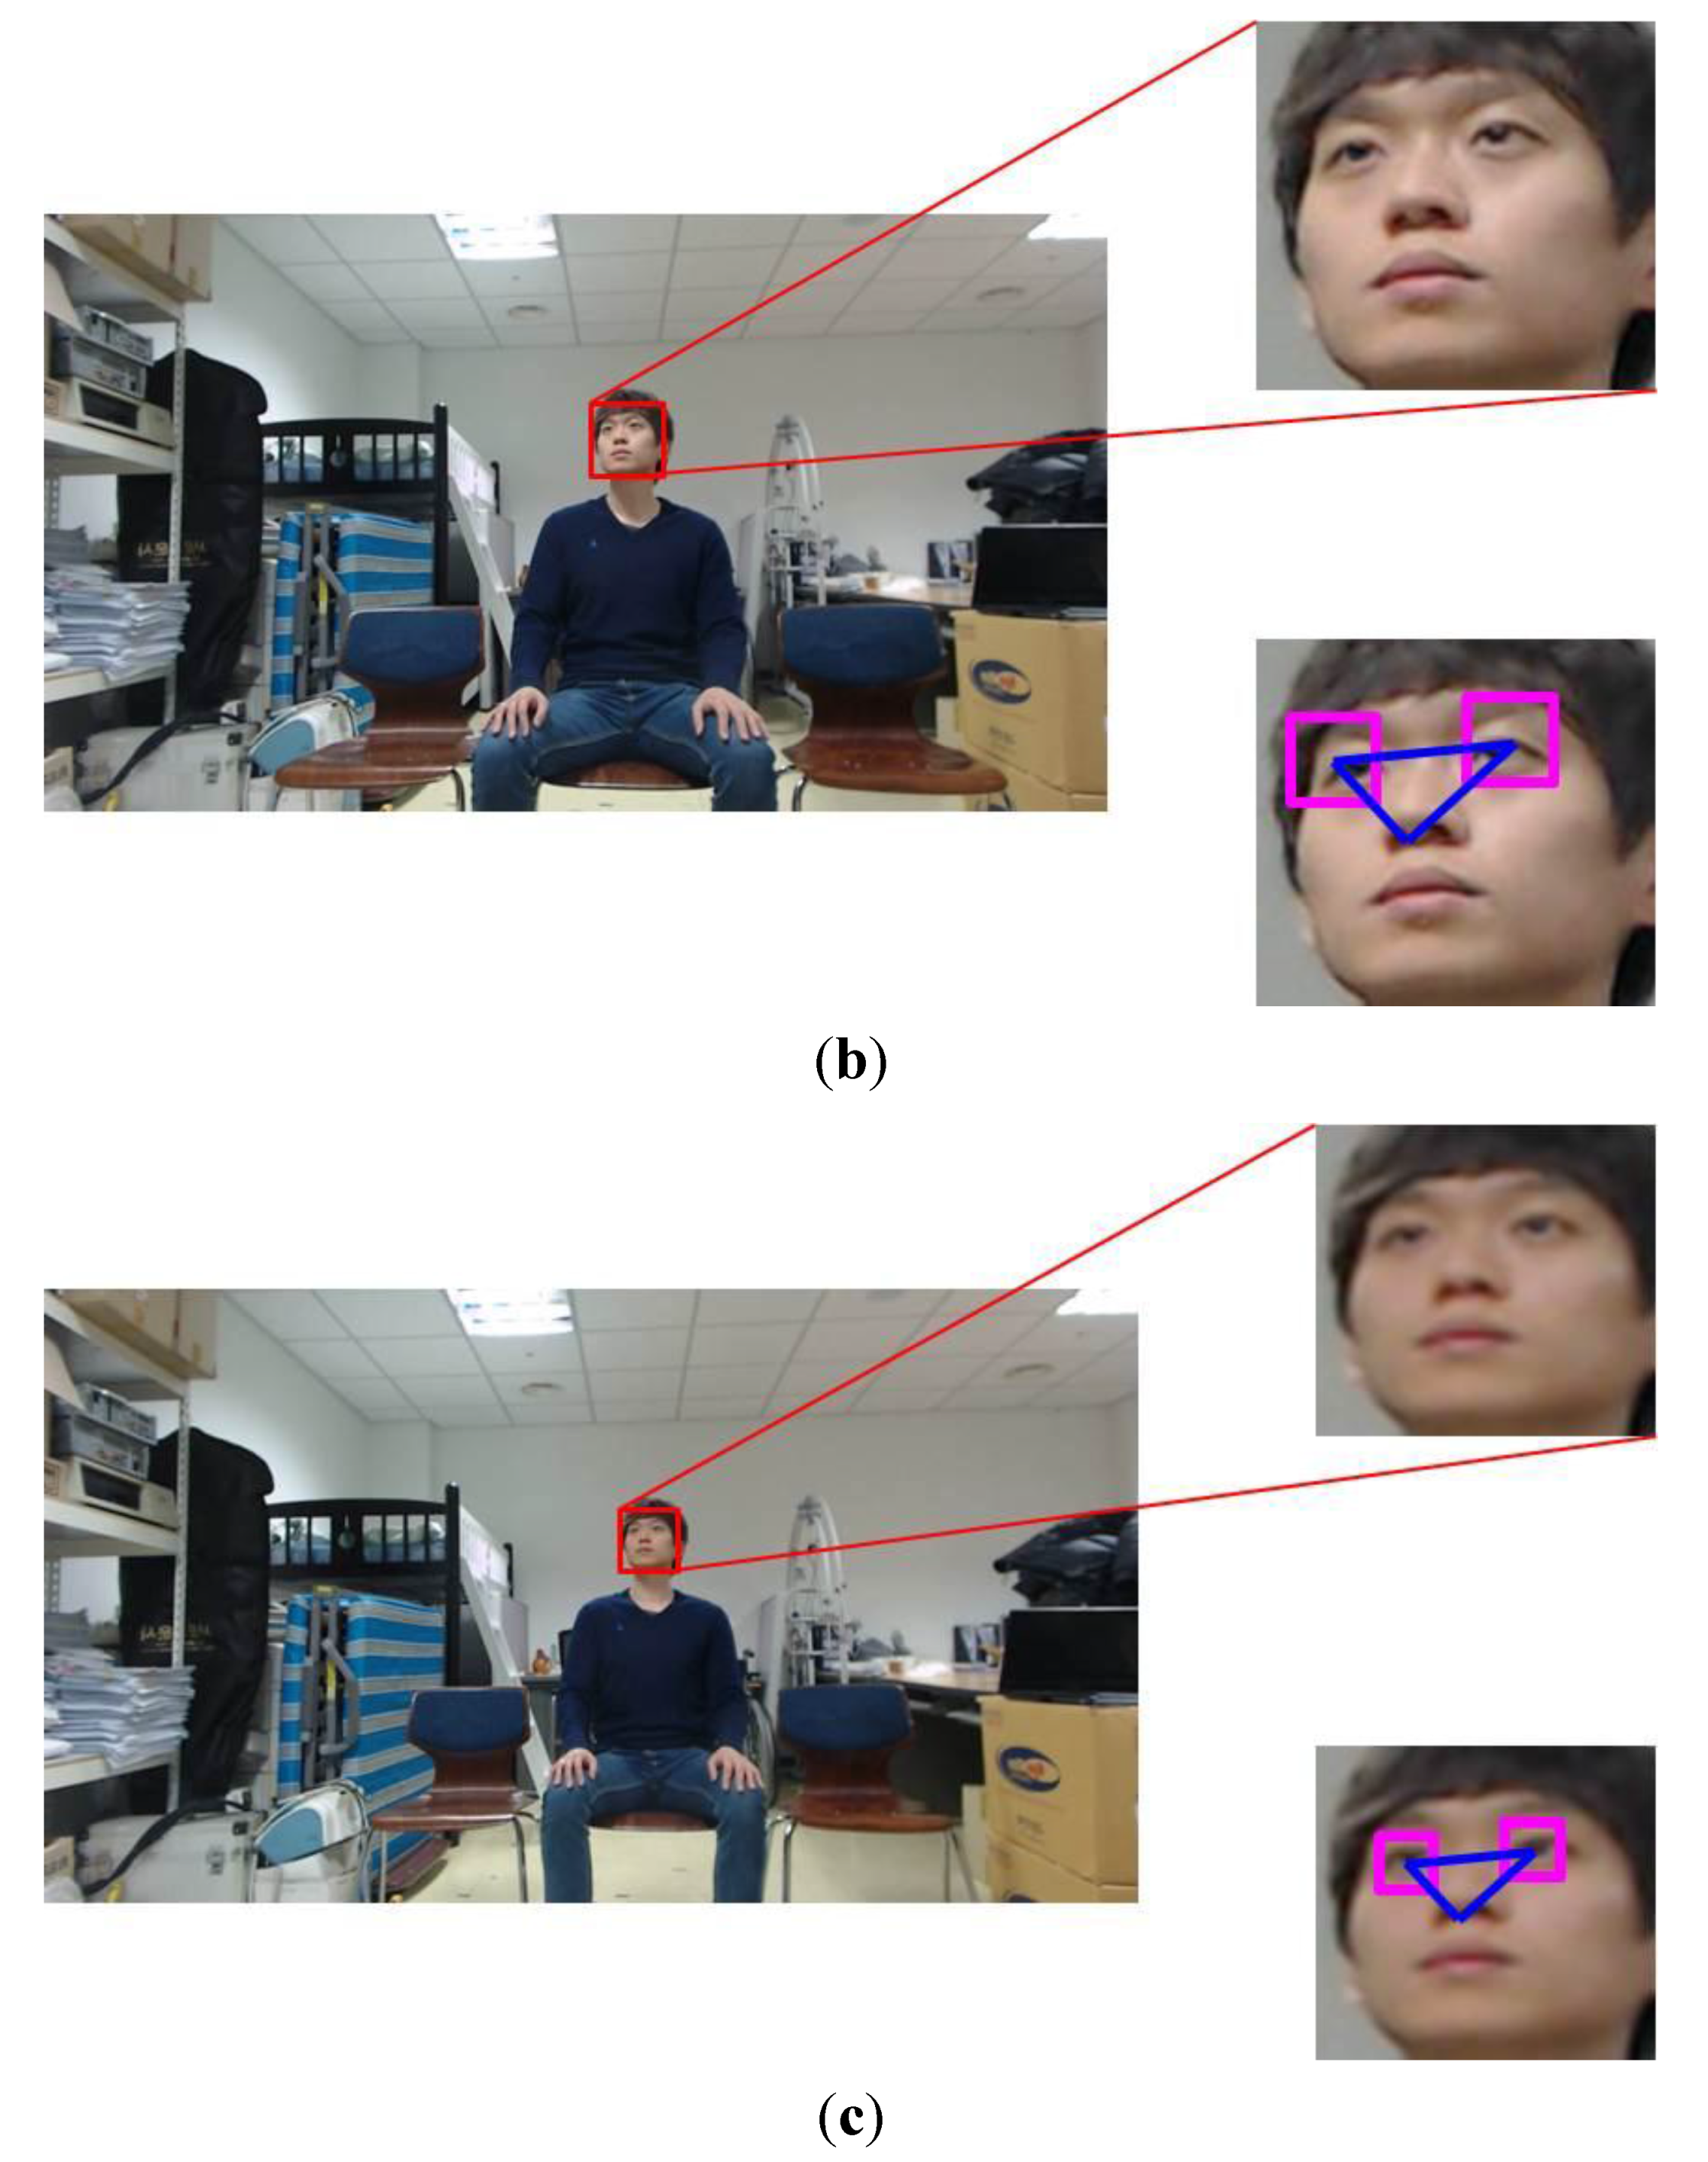
The degree of head pose change is different according to the Z distance even though the user looks at the same location on the TV screen of same size as shown in
Figure 22a–c. When a user is at a nearer distance from TV (in the case of
Figure 22a), the degree of head pose change becomes larger than that of the case of
Figure 22c. On the other hand, when the user is at a farther distance (in the case of
Figure 22c), the degree of head pose change becomes smaller than that of the case of
Figure 22a although the image resolution of the user of
Figure 22c decreases.
As shown in the right-lower images of
Figure 22a–c, the correct regions of face and facial features are detected by our method, and our method of measuring the quality of face image is also working successfully, which shows that the performance of our method is not affected by the farther or nearer distance between the user and TV.
In addition, we performed the experiments with additional open database. By using open database, the CAS-PEAL-R1 database [
54,
55], we could increase the number of subjects and show the fidelity of the proposed method irrespective of the kind of database. The CAS-PEAL-R1 database contains 30,863 images of 1040 subjects (595 males and 445 females). In the CAS-PEAL-R1 database, most images (21 poses × 1040 individuals) with pose variations were acquired according to the different camera position.
Figure 21.
Examples of head pose change according to the size of the TV with the optimal viewing distance. In (a)–(c), the upper and lower figures represent the original images and result ones including the detected regions of face and facial features, respectively: (a) when users are watching TV of 50 inches at the viewing distance of about 2 m; (b) when users are watching TV of 60 inches at the viewing distance of about 2.4 m; (c) when users are watching TV of 70 inches at the viewing distance of about 2.8 m.
Figure 22.
Examples of head pose change according to the Z distance with the TV of 60 inches: (a) 1.5 m; (b) 2 m; (c) 2.5 m.
Figure 22.
Examples of head pose change according to the Z distance with the TV of 60 inches: (a) 1.5 m; (b) 2 m; (c) 2.5 m.
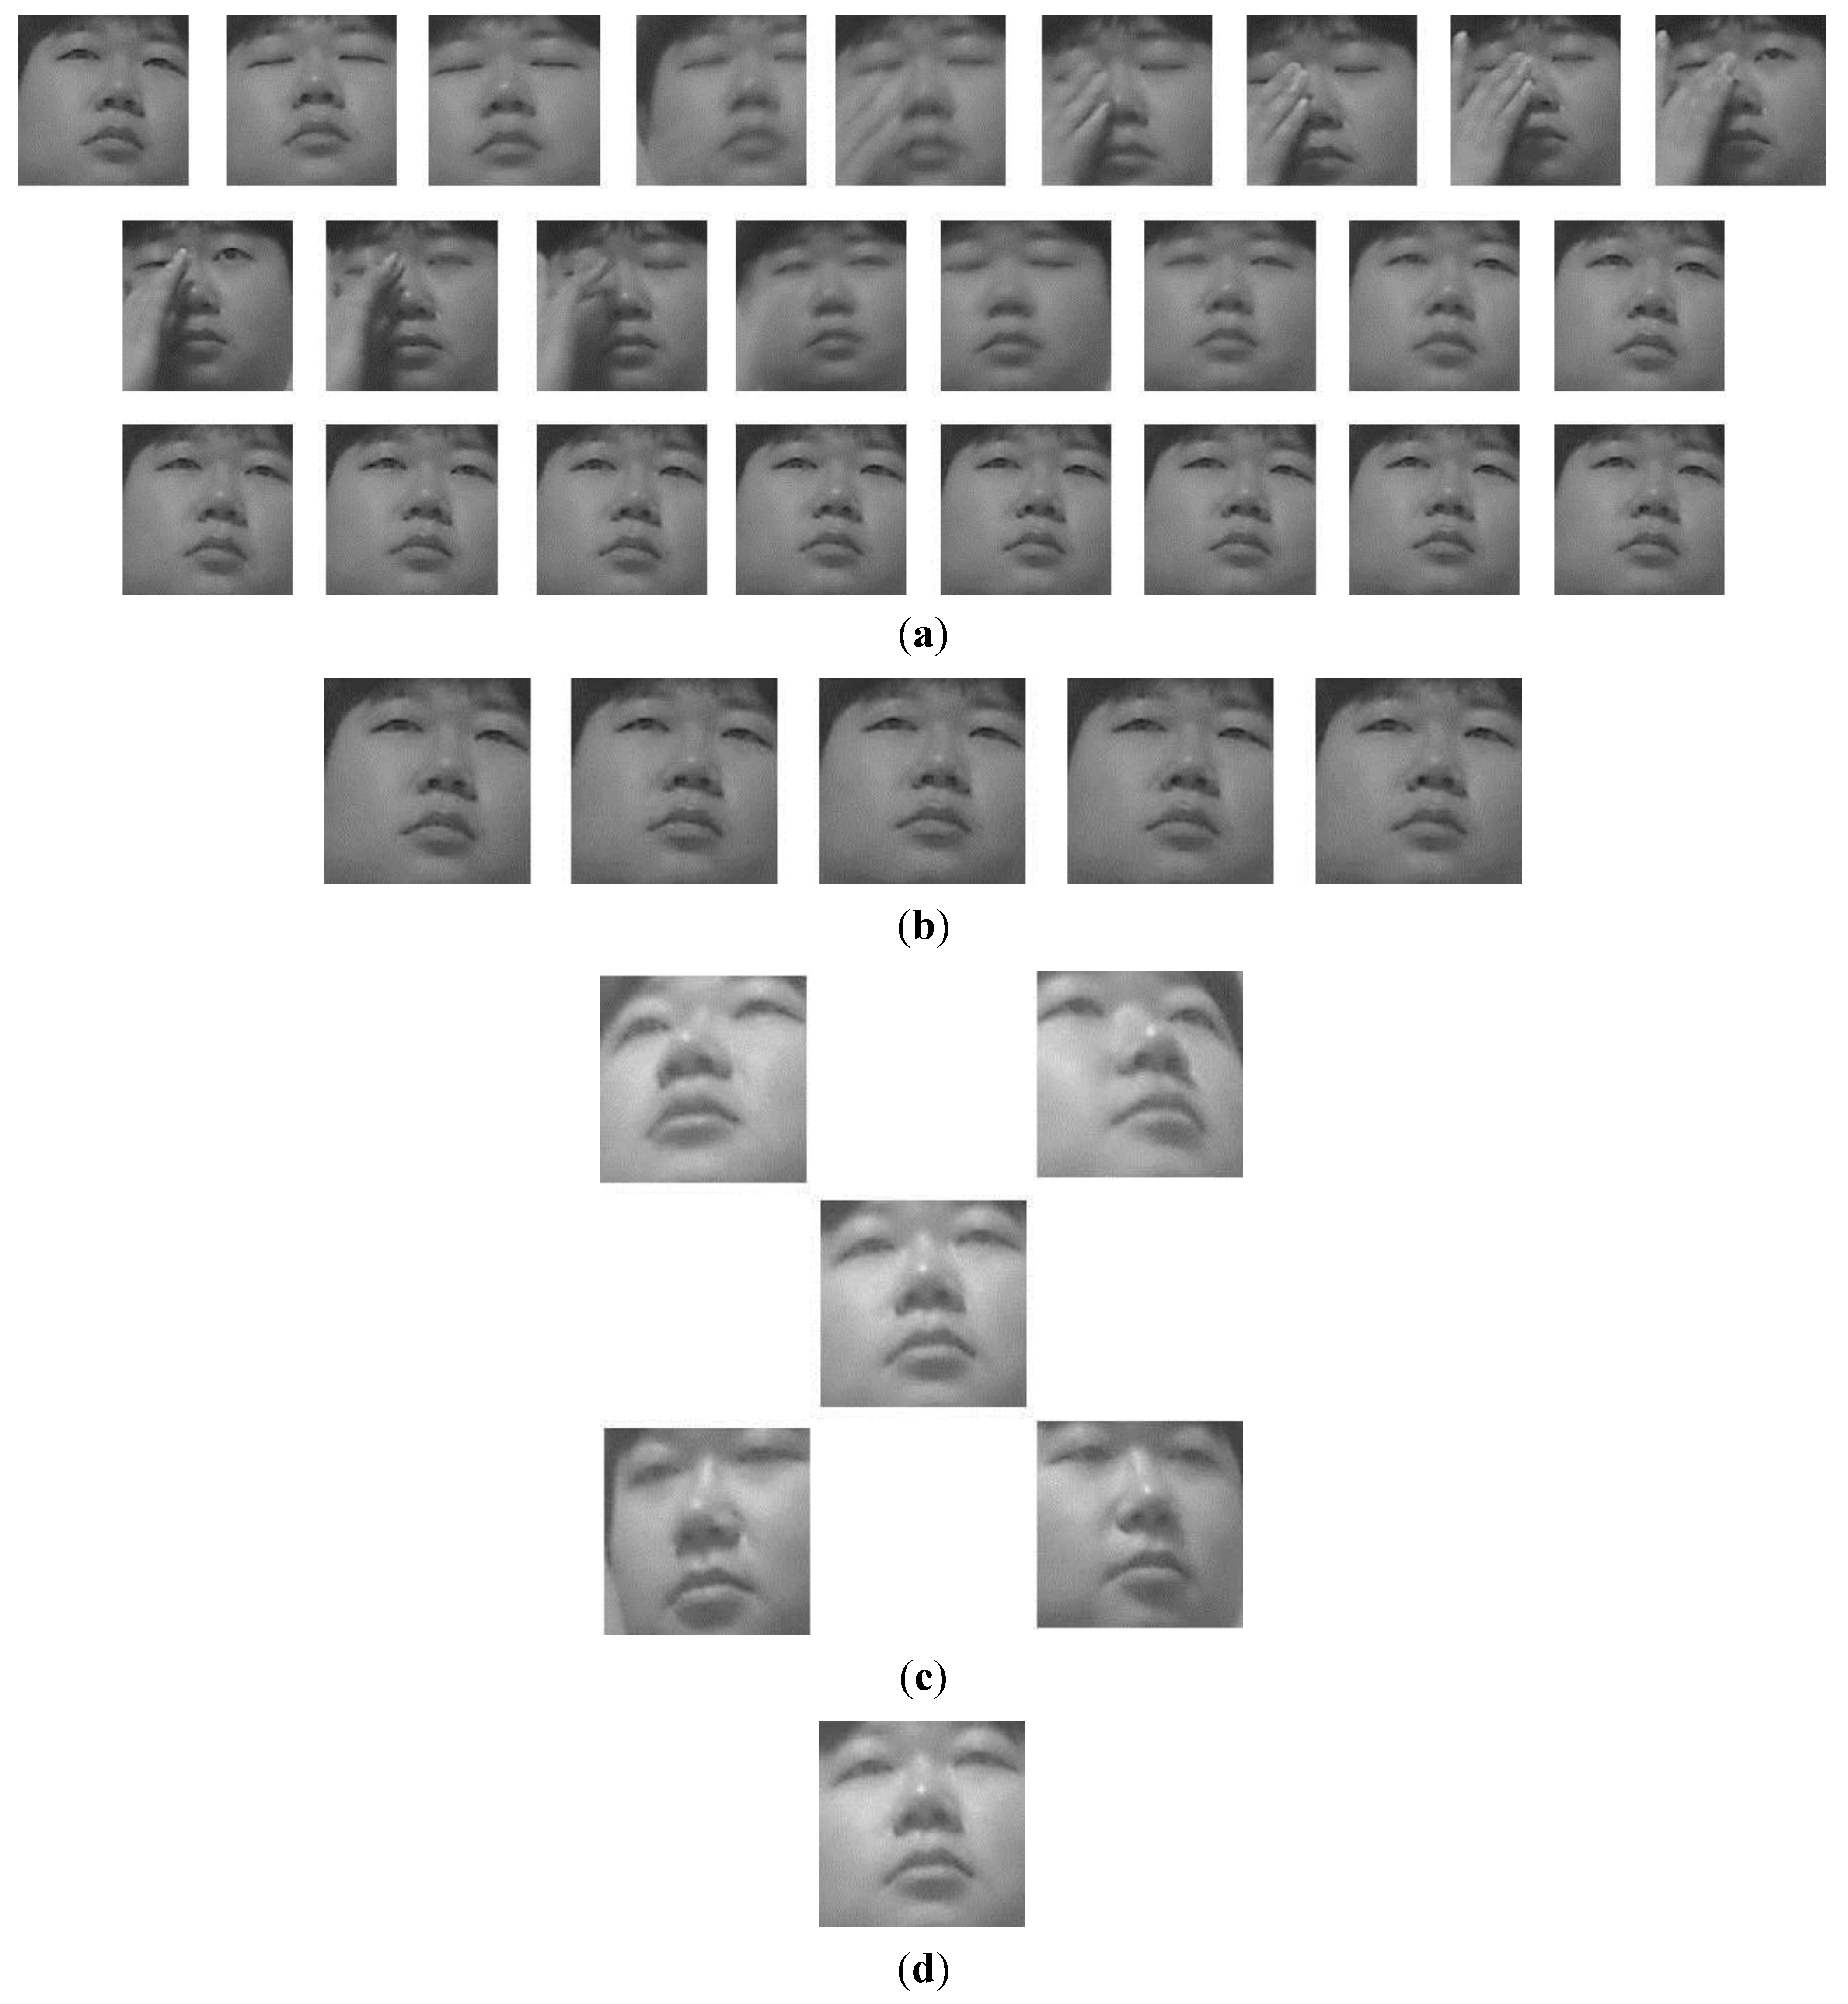
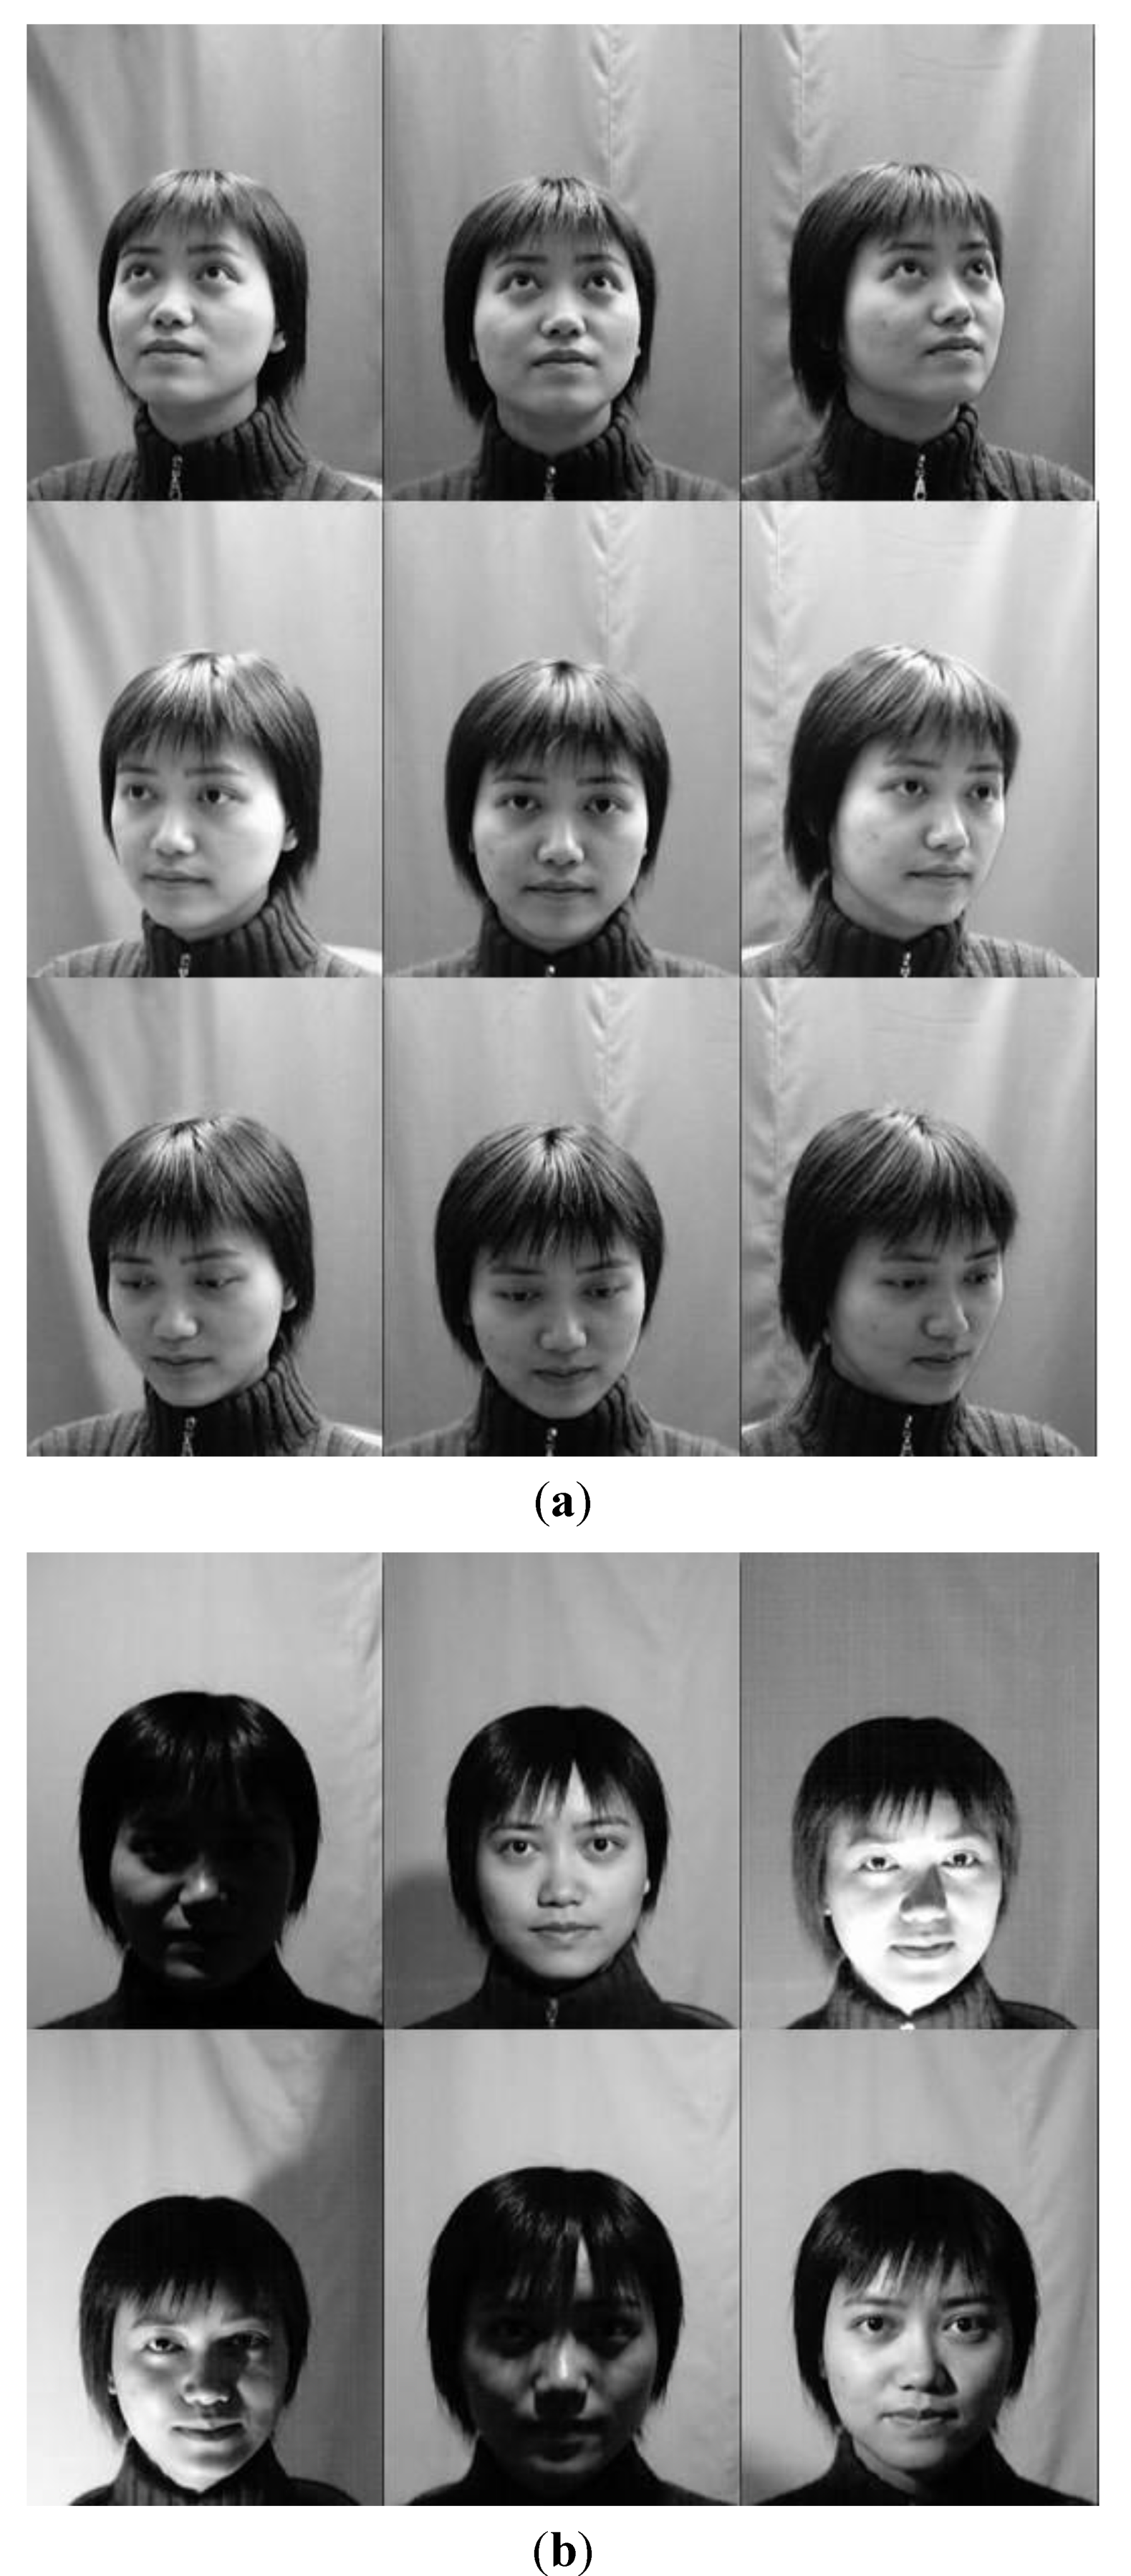
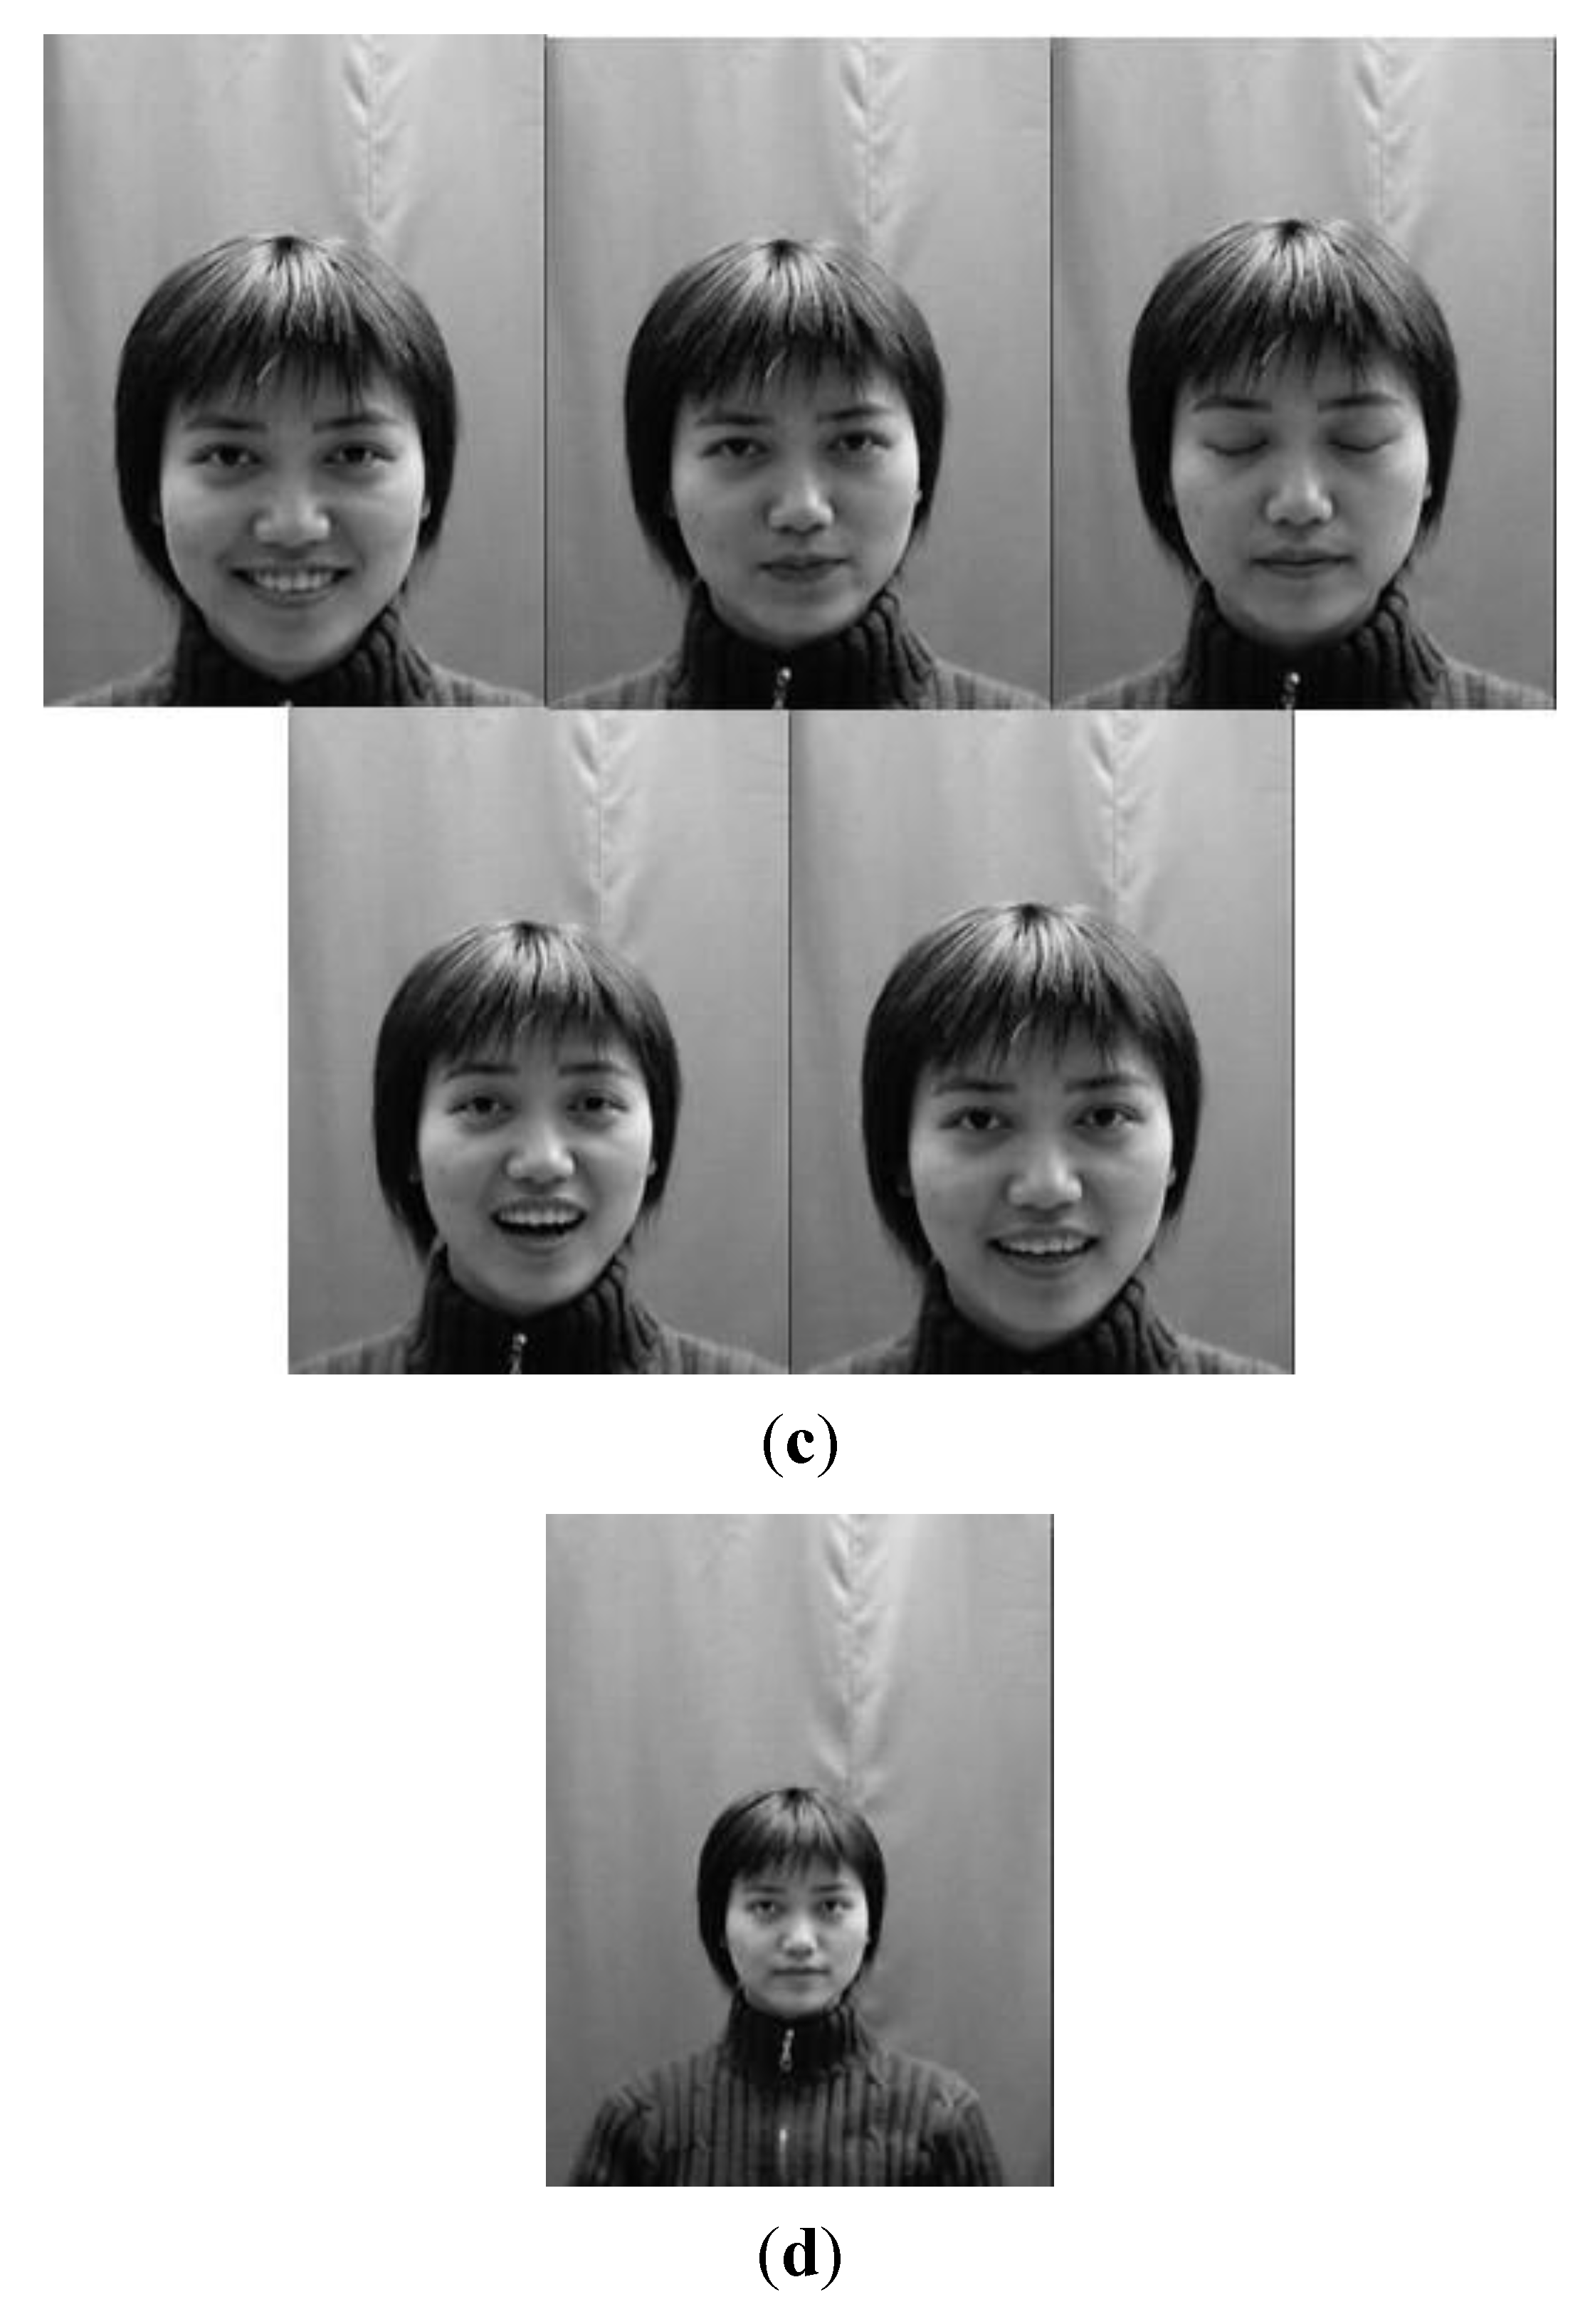
However, we do not cover high degree of rotation for our experiment because severe rotation of head does not happen when a user looks at a TV normally. Therefore, we used only nine images for each subject under different poses as shown in
Figure 23a. In addition, each subject has the images under at least six illumination changes, those with six different expressions, and those with different image resolutions within the face region as shown in
Figure 23b–d, respectively.
Consequently, a total of 2410 images (Database II) from 100 subjects were used for our experiments because the remainder images from 940 subjects contain few of variations. The image resolution is 360 × 480 pixels.
Figure 23.
Examples of one subject with different variations in Database II: (a) pose variation; (b) illumination variation; (c) expression variation; (d) image resolution variation.
Figure 23.
Examples of one subject with different variations in Database II: (a) pose variation; (b) illumination variation; (c) expression variation; (d) image resolution variation.
Experimental results showed that the Database II includes variations in head pose, contrast, and illumination as shown in
Figure 24. It is observed that the illumination is the most influential QM to construct the Face Log, whereas image resolution and openness of eyes have no influence as a QM. That is because the number of images where the Z distance variations of users occur is small among the whole images of Database II. In addition, the number of images where participants close their eyes is small among the whole Database II.
As the next experiment, we measured the accuracy of the face recognition method based on GAR where we set the number of enrolled persons to three. Using the results from
Figure 24, the accuracy of the proposed method was compared with a fixed quality measure-based approach [
21]. Here, we selected three influencing QMs (illumination, contrast, and head pose) for a fixed quality measure-based approach. In addition, we compared the accuracy of a previous method that uses all still images [
46], and the accuracy of fixed quality measure-based approach [
21] to the accuracy of our method as shown in
Table 8. Experimental results showed that the accuracy of the proposed method is higher than those of other methods, and its accuracy is similar to that of
Table 7 using our own database. From that, we can confirm that the accuracy of our method is less affected by the kinds of database and the number of participants in database.
Figure 24.
Results of adaptively selected QMs with Database II.
Figure 24.
Results of adaptively selected QMs with Database II.
Table 8.
Comparison of the accuracy of the proposed method with that of the other methods with Database II (unit: %).
Table 8.
Comparison of the accuracy of the proposed method with that of the other methods with Database II (unit: %).
| Method | Using all Images in a Video Sequence [46] | Fixed Quality Measures-Based Approach [21] | Adaptive Quality Measure-Based Approach (Proposed Method) |
|---|
| Accuracy | 79.2 | 95.72 | 97.67 |
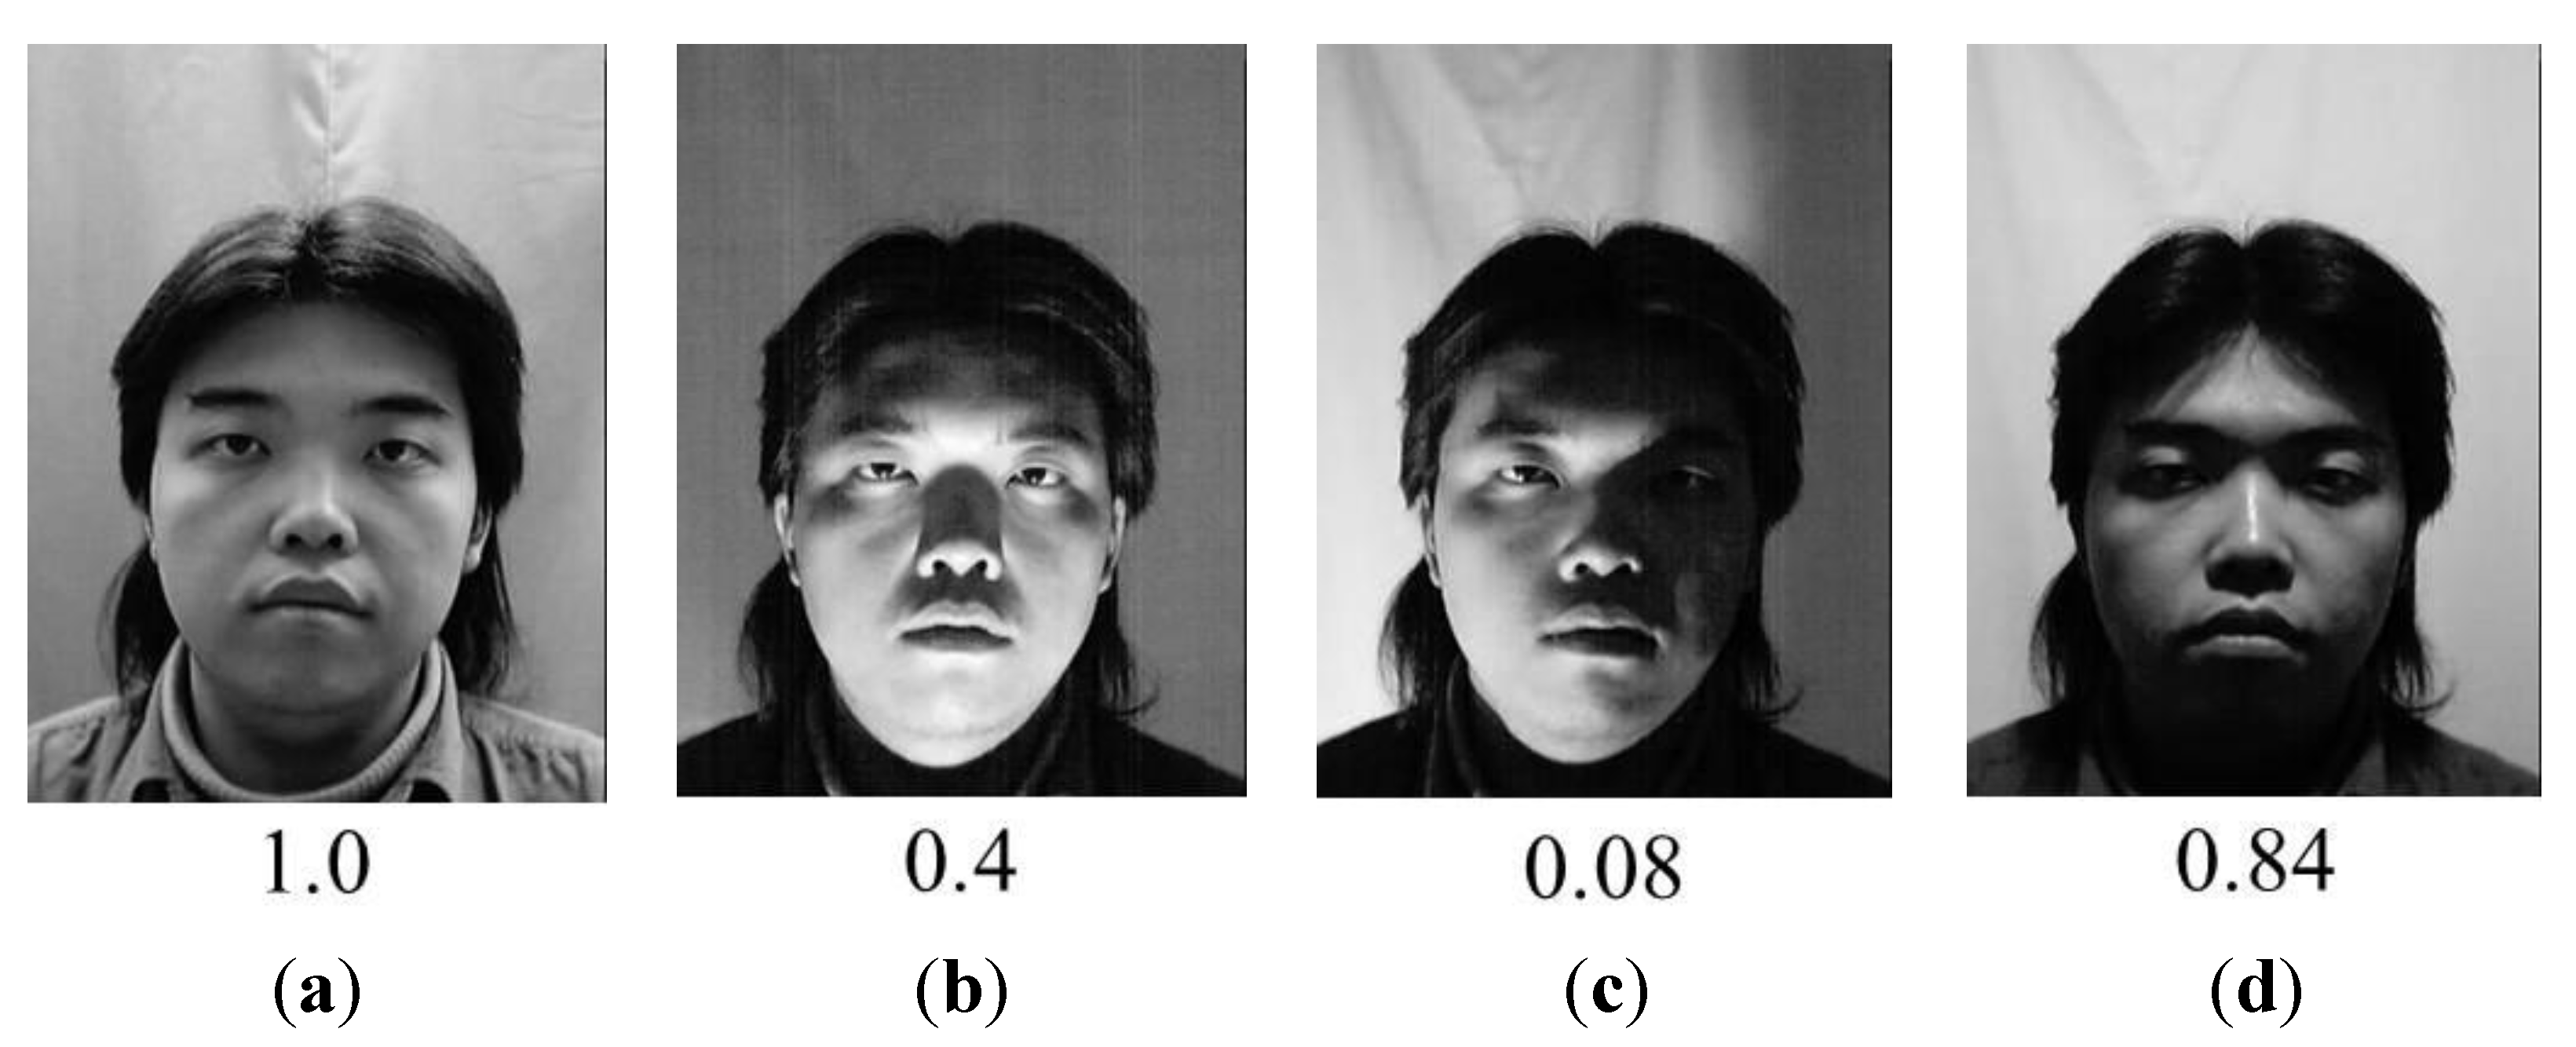
Because we consider the TV watching environment in doors, the case that user’s face is so dark that the facial features cannot be discriminative does not occur in our experiments. However, we consider the cases that shadows exist on both sides of face or in the entire face to a degree as shown in
Figure 25b,d. Each number below
Figure 25a–d represents the QM value (
of Equation (4)) of illumination. As shown in
Figure 25, the
of the case without shadows (
Figure 25(a)) is higher than those of the case of shadows on both sides of face (
Figure 25b) or in the entire face (
Figure 25d). In addition, the
of
Figure 25a is higher than that of the case of shadows in the right side of face (
Figure 25c). The reason why the
of
Figure 25a is higher than those of
Figure 25b,d is that it is difficult that the shadows are uniform on the both sides of the face due to the 3 dimensional shape of face even if shadows on both sides of face or in the entire face. Therefore, the
(based on the difference between the average values of left and right sides of the face) becomes larger than that without shadow of
Figure 25a.
From these results, we can find that our QM of illumination ( of Equation (4)) can produce the correct quality value with the face images including the shadows on both sides of face or in the entire face to a degree.
Figure 25.
Examples of the value according to the illumination condition with Database II: (a) uniform illumination; (b) shadows on both sides of face; (c) shadows on right side of the face; (d) shadows in the entire face.
Figure 25.
Examples of the value according to the illumination condition with Database II: (a) uniform illumination; (b) shadows on both sides of face; (c) shadows on right side of the face; (d) shadows in the entire face.
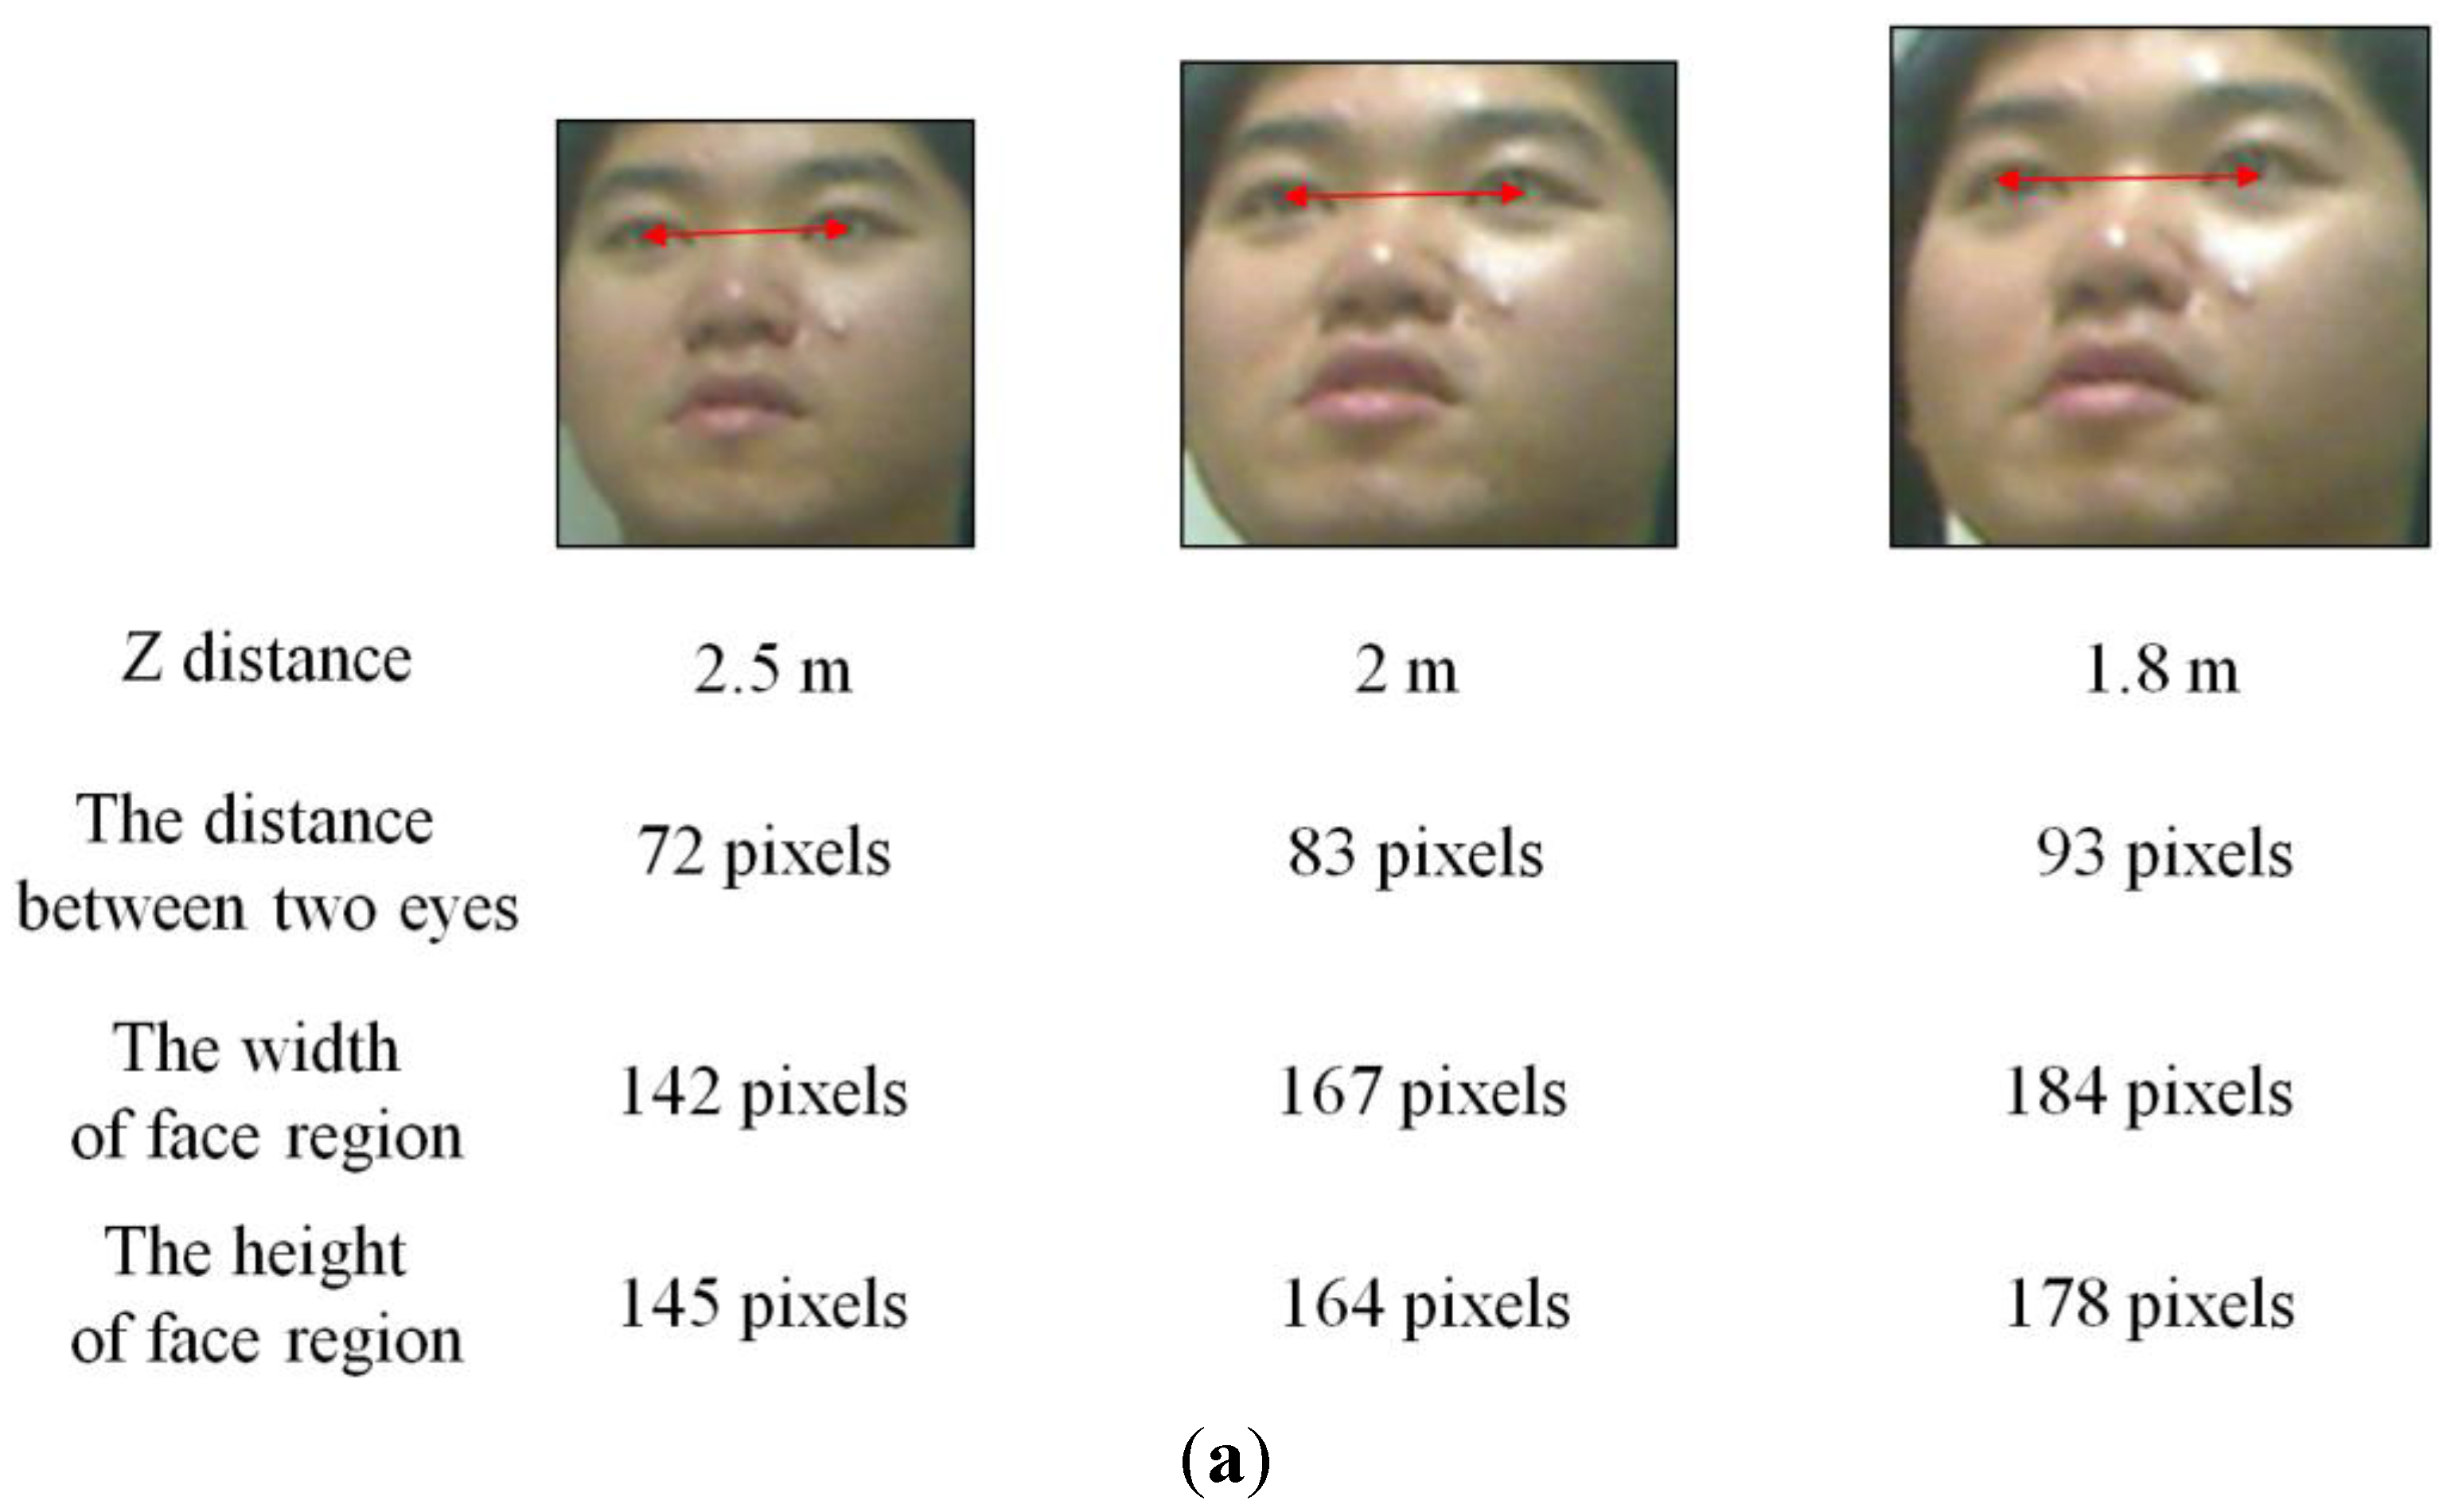
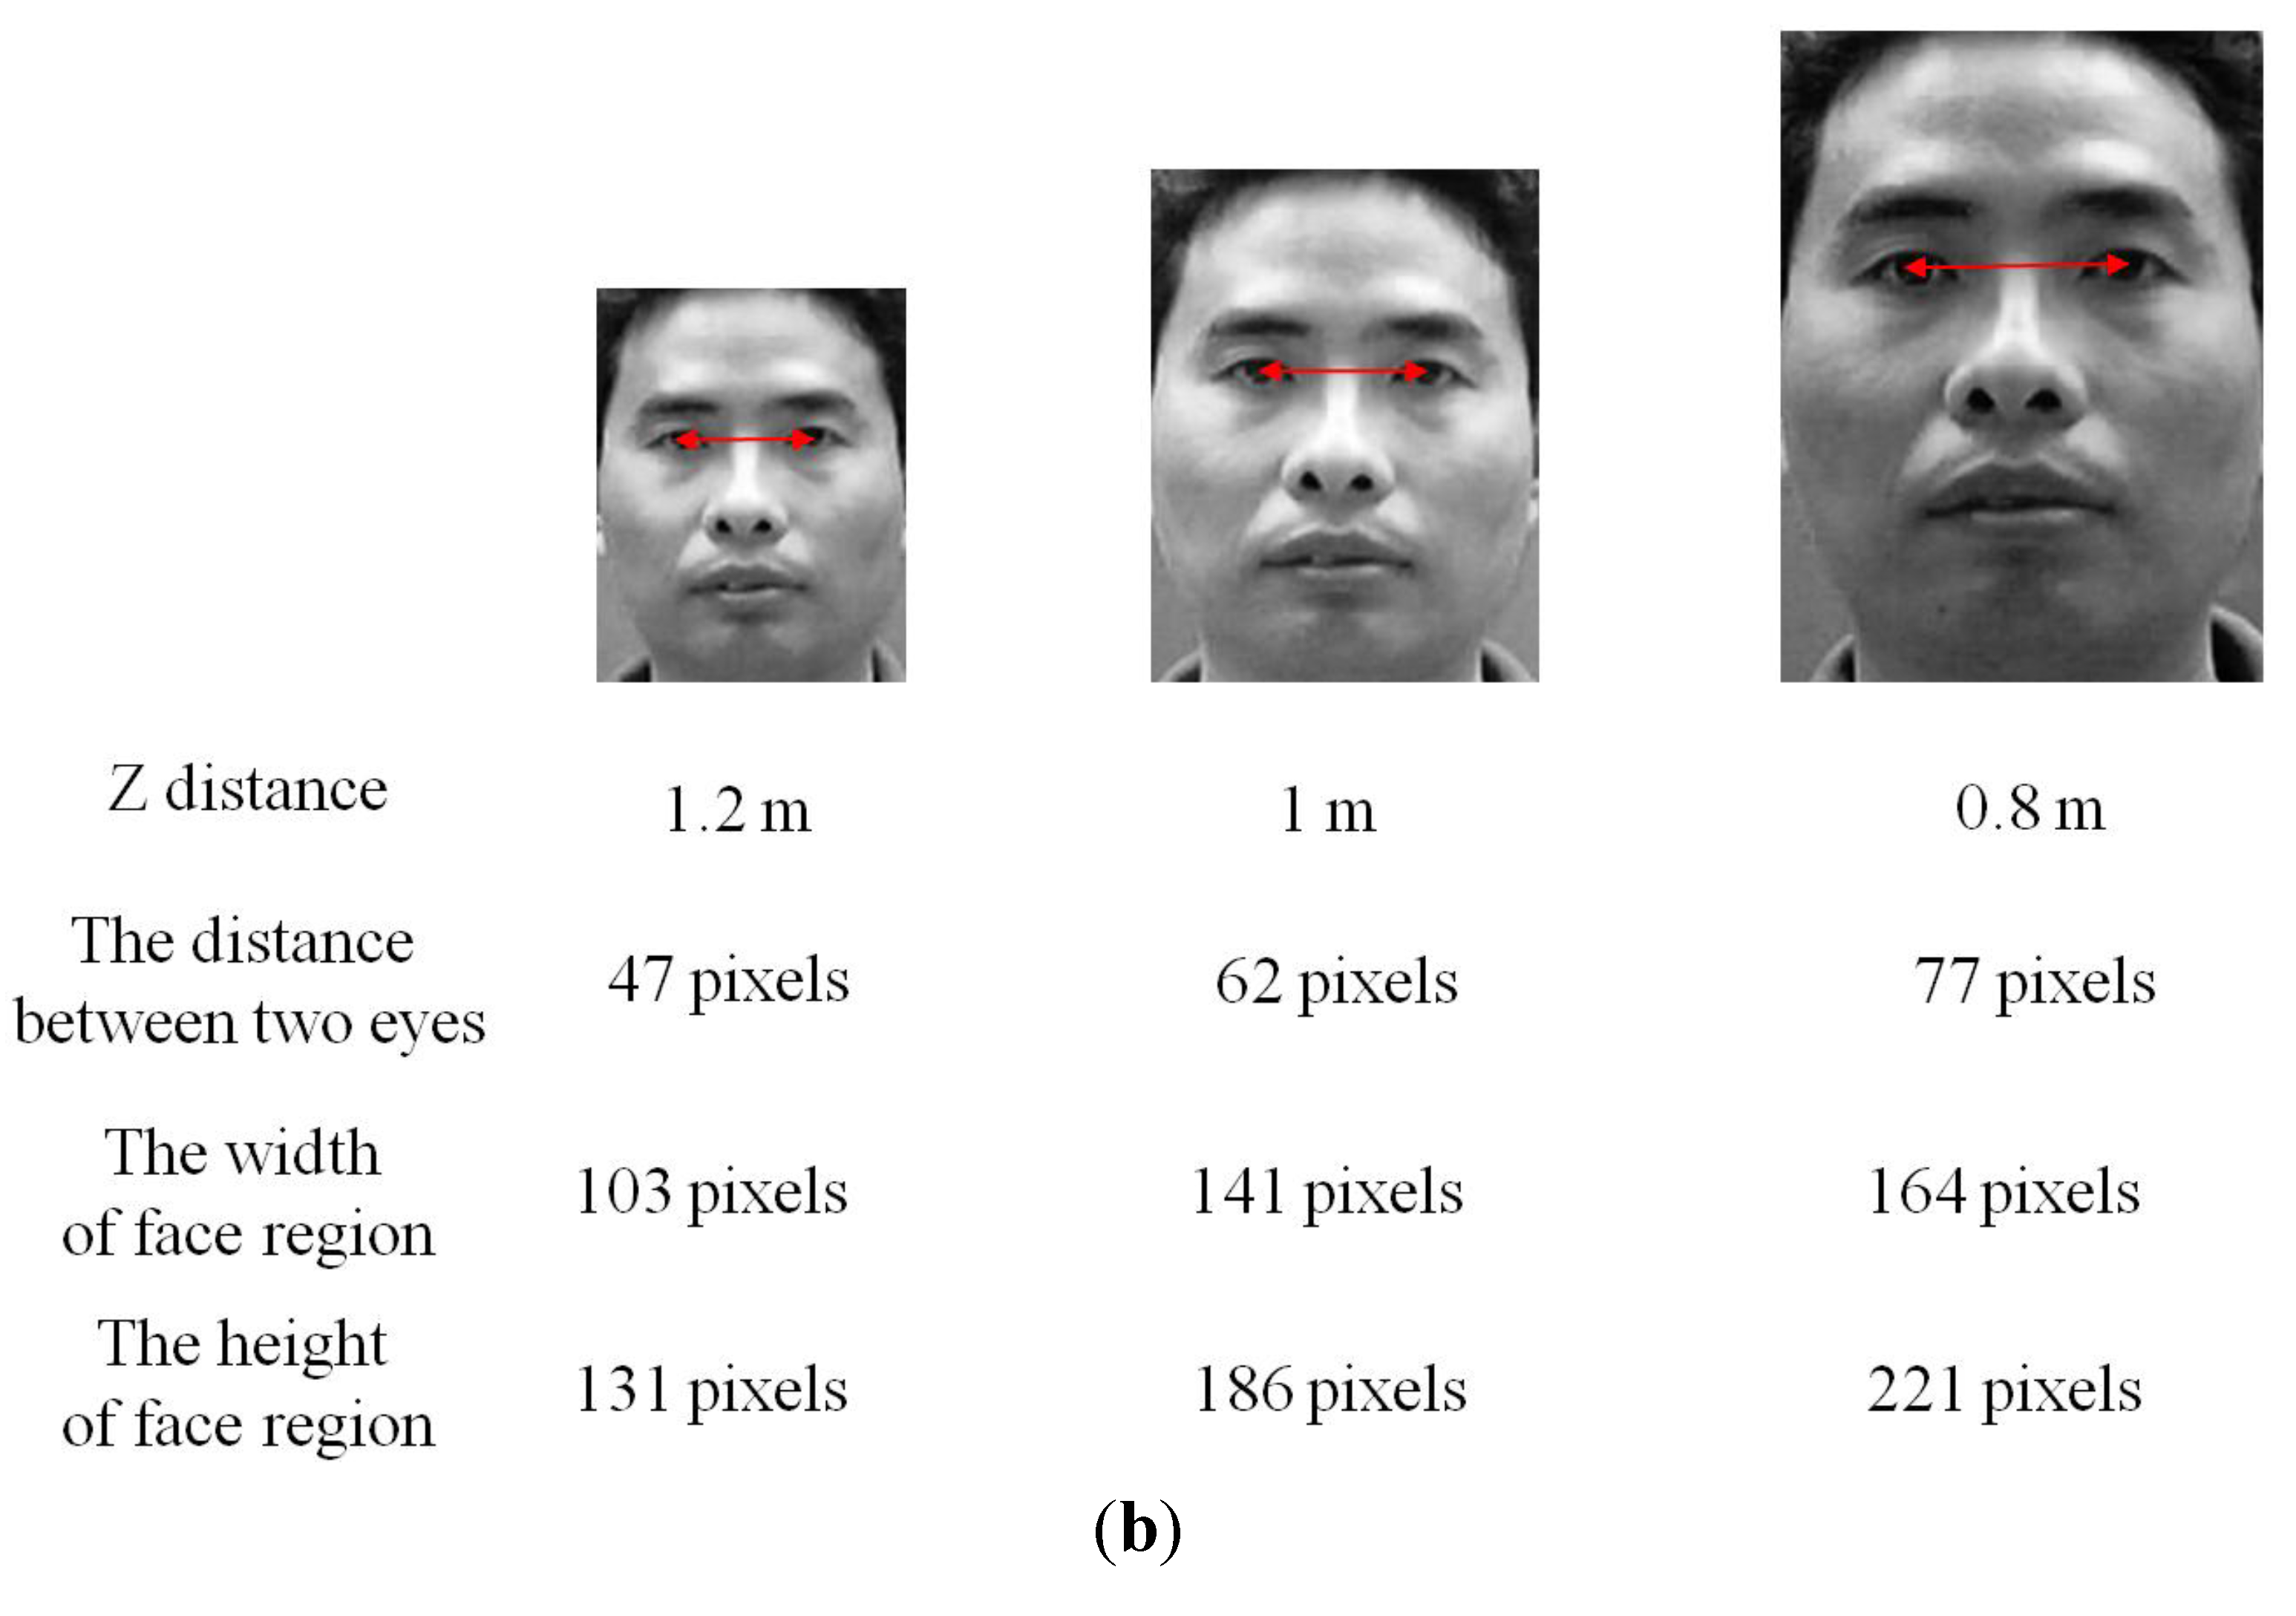
Generally, an image of higher resolution is regarded as containing more information than that of lower resolution. Likewise, the face images of high-resolution are preferred to those of low-resolution in terms of recognition. This is because the face images of high-resolution can yield better recognition results. As shown in
Figure 22 and
Figure 26, the nearer the Z distance between a user and TV is, the larger the size of face box becomes, which increases the inter-distance between two detected eyes and the image resolution (width and height) of face region. Therefore, the inter-distance between two detected eyes has almost proportional relationship with the image resolution. Based on these characteristics, we measure the distance between two detected eyes as QM (
) (explained in
Section 2.3.6) and assign the higher score to the face image of higher resolution.
The accurate detection of eye regions has influence on the performance of three QMs (head pose (
explained in
Section 2.3.1), openness of the eyes (
explained in
Section 2.3.4), and image resolution (
explained in
Section 2.3.6)). In addition, the performance of QM (
) is also affected by the accuracy of nose detection.
Figure 26.
Relationship between the inter-distance between two eyes and image resolution of face region: (a) examples from our own database; (b) examples from database II.
Figure 26.
Relationship between the inter-distance between two eyes and image resolution of face region: (a) examples from our own database; (b) examples from database II.
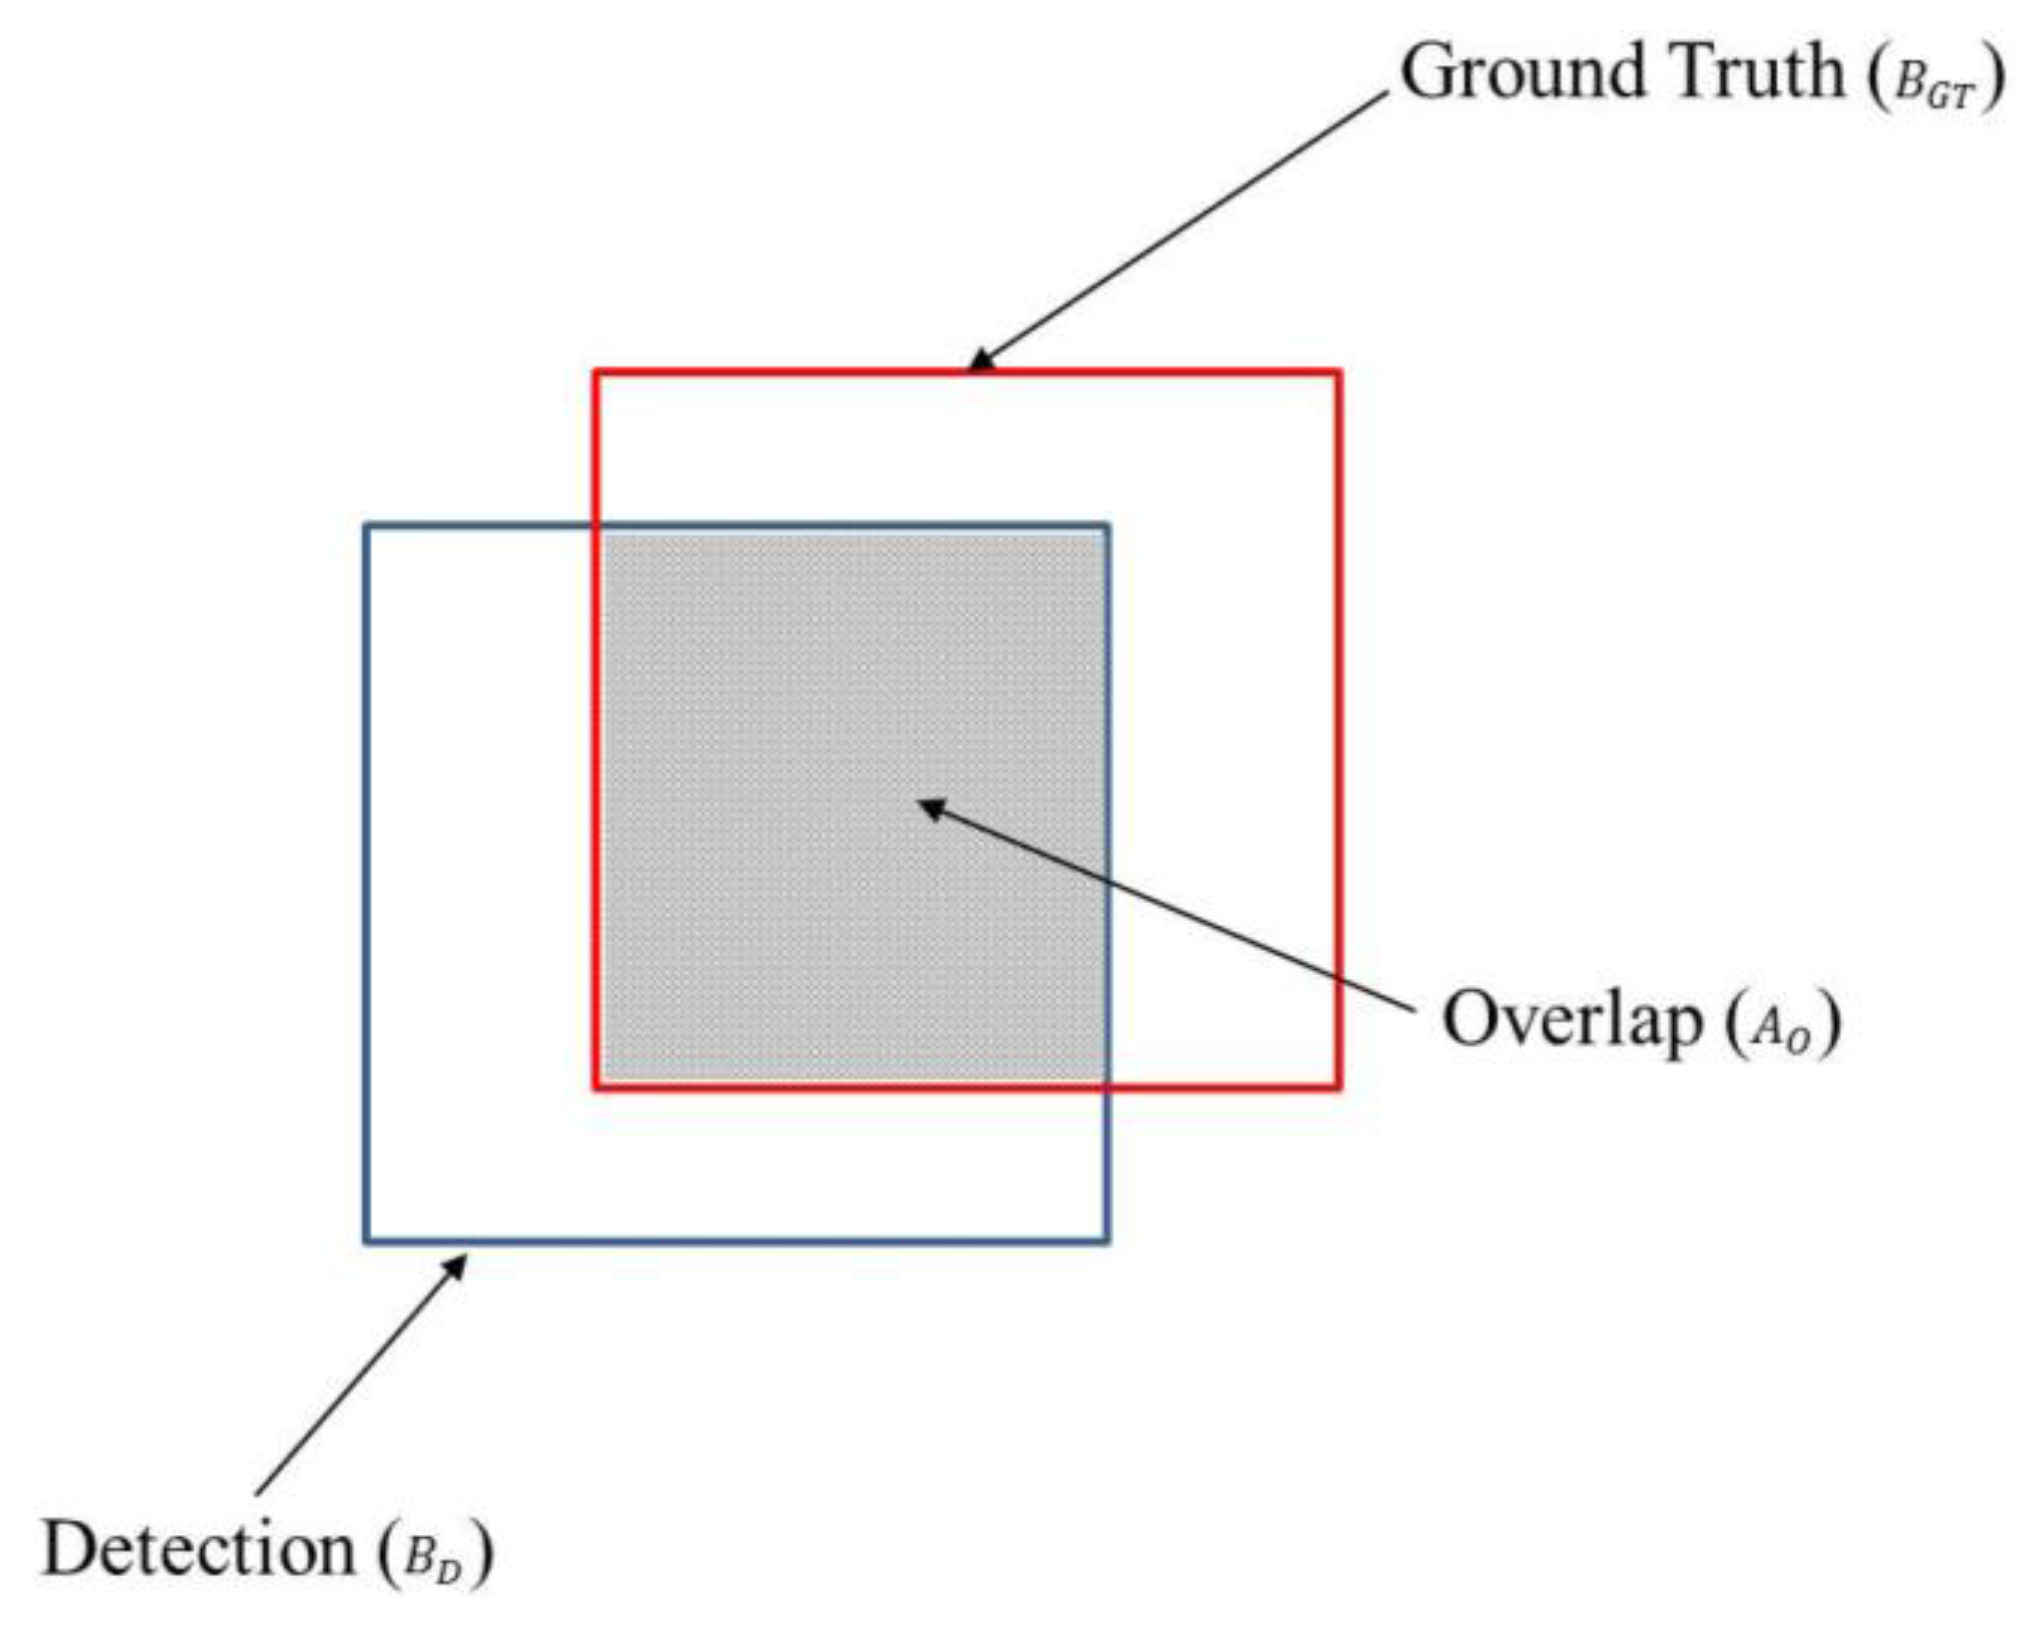
As the next experiments, we measured the accuracies of face, eye and nostril detection. For this, we manually depicted bounding boxes on the face (eye or nostril) areas in the images as ground truth regions. The detection results were evaluated using the Pascal overlap criterion [
57]. In order to judge true/false positives, we measured the overlap of the detected and ground truth boxes. If the area of overlap (
) between the detected box (
) and ground truth box (
) of
Figure 27 exceeds 0.5 using Equation (10), we count the result as a correct detection.
where
denotes the intersection of the detected and ground truth boxes and
is their union [
57].
Figure 27.
Overlapped area of ground truth and detected boxes.
Figure 27.
Overlapped area of ground truth and detected boxes.
Based on the Equation (10), we can count the number of true positive and false positive detection cases. Here, true positive means that the faces (eyes or nostrils) are correctly detected as faces (eyes or nostrils), and false positive is the case where non-faces (non-eyes or non-nostrils) are incorrectly detected as faces (eyes or nostrils). Consequently, the accuracies of face, eye and nostril detection are measured using the following Equations (11) and (12) [
58],
where
is the number of faces (eyes or nostrils),
is the number of true positives, and
is the number of false positives. As shown in Equations (11) and (12), the maximum and minimum values of the recall and precision are 1 and 0, respectively. The higher values of the recall and precision represent a higher accuracy of the detection of face (eye or nostril).
Experimental results showed that the recall and precision of face detection were 99.5% and 100%, respectively. In addition, with the images where face regions were successfully detected, the recall and precision of eye detection were 99.73% and 100%, respectively, and those of nostril detection were 99.67% and 100%, respectively.
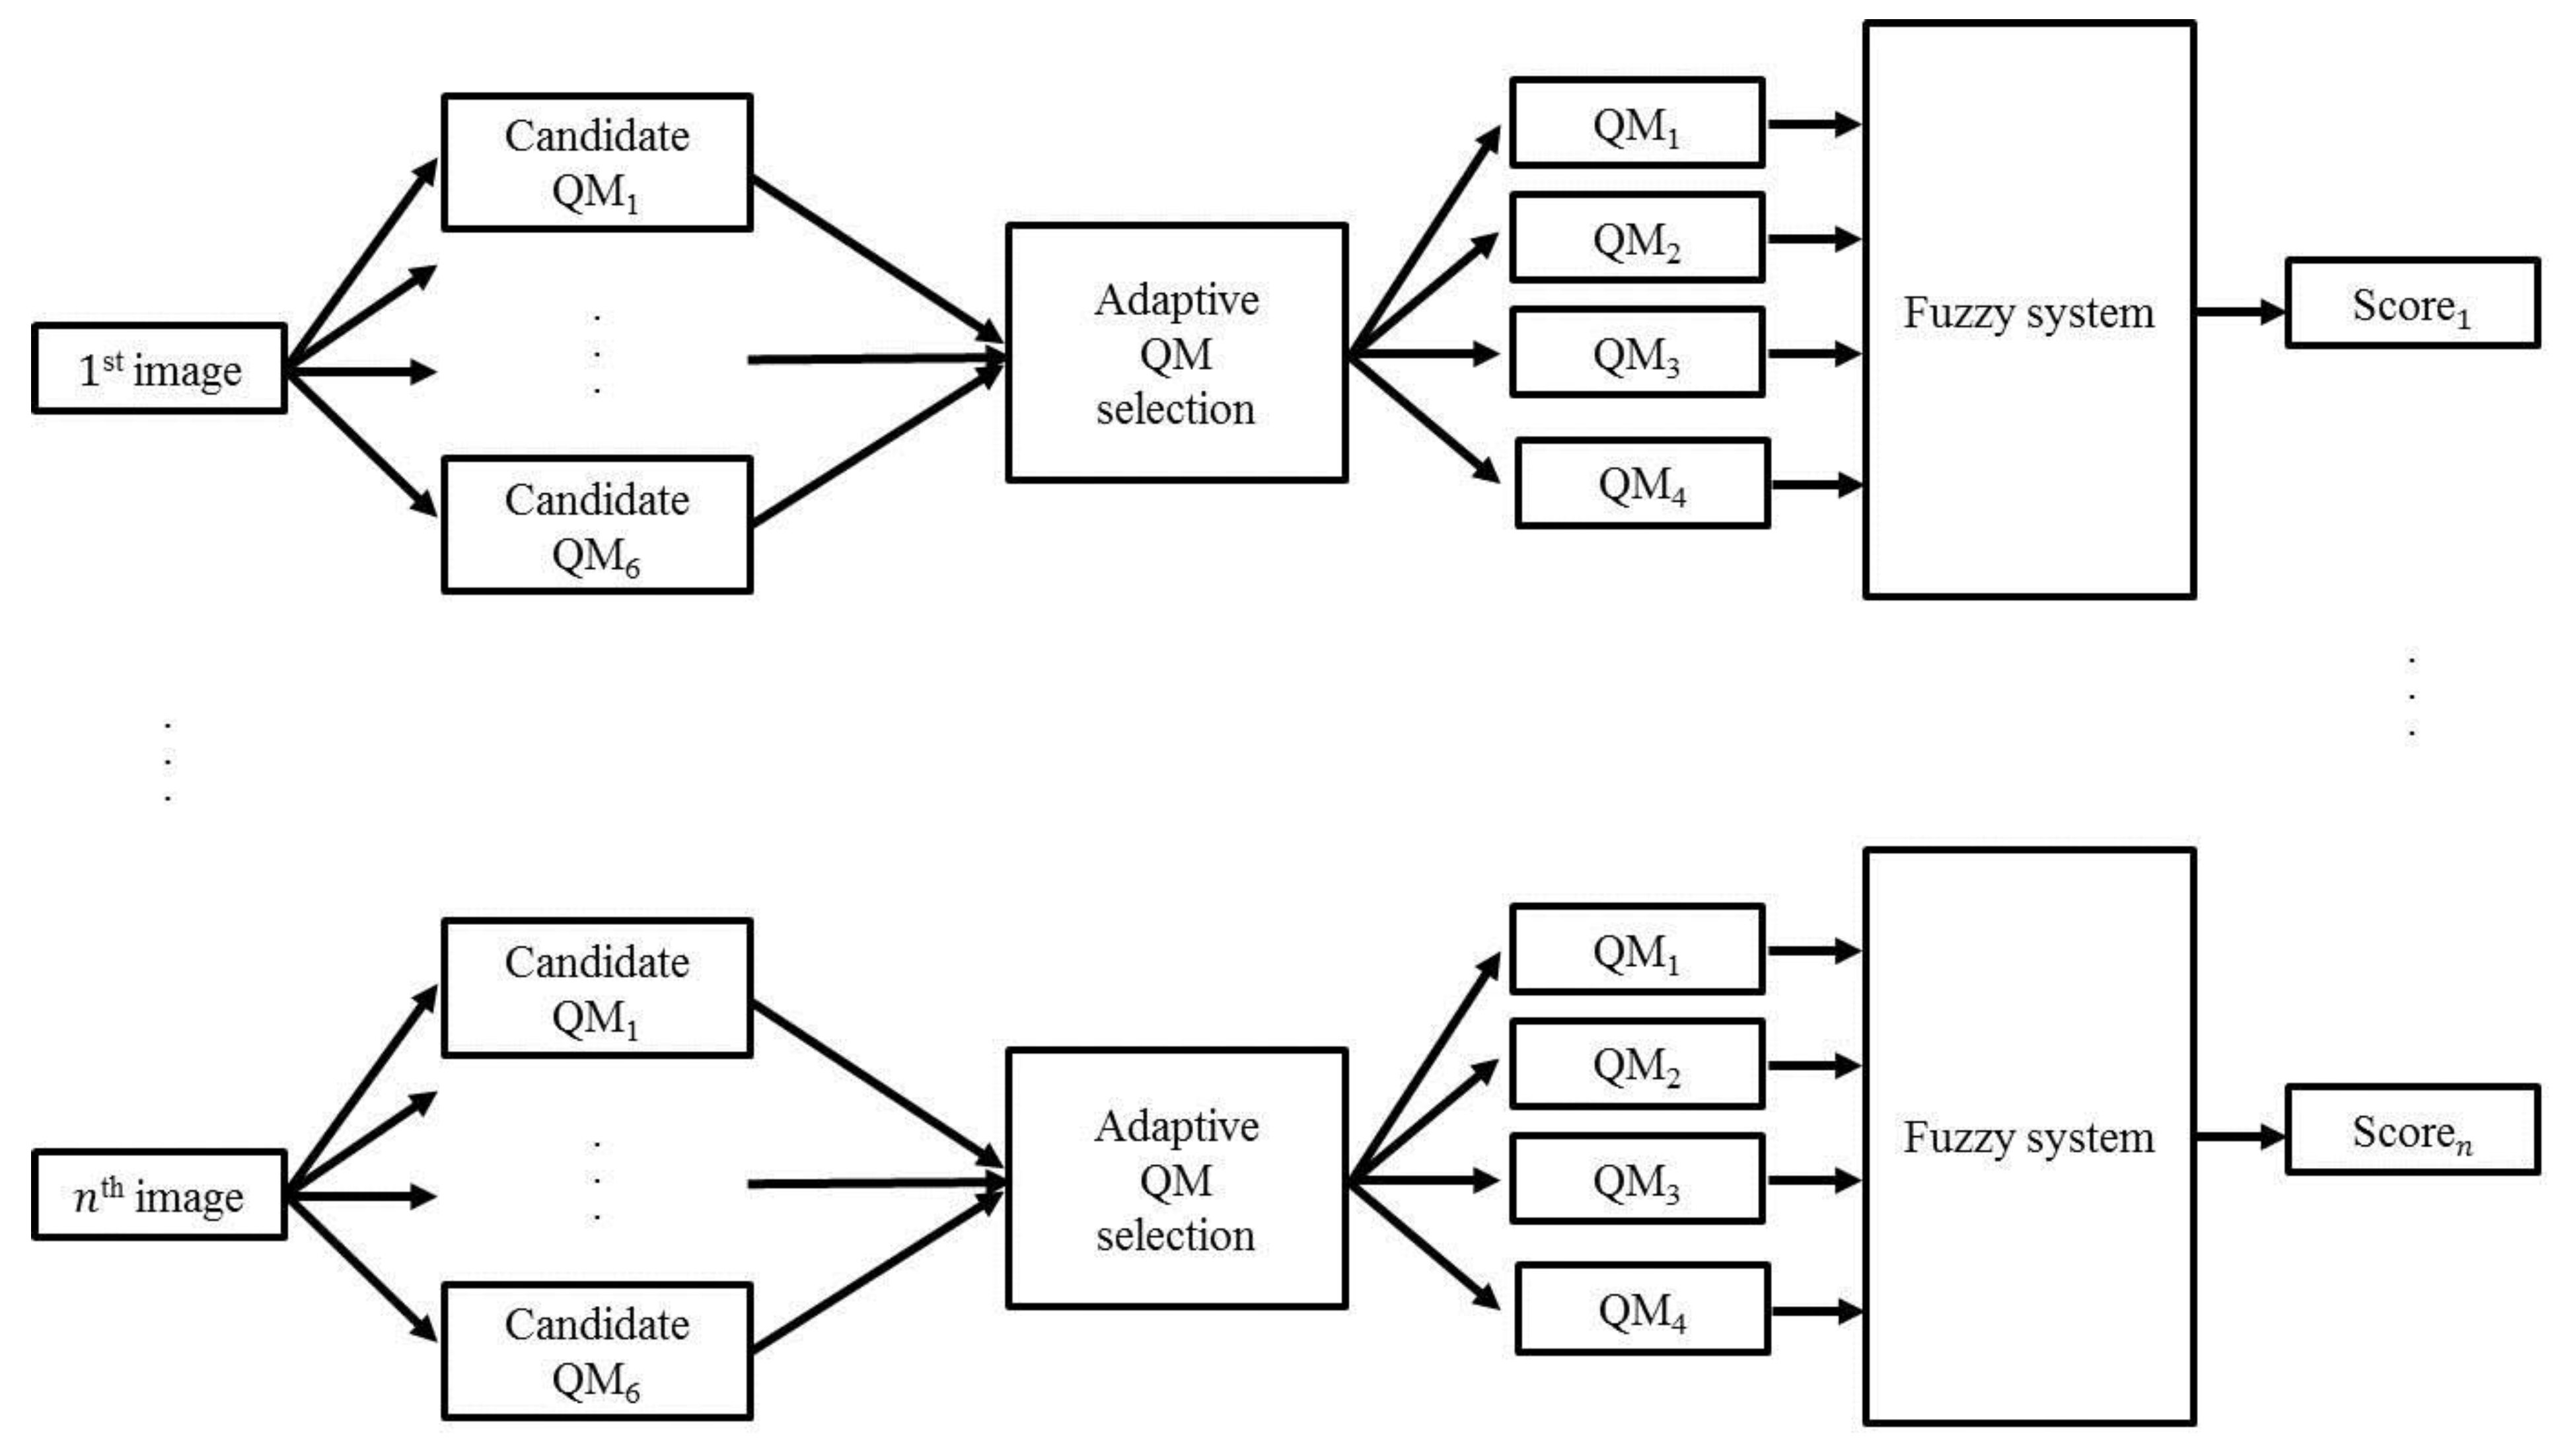
In general, the optimization of the quality metrics can be performed by principal component analysis (PCA), linear discriminant analysis (LDA), or neural network,
etc. However, most of these methods require the additional training procedure with training data, which makes the performance of system be affected by the kinds of training data. In order to solve this problem, we obtain the optimal weight (quality score) of the face image by using the schemes of adaptive QM selection and fuzzy system as shown in
Figure 6. Because these schemes do not require the additional (time-consuming) training procedure, the performance of our method is less affected by the kinds of database, which was experimentally proved with two databases (our own database and Database II) as shown in
Table 5 and
Table 6.
As shown in
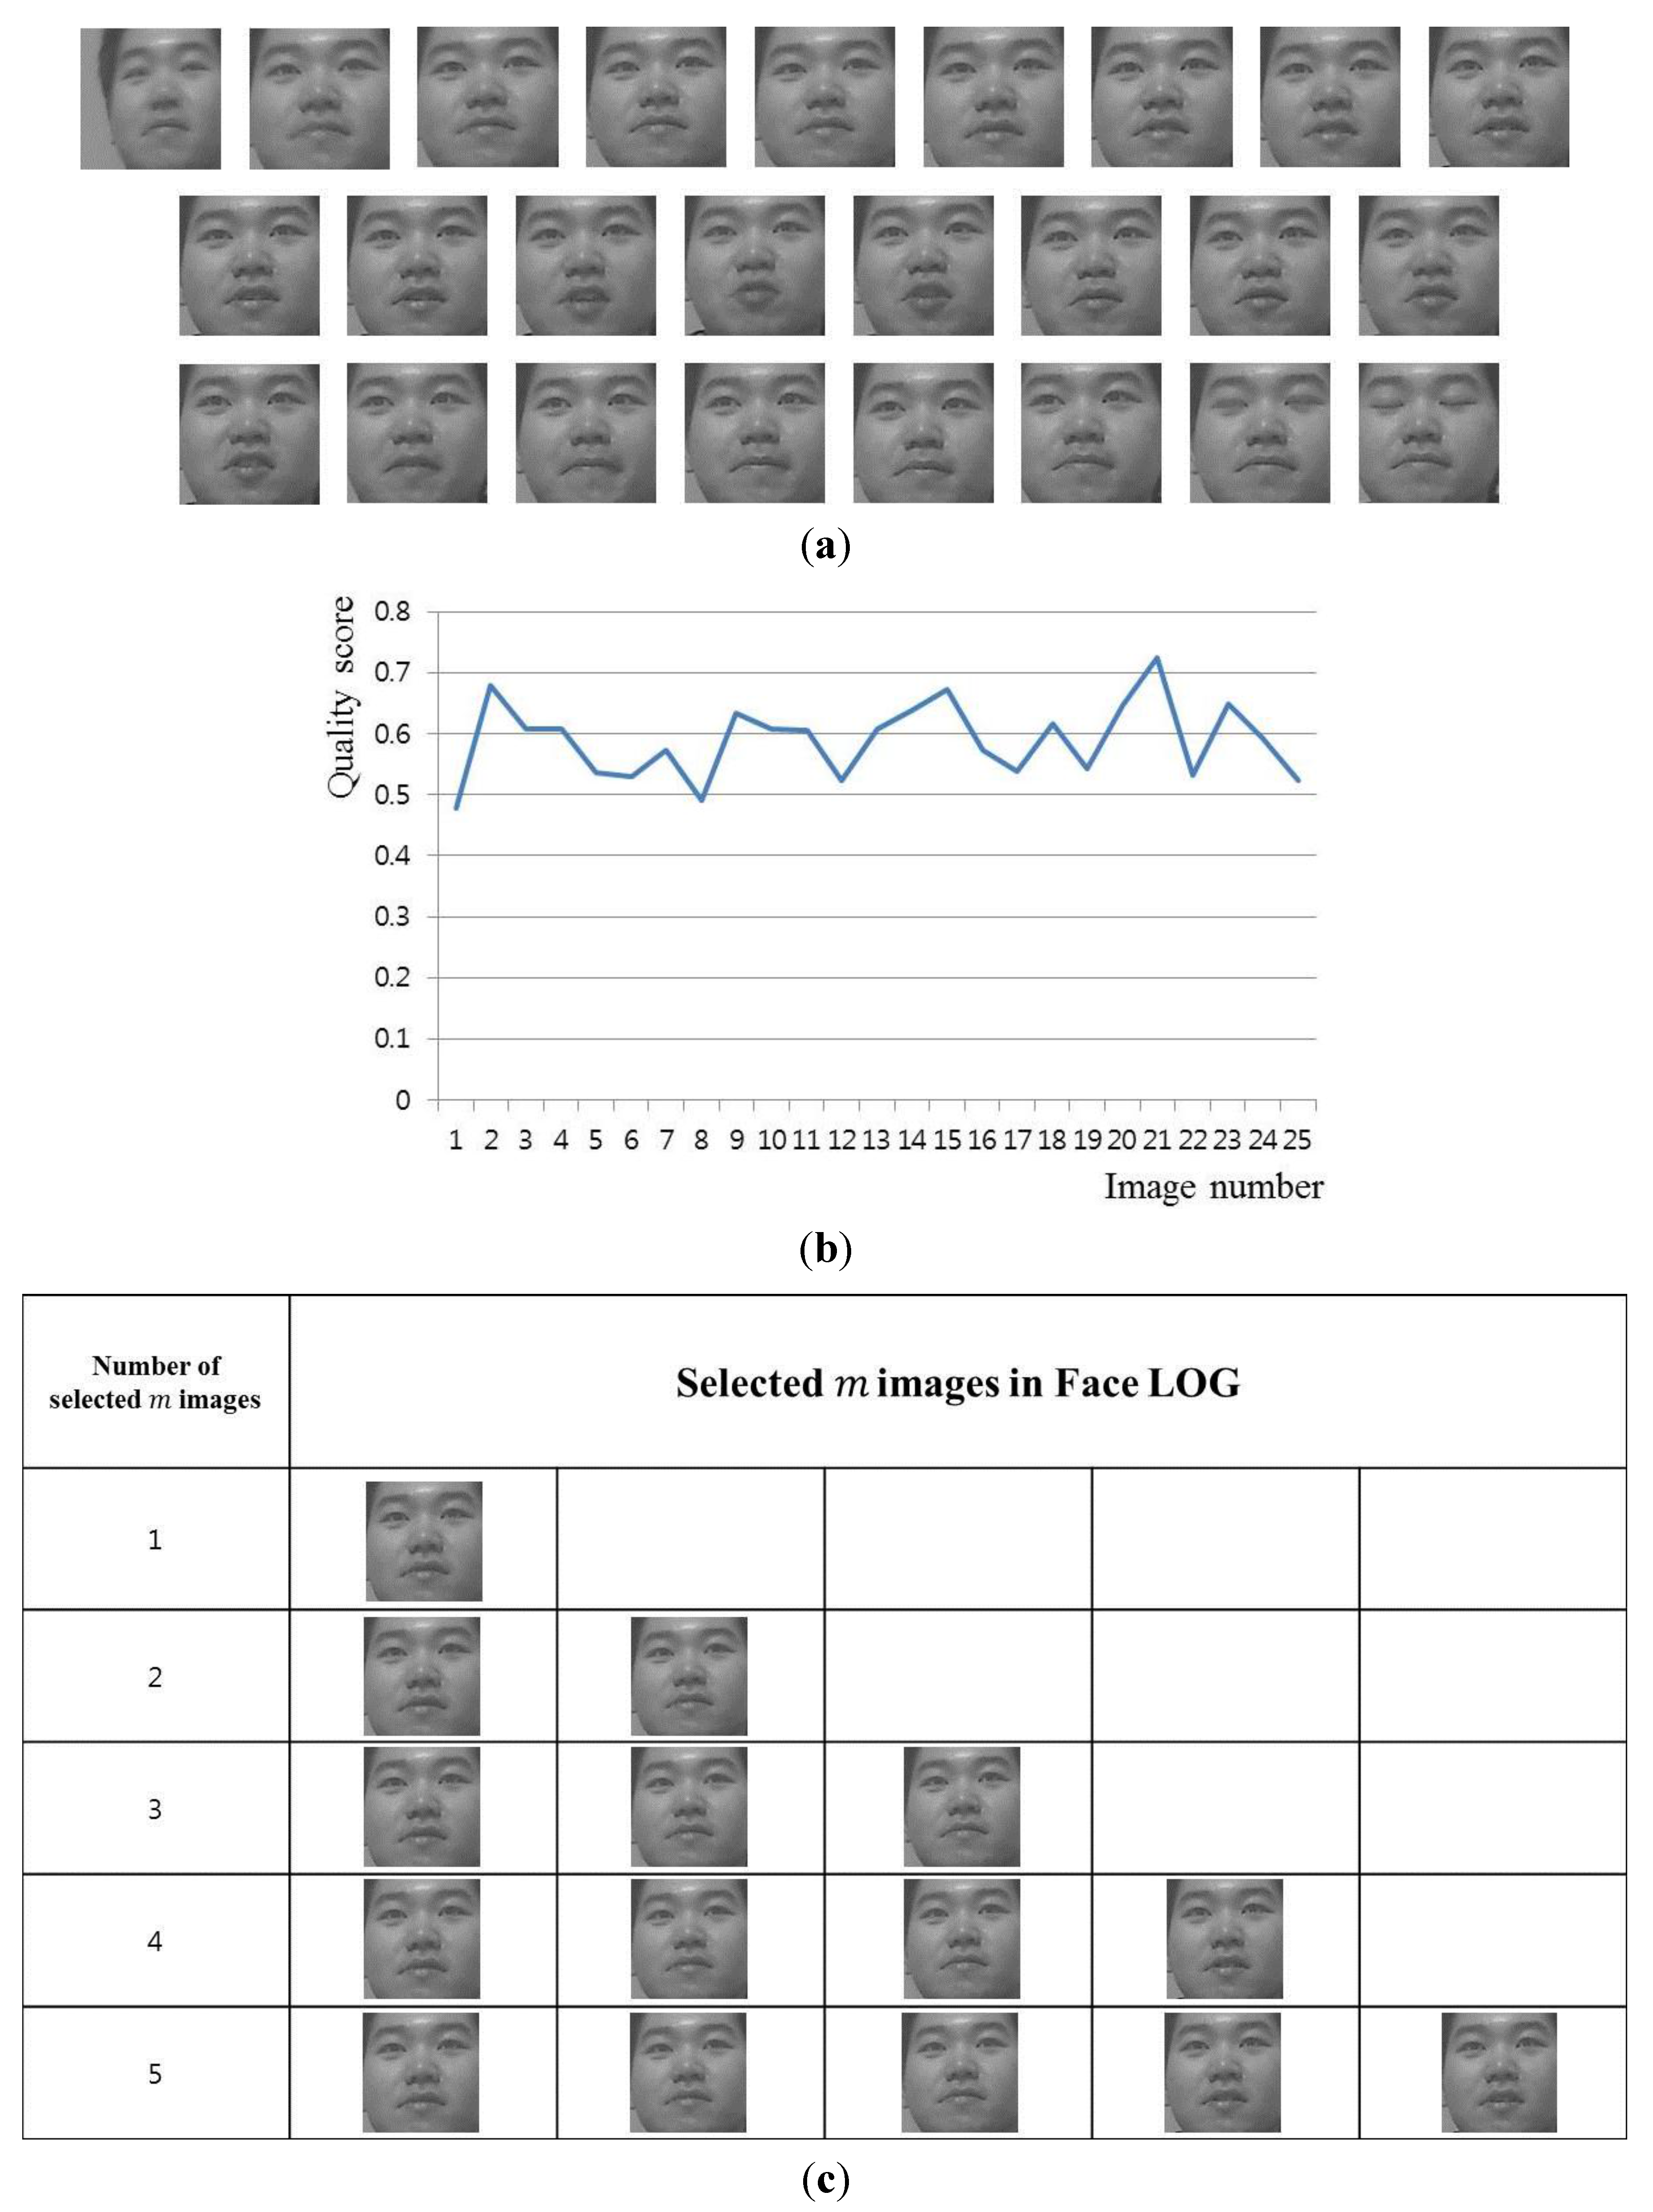
Figure 28, we show the correlation of the matching score (similarity) by face recognition and quality score. In both the matching score and quality score, the higher values represent the higher matching similarity and better quality, respectively. With the 25 face images of
Figure 28a, we show the graph of correlation between the quality scores (which are obtained by our method of
Figure 6) and the matching scores (by our face recognition method of multi-level binary pattern (MLBP) of
Figure 12) as shown in
Figure 28b. The values of the quality score and matching score are respectively normalized so as to be represented in the range from 0 to 1.
Figure 28b shows that these two scores are much correlated. In addition, we calculate the correlation value between the quality scores and matching scores. The calculated correlation value is about 0.87. The correlation value ranges from −1 to 1. 1 and −1 mean the positive and negative correlation cases, respectively. 0 represents the uncorrelated case [
59,
60]. Based on the correlation value, we can find that the quality scores are much correlated to the matching scores by face recognition, and the higher quality score corresponds to the good face recognition. The reason why there are no error bars in
Figure 28b is that this figure shows one example where the correlation coefficient between quality scores and matching scores is obtained from the data of a single human individual.
Figure 28.
Example of a video sequence and correlation between the matching score by face recognition and quality score: (a) all the 25 images in a video sequence; (b) the graph of correlation between the quality scores and matching scores.
Figure 28.
Example of a video sequence and correlation between the matching score by face recognition and quality score: (a) all the 25 images in a video sequence; (b) the graph of correlation between the quality scores and matching scores.
Although the weighted quality fusion approach can be considered as an alternative, this approach usually requires the weight values for fusion. The weight values can be determined by the experience of developer, but it cannot guarantee the optimal weight values to be determined irrespective of the variety of input data. To solve this problem, the weight values should be obtained through the time-consuming training procedure, which makes the performance of system be affected by the kinds of training data. However, our fuzzy-based fusion approach of image quality has the advantage of being less affected by the types of face databases because it does not perform an additional training procedure, which was experimentally proved with two databases (our own database and Database II) as shown in
Table 7 and
Table 8. This is the reason why we choose fuzzy approach over weighted quality metrics.
In general, the quality metrics which should have higher weights can be changed according to the kinds of database. As shown in
Figure 14, the quality metrics of head pose (
of Equation (2)) and openness of eye (
of Equation (6)) are more dominant than others because the variations of head pose and eye openness/closure are frequent in our database. However,
Figure 24 shows that the quality metrics of illumination (
of Equation (4)) and contrast (
of Equation (7)) are more dominant than others because the variations of illumination and contrast are frequent in Database II. Therefore, the quality metrics which should have higher weights can be changed according to the kinds of database, and our method (based on adaptive QM selection and fuzzy-based fusion as shown in
Figure 6) can select the optimal quality metrics and quality score considering the variety of database. In addition, this was experimentally proved with two databases (our own database and Database II) as shown in
Table 7 and
Table 8.


