Abstract
With the rapid growth of smart TV, the necessity for recognizing a viewer has increased for various applications that deploy face recognition to provide intelligent services and high convenience to viewers. However, the viewers can have various postures, illumination, and expression variations on their faces while watching TV, and thereby, the performance of face recognition inevitably degrades. In order to handle these problems, video-based face recognition has been proposed, instead of a single image-based one. However, video-based processing of multiple images is prohibitive in smart TVs as the processing power is limited. Therefore, a quality measure-based (QM-based) image selection is required that considers both the processing speed and accuracy of face recognition. Therefore, we propose a performance enhancement method for face recognition through symmetrical fuzzy-based quality assessment. Our research is novel in the following three ways as compared to previous works. First, QMs are adaptively selected by comparing variance values obtained from candidate QMs within a video sequence, where the higher the variance value by a QM, the more meaningful is the QM in terms of a distinction between images. Therefore, we can adaptively select meaningful QMs that reflect the primary factors influencing the performance of face recognition. Second, a quality score of an image is calculated using a fuzzy method based on the inputs of the selected QMs, symmetrical membership functions, and rule table considering the characteristics of symmetry. A fuzzy-based combination method of image quality has the advantage of being less affected by the types of face databases because it does not perform an additional training procedure. Third, the accuracy of face recognition is enhanced by fusing the matching scores of the high-quality face images, which are selected based on the quality scores among successive face mages. Experimental results showed that the performance of face recognition using the proposed method was better than that of conventional methods in terms of accuracy.
1. Introduction
With the rapid development of smart TVs, these are being used for various functionalities such as TV broadcasting, social network service (SNS), video on demand (VOD), television-commerce (T-commerce), and teleconferencing services. Recently, the applications of smart TV have been diversified for viewers’ usability, and many commercialized smart TVs are equipped with a camera to provide intelligent services and high convenience to viewers [1,2,3]. In particular, user identification is required for some services such as T-commerce and T-banking in a smart TV environment. Considering the convenience of the viewers, biometrics can be used to provide user identification. As a typical example of biometric techniques, face recognition is a reasonable solution in a smart TV environment because it does not require the viewer to come in contact with the special sensor on the TV but can be executed only by the camera of the smart TV. Therefore, this can easily facilitate the use of face recognition in many applications with high convenience. However, the viewer can have various facial poses, illumination, and expression variations while watching TV, and the performance of face recognition is inevitably degraded due to these factors. There have been many studies focusing on these problems.
Two main approaches for face recognition that are robust to illumination changes have been proposed. One of them is to represent images with features that are insensitive to illumination changes [4,5]. The other approach is to construct a low-dimensional linear subspace for face images by considering different lighting conditions [6,7]. Pose variability is usually regarded as the most challenging problem in the field of face recognition. There are different algorithms for dealing with the pose variation problem [8]. In general, they can be categorized as follows: (1) the approach of extracting invariant features; (2) the multiview-based approach; and (3) the approach of using a three-dimensional (3D) range image. The approach of extracting invariant features uses some features in a face image that do not change under pose variation [9,10,11]. The multiview-based approach stores a variety of view images in the database to handle the pose variation problem or to synthesize new view images from a given image. Recognition is then carried out using both the given image and the synthesized images [12,13,14]. Face recognition from 3D range images is another approach being vividly studied by researchers. Because the 3D shape of a face is not affected by illumination and pose variations, the face recognition approach based on 3D shape has evolved as a promising solution for dealing with these variations.
The above approaches can handle some variations on face but still have drawbacks that restrict their application. That is, since some features invariant to one variation can be sensitive to other variations, it is difficult to extract features that are completely immune to all kinds of variation. Thus, it is unsafe to heavily rely on the selection of invariant features for a particular variation. These limitations of single image-based face recognition have motivated the development of video-based face recognition [15,16].
There are some major advantages of video-based face recognition. First, spatial and temporal information of faces in a video sequence can be used to improve the performance of single image-based face recognition. Second, recent psychophysical and neural researches have shown that dynamic information is very important for the human face recognition process [17]. Third, with additional information of various poses and face size, we can acquire more effective representations of faces such as a 3D face model [18] or super-resolution images [19], which can be used to improve the recognition performance. Fourth, video-based face recognition can adopt online learning techniques to update the model over time [20]. Even though there are obvious advantages of video-based recognition, there are some disadvantages such as the successive face images captured can have the factors of poor video quality, low image resolution, and pose, illumination, and expression variations. In spite of all these advantages and disadvantages, various kinds of approaches for video-based face recognition have been implemented.
A simple way to process the faces in a video sequence is to keep and use all the images in the sequence for face recognition. However, the use of all images of the video sequence can incur steep computational costs and does not guarantee optimal performance. Moreover, parts of these face images in the sequence are useless because of motion blur, non-frontal pose, and non-uniform illumination. Therefore, a method that chooses the best face images in terms of quality is required for a video sequence. This is based on face quality assessment (FQA), and the set of high-quality face images is denoted as Face Log [21]. Since the performance of face recognition is affected by multiple factors, the detection of one or two quality measures (QMs) is insufficient for FQA. An approach to simultaneously detect multiple QMs is the use of a fusion of QMs for FQA. Hsu et al. proposed a framework to fuse individual quality scores into an overall score, which is shown to be correlated to the genuine matching score (the matching score when an input face image is correctly matched with the enrolled one of the same person) of face recognition engine [22]. Many studies adopted a weighted quality fusion approach to combine QMs, and these weighted values for fusion were experimentally determined or obtained through training [23,24,25,26,27]. In addition, Anantharajah et al. used a neural network to fuse QM scores, where the neural network was trained to produce a high score for a high-quality face image [28]. On the other hand, Nasrollahi et al. proposed a method that uses a fuzzy combination of QMs instead of a linear combination [21]. A fuzzy inference engine was adopted for improving the performance without training, but a few fixed QMs were used in this method. In addition, they provided only the accuracy of quality assessment by their method, not showing the performance enhancement of face recognition.
All the previous studies used a few fixed QMs, and their measures are difficult to reflect primary factors that influence the performance of face recognition. For example, although some QMs that can assess facial pose and illumination variation are selected in a face recognition system, if other factors (such as blurring and expression variation) occur in the system, the performance of face recognition degrades.
Therefore, in this study, QMs are adaptively selected by comparing variance values obtained from candidate QMs within a video sequence, where the higher the variance value by a QM, the more meaningful is the QM in terms of a distinction between images. Therefore, the selected QMs can reflect primary factors that influence the performance, and the fusion of QMs is carried out by a symmetrical fuzzy system. Based on the selected high-quality images (Face Log), the performance of the proposed method is enhanced by fusing matching scores.
Table 1 shows a summary of comparisons between methods discussed in previous research and the proposed method.

Table 1.
Comparison of previous and proposed methods.
| Category | Method | Strength | Weakness | ||
|---|---|---|---|---|---|
| Single image- based method |
|
|
| ||
| Video-based method | Not using image selection |
|
|
| |
| Selecting Face Log based on QMs | Using fixed QMs | Training for fusion [22,23,27,28] |
|
| |
| No training for fusion [21,24,25,26] |
|
| |||
| Adaptive selection of QMs and fusion of quality score without training (proposed method) |
|
| |||
2. Proposed Method
2.1. Overview of Proposed Method
Figure 1 shows the environment where the proposed face recognition system for smart TVs is applied. We used a universal serial bus (USB) camera of visible light (Webcam C600 by Logitech Corp. [29]) with an additional fixed (focal) zoom lens (1.75×), and the resolution of the captured image is 1600 × 1200 pixels with 3 (RGB) bytes per pixel. In our system, the camera has the interface of USB 2.0, and its maximum bandwidth is lower than 480 Mb/s. Therefore, the capturing speed of our camera is about 10 frames/s due to the limitation of the bandwidth of the USB interface. The Z distance between the user and the camera is 2–2.5 m, and the size of the TV screen is 60 inches.
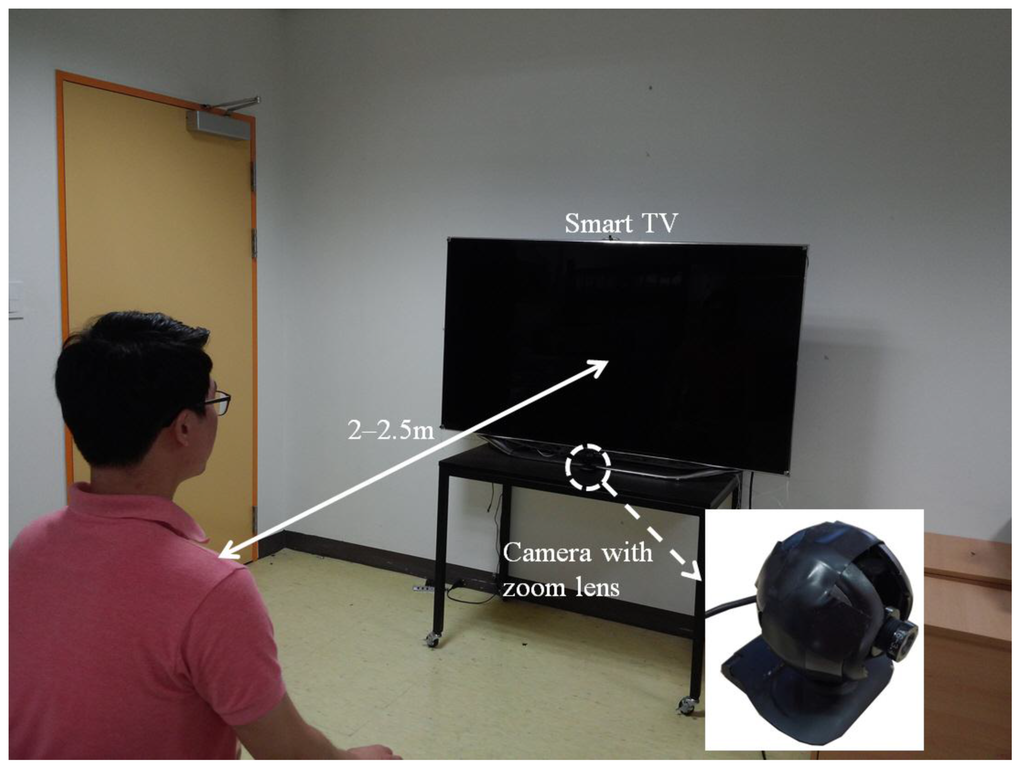
Figure 1.
Environment in which the proposed face recognition system for smart TVs is used.
Figure 2 shows an overview of the proposed method. In the initial enrollment stage, we capture RGB color images of the user at a predetermined Z distance of 2 m (Step 1 in Figure 2) [30]. In Step 2, the user looks at five points (left-top, right-top, center, left-bottom, and right-bottom) on the TV screen by rotating his head. This step facilitates the acquisition of facial features (face texture, eyes, and nostrils) in Step 3, where we can obtain not only the information of facial features but also that of face histogram features according to the various poses of the head. In the recognition stage, RGB color images are captured by the camera (Step 4). In Steps 5 and 6, the face regions of the captured images are detected by the adaptive boosting (Adaboost) algorithm [31], and then, the detected face region is tracked using the continuously adaptive mean shift (CamShift) algorithm [32]. In Step 7, the eye regions are detected by Adaboost and adaptive template matching (ATM) methods, and sub-block-based template matching is performed for nostril detection in Step 8. In addition, our method selects several face images based on the QMs and fuzzy-based quality assessment in Step 9. Finally, in Step 10, face recognition is carried out by fusing the matching scores of the selected images.

Figure 2.
Overall procedure of the proposed method.
The third step addresses human detection in the combined difference image. After applying size filtering and a morphology operation based on the size of the candidate areas, noise is removed. The remaining areas are separated by a vertical and horizontal histogram of the detected regions using the intensity of the background. Detected regions that may have more than two human areas are merged. Therefore, further procedures are performed to separate the candidate regions and to remove noise regions. These are based on the information of the size and ratio (of the height to width) of the candidate regions considering the camera-viewing angle and perspective projection (see the details in Section 2.4). Finally, we obtain the correct human areas.
2.2. Face and Facial Feature Detection
In the proposed method, the five still images are acquired through the initial enrollment stage in order to enhance the accuracy of face recognition irrespective of the head poses. In the initial enrollment stage, the user is in front of the smart TV at a Z distance of 2 m and then, looks at five points on the TV with the head movements. Figure 3 shows the examples of face images in the enrollment stage. The face and eye regions of the captured image are detected using the Adaboost method [31]. In addition, the nostril area is detected using sub-block-based template matching [30]. Based on these facial features (the face, eye, and nostril), we not only save the information of these features to estimate the head pose of the image in the recognition stage but also enroll face histogram features according to the head pose to identify each user.
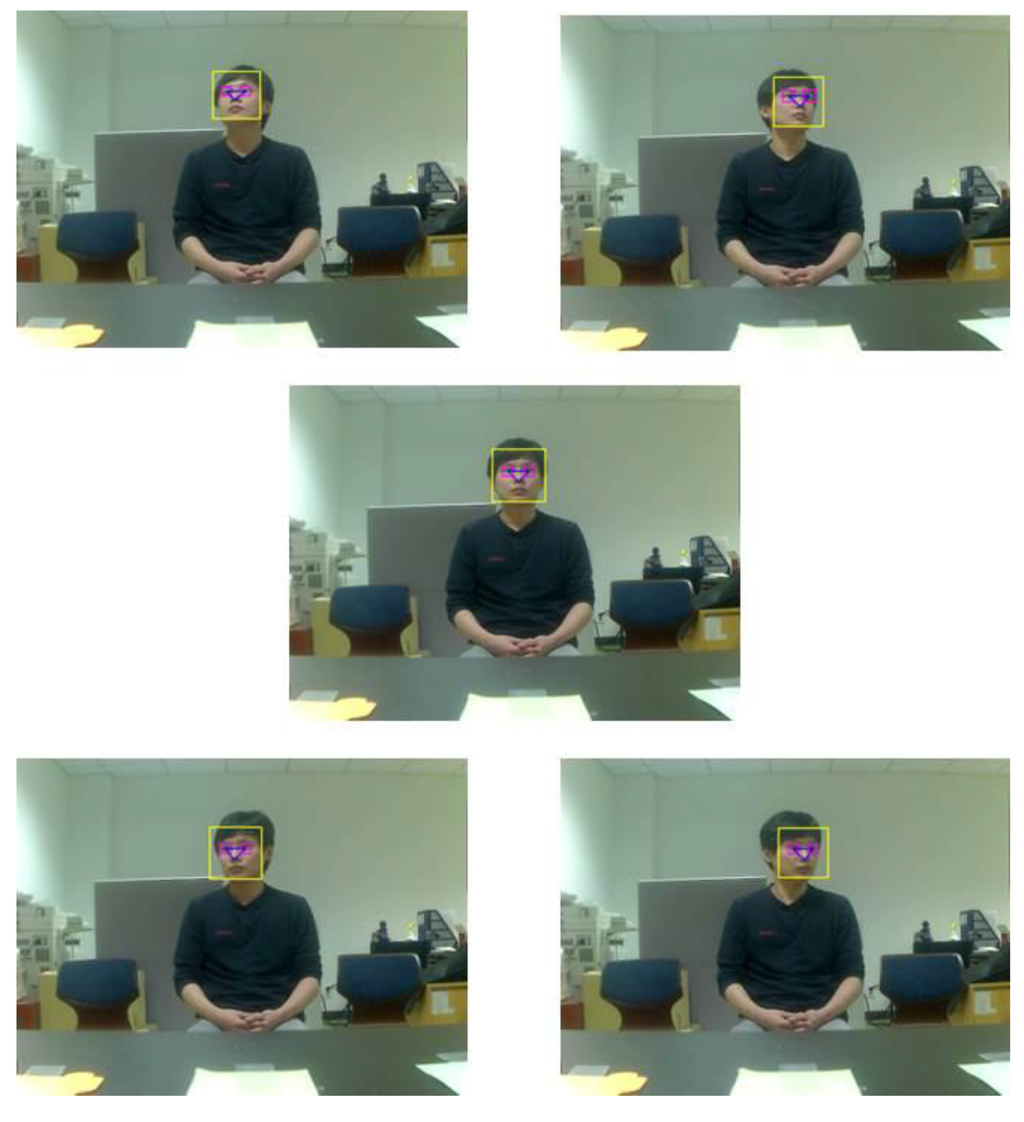
Figure 3.
Face and facial features obtained in the enrollment stage.
In the recognition stage, the information of successive images is used for face detection and tracking as shown in the Steps 5 and 6 of Figure 2. The face region detected by Adaboost is tracked using the CamShift method [30,32]. Even though the Adaboost method has a high detection rate, it is slightly time consuming. On the other hand, face tracking using the CamShift method has the advantages of higher processing speed and of being more robust to head pose variations.
The eyes are detected and tracked using Adaboost and ATM, respectively. Furthermore, the nostril area is detected using a nostril-detection mask based on sub-block-based template matching, and it is tracked using ATM [30]. With these facial features, we can obtain face images for assessing their quality. Figure 4 shows the examples of the detected and tracked face and facial features in the recognition stage.

Figure 4.
Face and facial features obtained in the recognition stage (Steps 5 through 8 of Figure 2).
2.3. Assessing the Quality of Face Images
In order to select high-quality face images, we need to determine a method for their assessment even though the quality of a face image is rather subjective. In this study, we assume that a high quality face image corresponds to the image’s potential for correct identification. This section describes the methods of assessing the quality of face images. Six QMs are used to assess the quality of face images in our research. These QMs are as follows: head pose, illumination, sharpness, openness of the eyes, contrast, and image resolution. We outline these features in the following subsections:
2.3.1. Head Pose
One of the biggest challenges in face recognition is to identify individuals despite variations in the head pose. In general, the out-of-plane rotation (rotation in the horizontal or vertical direction) of face occurs while face recognition is carried out. Therefore, it is important that the QM for the head pose distinguishes between various rotations and assigns a higher score to the image closest to one of enrolled images in terms of the head pose. In this study, we estimate the head pose based on the detected eye and nostril points [30]. In order to estimate out-of-plane rotation, we utilize changes in distances between the two eyes, and those between the eyes and the nostril. Therefore, we calculate the rotation angles in the directions of X (horizontal) and Y (vertical) axes based on the distances between the detected eye and nostril points. As described in Steps 2 and 3 of Figure 2, facial feature points and face histogram features are obtained according to the head pose, and thereby, the head pose in an image in the recognition stage can be measured using the following equation:
where denotes the pose value; , the face image number; and , the pose number that represents one of the five head poses obtained in the enrollment stage. The calculated rotation angles in the directions of X and Y axes are and with respect to the face image in the recognition stage. and are the average rotation angles of all the enrolled users according to head pose . Therefore, we can obtain the final pose value of the -th image, which is the closest head pose value among the five pose values, as follows:
2.3.2. Illumination Based on the Symmetrical Characteristics of Left and Right Face Regions
Variations caused by illumination changes are regarded as another significant challenge in face recognition. When a face is evenly lit up, shadows or a saturated area does not appear and uniform illumination exists in the entire face region. Based on this hypothesis, we divide the face region into left and right regions and then, calculate the difference between average values of each region by using the following equation:
where denotes the average value of a face region. represents the pixel value at the position () of the -th image, and and denote the height and width of the image, respectively. represents the illumination value based on the difference between the average values of the left and right face regions. Based on the symmetrical characteristics of left and right face regions, inevitably becomes small in case of uniform illumination in the entire face region.
2.3.3. Sharpness
A user’s head can usually move in front of the camera. Therefore, it is possible that the captured image is affected by motion blur, which decreases the quality of the image. Thus, defining a QM for sharpness is useful. Blurred images have less sharpness than well-focused images, and they are designed to yield a lower score for QM, as shown in the following equation [28]:
where denotes the pixel value at the position of the t-th image and represents the result of applying a low-pass filter to . By obtaining the difference between and , can reflect the amount of mid- and high-frequency components of .
2.3.4. Openness of the Eyes
In this study, we check the openness of the eyes because information related to the eyes is important for face recognition. We use -tile thresholding method to segment the detected eye image into the eye and background regions. After obtaining the eye region, we use component labeling to remove noise like hair or eyebrows. Finally, the obtained binarized image is projected onto the horizontal axis (-axis), and the histogram of the black pixels is obtained. Figure 5a,b shows the examples of the binarized image and the corresponding histogram of open and closed eyes. As shown in Figure 5a, there are more black pixels in the mid area of the histogram than in the side areas in the case of an open eye (higher standard deviation of the number of black pixels). However, the numbers of black pixels are similar in both the mid and side areas in the case of a closed eye, as shown in Figure 5b (lower standard deviation of the number of black pixels).
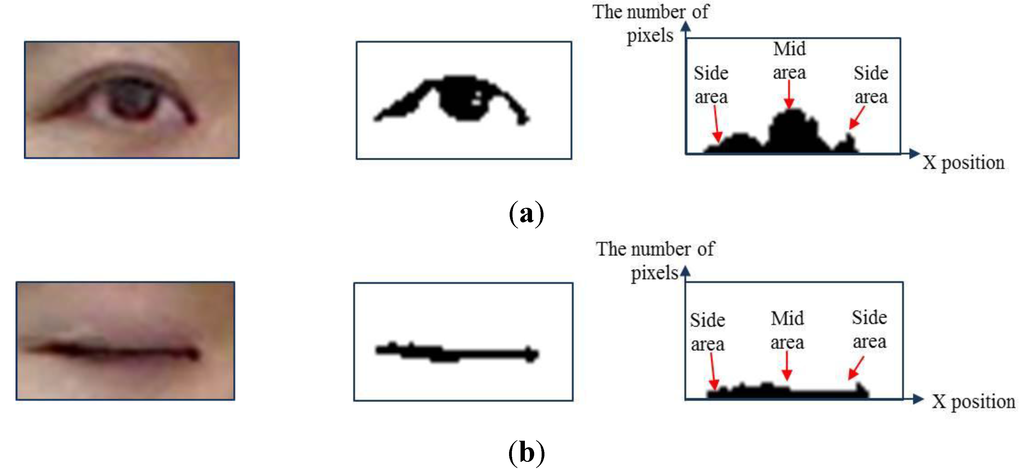
Figure 5.
Examples of the binarized image and the corresponding histogram of open and closed eyes: (a) open eye; (b) closed eye.
Based on this characteristic, the standard deviation of the number of black pixels is calculated using the following equation:
where denotes the openness value calculated using the standard deviation of the number of black pixels projected onto the horizontal axis, and and represent the position of a projected pixel and the range of the histogram, respectively, as shown in Figure 5a,b. indicates the number of black pixels at the -th position, and refers to the average of the number of black pixels. As shown in Figure 5a,b, we can estimate that of the open eye can exhibit a high value, whereas of the closed eye shows a low value.
2.3.5. Contrast
Contrast has a considerable influence on the quality of an image in terms of human visual perception as well as in an image analysis. A poorly illuminated environment affects the contrast and produces an unnatural image. In this study, the contrast value is calculated using the methods discussed in [28,33] as follows:
where and represent histogram bins at which the cumulative histogram has a value that is 75% and 25% of the maximum value, respectively. denotes the intensity range of the image. In general, the histogram of a high-contrast image has a wider range of intensity than that of a low-contrast image. Therefore, increases in the case of a high-contrast image.
2.3.6. Image Resolution
Image resolution is the easiest way to measure image quality. In general, high-resolution face images are preferred to low-resolution ones because such images can yield better recognition results. In order to reflect this characteristic in the quality assessment, we measure the inter-distance between two detected eyes as QM () and assign the highest score to a high-resolution face image.
2.3.7. Normalization of Features for Quality Assessment
In order to compare a face image of a person with another face image of the same person in a video sequence, it is necessary to assign a quality score to each image. Because the ranges of the six QMs (–) are different from each other, we obtain normalized QMs in the range of 0–1 based on the minimum and maximum value of QM. As shown in Section 2.3.1, Section 2.3.2, Section 2.3.3, Section 2.3.4, Section 2.3.5 and Section 2.3.6, a good-quality image shows lower values of and and higher values of –. To make all the values of QMs consistent with each other, we ensure that the good-quality image has higher values of and throughout the normalization procedure.
2.4. Selecting High Quality Face Images Based on Fuzzy System Using Symmetrical Membership Function and Rule Tables Considering the Characteristics of Symmetry
After obtaining the six QMs (–), we adaptively select some of them as primary QMs (reflecting primary factors) that influence the performance of the recognition. This is because the factors degrading the performance of face recognition vary according to the video sequences. For example, in the first video sequence, the factors of illumination and pose variations are dominant, whereas those of variations in image resolution and sharpness become dominant in the second video sequence. Therefore, the use of a fixed number of QMs in all the video sequences cannot cope with these all these factors.
To overcome these problems, we propose a method in which four QMs are adaptively selected by comparing the variance values obtained from the six QMs within a video sequence, where the higher the variance value by a QM, the more meaningful is the QM in terms of a distinction between images. Therefore, these selected QMs can reflect the primary factors that influence the performance.
We use a fuzzy system to combine the values obtained by the four QMs and to obtain the final quality score of the image, as shown in Figure 6. Fuzzy systems are widely used in many applications such as edge detection [34], image segmentation [35,36] because of its aptitude to deal with nonlinearities and uncertainties. For example, Barghout [34] used the fuzzy system for edge detection and recognition. In another example, image segmentation problem was dealt with by a nested two-class fuzzy inference system [35]. In [36], he proposed the method of image segmentation based on iterative fuzzy-decision making.
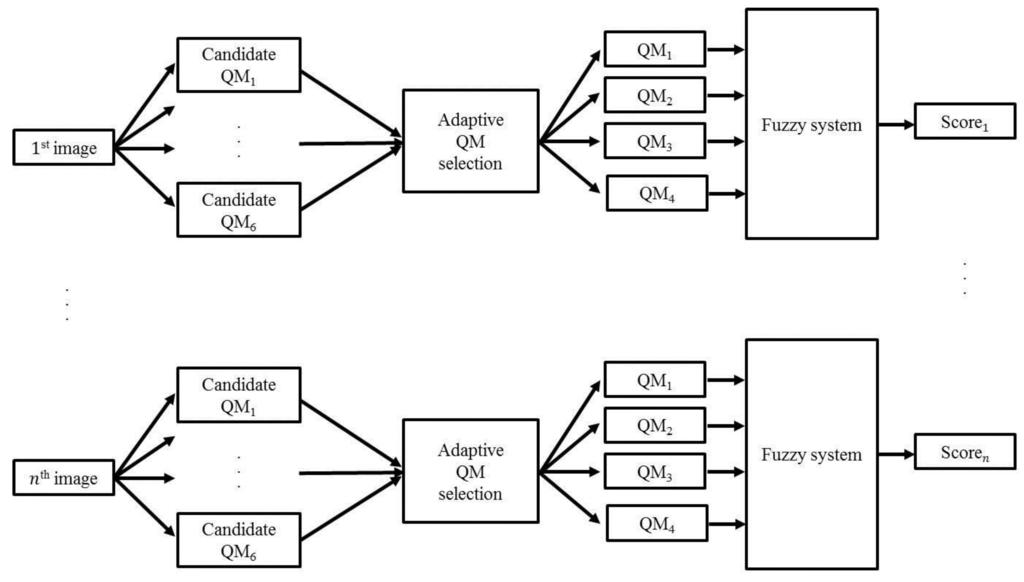
Figure 6.
Procedure for calculating the final quality score of the input image using a fuzzy system.
In order to use the fuzzy system, we use Mamdani’s method [37], which is utilized most commonly in many applications because of its simple structure of “min-max” operations. In addition, the universe of discourse is chosen to be the real number in the range of [0,1] for the input and output membership functions. The shape of membership function is often dependent on its applications, and can be determined through a heuristic process.
In this paper, we use symmetric triangular membership functions for the fuzzy system. There are two reasons for this. The first is that the triangular membership function is simple to implement and fast for computation [38,39]. Another reason is that it is difficult to adopt any particular shape of membership function based on a priori information about the distribution of input and output values. This is because the selected QMs for the fuzzy system are changeable according to the variance value obtained from each QM.
Therefore, the input membership function is designed according to the input value (QM1–QM4), as shown in Figure 7, and henceforth, we will call these QM1–QM4 values as factors 1–4.

Figure 7.
Symmetrical input membership function (SIMF).
The larger the values of factors 1–4, the better the quality of the image is. As shown in Figure 7, the input values of the fuzzy system are categorized into two types: low (L) and high (H). The output membership function of the fuzzy system is designed as shown in Figure 8. Here, the output value (Score in Figure 6) can be categorized as low (L), middle (M), and high (H). In general, the membership function is designed considering the distributions of input features and output values. Because we can assume that the distributions of L and H are similar to each other, we design that the membership functions of L and H become symmetrical based on 0.5. In addition, because we can assume the characteristics of left part of M distribution based on its mean (0.5) is similar to that of right part, the membership function of M is designed to become symmetrical based on its mean (0.5).

Figure 8.
Symmetrical output membership function (SOMF).
As explained earlier, larger values of factors 1–4 represent a higher-quality image. With this hypothesis, we can define the relationships between the input (factors 1–4) and output values (scores) based on the fuzzy rules, as shown in Table 2. For example, if the values of all factors are low (L), image quality is considered to be low, and we assign the output value to be low (L). In addition, if the values of two factors are low (L) and those of the others are high (H), we assign the output value to be middle (M). If the values of all the factors are high (H), the image quality is considered to be high and we assign the output value to be high (H).
Because we consider that all the weights to factors 1–4 are similar, the fuzzy rule table of Table 2 is designed considering the characteristics of symmetry. That is, if output is L with the factors 1–4 of L, L, L, and L, respectively, the output becomes H with the factors 1–4 of H, H, H, and H, respectively. If the output is L with the factors 1–4 of L, H, L, and L, respectively, the output becomes H with the factors 1–4 of H, L, H, and H, respectively.

Table 2.
Designed fuzzy rules of relationships between the input and output values considering the characteristics of symmetry.
| Factor 1 | Factor 2 | Factor 3 | Factor 4 | Output |
|---|---|---|---|---|
| L | L | L | L | L |
| H | L | |||
| H | L | L | ||
| H | M | |||
| H | L | L | L | |
| H | M | |||
| H | L | M | ||
| H | H | |||
| H | L | L | L | L |
| H | M | |||
| H | L | M | ||
| H | H | |||
| H | L | L | M | |
| H | H | |||
| H | L | H | ||
| H | H |
Based on the fuzzy membership functions and the fuzzy rules considering the characteristics of symmetry, we can obtain the output (score). Using the input membership function, one input value of a factor corresponds to two output values, as shown in Figure 9. Since there are four input values (factors 1–4), a total of eight output values can be obtained. For example, we can obtain a pair of two output values (0.2 (L) and 0.8 (H)) that are produced from factor 1 (0.8), as shown in Figure 9. Similarly, if we assume that the value of factors 2–4 is 0.8, same as that of factor 1, we can obtain the following four pairs of two output values: {(0.2 (L), 0.8 (H)), (0.2 (L), 0.8 (H)), (0.2 (L), 0.8 (H)), (0.2 (L), 0.8 (H))} from factors 1–4. From these four pairs, the following sixteen combination pairs of the output values are then obtained: {(0.2 (L), 0.2 (L), 0.2 (L), 0.2 (L)), (0.2 (L), 0.2 (L), 0.2 (L), 0.8 (H)), (0.2 (L), 0.2 (L), 0.8 (H), 0.2 (L)), ···, (0.8 (H), 0.8 (H), 0.8 (H), 0.8 (H))}. With one subset, one output value (0.2 or 0.8) and its symbol (L, M, or H) are determined based on the MIN or MAX method and the fuzzy rules presented in Table 2 [40]. MIN method selects one minimum output value among all values whereas MAX method selects one maximum output value among all values.
For example, we can determine the output value to be 0.8 based on the MAX method with one subset (0.2 (L), 0.2 (L), 0.2 (L), 0.8 (H)). Furthermore, its symbol can be determined as L using Table 2 (where factors 1–4 are L, L, L, and H, respectively, and the output is L, as shown in Table 2).
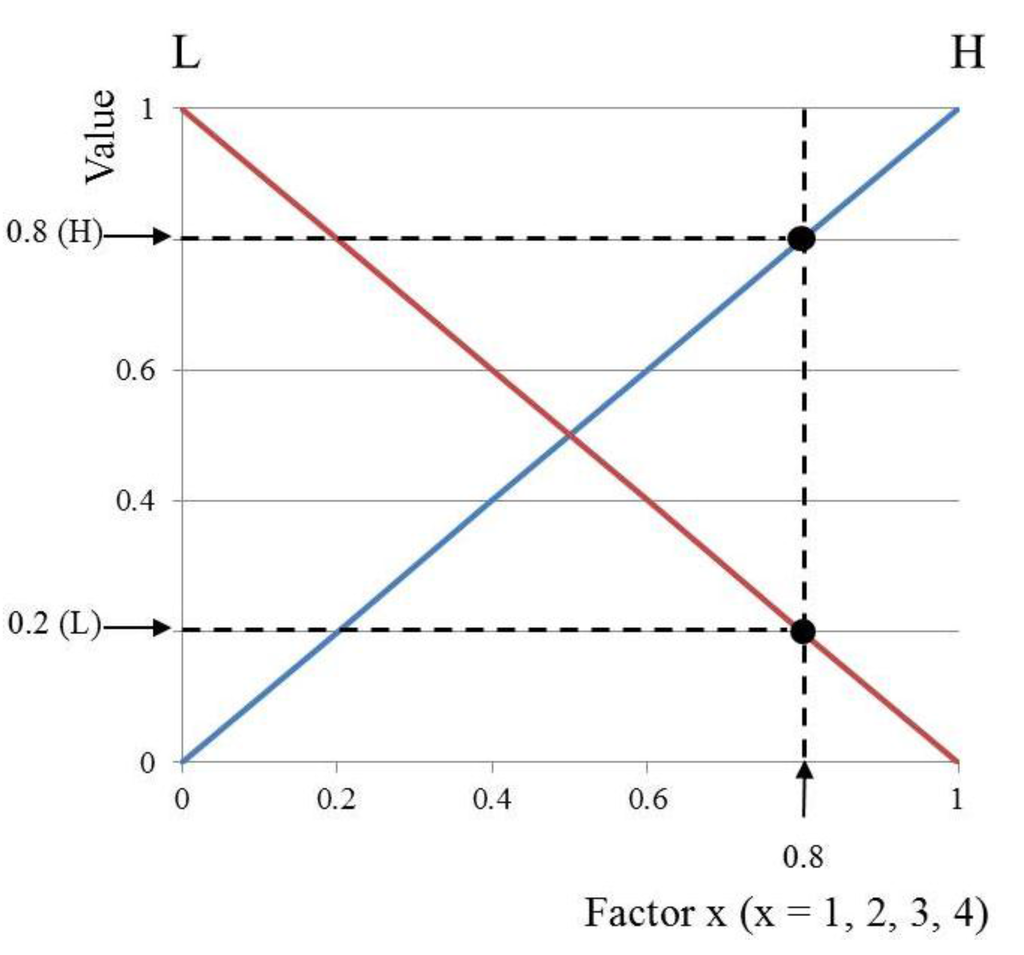
Figure 9.
Obtaining two output values from one input factor using the input membership function.
Accordingly, we obtain 0.8 (L) from (0.2 (L), 0.2 (L), 0.2 (L), 0.8 (H)). We label the value (0.8 (L)) as the inference value (IV) in this paper. If the MIN method is applied, the obtained IV is 0.2 (L). Consequently, sixteen types of IVs are determined (from the sixteen combination pairs of the output values {(0.2 (L), 0.2 (L), 0.2 (L), 0.2 (L)), (0.2 (L), 0.2 (L), 0.2 (L), 0.8 (H)), (0.2 (L), 0.2 (L), 0.8 (H), 0.2 (L)), ···, (0.8 (H), 0.8 (H), 0.8 (H), 0.8 (H))} based on the MIN or MAX methods and the fuzzy rules presented in Table 2.
Based on these sixteen IVs, we can obtain the final score using a defuzzification step. Figure 10 shows an example of defuzzification on the basis of the membership function for the output value (score) and the IVs. With each IV, we can obtain either one or two outputs (scores), as shown in Figure 10. If the IV is 0.2 (L), its corresponding output is S1. Thus, multiple outputs (S1, S2, ···, SN) are obtained from the 16 IVs, and thereby, we can determine the final output score based on the defuzzification method [41]. Five defuzzification methods such as the first of maxima (FOM), last of maxima (LOM), middle of maxima (MOM), mean of maxima (MeOM), and center of gravity (COG) can be considered [41]. The FOM chooses the first output (S2) among the outputs calculated using the maximum IV (0.8 (M)) as the output (score). The LOM chooses the last output (S3) among the outputs calculated using the maximum IV (0.8 (M)) as the output (score). The MOM chooses the middle output ((S2 + S3)/2) among the outputs using the maximum IV (0.8 (M)) as the output (score). Finally, the MeOM chooses the mean output ((S2 + S3)/2) among the outputs by using the maximum IV (0.8 (M)) as the output (score) [41]. The output (score) of the COG is determined as S5, as shown in Figure 10b, from the geometrical center (G in Figure 10b) of the union area of three regions (R1, R2, and R3). In our research, we calculate the center based on the weighted average of all the regions defined by all the IVs.

Figure 10.
Obtaining the final output (score) by a defuzzification method: (a) first of maxima (FOM), last of maxima (LOM), middle of maxima (MOM), and mean of maxima (MeOM); (b) center of gravity (COG).
Using the output scores (Score1, Score2, ···, Scoren shown in Figure 6), we can construct a Face Log (face images of higher quality) for face recognition. Here, the score is stored for each face region of an observed person in a video sequence with n images, and we choose face images by our method to build the Face Log in the order of the quality score. Figure 11 shows an example of a video sequence and the finally selected face images in the Face Log. The quality score of Figure 11b implies Scorei of the -th image of Figure 6.
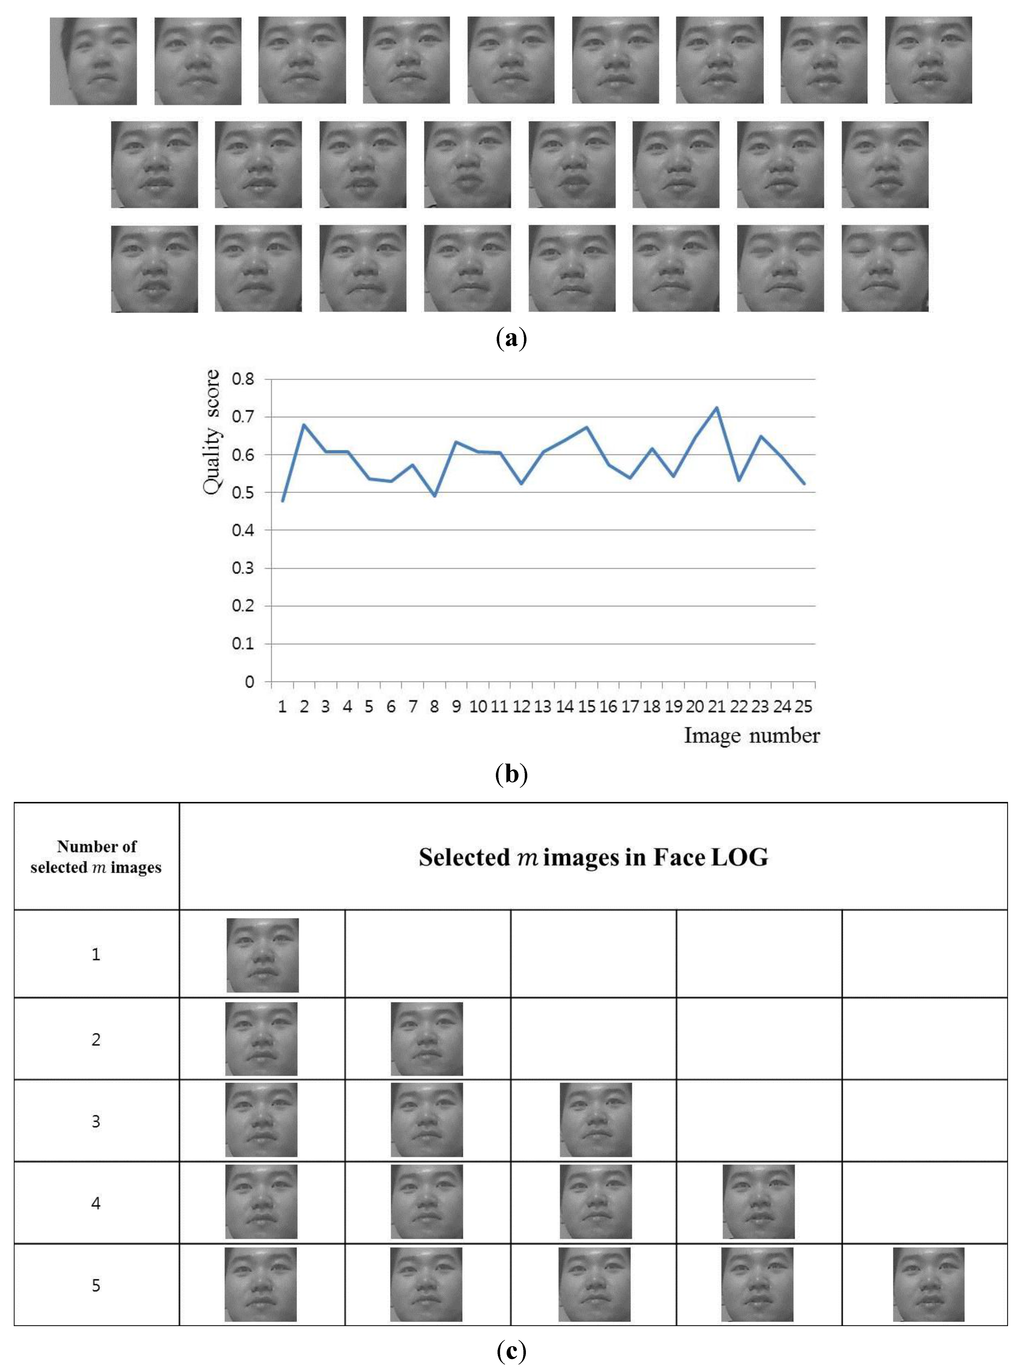
Figure 11.
Example of a video sequence and the selected face images in Face Log: (a) all the images in a video sequence; (b) quality score curve of the video sequence; (c) selected images in Face Log.
2.5. Face Recognition
The selected face images in the Face Log are used for face recognition. After obtaining the selected face image, the face region is redefined based on the positions of the detected and tracked eyes to normalize the size of the face region. This is because there can be variable sizes of the face regions depending on the Z distance between the camera and user’s face. In addition, there can be illumination variations in the face region while a user is watching TV. In order to solve this problem, retinex filtering is performed for illumination normalization [42]. Using the face image after performing illumination normalization, features for face recognition are extracted.
Many techniques for extracting features for face recognition have been proposed in previous studies, such as principal component analysis (PCA) [43], linear discriminant analysis (LDA) [11], and local binary pattern (LBP) [44]. In our research, the normalized face image is used for extracting features based on multi-level binary pattern (MLBP) [45,46]. Figure 12 illustrates the concept of MLBP feature extraction technique.

Figure 12.
Extracting histogram features based on multi-level binary pattern (MLBP) at two levels: (a) a face image divided into sub-blocks; (b) sub-block regions; (c) histogram of (b) obtained by local binary pattern (LBP); (d) final histogram feature obtained by the histogram of (c).
The face region is divided into sub-blocks, and the LBP histograms from each block are obtained as shown in Figure 12c. The final histogram feature is concatenated from the blocks of all histograms in order to form the final feature vector for face recognition, as shown in Figure 12d.
In this paper, we use the chi-squared distance (matching score) to measure dissimilarities between the enrolled face histogram features and face histogram feature from the input image [40]. In order to deal with pose variations (horizontal and vertical rotation), the face histogram feature of the input image is matched with the five enrolled face histogram features (which are obtained in the enrollment stage of Figure 2), and then, the matching score is determined as the smallest value among the five.
Furthermore, we fuse the obtained matching scores of the selected face images in the Face Log as the final matching score. The weight values for the matching scores of a viewer are determined using Equation (8).
The final matching score of face recognition is calculated using the weight values of the selected face images, as shown in Equation (9). Using the matching scores ( obtained by MLBP and their weight values ( of face images in the Face Log, we obtain the fused matching score ( by using Equation (9). Based on the smallest FMS, our system selects the genuine person in the enrolled data (the enrolled face image of the same person to the person of input image) corresponding to that of the input image.
3. Experimental Results and Analyses
The proposed method for face recognition was tested on a desktop computer with an Intel Core™ I7 3.5-GHz CPU and 8-GB RAM. The algorithm was developed using Microsoft Foundation Class (MFC)-based C++ programming and the Direct X9.0 software development kit (SDK).
Although there are a lot of face databases such as FEI [47], PAL [48], AR [49], JAFFE [50], YouTube Faces [51], Honda/UCSD video database [52], and IIT-NRC facial video database [53], most of them do not include all the factors such as the variations of head pose, illumination, sharpness, openness of eyes, contrast, and image resolutions in the video sequences of the database. Therefore, we constructed our own database (Database I), which includes all of these factors in the video sequences for the experiments.
When constructing our database, we defined 20 groups based on 20 people who participated in the test. The three people in each group carried out three trials using the proposed system by varying the Z distance (2, 2.5 m) and the sitting positions (left, middle, and right). Participants randomly and naturally looked at any point on the TV screen with their eyes blinking as if they were watching TV. During this period, successive images were acquired. The database contained a total of 31,234 images for measuring the performance of the proposed method. In addition, an additional five images per person in each group were obtained at the distance Z of 2 m at the enrollment stage. Figure 13 shows the examples of images captured for the experiments.
This database contains the variations in head pose, illumination, sharpness, and openness of the eyes, as shown in Figure 14. It is observed that the head pose is the most influential quality measure to construct the Face Log, whereas image resolution has no influence as a QM because participants have few Z-distance variations. In Figure 14, the bar in the first (row) denotes the number of selected QMs as the first order. Similarly, the bar in the fourth (row) denotes the number of selected QMs as the fourth order. The vertical axis of Figure 14 shows the number of selected QMs.

Figure 13.
Captured images for the experiments.
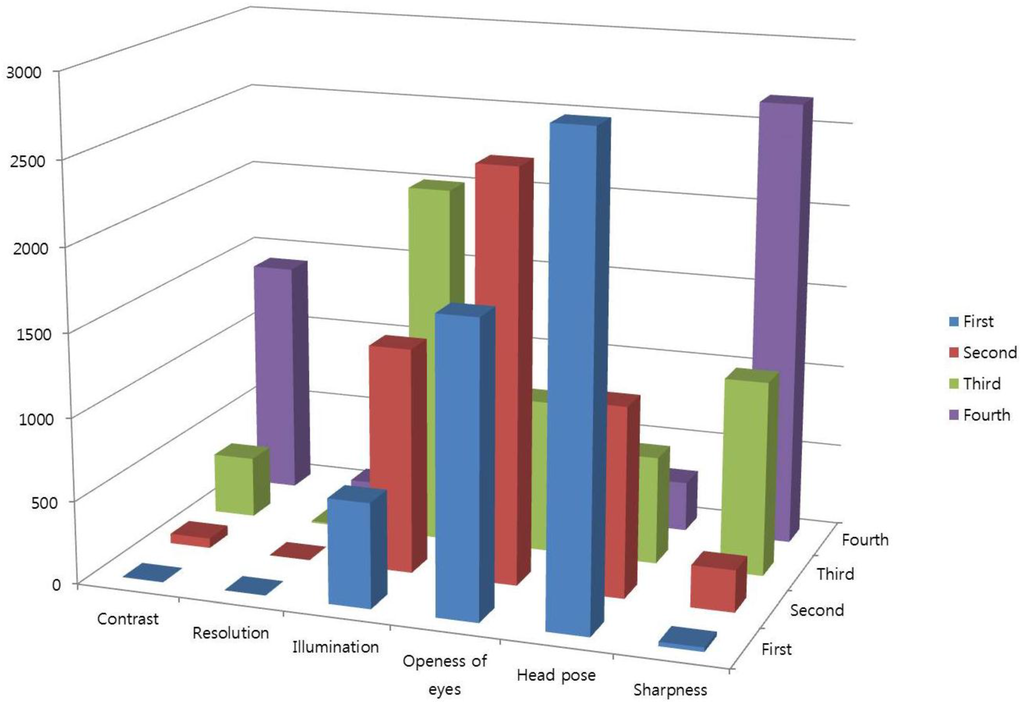
Figure 14.
Results of adaptively selected quality measures.
In the first experiment, we measured the accuracy of the face recognition method based on genuine acceptance rate (GAR) where we set the number of enrolled persons to three. As explained in Section 2.4, either the MIN or MAX method can be chosen for obtaining the IV. Further, the final output score can be obtained by using one of the five defuzzification methods (FOM, LOM, MOM, MeOM, or COG). Therefore, we compared the accuracies of face recognition using the MIN or MAX methods and compared them according to the defuzzification method, as shown in Table 3. Here, the number of face images in a video sequence is 10; we also measured the accuracies of face recognition by changing the number of selected images in the Face Log. In Table 3, no fusion means all the matching scores (MS1, …, MSm) of Equation (9) are used for calculating the GAR not using the fusion method of Equation (8). Fusion of Table 3 means our method, and therefore, the FMS of Equation (9) is used for calculating GAR.
Experimental results showed that the methods based on MIN and COG generally show higher face recognition accuracies than the other methods. The best accuracy (92.94%) was obtained with the Fuzzy MIN rule and COG in the case of fusing five selected images.

Table 3.
Comparison of face recognition accuracies using the MIN or MAX methods according to the defuzzification method (unit: %).
| Method | Number of Selected m Images | |||||||||
|---|---|---|---|---|---|---|---|---|---|---|
| 1 | 2 | 3 | 4 | 5 | ||||||
| No Fusion | No Fusion | Fusion | No Fusion | Fusion | No Fusion | Fusion | No Fusion | Fusion | ||
| Fuzzy MIN rule | FOM | 92.05 | 89.74 | 91.95 | 91.35 | 92.3 | 91.36 | 92.42 | 91.32 | 92.44 |
| LOM | 91.61 | 91.05 | 91.78 | 91.3 | 91.95 | 91.28 | 92.17 | 91.33 | 92.23 | |
| MOM | 92.29 | 91.35 | 91.88 | 91.43 | 92.05 | 91.45 | 92.38 | 91.45 | 92.45 | |
| MeOM | 92.23 | 91.54 | 92.29 | 91.53 | 92.63 | 91.48 | 92.92 | 91.41 | 92.82 | |
| COG | 92.27 | 91.61 | 92.42 | 91.63 | 92.73 | 91.63 | 92.89 | 91.58 | 92.94 | |
| Fuzzy MAX rule | FOM | 92.12 | 91.49 | 91.74 | 91.49 | 91.98 | 91.46 | 92.1 | 91.45 | 92.16 |
| LOM | 92.31 | 91.38 | 91.9 | 91.41 | 92.18 | 91.36 | 92.2 | 91.36 | 92.46 | |
| MOM | 91.77 | 91.31 | 92.01 | 91.53 | 92.43 | 91.46 | 92.4 | 91.43 | 92.42 | |
| MeOM | 92.43 | 91.47 | 92.09 | 91.52 | 92.68 | 91.51 | 92.72 | 91.47 | 92.72 | |
| COG | 92.37 | 91.4 | 92.33 | 91.58 | 92.77 | 91.42 | 92.72 | 91.54 | 92.86 | |
In the next experiment, we performed the additional experiments for measuring the accuracies of face recognition in terms of GAR according to the number of QMs as shown in Table 4. Since we use the fuzzy system to combine the values obtained by the selected QMs and to obtain the final quality score of the image, the number of QMs should be at least two. Therefore, we compared the accuracies of face recognition according to the number of QMs and defuzzification method. Experimental results showed that the greater the number of QMs, the higher the accuracy of face recognition becomes.
In the third experiment, in order to show the accuracy changes of face recognition according to the membership function, the accuracy of symmetric input and output membership functions (SIMF and SOMF (Figure 7 and Figure 8)) is compared with asymmetric ones (Figure 15). Here, asymmetric input membership functions (AsIMF 1 and 2) are defined based on each cutoff point at input value, respectively, as shown in Figure 15a,b. Similarly, asymmetric output membership functions (AsOMF 1 and 2) are defined based on each cutoff point at output value, respectively, as shown in Figure 15c,d.

Table 4.
Comparison of the accuracies of the proposed method according to the number of quality measures (QMs) (unit: %).
| Method | Number of QMs | |||
|---|---|---|---|---|
| 2 | 3 | 4 | ||
| Fuzzy MIN rule | FOM | 92.14 | 92.22 | 92.44 |
| LOM | 92.05 | 92.17 | 92.23 | |
| MOM | 91.95 | 92.10 | 92.45 | |
| MeOM | 92.10 | 92.25 | 92.82 | |
| COG | 92.58 | 92.84 | 92.94 | |
| Fuzzy MAX rule | FOM | 91.40 | 92.02 | 92.16 |
| LOM | 92.14 | 92.35 | 92.46 | |
| MOM | 92.20 | 92.63 | 92.42 | |
| MeOM | 92.31 | 92.74 | 92.72 | |
| COG | 92.16 | 92.86 | 92.86 | |
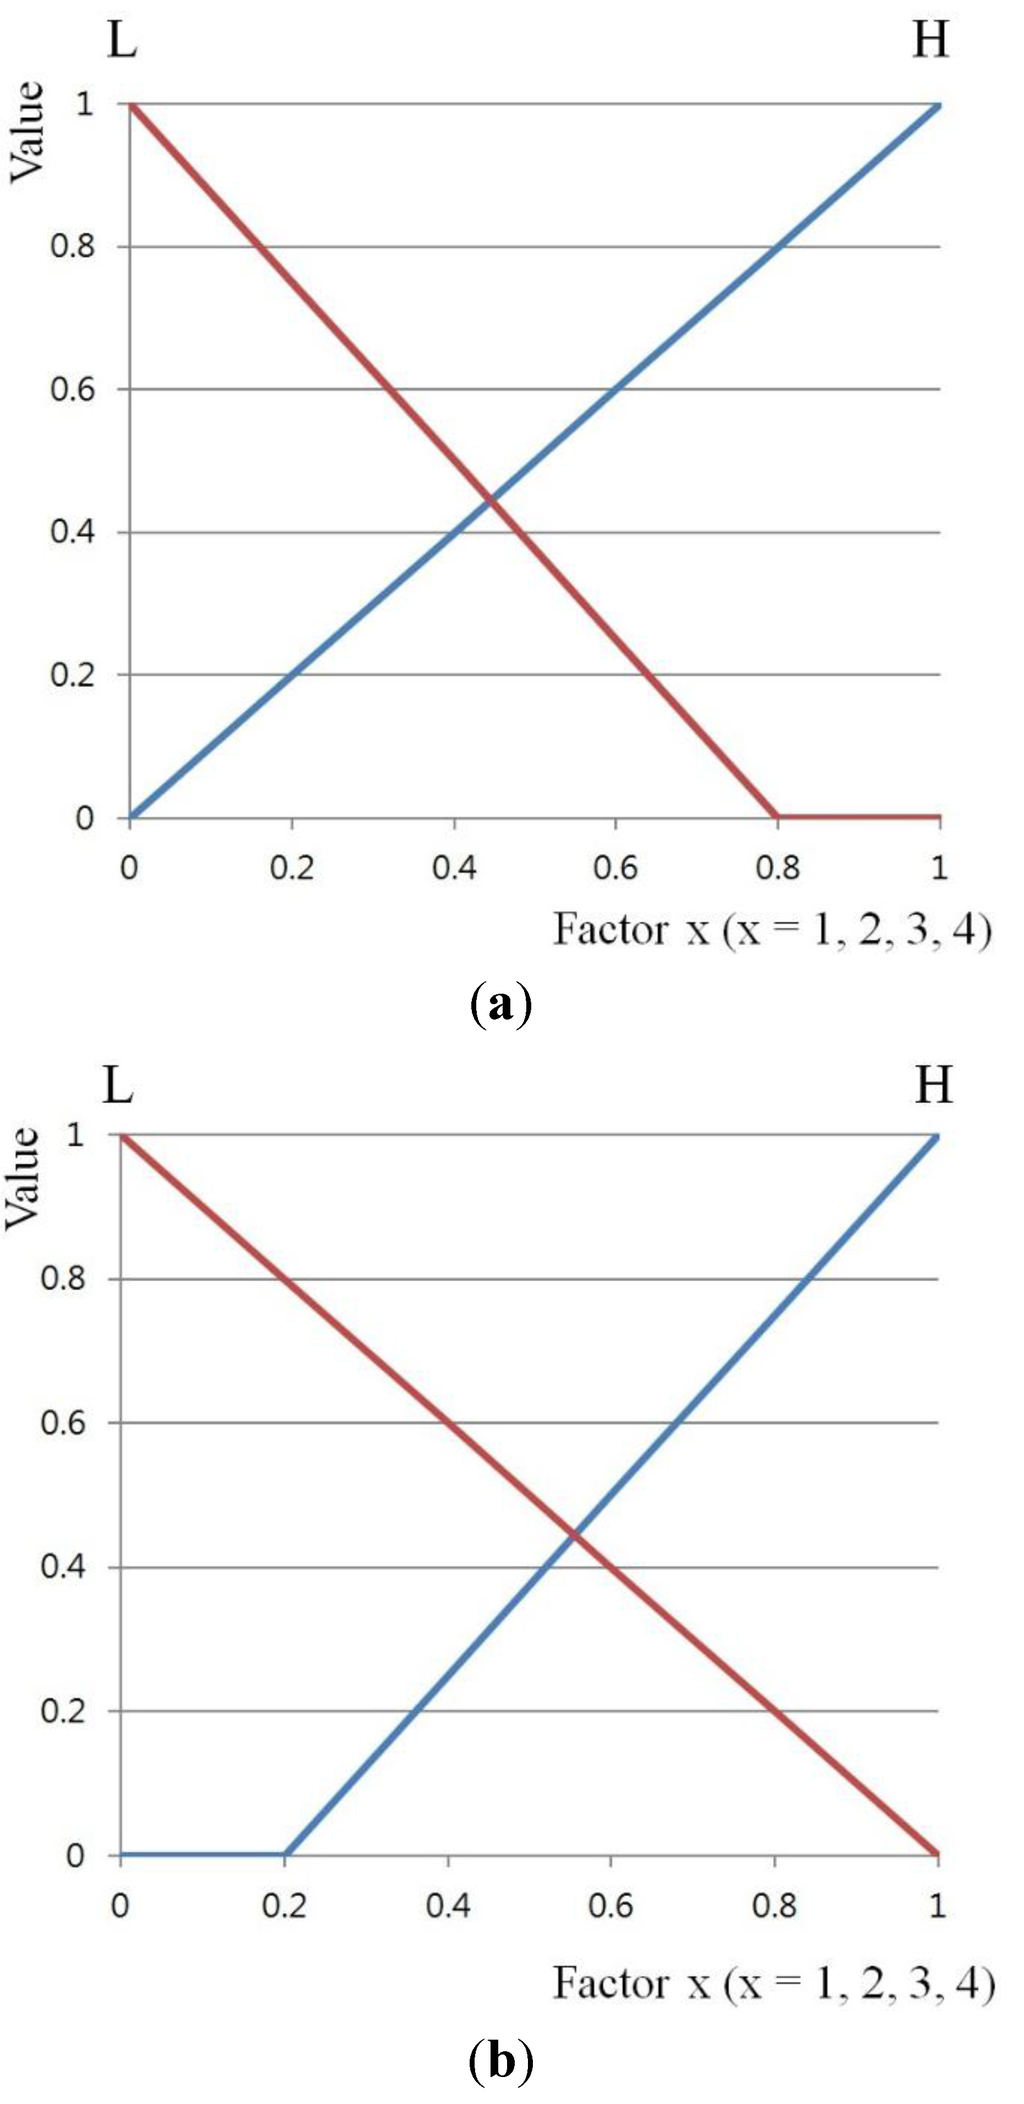
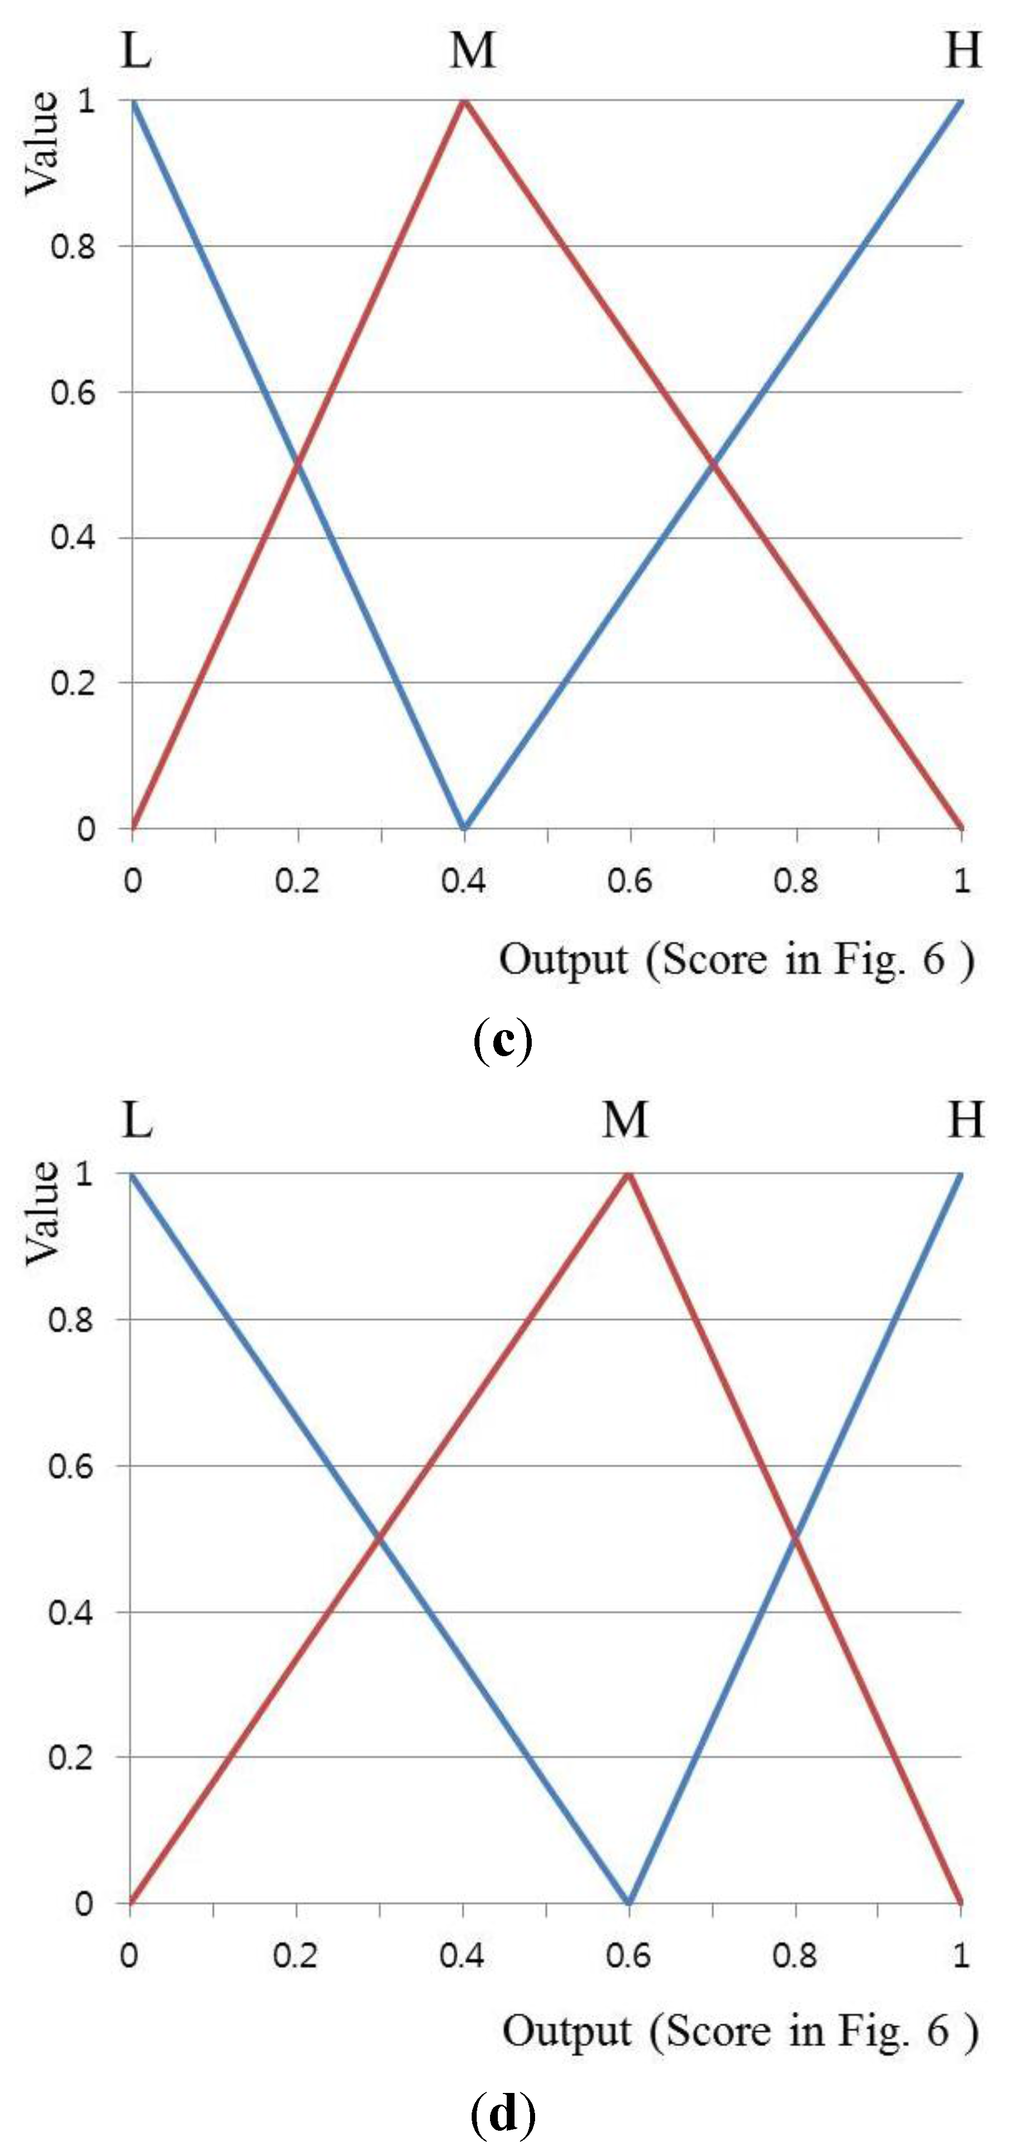
Figure 15.
Asymmetrical triangular membership functions: (a) asymmetric input membership function (AsIMF) 1; (b) AsIMF 2; (c) AsOMF 1; (d) AsOMF 2.
Table 5 shows the accuracies of face recognition according to the membership function and defuzzification method. It is observed that the accuracy of symmetric membership functions is slightly higher but very similar to that of the others (based on asymmetric membership function). On the basis of these results, it can be shown that the symmetric triangular shape for the membership function is more considerable than others in terms of not only accuracy but also implementation (explained in Section 2.4).
In the next experiment, as shown in Table 6, we measured the accuracies of face recognition according to the number of face images in a video sequence in terms of GAR. In Table 6, fusion means our method, and therefore, the FMS of Equation (9) is used for calculating GAR. It is observed that the accuracy of face recognition improves with an increase in the number of face images.

Table 5.
Comparison of the accuracies of the proposed method according to the shape of the membership function (unit: %).
| Method | Membership Function | |||||
|---|---|---|---|---|---|---|
| SIMF and SOMF (Figure 7 and Figure 8) | AsIMF 1 and SOMF (Figure 15a and Figure 8) | AsIMF 2 and SOMF (Figure 15b and Figure 8) | SIMF and AsOMF 1 (Figure 7 and Figure 15c) | SIMF and AsOMF 2 (Figure 7 and Figure 15d) | ||
| Fuzzy MIN rule | FOM | 92.44 | 92.55 | 92.31 | 92.27 | 92.44 |
| LOM | 92.23 | 92.53 | 92.56 | 92.56 | 92.74 | |
| MOM | 92.45 | 92.39 | 92.23 | 92.42 | 92.59 | |
| MeOM | 92.82 | 92.47 | 92.44 | 92.49 | 92.67 | |
| COG | 92.94 | 92.71 | 92.51 | 92.60 | 92.88 | |
| Fuzzy MAX rule | FOM | 92.16 | 92.07 | 92.33 | 92.17 | 92.37 |
| LOM | 92.46 | 92.68 | 92.44 | 92.59 | 92.87 | |
| MOM | 92.42 | 92.65 | 92.56 | 92.44 | 92.71 | |
| MeOM | 92.72 | 92.58 | 92.47 | 92.59 | 92.60 | |
| COG | 92.86 | 92.75 | 92.45 | 92.45 | 92.84 | |

Table 6.
Comparison of the accuracies of the proposed method according to the number of face images in a video sequence (unit: %).
| Number of Selected m Images | Number (n) of Face Images in a Video Sequence | ||||
|---|---|---|---|---|---|
| 10 | 15 | 20 | 25 | ||
| Fusion | 2 | 92.42 | 93.12 | 93.63 | 93.92 |
| 3 | 92.73 | 93.59 | 93.89 | 94.33 | |
| 4 | 92.89 | 93.57 | 94.06 | 94.59 | |
| 5 | 92.94 | 93.72 | 94.18 | 94.71 | |
In addition, the accuracy of the proposed method was compared with a fixed quality measure-based approach [21]. Using the results from Figure 14, we selected four influencing QMs (head pose, illumination, sharpness, and openness of eyes) for a fixed quality measure-based approach. In this experiment, and are set to 25 and 5, respectively. As described in Section 2.4, since the fixed quality measure-based approach cannot assess other quality measures that affect the accuracy of face recognition, its accuracy is lower than that of the proposed method. Furthermore, we compared the accuracy of a previous method that uses all images in a video sequence [40], and the accuracy of fixed quality measure-based approach [21] to the accuracy of our method, the results of which are shown in Table 7. Experimental results showed that the proposed method has a higher face recognition accuracy than the other methods.

Table 7.
Comparison of the accuracy of the proposed method with that of the other methods (unit: %).
| Method | Using all Images in a Video Sequence [46] | Fixed Quality Measures-Based Approach [21] | Adaptive Quality Measure-Based Approach (Proposed Method) |
|---|---|---|---|
| Accuracy | 89.74 | 93.09 | 94.71 |
In Figure 16 and Figure 17, we show the face images of correctly recognized results. As shown in Figure 16a,b, although there exist the images where hand occludes a part of face, face area is not correctly detected, or eyes are closed, our method can exclude these bad-quality images. On the basis of these results, we can confirm that good-quality images are correctly selected by our method and that they are correctly matched with the enrolled face image of the same person.

Figure 16.
Example of correctly recognized results: (a) a sequences of 25 images; (b) selected five images; (c) enrolled face images (gazing at five positions of TV); (d) correctly matched face image among face images of enrolled persons.

Figure 17.
Example of correctly recognized results: (a) a sequences of 25 images; (b) selected five images; (c) enrolled face images (gazing at five positions of TV); (d) correctly matched face image among face images of enrolled persons.
In Figure 18 and Figure 19, we show the face images of incorrectly recognized results. As shown in these Figures, although there exist the images where eyes are closed, our method can exclude these bad-quality images, and the face images of good quality are correctly selected. However, they are incorrectly matched with other person’s enrolled face image. This is because there exists a size difference between the face areas of enrolled image and input one due to the incorrect detection of face and eye region (Steps 6 and 7 of Figure 2), which leads to misrecognition. These can be solved by increasing the accuracy of re-definition of face area based on more accurate detection algorithm. Because our research is not focused on accurate detection, but focused on correctly selecting the face images of good quality, this research of accurate detection would be studied as a future work.
We used the images which were acquired while each user naturally watches TV as shown in Figure 3 for our experiments. In case of the severe rotation of head as shown in Figure 20, the face and facial features are difficult to be detected. In addition, because these cases do not happen when a user looks at a TV normally, we did not use these images for our experiments.
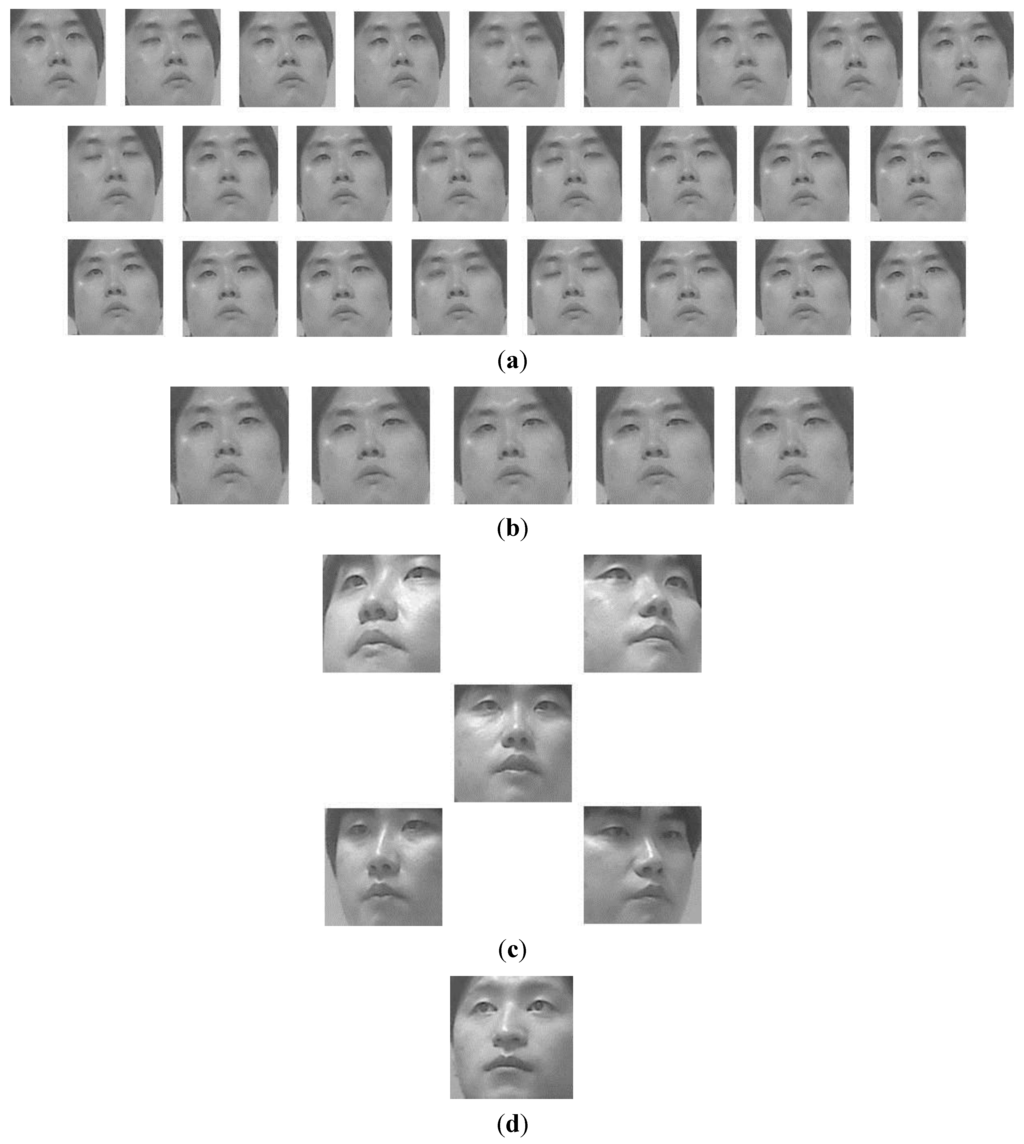
Figure 18.
Example of incorrectly recognized results: (a) a sequences of 25 images; (b) selected five images; (c) enrolled face images (gazing at five positions of TV); (d) incorrectly matched face image among face images of enrolled persons.
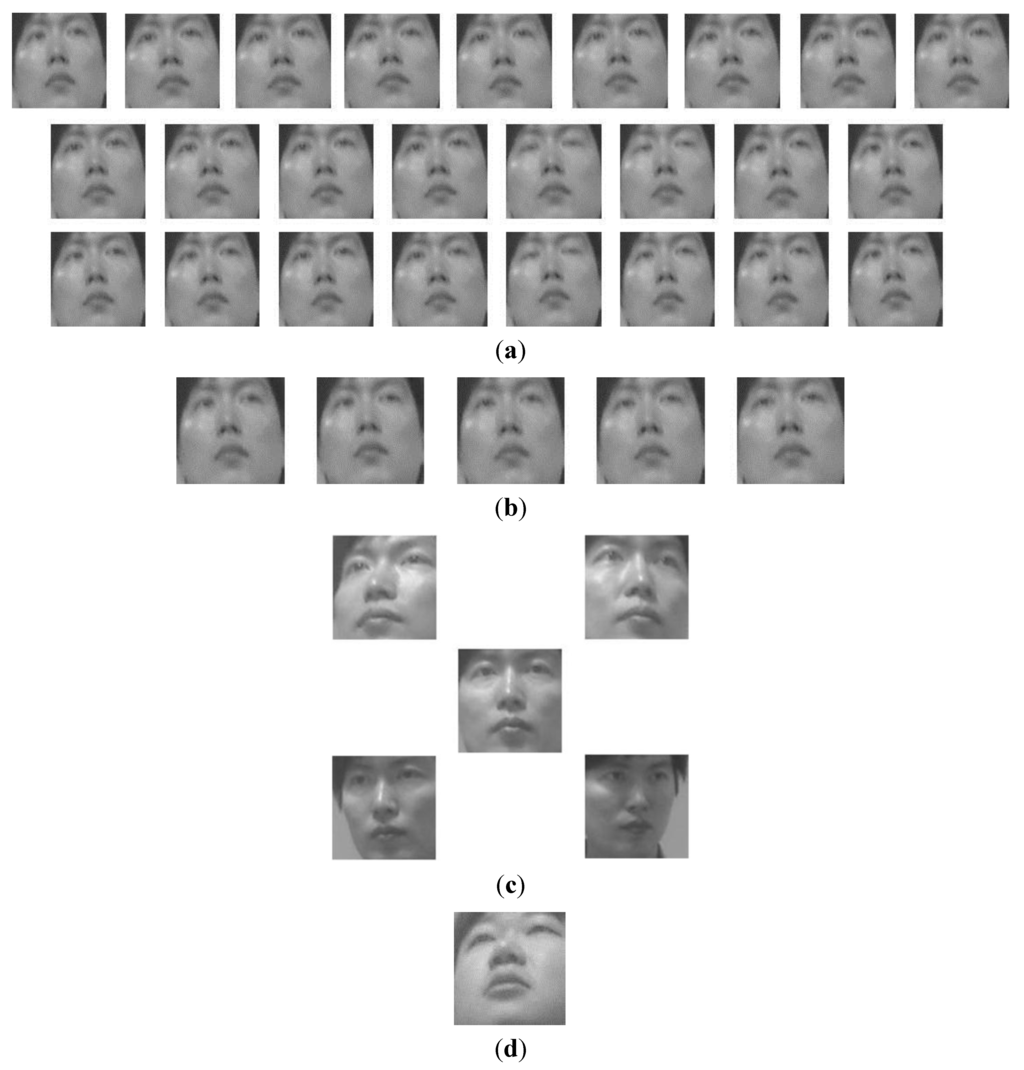
Figure 19.
Example of incorrectly recognized results: (a) a sequences of 25 images; (b) selected five images; (c) enrolled face images (gazing at five positions of TV); (d) incorrectly matched face image among face images of enrolled persons.

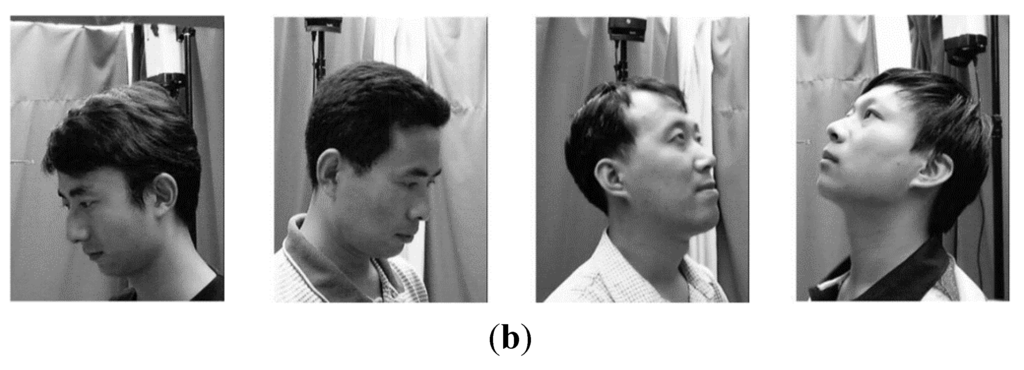
Figure 20.
Examples of severe rotation of head: (a) Images captured by our system; (b) images from CAS-PEAL-R1 database [54,55].
When a user looks at a TV normally, the primary factors for determining degree of head pose change are the size of the TV and viewing distance between the user and TV. The relationship between the TV size and optimal viewing distance is already defined in [56]. That is, the larger the TV size is, the farther the optimal viewing distance should be. Moreover, the smaller the TV size is, the nearer the optimal viewing distance should be.
Based on this [56], we show the three cases, (a) when users are watching TV of 50 inches at the viewing distance of about 2 m; (b) when users are watching TV of 60 inches at the viewing distance of about 2.4 m; and (c) when users are watching TV of 70 inches at the viewing distance of about 2.8 m as shown in Figure 21a–c, respectively. As shown in the upper images of Figure 21a–c, the degrees of head pose change are almost similar all in these cases when each user gazes at the same (lower-left) position on the TV although the image resolution of each user decreases according to the increase of the viewing distance. As shown in the lower images of Figure 21a–c, the correct regions of face and facial features are detected by our method, and our method of measuring the quality of face image is also working successfully, which shows that the performance of our method is not affected by using the smaller or larger sized TV if considering the optimal viewing distance.
The degree of head pose change is different according to the Z distance even though the user looks at the same location on the TV screen of same size as shown in Figure 22a–c. When a user is at a nearer distance from TV (in the case of Figure 22a), the degree of head pose change becomes larger than that of the case of Figure 22c. On the other hand, when the user is at a farther distance (in the case of Figure 22c), the degree of head pose change becomes smaller than that of the case of Figure 22a although the image resolution of the user of Figure 22c decreases.
As shown in the right-lower images of Figure 22a–c, the correct regions of face and facial features are detected by our method, and our method of measuring the quality of face image is also working successfully, which shows that the performance of our method is not affected by the farther or nearer distance between the user and TV.
In addition, we performed the experiments with additional open database. By using open database, the CAS-PEAL-R1 database [54,55], we could increase the number of subjects and show the fidelity of the proposed method irrespective of the kind of database. The CAS-PEAL-R1 database contains 30,863 images of 1040 subjects (595 males and 445 females). In the CAS-PEAL-R1 database, most images (21 poses × 1040 individuals) with pose variations were acquired according to the different camera position.

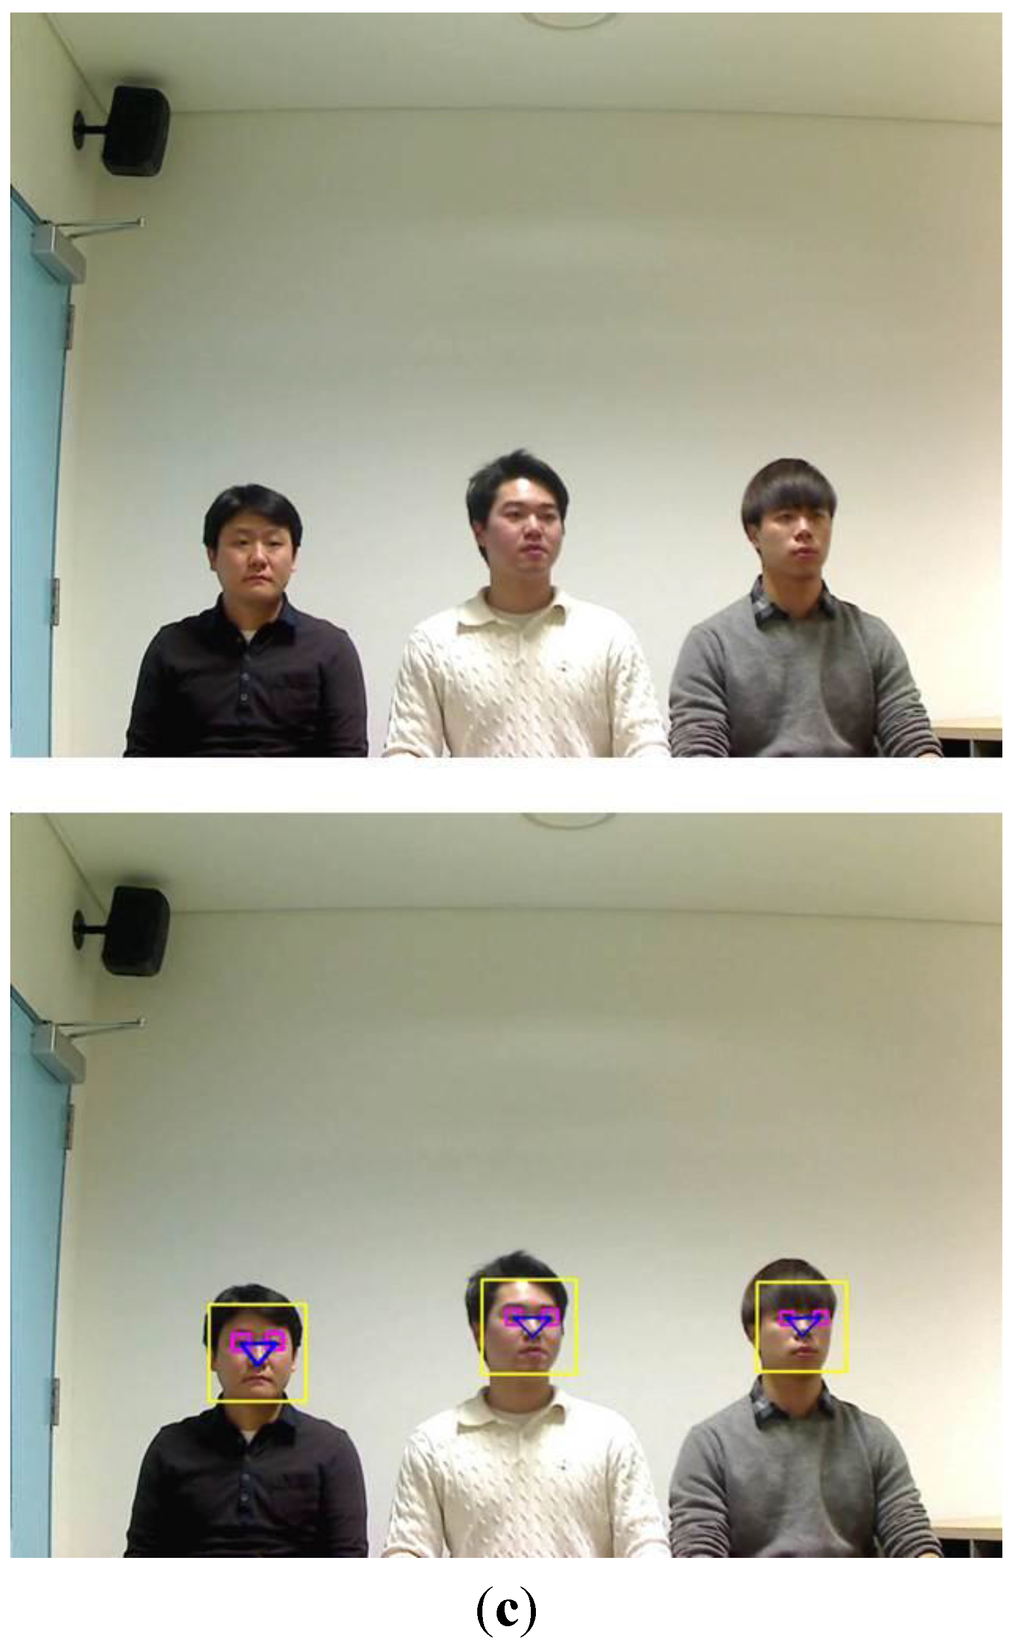
Figure 21.
Examples of head pose change according to the size of the TV with the optimal viewing distance. In (a)–(c), the upper and lower figures represent the original images and result ones including the detected regions of face and facial features, respectively: (a) when users are watching TV of 50 inches at the viewing distance of about 2 m; (b) when users are watching TV of 60 inches at the viewing distance of about 2.4 m; (c) when users are watching TV of 70 inches at the viewing distance of about 2.8 m.
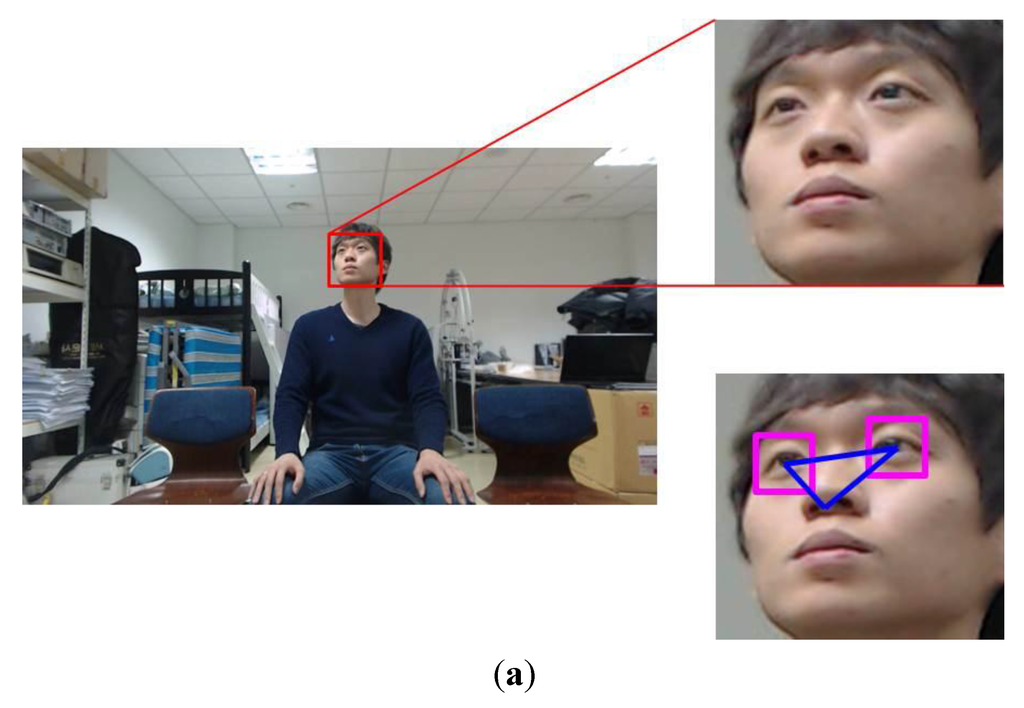
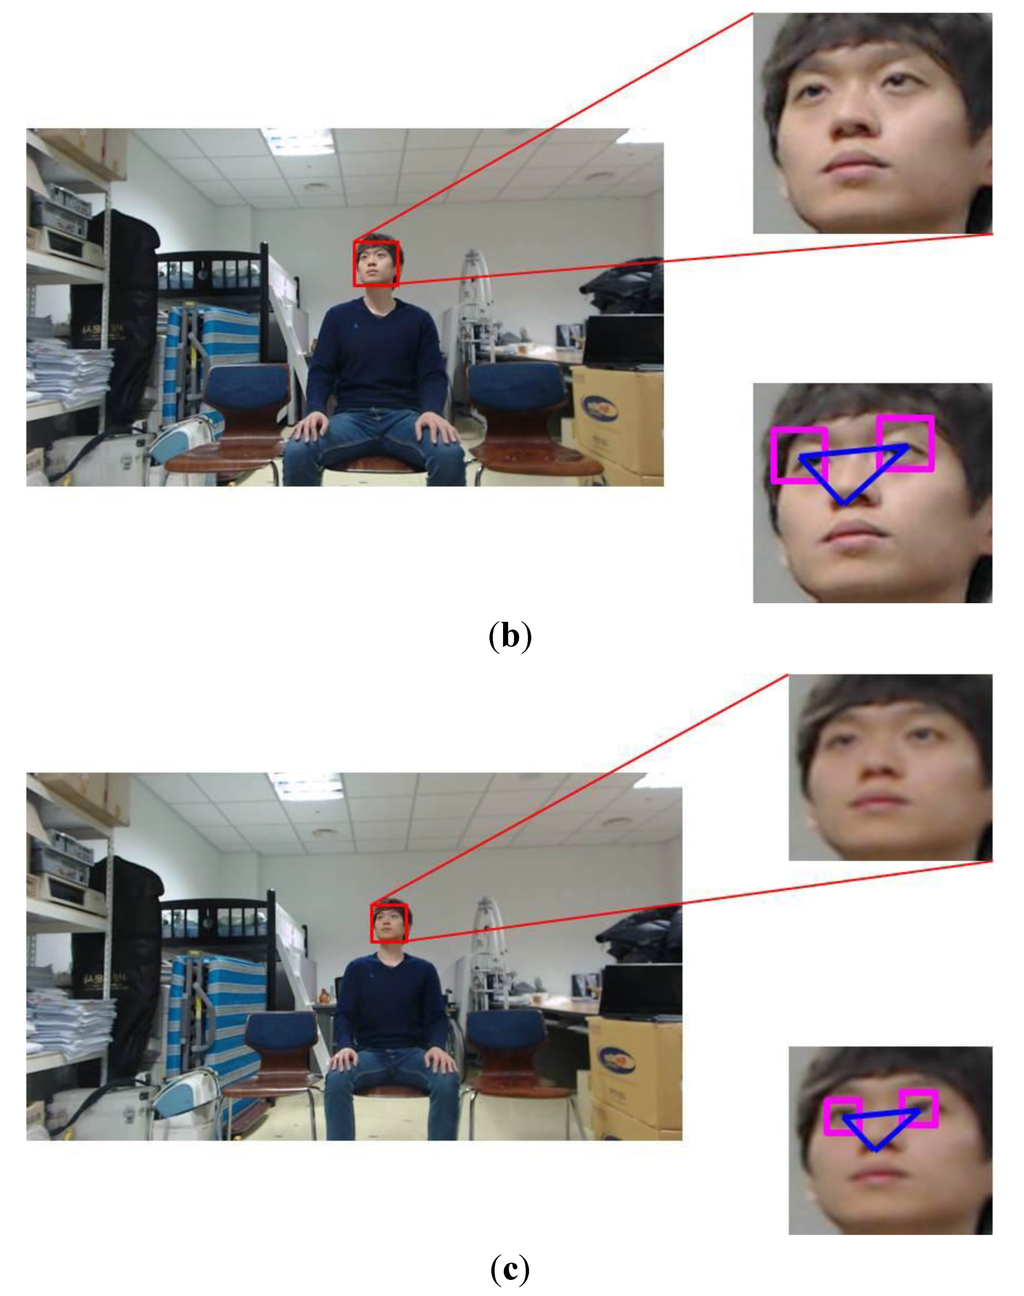
Figure 22.
Examples of head pose change according to the Z distance with the TV of 60 inches: (a) 1.5 m; (b) 2 m; (c) 2.5 m.
However, we do not cover high degree of rotation for our experiment because severe rotation of head does not happen when a user looks at a TV normally. Therefore, we used only nine images for each subject under different poses as shown in Figure 23a. In addition, each subject has the images under at least six illumination changes, those with six different expressions, and those with different image resolutions within the face region as shown in Figure 23b–d, respectively.
Consequently, a total of 2410 images (Database II) from 100 subjects were used for our experiments because the remainder images from 940 subjects contain few of variations. The image resolution is 360 × 480 pixels.

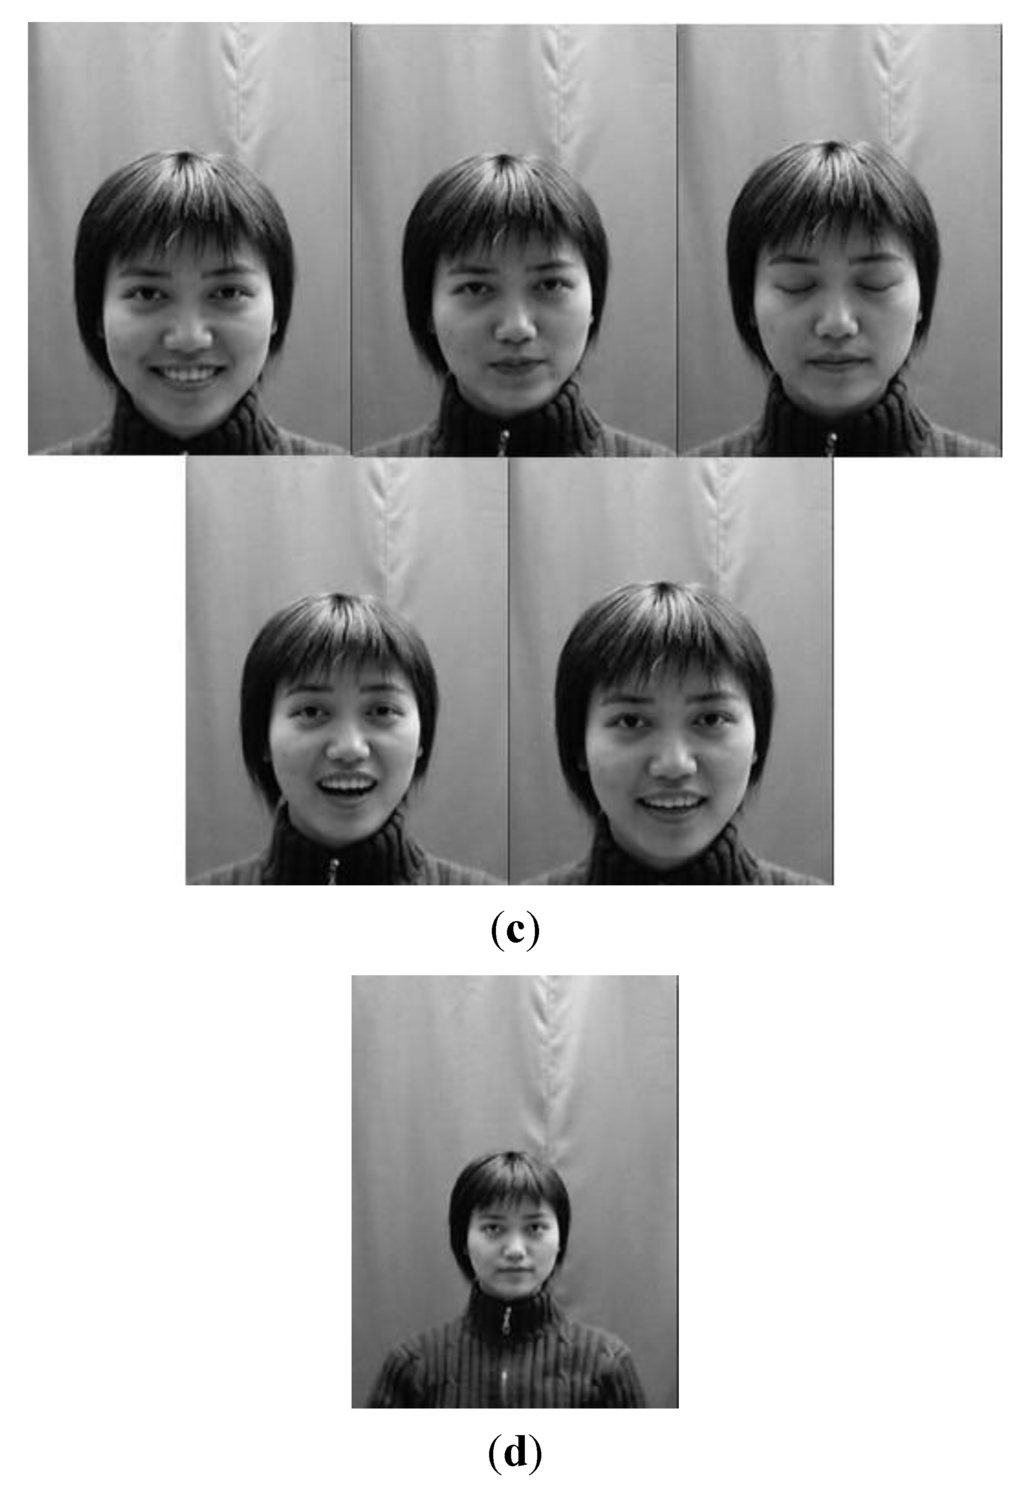
Figure 23.
Examples of one subject with different variations in Database II: (a) pose variation; (b) illumination variation; (c) expression variation; (d) image resolution variation.
Experimental results showed that the Database II includes variations in head pose, contrast, and illumination as shown in Figure 24. It is observed that the illumination is the most influential QM to construct the Face Log, whereas image resolution and openness of eyes have no influence as a QM. That is because the number of images where the Z distance variations of users occur is small among the whole images of Database II. In addition, the number of images where participants close their eyes is small among the whole Database II.
As the next experiment, we measured the accuracy of the face recognition method based on GAR where we set the number of enrolled persons to three. Using the results from Figure 24, the accuracy of the proposed method was compared with a fixed quality measure-based approach [21]. Here, we selected three influencing QMs (illumination, contrast, and head pose) for a fixed quality measure-based approach. In addition, we compared the accuracy of a previous method that uses all still images [46], and the accuracy of fixed quality measure-based approach [21] to the accuracy of our method as shown in Table 8. Experimental results showed that the accuracy of the proposed method is higher than those of other methods, and its accuracy is similar to that of Table 7 using our own database. From that, we can confirm that the accuracy of our method is less affected by the kinds of database and the number of participants in database.
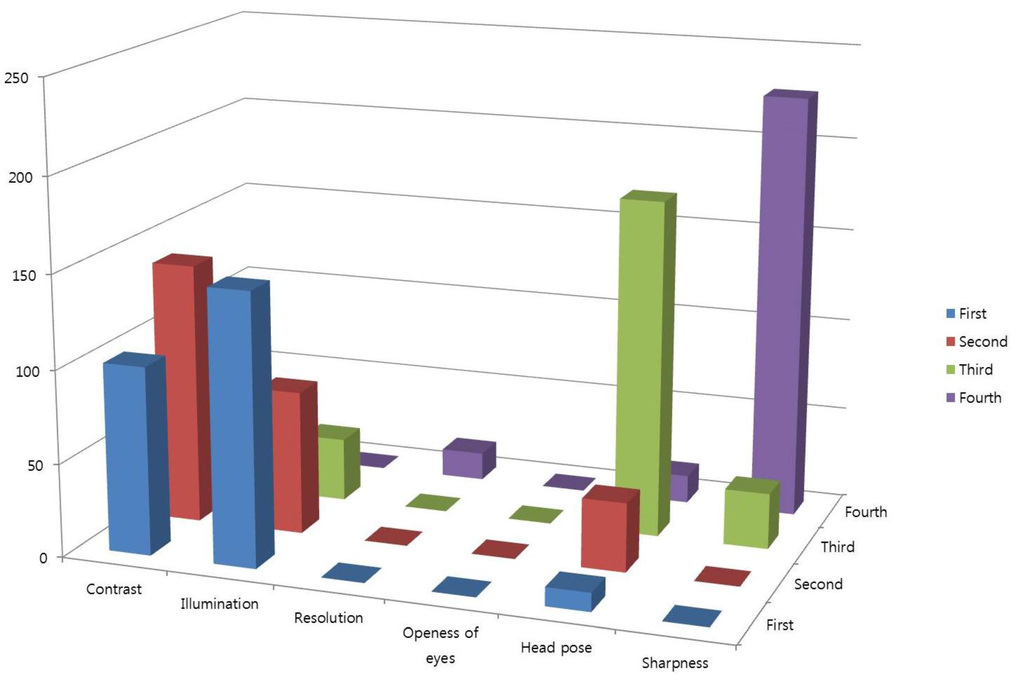
Figure 24.
Results of adaptively selected QMs with Database II.

Table 8.
Comparison of the accuracy of the proposed method with that of the other methods with Database II (unit: %).
| Method | Using all Images in a Video Sequence [46] | Fixed Quality Measures-Based Approach [21] | Adaptive Quality Measure-Based Approach (Proposed Method) |
|---|---|---|---|
| Accuracy | 79.2 | 95.72 | 97.67 |
Because we consider the TV watching environment in doors, the case that user’s face is so dark that the facial features cannot be discriminative does not occur in our experiments. However, we consider the cases that shadows exist on both sides of face or in the entire face to a degree as shown in Figure 25b,d. Each number below Figure 25a–d represents the QM value ( of Equation (4)) of illumination. As shown in Figure 25, the of the case without shadows (Figure 25(a)) is higher than those of the case of shadows on both sides of face (Figure 25b) or in the entire face (Figure 25d). In addition, the ofFigure 25a is higher than that of the case of shadows in the right side of face (Figure 25c). The reason why the of Figure 25a is higher than those of Figure 25b,d is that it is difficult that the shadows are uniform on the both sides of the face due to the 3 dimensional shape of face even if shadows on both sides of face or in the entire face. Therefore, the (based on the difference between the average values of left and right sides of the face) becomes larger than that without shadow of Figure 25a.
From these results, we can find that our QM of illumination ( of Equation (4)) can produce the correct quality value with the face images including the shadows on both sides of face or in the entire face to a degree.
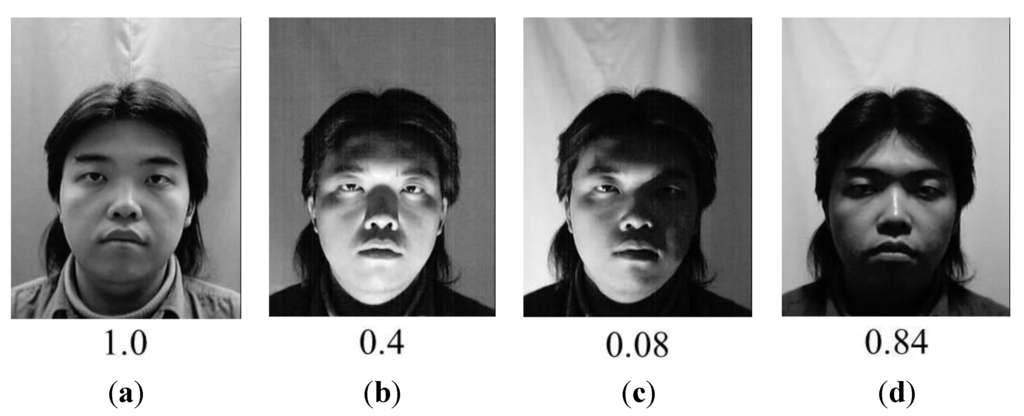
Figure 25.
Examples of the value according to the illumination condition with Database II: (a) uniform illumination; (b) shadows on both sides of face; (c) shadows on right side of the face; (d) shadows in the entire face.
Generally, an image of higher resolution is regarded as containing more information than that of lower resolution. Likewise, the face images of high-resolution are preferred to those of low-resolution in terms of recognition. This is because the face images of high-resolution can yield better recognition results. As shown in Figure 22 and Figure 26, the nearer the Z distance between a user and TV is, the larger the size of face box becomes, which increases the inter-distance between two detected eyes and the image resolution (width and height) of face region. Therefore, the inter-distance between two detected eyes has almost proportional relationship with the image resolution. Based on these characteristics, we measure the distance between two detected eyes as QM () (explained in Section 2.3.6) and assign the higher score to the face image of higher resolution.
The accurate detection of eye regions has influence on the performance of three QMs (head pose ( explained in Section 2.3.1), openness of the eyes ( explained in Section 2.3.4), and image resolution ( explained in Section 2.3.6)). In addition, the performance of QM () is also affected by the accuracy of nose detection.
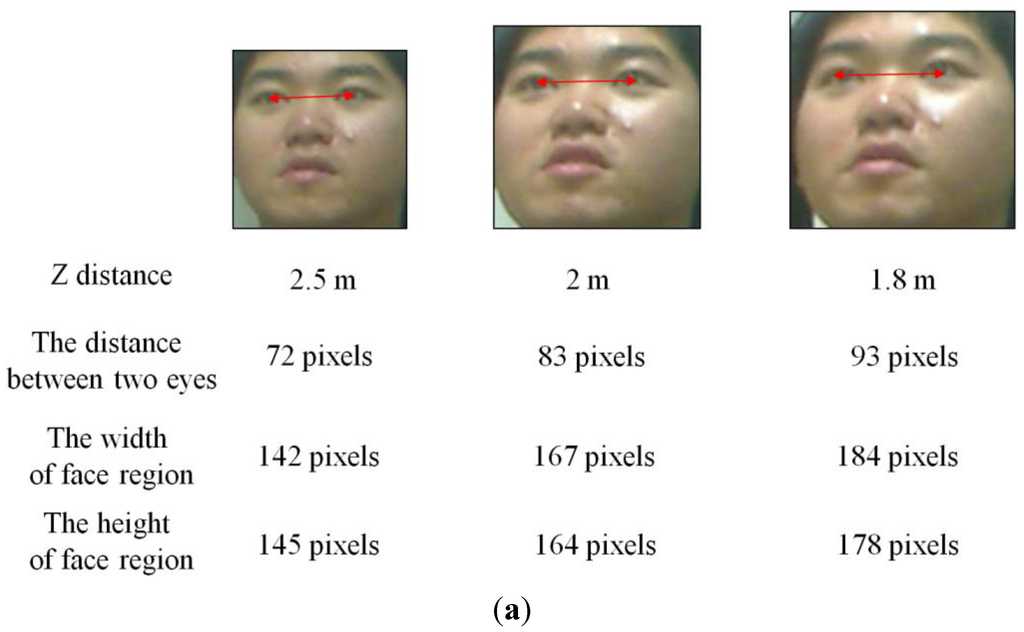
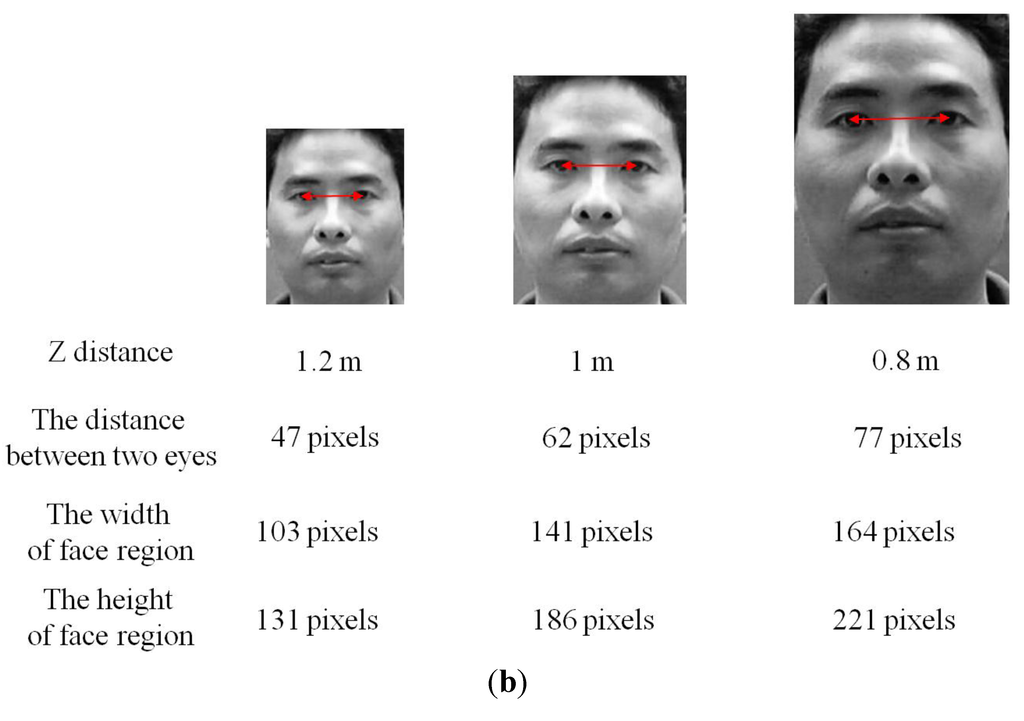
Figure 26.
Relationship between the inter-distance between two eyes and image resolution of face region: (a) examples from our own database; (b) examples from database II.
As the next experiments, we measured the accuracies of face, eye and nostril detection. For this, we manually depicted bounding boxes on the face (eye or nostril) areas in the images as ground truth regions. The detection results were evaluated using the Pascal overlap criterion [57]. In order to judge true/false positives, we measured the overlap of the detected and ground truth boxes. If the area of overlap () between the detected box () and ground truth box () of Figure 27 exceeds 0.5 using Equation (10), we count the result as a correct detection.

Figure 27.
Overlapped area of ground truth and detected boxes.
Based on the Equation (10), we can count the number of true positive and false positive detection cases. Here, true positive means that the faces (eyes or nostrils) are correctly detected as faces (eyes or nostrils), and false positive is the case where non-faces (non-eyes or non-nostrils) are incorrectly detected as faces (eyes or nostrils). Consequently, the accuracies of face, eye and nostril detection are measured using the following Equations (11) and (12) [58],
where is the number of faces (eyes or nostrils), is the number of true positives, and is the number of false positives. As shown in Equations (11) and (12), the maximum and minimum values of the recall and precision are 1 and 0, respectively. The higher values of the recall and precision represent a higher accuracy of the detection of face (eye or nostril).
Experimental results showed that the recall and precision of face detection were 99.5% and 100%, respectively. In addition, with the images where face regions were successfully detected, the recall and precision of eye detection were 99.73% and 100%, respectively, and those of nostril detection were 99.67% and 100%, respectively.
In general, the optimization of the quality metrics can be performed by principal component analysis (PCA), linear discriminant analysis (LDA), or neural network, etc. However, most of these methods require the additional training procedure with training data, which makes the performance of system be affected by the kinds of training data. In order to solve this problem, we obtain the optimal weight (quality score) of the face image by using the schemes of adaptive QM selection and fuzzy system as shown in Figure 6. Because these schemes do not require the additional (time-consuming) training procedure, the performance of our method is less affected by the kinds of database, which was experimentally proved with two databases (our own database and Database II) as shown in Table 5 and Table 6.
As shown in Figure 28, we show the correlation of the matching score (similarity) by face recognition and quality score. In both the matching score and quality score, the higher values represent the higher matching similarity and better quality, respectively. With the 25 face images of Figure 28a, we show the graph of correlation between the quality scores (which are obtained by our method of Figure 6) and the matching scores (by our face recognition method of multi-level binary pattern (MLBP) of Figure 12) as shown in Figure 28b. The values of the quality score and matching score are respectively normalized so as to be represented in the range from 0 to 1. Figure 28b shows that these two scores are much correlated. In addition, we calculate the correlation value between the quality scores and matching scores. The calculated correlation value is about 0.87. The correlation value ranges from −1 to 1. 1 and −1 mean the positive and negative correlation cases, respectively. 0 represents the uncorrelated case [59,60]. Based on the correlation value, we can find that the quality scores are much correlated to the matching scores by face recognition, and the higher quality score corresponds to the good face recognition. The reason why there are no error bars in Figure 28b is that this figure shows one example where the correlation coefficient between quality scores and matching scores is obtained from the data of a single human individual.
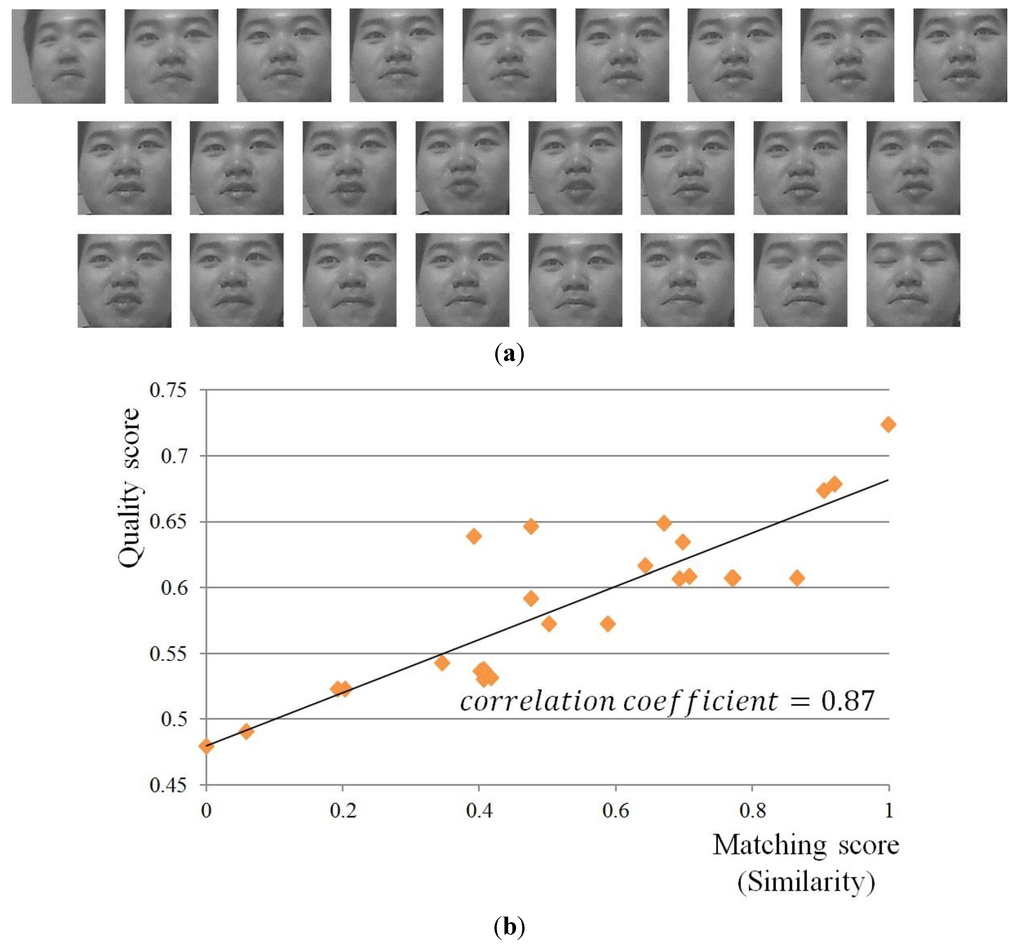
Figure 28.
Example of a video sequence and correlation between the matching score by face recognition and quality score: (a) all the 25 images in a video sequence; (b) the graph of correlation between the quality scores and matching scores.
Although the weighted quality fusion approach can be considered as an alternative, this approach usually requires the weight values for fusion. The weight values can be determined by the experience of developer, but it cannot guarantee the optimal weight values to be determined irrespective of the variety of input data. To solve this problem, the weight values should be obtained through the time-consuming training procedure, which makes the performance of system be affected by the kinds of training data. However, our fuzzy-based fusion approach of image quality has the advantage of being less affected by the types of face databases because it does not perform an additional training procedure, which was experimentally proved with two databases (our own database and Database II) as shown in Table 7 and Table 8. This is the reason why we choose fuzzy approach over weighted quality metrics.
In general, the quality metrics which should have higher weights can be changed according to the kinds of database. As shown in Figure 14, the quality metrics of head pose ( of Equation (2)) and openness of eye ( of Equation (6)) are more dominant than others because the variations of head pose and eye openness/closure are frequent in our database. However, Figure 24 shows that the quality metrics of illumination ( of Equation (4)) and contrast ( of Equation (7)) are more dominant than others because the variations of illumination and contrast are frequent in Database II. Therefore, the quality metrics which should have higher weights can be changed according to the kinds of database, and our method (based on adaptive QM selection and fuzzy-based fusion as shown in Figure 6) can select the optimal quality metrics and quality score considering the variety of database. In addition, this was experimentally proved with two databases (our own database and Database II) as shown in Table 7 and Table 8.
4. Conclusions
In this paper, we proposed a new performance enhancement method of face recognition by the adaptive selection of face images through symmetrical fuzzy-based quality assessment. To select high-quality face images from a video sequence, we measured the qualities of face images on the basis of four QMs that were adaptively selected by comparing the variations of each of the six QMs. These QMs were combined using a fuzzy system (based on symmetrical membership function and rule table considering the characteristics of symmetry) into one quality score for the face image. After obtaining the quality score of the face image, high-quality images from the Face Log were selected in the order of the quality score of each image. The performance of face recognition was enhanced by fusing the matching scores of the high-quality face images.
Experimental results show that the proposed method outperforms the other methods in terms of accuracy. Misrecognition errors are caused by a size difference between the face areas of enrolled image and input one due to the incorrect detection of face and eye region. These can be solved by increasing the accuracy of re-definition of face area based on more accurate detection algorithm. Because our research is not focused on accurate detection, but focused on correctly selecting the face images of good quality, research in accurate detection could be studied as a future work.
Acknowledgments
This work was supported by the SW R&D program of MSIP/IITP (10047146, Real-time Crime Prediction and Prevention System based on Entropy-Filtering Predictive Analytics of Integrated Information such as Crime-Inducing Environment, Behavior Pattern, and Psychological Information).
Author Contributions
Yeong Gon Kim and Kang Ryoung Park designed the overall system of proposed face recognition. In addition, they wrote and revised the paper. Won Oh Lee, Ki Wan Kim, and Hyung Gil Hong implemented the methods of face and eye detection. Also, they helped the data collection and experiments.
Conflicts of Interest
The authors declare no conflict of interest.
References
- Lin, K.-H.; Shiue, D.-H.; Chiu, Y.-S.; Tsai, W.-H.; Jang, F.-J.; Chen, J.-S. Design and Implementation of Face Recognition-aided IPTV Adaptive Group Recommendation System Based on NLMS Algorithm. In Proceedings of International Symposium on Communications and Information Technologies, Gold Coast, Australia, 2–5 October 2012; pp. 626–631.
- Lee, S.-H.; Sohn, M.-K.; Kim, D.-J.; Kim, B.; Kim, H. Smart TV Interaction System Using Face and Hand Gesture Recognition. In Proceedings of International Conference on Consumer Electronics, Las Vegas, NV, USA, 11–14 January 2013; pp. 173–174.
- Chae, Y.N.; Lee, S.; Han, B.O.; Yang, H.S. Vision-based Sleep Mode Detection for a Smart TV. In Proceedings of International Conference on Consumer Electronics, Las Vegas, NV, USA, 11–14 January 2013; pp. 123–124.
- Gao, Y.; Leung, M.K.H. Face Recognition Using Line Edge Map. IEEE Trans. Pattern Anal. Mach. Intell. 2002, 24, 764–779. [Google Scholar]
- Yilmaz, A.; Gökmen, M. Eigenhill vs. Eigenface and Eigenedge. Pattern Recognit. 2001, 34, 181–184. [Google Scholar] [CrossRef]
- Basri, R.; Jacobs, D.W. Lambertian Reflectance and Linear Subspaces. IEEE Trans. Pattern Anal. Mach. Intell. 2003, 25, 218–233. [Google Scholar] [CrossRef]
- Georghiades, A.S.; Belhumeur, P.N.; Kriegman, D.J. From Few to Many: Illumination Cone Models for Face Recognition under Variable Lighting and Pose. IEEE Trans. Pattern Anal. Mach. Intell. 2001, 23, 643–660. [Google Scholar] [CrossRef]
- Du, S.; Ward, R. Face Recognition under Pose Variations. J. Frankl. Inst. Eng. Appl. Math. 2006, 343, 596–613. [Google Scholar] [CrossRef]
- Wiskott, L.; Fellous, J.-M.; Krüger, N.; Malsburg, C.V.D. Face Recognition by Elastic Bunch Graph Matching. IEEE Trans. Pattern Anal. Mach. Intell. 1997, 19, 775–779. [Google Scholar] [CrossRef]
- Cootes, T.F.; Edwards, G.J.; Taylor, C.J. Active Appearance Models. IEEE Trans. Pattern Anal. Mach. Intell. 2001, 23, 681–685. [Google Scholar] [CrossRef]
- Belhumeur, P.N.; Hespanha, J.P.; Kriegman, D.J. Eigenfaces vs. Fisherfaces: Recognition Using Class Specific Linear Projection. IEEE Trans. Pattern Anal. Mach. Intell. 1997, 19, 711–720. [Google Scholar] [CrossRef]
- Blanz, V.; Grother, P.; Phillips, P.J.; Vetter, T. Face Recognition Based on Frontal Views Generated from Non-Frontal Images. In Proceedings of International Conference on Computer Vision and Pattern Recognition, San Diego, CA, USA, 20–25 June 2005; pp. 454–461.
- Blanz, V.; Vetter, T. Face Recognition Based on Fitting a 3D Morphable Model. IEEE Trans. Pattern Anal. Mach. Intell. 2003, 25, 1063–1074. [Google Scholar] [CrossRef]
- Vetter, T. Learning Novel Views to a Single Face Image. In Proceedings of International Conference on Automatic Face and Gesture Recognition, Killington, VT, USA, 14–16 October 1996; pp. 22–27.
- Wang, H.; Wang, Y.; Cao, Y. Video-based Face Recognition: A Survey. World Acad. Sci. Eng. Technol. 2009, 60, 293–302. [Google Scholar]
- Barr, J.R.; Bowyer, K.W.; Flynn, P.J.; Biswas, S. Face Recognition from Video: A Review. J. Pattern Recognit. Artif. Intell. 2012, 26, 1266002:1–1266002:53. [Google Scholar] [CrossRef]
- O’Toole, A.J.; Roark, D.A.; Abdi, H. Recognizing Moving Faces: A Psychological and Neural Synthesis. Trends Cognit. Sci. 2002, 6, 261–266. [Google Scholar] [CrossRef]
- Chowdhury, A.R.; Chellappa, R.; Krishnamurthy, S.; Vo, T. 3D Face Reconstruction from Video Using A Generic Model. In Proceedings of International Conference on Multimedia and Expo, Lausanne, Switzerland, 26–29 August 2002; pp. 449–452.
- Baker, S.; Kanade, T. Limits on Super-Resolution and How to Break Them. IEEE Trans. Pattern Anal. Mach. Intell. 2002, 24, 1167–1183. [Google Scholar] [CrossRef]
- Liu, X.; Chen, T.; Thornton, S.M. Eigenspace Updating for Non-stationary Process and Its Application to Face Recognition. Pattern Recognit. 2003, 36, 1945–1959. [Google Scholar] [CrossRef]
- Nasrollahi, K.; Moeslund, T.B. Complete Face Logs for Video Sequences Using Face Quality Measures. IET Signal Process. 2009, 3, 289–300. [Google Scholar] [CrossRef]
- Hsu, R.-L.V.; Shah, J.; Martin, B. Quality Assessment of Facial Images. In Proceedings of Biometrics Consortium Conference, Baltimore, MD, USA, 19–21 September 2006; pp. 1–6.
- Fourney, A.; Laganière, R. Constructing Face Image Logs that are Both Complete and Concise. In Proceedings of Canadian Conference on Computer and Robot Vision, Montreal, QC, Canada, 28–30 May 2007; pp. 488–494.
- Nasrollahi, K.; Moeslund, T.B. Hybrid Super Resolution Using Refined Face Logs. In Proceedings of International Conference on Image Processing Theory, Tools and Applications, Paris, France, 7–10 July 2010; pp. 435–440.
- Bagdanov, A.D.; Bimbo, A.D.; Dini, F.; Lisanti, G.; Masi, I. Posterity Logging of Face Imagery for Video Surveillance. IEEE Multimedia 2012, 19, 48–59. [Google Scholar] [CrossRef]
- Bharadwaj, S.; Bhatt, H.; Vatsa, M.; Singh, R.; Noore, A. Quality Assessment based Denoising to Improve Face Recognition Performance. In Proceedings of IEEE Computer Society Conference on Computer Vision and Pattern Recognition Workshops, Colorado Springs, CO, USA, 20–25 June 2011; pp. 140–145.
- Wei, Z.; Li, X.; Zhuo, L. An Automatic Face Log Collection Method for Video Sequence. In Proceedings of International Conference on Internet Multimedia Computing and Service, Huangshan, China, 16–18 August 2013; pp. 376–379.
- Anantharajah, K.; Denman, S.; Sridharan, S.; Fookes, C.; Tjondronegoro, D. Quality Based Frame Selection for Video Face Recognition. In Proceedings of International Conference on Signal Processing and Communication Systems, Gold Coast, Australia, 12–14 December 2012; pp. 1–5.
- Webcam C600. Available online: https://support.logitech.com/en_us/product/5869 (accessed on 13 August 2015).
- Lee, W.O.; Kim, Y.G.; Shin, K.Y.; Nguyen, D.T.; Kim, K.W.; Park, K.R.; Oh, C.I. New Method for Face Gaze Detection in Smart Television. Opt. Eng. 2014, 53, 053104:1–053104:12. [Google Scholar] [CrossRef]
- Viola, P.; Jones, M.J. Robust Real-Time Face Detection. Int. J. Comput. Vis. 2004, 57, 137–154. [Google Scholar] [CrossRef]
- Boyle, M. The Effects of Capture Conditions on the CAMSHIFT Face Tracker; Technical Report 2001-691-14; Department of Computer Science, University of Calgary: Calgary, Canada, 2001. [Google Scholar]
- Tripathi, A.K.; Mukhopadhyay, S.; Dhara, A.K. Performance Metrics for Image Contrast. In Proceedings of International Conference on Image Information Processing, Himachal Pradesh, India, 3–5 November 2011; pp. 1–4.
- Barghout, L. System and Method for Edge Detection in Image Processing and Recognition. U.S. Patent PCT/US2006/039812, 20 April 2006. [Google Scholar]
- Grycuk, R.; Gabryel, M.; Korytkowski, M.; Scherer, R.; Voloshynovskiy, S. From Single Image to List of Objects Based on Edge and Blob Detection. In Artificial Intelligence and Soft Computing; Springer International Publishing: Cham, Switzerland, 2014; Volume 8468, pp. 605–615. [Google Scholar]
- Barghout, L. Spatial-Taxon Information Granules as Used in Iterative Fuzzy-Decision-Making for Image Segmentation. In Granular Computing and Decision-Making: Interactive and Iterative Approaches; Springer International Publishing: Cham, Switzerland, 2015; Volume 10, pp. 285–318. [Google Scholar]
- Mamdani, E.H.; Assilian, S. An experiment in linguistic synthesis with a fuzzy logic controller. Int. J. Man Mach. 1975, 7, 1–13. [Google Scholar] [CrossRef]
- Hurwitz, D.S.; Wang, H.; Knodler, M.A., Jr.; Ni, D.; Moore, D. Fuzzy sets to describe driver behavior in the dilemma zone of high-speed signalized intersections. Transport. Res. Part F Traffic Psychol. Behav. 2012, 15, 132–143. [Google Scholar] [CrossRef]
- Wu, J.; Wu, Y. Detecting Moving Objects Based on Fuzzy Non-Symmetric Membership Function in Color Space. Int. J. Eng. Ind. 2011, 2, 62–69. [Google Scholar]
- Klir, G.J.; Yuan, B. Fuzzy Sets and Fuzzy Logic-Theory and Applications; Prentice-Hall: Upper Saddle River, NJ, USA, 1995. [Google Scholar]
- Leekwijck, W.V.; Kerre, E.E. Defuzzification: Criteria and Classification. Fuzzy Sets Syst. 1999, 108, 159–178. [Google Scholar] [CrossRef]
- Hines, G.; Rahman, Z.-U.; Jobson, D.; Woodell, G. Single-Scale Retinex Using Digital Signal Processors. In Proceedings of Global Signal Processing Conference, Santa Clara, CA, USA, 27–30 September 2004.
- Turk, M.; Pentland, A. Eigenfaces for Recognition. J. Cogn. Neurosci. 1991, 3, 71–86. [Google Scholar] [CrossRef] [PubMed]
- Ahonen, T.; Hadid, A.; Pietikäinen, M. Face Description with Local Binary Patterns: Application to Face Recognition. IEEE Trans. Pattern Anal. Mach. Intell. 2006, 28, 2037–2041. [Google Scholar] [CrossRef] [PubMed]
- Nguyen, D.T.; Cho, S.R.; Shin, K.Y.; Bang, J.W.; Park, K.R. Comparative Study of Human Age Estimation with or Without Pre-classification of Gender and Facial Expression. Sci. World J. 2014, 2014, 1–15. [Google Scholar]
- Lee, W.O.; Kim, Y.G.; Hong, H.G.; Park, K.R. Face Recognition System for Set-Top Box-Based Intelligent TV. Sensors 2014, 14, 21726–21749. [Google Scholar] [CrossRef] [PubMed]
- FEI Face Database. Available online: http://fei.edu.br/~cet/facedatabase.html (accessed on 13 August 2015).
- Minear, M.; Park, D.C. A lifespan database of adult facial stimuli. Behav. Res. Methods 2004, 36, 630–633. [Google Scholar] [CrossRef]
- AR Face Database. Available online: http://www2.ece.ohio-state.edu/~aleix/ARdatabase.html (accessed on 13 August 2015).
- The Japanese Female Facial Expression (JAFFE) Database. Available online: http://www.kasrl.org/jaffe.html (accessed on 13 August 2015).
- Wolf, L.; Hassner, T.; Maoz, I. Face Recognition in Unconstrained Videos with Matched Background Similarity. In Proceedings of IEEE Conference on Computer Vision and Pattern Recognition, Providence, RI, USA, 20–25 June 2011; pp. 529–534.
- Lee, K.-C.; Ho, J.; Yang, M.-H.; Kriegman, D. Visual tracking and recognition using probabilistic appearance manifolds. Comput. Vis. Image Underst. 2005, 99, 303–331. [Google Scholar] [CrossRef]
- Gorodnichy, D.O. Video-based Framework for Face Recognition in Video. In Proceedings of the 2nd Canadian Conference on Computer and Robot Vision, British Columbia, BC, Canada, 9–11 May 2005; pp. 1–9.
- Gao, W.; Cao, B.; Shan, S.; Chen, X.; Zhou, D.; Zhang, X.; Zhao, D. The CAS-PEAL large-scale Chinese face database and baseline evaluations. IEEE Trans. Syst. Man Cybern. 2008, 38, 149–161. [Google Scholar]
- CAS-PEAL-R1 Face Database. Available online: http://www.jdl.ac.cn/peal/ (accessed on 13 August 2015).
- TV Size to Distance Calculator and Science. Available online: http://www.rtings.com/info/television-size-to-distance-relationship (accessed on 13 August 2015).
- Everingham, M.; Gool, L.V.; Williams, C.K.I.; Winn, J.; Zisserman, A. The Pascal Visual Object Classes (VOC) Challenge. Int. J. Comput. Vis. 2010, 88, 303–338. [Google Scholar] [CrossRef]
- Sensitivity and Specificity. Available online: http://en.wikipedia.org/wiki/Sensitivity_and_specificity (accessed on 13 August 2015).
- Correlation and Dependence. Available online: http://en.wikipedia.org/wiki/Correlation_and_dependence (accessed on 13 August 2015).
- Martin, R.; Arandjelović, O. Multiple-Object Tracking in Cluttered and Crowded Public Spaces. Lect. Notes Comput. Sci. 2010, 6455, 89–98. [Google Scholar]
© 2015 by the authors; licensee MDPI, Basel, Switzerland. This article is an open access article distributed under the terms and conditions of the Creative Commons Attribution license (http://creativecommons.org/licenses/by/4.0/).