Abstract
The ability to assess geometric asymmetry in the torsos of individuals is important for detecting Adolescent Idiopathic Scoliosis (AIS). A markerless technique using Surface Topography (ST) has been introduced as a non-invasive alternative to standard diagnostic radiographs. The technique has been used to identify asymmetry patterns associated with AIS. However, the presence and nature of asymmetries in the healthy population has not been properly studied. The purpose of this study is therefore to identify asymmetries and potential relationships to development factors such as age, gender, hand dominance and unilateral physical activity in healthy adolescents. Full torso scans of 83 participants were analyzed. Using Geomagic, deviation contour maps (DCMs) were created by reflecting the torso along the best plane of sagittal symmetry with each spectrum normalized. Two classes of asymmetry were observed: twist and thickness each with subgroupings. Averaged interobserver and intraobserver Kappas for twist subgroupings were 0.84 and 0.84, respectively, and for thickness subgroupings were 0.53 and 0.63 respectively. Further significant relationships were observed between specific types of asymmetry and gender such as females displaying predominately twist asymmetry, and males with thickness asymmetry. However, no relationships were found between type of asymmetry and age, hand dominance or unilateral physical activity. Understanding asymmetries in healthy subjects will continue to enhance assessment ability of the markerless ST technique.
1. Introduction
Adolescence is the period of development between the ages of 10–19 years [1]. From 10 to 14 years, early adolescence is the period of most physical growth, and often a period of increased physical activity as well. At this stage, males and females begin to develop physical attributes that characterize their gender. Late adolescence from 15 to 19 years is characterized by cognitive maturation [2]. Females generally undergo the onset of puberty earlier in comparison to males with the appearance of their menarche [3].
Scoliosis is a condition characterized by lateral curvature and axial rotation of the spine [4]. The deformity is most common in adolescents ranging from age 10 to 18 years, with the cause of the abnormal spine undetermined. This type of scoliosis is thus termed adolescent idiopathic scoliosis (AIS) [5]. Despite an unknown etiology, in many studies there appears to be an implication that the circumstances of scoliosis are not due to abnormal spine growth, but rather a consequence of the normal developing spine. The initiation and consequent development of scoliosis seems therefore to be related to the changes of structural components such as the muscles and bones of the human body during adolescent growth [6,7]. Although both genders are susceptible, there is a higher prevalence of females being affected by scoliosis. Curve severity increases with age and is also more likely to progress in females [8]. The current standard diagnostic and monitoring techniques involve using two dimensional (2D) radiographic imaging of the full spine. However, such techniques expose an adolescent’s developing body to elevated amounts of ionizing radiation, which may result in harmful consequences such as DNA mutations and increased cancer risk [9,10].
Surface topography (ST) is a non-invasive assessment alternative. ST captures three dimensional (3D) surface images and utilizes this data for asymmetry analysis of the torso and spine [11]. More specifically, the technique captures the 3D effects on the surface of the spine deformity and does not expose the patient to any ionization radiation. Although there are no harmful implications of using ST, other limitations exist. Such limits include sensitivity of distance or angle measurements to errors in landmark placement or digitization on the torsos [12]. Therefore, a markerless technique was proposed that involves reflection of the torso about the best plane of sagittal symmetry and creating a map whose colors outline different asymmetrical features of the torso [13]. Initial development of the technique showed the ability to predict spinal curvature, shape and severity based on these asymmetry patterns in patients with AIS [14]. The depth and variations in colors allowed for the classification of patients with scoliosis and prediction of several radiographic parameters [13].
Further development of this markerless ST technique needs to be investigated before clinical implementation including understanding typical asymmetries in normally developing subjects. Many studies have looked at asymmetries of healthy subjects, however ST was not employed to measure these asymmetries [15,16,17]. Comparison of asymmetry patterns observed in healthy adolescents to those with abnormal spinal curvature and rotation will help improve our ability to interpret ST findings when assessing patients with scoliosis by providing a threshold for analysis. Adolescence is a period of growth that is influenced by many different factors. Once asymmetry patterns in healthy subjects are identified, the relationship between asymmetries and developing factors that include age, gender, hand dominance and unilateral physical activity will also be analyzed.
The objectives of this study are to classify the asymmetries present in the torsos of healthy adolescents, to determine the reliability of the classifications of these asymmetries and to identify the relationships between these asymmetrical manifestations and age, gender, hand dominance and unilateral physical activity.
2. Method
2.1. Subjects
We aimed to recruit ninety healthy female and male adolescents with approximately five persons from each gender for each age between 10 and 18 years. Participants completed a single hour-long assessment to confirm their eligibility and acquire surface topography data of the torso shape for the study. Information of hand dominance and physical activity were collected by a telephone and email questionnaire. The questions asked were: (1) Are you right or left-handed? (2) At the time of your evaluation, did you participate in any sports or physical activities? If so, did they include the preference of one hand over the other?
Participants were excluded if they presented back pain (>2 pts on numeric pain rating scale out of 10), leg length discrepancies (>2.5 cm) [18,19], prior torso or lower extremity surgeries, torso or lower extremity contractures (>15 degrees) or scoliometer asymmetries during Adam’s forward bending test >7° [20]. Patients attending the Edmonton Scoliosis Clinic and all participants were provided a flyer to invite 2–3 healthy friends as volunteers to seek information about the study. Recruitment flyers were posted at the Glenrose Hospital, and University of Alberta. Ads were placed in the Capital Health and Faculty of Rehabilitation Medicine and in community leagues e-newsletters.
Participants under 14 years old provided assent and their parent signed a parental consent form after reviewing the information document. Older participants provided informed consent. The study was approved by the University of Alberta Health Research Ethics Board (Pro00003600).
2.2. Clinical Examination to Confirm Eligibility
All participants completed a clinical history questionnaire in 5–10 min. to collect socio-demographics and screen for present or past torso or lower extremity problems to confirm eligibility. Participants also completed clinical questionnaires including the numeric pain ratings scale [18], the Scoliosis Research Society-22 questionnaire (SRS-22r) [21,22,23,24] and the Spinal Appearance Questionnaire. The purpose of the questionnaires was to confirm subject eligibility. Subjects presenting any problems identified by the questionnaire were excluded from the study sample of healthy participants.
A 15-min. physical screening examination was also done to confirm normal function of subject’s spine and lower extremity. The range of motion of passive lower extremity movements was collected [25]. Leg lengths were quantified in supine from the anterior superior iliac spine to the lower tip of the medial malleolus using a tape measure [19]. The range of motion of the torso movements in all planes was recorded using digital double inclinometers to confirm symmetry of movements [25]. The maximum and minimum asymmetry in scoliometer measurement was recorded during the Adam forward bend test [20,26].
2.3. Surface Topography Data Acquisition
Subjects disrobed their torso area and to maintain privacy, females used stick-on bras, which were predetermined to generally not affect the scan or analysis. Subjects were positioned in a standard frame according to position guidelines, ensuring assessment of the natural posture of the torso, while controlling the alignment of the feet, shins, and arm elevation to 90 degrees [27]. Further, a probe touching the cervical vertebra C7 provided feedback to limit body sway. The scan was acquired using four Konica Minolta 3D Vivid 910 laser cameras to capture the torso shape from the anterior, posterior, left and right perspectives using the Polygon Editing Tool (PET) software [28,29].
After the first set of scans (Set A) was obtained, subjects were asked to step out of the frame, which was reset to its original storage position. A second scan (Set B) was then obtained using the same procedures for frame adjustment and body positioning as described above. The same evaluator, a Ph.D. student new at using this procedure, acquired all scans included in this study.
Clinically, a total of 10 min would be sufficient for a participant to disrobe, be instructed in the scanning position and to complete a scanning procedure (scanning is less than 15 s). It is possible to automate the processing procedure described below where analysis could be completed in 20 min for clinical applications.
2.4. Data Preprocessing and Processing
The scans from each of the four cameras were exported from PET as vivid (vvd) files and imported into Geomagic to be processed. The same operator completed the processing of all scans. Scans were registered in space with both the “Manual Registration” option and “Global Registration” to perfect the alignment. Once all views were adequately registered, they were merged with the “Merge” function and smoothed to reduce extraneous background noise. To obtain only the relevant data for torso analysis, the scan was cropped at the following locations: above the C7, at the armpits, and below the posterior superior iliac spine (PSIS). Scans with significant holes or spikes representative of motion artifacts were excluded from the analysis.
To obtain the DCM in Geomagic Control, the original torso was set as the reference and a test copy was duplicated from it. The test torso was mirrored about the YZ plane (midsagittal plane). Using the “Best Fit Alignment” function built into Geomagic, the reflected torso was aligned against the original torso where the distances between the original and corresponding points of the duplicated reflected torso were minimized. The combination of mirroring and alignment of the original torso gives the best plane of sagittal rotoinversion symmetry, a plane of symmetry which considers both bilateral and rotational perspectives [30]. Hill et al. also showed that for torso geometry, this procedure is equivalent to finding the torso’s plane of best sagittal symmetry [30].
Using the “3D Compare” function in Geomagic, the DCM can be obtained to illustrate the areas of the torso with most asymmetry. Green areas are commonly referred to as nominal values and represent symmetry in that area within an acceptable range. Blue areas indicate protrusion compared to the corresponding reflected half, and red indicates the opposite where the original torso is depressed in comparison [13]. The thresholds in the color spectrum of the DCM for each subject were modified to best show the asymmetries on their torso. The spectrum of each DCM was adjusted by increasing the max/min nominal value by 0.2 mm at a time until the torso was completely green or significant areas of asymmetry disappeared. Two DCMs were created for set A and set B of each subject. Set A of all subjects was processed first and the nominal values for each was recorded. Once set A was complete, analysis on set B for all subjects began using the same method as described above. This was to ensure that the results of set A would not affect the results of set B. The max/min nominal values between sets A and B for each subject were then averaged. Using this averaged max/min nominal value as the max/min critical value (extremities of the spectrum), a final DCM was created for both set A and set B, so that both sets of scans could be compared using the same spectrum while still allowing the DCM to illustrate maximal asymmetry. The new max/min nominal value on the final DCMs were set to 0 in order to consider all asymmetries in normal subjects. Rather than a single max/min critical and max/min nominal value for the entire sample size, individual subject values were created in order to eliminate the possibility of under-analyzing a subject. All DCMs of this study were generated by a single individual.
2.5. Classification of Asymmetry Patterns
By the same evaluator processing the scans, the torsos were individually inspected noting patterns of asymmetry and a subsequent qualitative classification system was created based on the observations. Two broad distinct groups were created in this classification based on whether twist or thickness was demonstrated in the surface scan.
Twist and thickness are defined based on the placements of the color patches on the torso. Twist is characterized by having oppositely colored patches on the corresponding anterior and posterior areas of the torso. Thickness is defined by having identical colors on corresponding anterior and posterior parts of the torso. A pair of blue patches indicated that the original torso is thicker in that area compared to its pair on the other side of the medial plane. A pair of red patches demonstrates the opposite; the original torso is thinner in comparison to its other half (Figure 1).
The degree of twist and the type of twist however varied, leading to further division of the subjects into three different subgroups corresponding to the number of alternating color patches present on their torso. These twist subgroups are identified by the posterior side of the torso and will be referred to by Two, Three and Four indicating the respective number of alternating color patches. The transition zone between color patches indicates the origin at which the torso is rotated (Figure 2) [13].
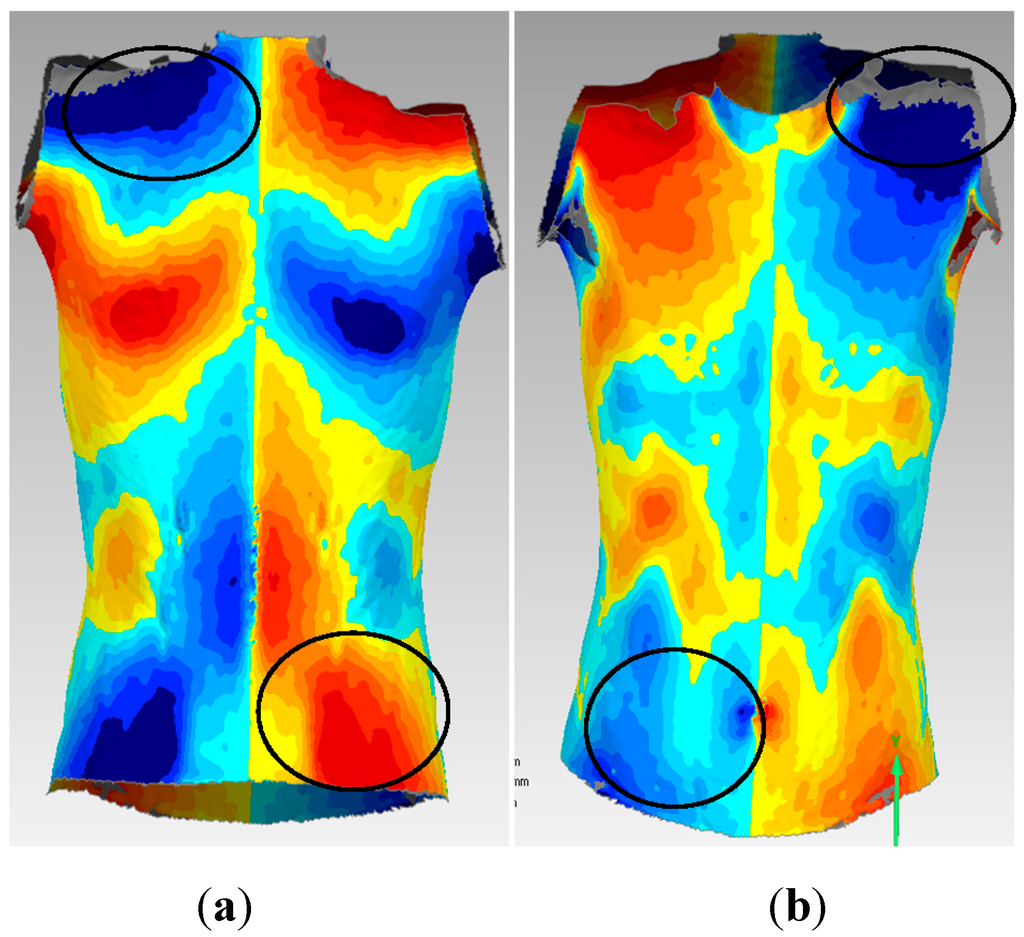
Figure 1.
Posterior (a) and anterior (b) views of a subject with areas of twist and thickness defined. The superior pair of circles display thickness asymmetry while the inferior pair of circles display twist asymmetry. Based on the torso model (Appendix), this subject has a thicker left shoulder but is twisted inferior to this region.
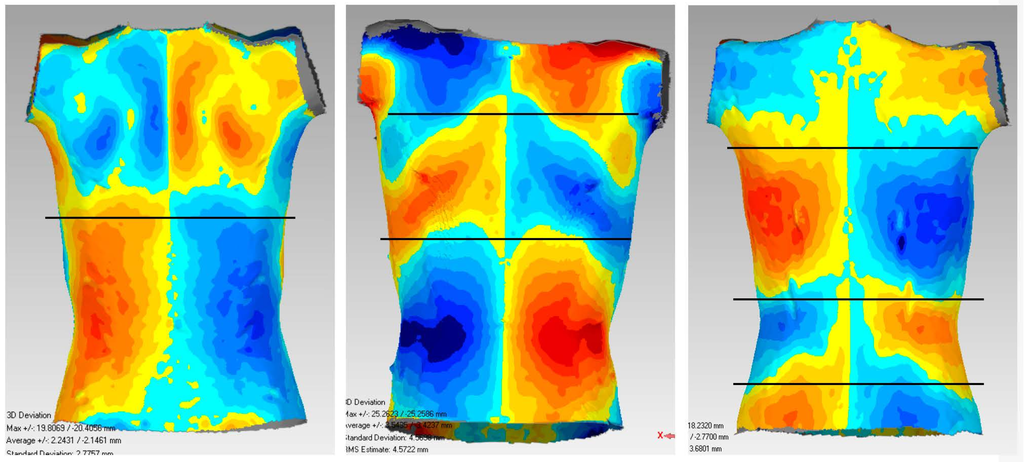
Figure 2.
Twist subgroups: Two, Three, and Four respectively with horizontal planes indicating the transition between alternating color patches.
Subgroups were also created and identified based on whether thickness was located at the shoulder, pectoral/breast, rectus abdominis or oblique muscle areas (Appendix). Each area was further subdivided into the left, right and none to distinguish which side of that area was thicker. These areas were defined based on the anterior perspective of the torso for ease and clarity during identification.
2.6. Analysis of the Association between Asymmetry Patterns and Developing Factors
The relationship between different asymmetry patterns and developing factors were evaluated by two different statistical measures depending on the type of data. For age, an Eta value was calculated due to the categorical nature of asymmetry patterns versus the continuous age variable. For gender, hand dominance and physical activity, Pearson’s Chi-square (X2) tests for independence were used to evaluate the significance of the relationships with the asymmetry pattern using an alpha level of 0.05 [31].
2.7. Reliability
Two types of reliability were examined. The first was test-retest reliability of the scans—a comparison analysis of the two scans for the same subject: set A and set B. To further determine the reproducibility of the deviation maps, two more subjects, one adult female and one adult male had 10 scans captured using the same method as previously described.
Second, interobserver reliability in classifying the different asymmetry patterns proposed was assessed. All subjects were classified into different categories by each of the five observers. Out of the five, only one observer had previous knowledge of related studies and of the method behind the creation of the maps. The four other observers were asked to read and understand basic background information and instructions before beginning. None of the observers had prior clinical training in the assessment of posture. Intraobserver reliability was examined as well. Due to the length of time needed to classify all subjects into subgroups, only one experienced rater could be reached to perform the classifications a second time, and therefore only one intra-rater Kappa was calculated. The time required to complete full assessment of all subjects by one observer was approximately 2.5 h. The time between the initial assessment and repetition of the assessment by the experienced rater was two weeks, in which the rater did not have access to the classification results of the first attempt.
The reliability of classifications (both intra and interrater) of different asymmetry patterns was evaluated using Fleiss’ Kappa (κ) with 95% confidence interval [32]. Kappa measures the agreement between a given number of ratings, while factoring out the potential agreement due to chance [32]. Although there only exists arbitrary interpretations, the commonly used benchmarks proposed by Landis and Koch was used in the present study [33]. The Kappa statistic ranged from 0.00 to 1.00 with 1.00 representing perfect agreement. Poor agreement is defined as <0.00, followed by slight, fair, moderate, substantial and almost perfect for the following intervals of 0.00–0.20, 0.21–0.40, 0.41–0.60, 0.61–0.80 and 0.81–1.00 respectively. The average of multiple Kappa coefficients were calculated by Fisher Transformation of the Kappa coefficients, averaging the results of the transformed values and then using the Fisher inverse transformation to obtain the averaged coefficient [34].
3. Results
3.1. Subject Demographics
After exclusion, there was a minor imbalance in the age and gender categories, leaving a remaining total of 83 subjects overall. No more than two subjects were excluded in each age group. Forty-two males and forty-one females remained. Fifty-five participants responded to the hand dominance and physical activity questionnaire with 48 being right handed, and seven left handed. Twenty-seven of those that responded participated in a unilateral activity or sport that was outside the scope of their physical education in school. Table 1 further summarizes the relevant demographic information.

Table 1.
Subject Demographics.
| Age (years) | 10 | 11 | 12 | 13 | 14 | 15 | 16 | 17 | 18 | |
|---|---|---|---|---|---|---|---|---|---|---|
| # females included | 4 | 5 | 4 | 5 | 5 | 3 | 5 | 4 | 6 | |
| # males included | 6 | 4 | 5 | 4 | 5 | 5 | 4 | 5 | 4 | |
| Mean scoliometer measurement (°) | Max | Min | ||||||||
| 1.17 ± 2.08 | −2.28 ± 2.38 | |||||||||
| Mean BMI (kg/m2) | 19.6 ± 2.7 | |||||||||
| Dominance frequency | Right Hand | Left Hand | ||||||||
| 48 | 7 | |||||||||
| Unilateral physical activity frequency | 27/55 | |||||||||
3.2. Classification of Subjects into Twist and Thickness Asymmetries
The 83 sets of asymmetry maps for the subjects could be divided based on their displaying two characteristics: twist and thickness. A twist pattern was identified in all 83 participants; however, only 28 subjects displayed strictly a twist pattern and thus these subjects were placed in the twist category. Areas of thickness were identified on either the right or left sides for certain muscle areas in the remaining 55 of the 83 subjects, and, therefore, these subjects were placed into the thickness category. Subjects were also placed in multiple thickness categories if their asymmetry map displayed multiple areas of thickness (Table 2).
Table 2.
Division of subjects in twist and thickness asymmetry subgroups. The left, right and none sides are abbreviated to L, R and N respectively.
| Twist Asymmetries | Two | Three | Four | None | ||||||||
|---|---|---|---|---|---|---|---|---|---|---|---|---|
| 14 | 11 | 3 | 55 | |||||||||
| Thickness Asymmetries | Shoulders | Pectorals/Breasts | Rectus Abdominis | Obliques | ||||||||
| L | R | N | L | R | N | L | R | N | L | R | N | |
| 15 | 22 | 46 | 14 | 15 | 54 | 7 | 7 | 69 | 14 | 5 | 64 | |
3.3. Reliability
Test-retest reliability was measured by visually observing the 10 DCMs of both adult subjects. Figure 3 presents the 10 scans of the adult female volunteer. Classification of the adult subject DCMs between either twist or thickness was reached as unanimous decision. Classification into subgroups, however, differed.
Therefore, when classifying adolescent subjects into their respective subcategories, both sets of scans were considered simultaneously by raters in order to reach a decision minimizing the influence of the variability between scans. Generally, the set of scans for a subject produced similar patterns although not identical.
3.3.1. Interobserver Reliability
The average Kappa for deciding between twist subgroups Two, Three, Four and None was 0.84. The Kappa for deciding separately if a subject showed pattern Two or not, Three or not, and Four or not, as well as None or not produced individual Kappa coefficients of 0.81, 0.71, 0.52 and 0.99 respectively. The “None” category was essentially the agreement of a subject placement in the thickness category and not the twist only (Table 2). The subjects were placed officially into the Two, Three and Four subgroups according to the subgroups for which an interobserver agreement of ≥60% (3/5 observers) was reached. The number of subjects ultimately assigned to the twist category and each twist subgroup using this consensus method is shown in Table 2. In total 14, 11 and three displayed two, three and four alternating color patches respectively.
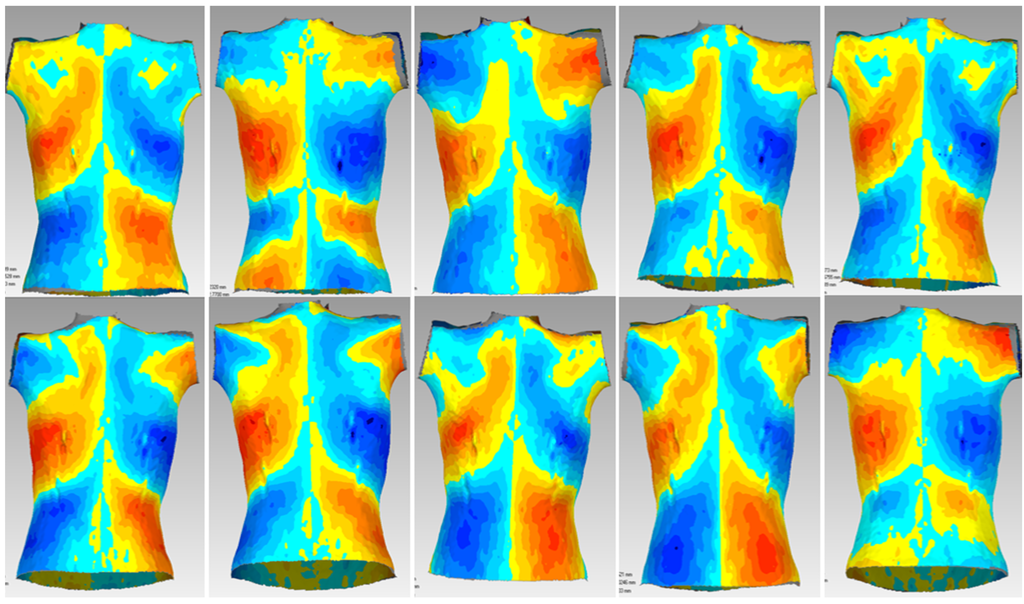
Figure 3.
10 posterior scans of the adult female volunteer when observing test-retest reliability.
Table 3 represents the summary matrix that assessed the discrepancy of classifications between each pair of observers, for a total of 10 pairs for each of the 83 subjects. The diagonal represents complete agreement in that subgroup for a pair of observers assessing twist subcategories. The off-diagonal components represent the location of disagreement. The highest level of disagreement observed is between subgroups Two and Three with a frequency of 35.
Table 3.
Distribution of agreements and disagreements for the twist subcategories between pairs of observers from a sample size of five observers.
| Colume heading | Two | Three | Four | None |
|---|---|---|---|---|
| Two | 111 | |||
| Three | 35 | 90 | ||
| Four | 7 | 21 | 16 | |
| None | 0 | 4 | 0 | 546 |
The inter-rater Kappa coefficients calculated for each section for determining between left, right or none sides of thickness being noted (total ratings), were 0.63, 0.61, 0.39 and 0.47 for shoulders, pectorals/breasts, rectus abdominis and obliques respectively (Table 4). The overall average Kappa was 0.53 for the thickness category. Subjects were placed into definitive thickness areas when at least 60% (3/5) of the raters assigned a subject to the same thickness subcategory. When the ratings were distributed more evenly between subgroups and a majority was not clear, the subject was officially classified into the “None” category to avoid ambiguity. The number of subjects for thickness and each thickness subgroup are reported in Table 2.
Table 4.
Inter-observer Kappa coefficients and 95% confidence intervals (κ [95% CI]) for twist and thickness asymmetry subgroups.
| Twist Asymmetry | Two | Three | Four | None | |
| 0.81 [0.74,0.88] | 0.71 [0.64,0.78] | 0.52 [0.45,0.58] | 0.99 [0.92,1.06] | ||
| Average Kappa | 0.84 [0.80,0.89] | ||||
| Thickness Asymmetry | Total | Left | Right | None | |
| Shoulders | 0.63 [0.58,0.68] | 0.69 [0.62,0.76] | 0.63 [0.56,0.69] | 0.60 [0.53,0.66] | |
| Pectorals/Breasts | 0.61 [0.56,0.66] | 0.58 [0.52,0.65] | 0.64 [0.57,0.71] | 0.60 [0.53,0.67] | |
| Rectus Abdominis | 0.39 [0.33,0.44] | 0.37 [0.30,0.44] | 0.41 [0.34,0.47] | 0.38 [0.31,0.45] | |
| Obliques | 0.47 [0.41,0.52] | 0.55 [0.48,0.62] | 0.28 [0.21, 0.35] | 0.49 [0.42,0.55] | |
| Average Kappa | 0.53 [0.48,0.58] | ||||
Table 5 summarizes the discrepancies in agreements by matrix format between left, right or none sides in the shoulders, pectorals/breasts, rectus abdominis and obliques regions respectively. In all areas, the largest levels of disagreement were between left and none or right and none sides.
Table 5.
Distribution of agreements and disagreements for thickness in the left, right and none ratings for areas of thickness between pairs of observers from a sample size of five observers.
| Thickness Area | Left | Right | None | |
|---|---|---|---|---|
| Shoulders | Left | 107 | ||
| Right | 14 | 153 | ||
| None | 60 | 104 | 392 | |
| Pectorals/Breasts | Left | 93 | ||
| Right | 21 | 126 | ||
| None | 77 | 79 | 434 | |
| Rectus Abdominis | Left | 50 | ||
| Right | 16 | 50 | ||
| None | 104 | 92 | 518 | |
| Obliques | Left | 114 | ||
| Right | 27 | 32 | ||
| None | 97 | 89 | 471 |
3.3.2. Intraobserver Reliability
The average intraobserver Kappas for the observer who repeated all ratings for the twist and thickness groupings were 0.84 [0.69,0.99] and 0.63 [0.46,0.82], respectively.
3.4. Age Correlation
The Eta correlation coefficient between the continuous age variable and the presence or absence of twists and respectively the absence or presence of thickness was 0.347 (Figure 4). The Chi-square value comparing the frequency of patients demonstrating twist or thickness above and below the general transition from early to late adolescence at age 15, did not differ significantly (X2 = 0.755, 2 sided test p = 0.385).
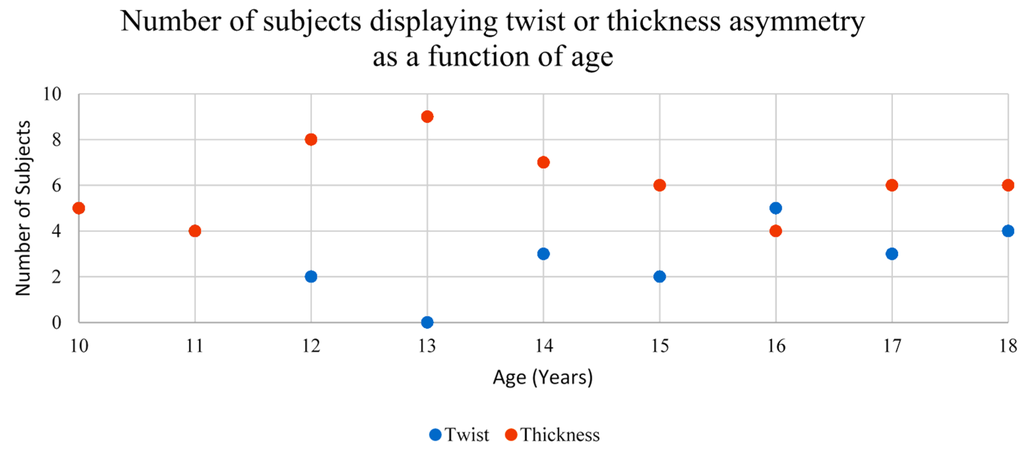
Figure 4.
Graphical representation of asymmetry relation to age. The number of subjects displaying twist at ages 10 and 11 are equal to the number displaying thickness. These points plotting twist are hidden under the ones for thickness.
3.5. Gender Correlation
The Pearson’s Chi-square test was used to determine whether a certain gender was most associated with a specific type of asymmetry. The relationship between gender and twist/thickness asymmetry was significant (p = 0.004; X2 = 8.21) (Table 6). Females had a higher prevalence towards twist asymmetry and males with thickness asymmetry.
Table 6.
Pearson’s Chi-square and p-values between gender and overall twist asymmetry, two and three alternating color patches.
| Asymmetry | Presence | Males | Females | X2 | p |
|---|---|---|---|---|---|
| Twist | No | 34 | 21 | 8.21 | 0.004 |
| Yes | 8 | 20 | |||
| Two | No | 39 | 30 | 5.73 | 0.02 |
| Yes | 3 | 11 | |||
| Three | No | 38 | 34 | 1.03 | 0.32 |
| Yes | 4 | 7 |
The relationships between gender and specific types of asymmetry were also examined but the sample size for those displaying four alternating color patches was too small to attempt calculating a Chi-square value. A significant association between gender and having two alternating color patches but not three was observed (Table 6). Once again, females had more twist asymmetry, specifically with two alternating color patches over higher numbers (p = 0.02; X2 = 5.73).
Only two areas in the thickness subgroups showed significant relationships with gender. These areas are the left pectoral/breast and the right oblique with p = 0.02 in both cases, and X2 = 5.27 and 5.19 respectively (Table 7). Males showed higher prevalence in both these areas.
Table 7.
Pearson’s Chi-square and p-values between gender and left and right sides of the shoulder, pectoral/breast, rectus abdominis and oblique areas.
| Thickness Area | Side | Presence of Asymmetry | Males | Females | X2 | p |
|---|---|---|---|---|---|---|
| Shoulders | Left | No | 33 | 35 | 0.65 | 0.42 |
| Yes | 9 | 6 | ||||
| Right | No | 31 | 30 | 0.004 | 0.95 | |
| Yes | 11 | 11 | ||||
| Pectorals/Breasts | Left | No | 31 | 38 | 5.27 | 0.02 |
| Yes | 11 | 3 | ||||
| Right | No | 36 | 32 | 0.82 | 0.36 | |
| Yes | 6 | 9 | ||||
| Rectus Abdominis | Left | No | 37 | 39 | 1.33 | 0.25 |
| Yes | 5 | 2 | ||||
| Right | No | 38 | 38 | 0.13 | 0.72 | |
| Yes | 4 | 3 | ||||
| Obliques | Left | No | 33 | 36 | 1.26 | 0.26 |
| Yes | 9 | 5 | ||||
| Right | No | 37 | 41 | 5.19 | 0.02 | |
| Yes | 5 | 0 |
3.6. Association between Physical Activity or Hand Dominance and Asymmetry Detected
Only 55 participants could be reached to provide hand dominance and physical activity information. Fisher exact tests of the associations between hand dominance or physical activity and the type of asymmetry were calculated. However, no significance was observed in any of the areas using bilateral hypothesis testing at alpha 0.05.
4. Discussion
While torso asymmetry patterns associated with scoliosis patients have been identified and documented [13], it was not clear whether these or any asymmetries were manifested in healthy subjects. We were able to determine two different patterns of asymmetry in the healthy adolescents with relatively good reliability. We also observed that gender was connected significantly to the manifestations of certain asymmetries.
Twist asymmetry viewed in DCMs has been shown to reflect lateral curvature or rotation in the spine—the characteristics of scoliosis [13]. A previous study done by Komeili et al. on scoliosis patients, divided the subgroups further into six subgroups based on the span and location of color patches [13]. For the present study however, division into additional subgroups was limited by the spectrum of the DCMs created. Standardized nominal values were not used in these DCMs to maximally compare asymmetries. As a result, the spans of asymmetry patterns are exaggerated in comparison to scoliosis patients for whom the same nominal values had been used. Since the different nominal used for each subject affected the location of the color patches, simply counting the number of color patches was done instead of formally classifying whether patches were present in the thoracic, thoracolumbar, or lumbar regions specifically.
In all subjects, there was some degree of twist asymmetry shown on the DCMs, suggesting that all persons in the normal population have some extent of rotation or lateral curvature in their torsos. Scoliosis then appears to be the magnification of these twist asymmetries. In previous studies, non-scoliosis spinal curves produced scoliometer readings ranging from magnitudes of 1° to 6° [35]. Although not analyzed in this study, in the future, it would also be useful to compare each subject’s maximal surface rotation scoliometer measurements within the “normal” range and each subject’s nominal value observed in the DCM spectrum. Approximately 75% of participants in the posterior torso showed right-sided protrusion especially in the thoracic region as well as left directional protrusion in the lumbar region. Similar to scoliosis, these general trends observed in the normal population may also describe why the majority of scoliosis curves are thoracic dextroscoliosis and lumbar levoscoliosis [36].
Using Landis and Koch’s Kappa interpretation scale [33], the strength of agreement between observers for distinguishing whether a subject displayed twist only or thickness asymmetries is almost perfect. With the same interpretation scale, the strength of agreement for the thickness and twist subgroups averaged was moderate to almost perfect. A similar result was produced for intraobserver reliability with the exception that the agreement of the thickness categories which ranged in the substantial interval. In both cases of inter- and intrareliability however, certain subgroups presented poor reliability ranges including the right oblique area, the lowest lower limit of all of the agreements. Discrepancies in the twist sub categories were mostly between adjacent groupings. The highest was between two and three alternating color patches with 35 disagreements followed by three and four alternating color patches with 21, and two and four alternating color patches with seven. The common error associated in these disagreements is due to similar groupings, where they only differed in one alternating color patch as opposed to many. The thickness asymmetry areas showed greater disagreement, especially between left and none and between right and none in all areas. There was relatively low disagreement between left and right sides. Distinction of oppositely colored patches on opposite sides of the torso is fairly easy to distinguish. Error in identifying between left and right sides may have arisen due to variance between a set of two scans for a subject or fatigue of the observer due to the considerable amount of time of 2.5 h needed for classifying the subjects.
When assessing the association between gender and asymmetry, it appeared that twist asymmetry was more prevalent in females than in males. Conversely, areas of thickness were more evident on the male torso. Similar to female prevalence in twist asymmetry for normal subjects, females are also more predominately affected by scoliosis [37,38]. This suggests that predisposition to curve progression may be related to gender. In both Komeili’s study of patients with scoliosis and in our study of healthy teens, the majority of scoliosis patients and healthy subjects are classified by having two alternating color patches. Likewise in both studies, the frequencies of subjects in each group decreased with the increasing number of alternating color patches. It is difficult to compare beyond this observation as subgroups of scoliosis patients in Komeili’s study were formally defined in specific regions of asymmetry such as the thoracic, thoracolumbar and lumbar regions. However, given that the majority of both normal subjects and scoliosis patients are classified by having two alternating color patches of twist asymmetry, it is suggestive that certain curves may be predisposed to severity progression or that particular curves may be more common.
Males had a higher prevalence of a thicker left pectoral and thicker right oblique. A further analysis showed there existed a significant relationship with males in early puberty developing a larger left breast. The results may be reflective of a condition called Gynaecomastia—the enlargement of male breast tissue. The condition is benign and very common as approximately 40%–70% of adolescent males will develop Gynaecomastia, typically with an onset of 13 to 14 years old [2,37,39]. During adolescence, the breast development is typically “minor, transient and regresses” [2]. Most common unilateral cases of Gynaecomastia also occur in the left breast consistent with the observations [39] Diagnosis is generally done through physical examination; however, ultrasounds and screening mammography may also be used if diagnosis is difficult [40]. It is unclear, however, if this condition is also present in those with scoliosis, or if the condition affects scoliosis and other spine problems at all.
Multiple papers report the lateral symmetry of abdominals (both rectus and oblique) [41,42]. However our analyses revealed that the relationship of male gender with thickness in the right oblique area was found to be significant. The inconsistency between our observations and observations in literature is most likely due to poor interobserver rating observed for the right oblique area in our study. The lowest Kappa for intrareliability was also found for the right oblique area. Therefore, the apparent relationship for the thickness of the right oblique is affected by the chance that multiple observers agreed in the right oblique region for a particular subject. Many observers reported that it was difficult to discern from the rectus abdominis and the obliques. For the few participants that had a lower BMI or appeared to have more muscle mass, line depressions were visible, dividing the rectus abdominis region from the obliques making interpretation of thickness of asymmetry easier. However, since the majority of subjects had average BMI and the appearance of average muscle mass, muscle definition lines were not present to help in the classification of subjects for the observers.
Many studies that have reported muscle asymmetry and strength, have associated these features with the increase of unilateral training [43,44,45]. Similar to this, we expected that thickness asymmetries would be attributed to the increased use of one hand over the other in everyday activities. However, in the present study, no significance was detected for the relationships between hand dominance or unilateral physical activity and the type of asymmetry pattern observed. This may be potentially due to the reduced sample size because of the limited response to the hand dominance and physical activity questionnaire. Despite this, for those whose hand dominance information was collected, the majority of participants were right hand dominant and displayed thickness in the left oblique area. For the overall sample, a clear majority also exhibited thickness in the left oblique area, as well as in the right shoulder. The right shoulder and the left oblique can be connected as a pair of contralateral muscles [44,46]. For example, the usage of the right shoulder activates the left side obliques. Consequently, when the right shoulder was hypertrophied, we would find the increased thickness in the left oblique as well. In contrast, there did not appear to be an association between either hand dominance or unilateral activity and twist asymmetries. In the present study, color patches representing twist were classified based on how many twist areas were observed but without regard to placement of the color patches. Once an acceptable nominal threshold value is proposed, the location of distinct colors could be qualified. The use of this would allow identification of whether a certain type of rotation exists with hand dominance e.g., right handed persons may show right rotation such as those commonly found in thoracic dextroscoliosis. An increased response to the questionnaire or more participants that are left handed could be used to explore more combinations other than right handed-ness and to reveal whether their impact on thickness and rotational asymmetry in twist is significant or not, respectively.
5. Conclusions
In this study, twist and thickness classification groups were developed from the observations of asymmetry patterns in healthy adolescents. All subjects displayed a twist asymmetry pattern related to the abnormal curvature and rotation normally seen with scoliosis. The majority of these twists were also observed to be right protruded roughly in the thoracic region as well as left protruded in the lumbar region. Females showed a higher prevalence of a twist pattern and conversely, males of a thickness pattern. More specifically, the higher twist pattern frequency of two alternating color patches, corresponding to same twist pattern found most frequent in scoliosis patients [13], revealed the possibility that a particular type of curve may be more common or more susceptible to severity progression. On the other hand, for thickness asymmetry in males, significance was shown in the left breast area specifically for those in early adolescence. It would be useful to then determine if the effect of thickness asymmetries when using surface topography to assess asymmetry in scoliosis patients may hinder the twist analysis. In the overall sample, most presented thickness in the left oblique area as well as in the right shoulder. Thickness in these areas may be connected to hand dominance and unilateral physical activity. On the other hand, twist asymmetries were not associated with either hand dominance or unilateral activities.
Acknowledgments
This research was supported by a small faculty’s research grant from the Faculty of Rehabilitation Medicine at University of Alberta entitled: Preliminary development of a database of 360° surface topography parameters in healthy adolescents and determination of the test-retest reliability, and the Natural Sciences and Engineering Research Council of Canada (NSERC).
Author Contributions
Eric C. Parent, Elise Watkins, Doug Hedden, Marc J. Moreau, Marwan El-Rich, Samer Adeeb conceived and designed the experiments; Eric C. Parent and Elise Watkins performed the experiments; Elise Watkins and Connie Ho analyzed the data; Samer Adeeb, Eric C. Parent contributed materials/analysis tools; Connie Ho wrote the paper. All authors provided critical revisions to the manuscript.
Conflicts of Interest
The authors declare no conflict of interest
Appendix
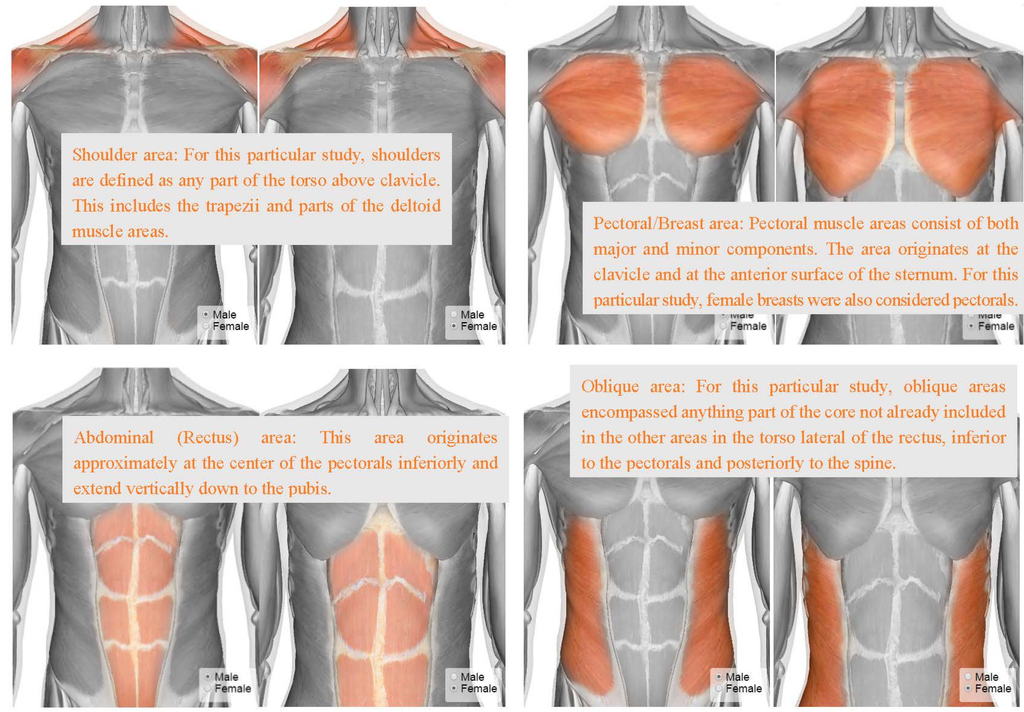
Figure A1.
Thickness subgroupings [47].
References
- World Health Organization Adolescent development. Available online: http://www.who.int/maternal_child_adolescent/topics/adolescence/dev/en/ (accessed on 27 February 2015).
- Sawyer, S.; Kennedy, A. Care of the adolescen. In Practical Paediatrics, 7th ed.; Churchill Livingstone/Elsevier: Edinburgh, UK, 2012; pp. 130–139. [Google Scholar]
- American Medical Association Parents and Teachers: Teen Growth & Development, Years 11 to 14. Available online: http://www.pamf.org/parenting-teens/health/growth-development/pre-growth.html#Physical (accessed on 27 February 2015).
- Scoliosis Research Society Common Scoliosis Questions. Available online: http://www.srs.org/patient_and_family/scoliosis/ (accessed on 27 February 2015).
- Scoliosis Research Society Idiopathic Scoliosis: Adolescents. Available online: http://www.srs.org/patient_and_family/scoliosis/idiopathic/adolescents/ (accessed on 27 February 2015).
- Wong, C. Mechanism of right thoracic adolescent idiopathic scoliosis at risk for progression; A unifying pathway of development by normal growth and imbalance. Scoliosis 2015, 10. [Google Scholar] [CrossRef] [PubMed]
- Millner, P.A.; Dickson, R.A. Idiopathic scoliosis: Biomechanics and biology. Eur. Spine J. 1996, 5, 362–373. [Google Scholar] [CrossRef] [PubMed]
- McIntosh, A.L.; Weiss, J.M. Scoliosis and Sex. Available online: http://www.aaos.org/news/aaosnow/apr12/research1.asp (accessed on 27 February 2015).
- American Cancer Society X-rays, Gamma Rays and Cancer Risk. Available online: http://www.cancer.org/cancer/cancercauses/radiationexposureandcancer/xraysgammaraysandcancerrisk/x-rays-gamma-rays-and-cancer-risk-medical-radiation (accessed on 27 February 2015).
- Levy, A.R.; Goldberg, M.S.; Mayo, N.E.; Hanley, J.A.; Poitras, B. Reducing the lifetime risk of cancer from spinal radiographs among people with adolescent idiopathic scoliosis. Spine 1996, 21, 1540–1547, Discussion 1548. [Google Scholar] [CrossRef] [PubMed]
- Oxborrow, N.J. Assessing the child with scoliosis: The role of surface topography. Arch. Dis. Child. 2000, 83, 453–455. [Google Scholar] [CrossRef] [PubMed]
- Sevastik, J.A.; Diab, K.M. Surface Topography Measurements of Back Asymmetry in Relation to Scoliosis Surgery. In Research in Spinal Deformities 1; IOS Press: Amsterdam, The Netherlands, 1997; pp. 309–312. [Google Scholar]
- Komeili, A.; Westover, L.M.; Parent, E.C.; Moreau, M.; El-Rich, M.; Adeeb, S. Surface topography asymmetry maps categorizing external deformity in scoliosis. Spine J. 2014, 14, 973–983. [Google Scholar] [CrossRef] [PubMed]
- Komeili, A.; Westover, L.; Parent, E.C.; El-Rich, M.; Adeeb, S. Monitoring for idiopathic scoliosis curve progression using surface topography asymmetry analysis of the torso in adolescents. Spine J. 2015, 15, 743–751. [Google Scholar] [CrossRef] [PubMed]
- Grabara, M. Comparison of posture among adolescent male volleyball players and non-athletes. Biol. Sport 2015, 32, 79–85. [Google Scholar] [CrossRef] [PubMed]
- Grabara, M. A comparison of the posture between young female handball players and non-training peers. J. Back Musculoskelet. Rehabil. 2014, 27, 85–92. [Google Scholar] [PubMed]
- Rho, M.; Spitznagle, T.; van Dillen, L.; Maheswari, V.; Oza, S.; Prather, H. Gender differences on ultrasound imaging of lateral abdominal muscle thickness in asymptomatic adults: A pilot study. PM R 2013, 5, 374–380. [Google Scholar] [CrossRef] [PubMed]
- Childs, J.D.; Piva, S.R.; Fritz, J.M. Responsiveness of the numeric pain rating scale in patients with low back pain. Spine 2005, 30, 1331–1334. [Google Scholar] [CrossRef] [PubMed]
- Magee, D.J. Orthopedic Physical Assessment, 4th ed.; Saunders: Philadelphia, PA, USA, 2002; p. 1020. [Google Scholar]
- The University of the State of New York. The State Education Department, Comprehensive Health and Pupil Services, School Scoliosis Screening Guidelines; The University of the State of New York: Albany, NY, USA, 1997; pp. 1–12. [Google Scholar]
- Asher, M.; Lai, S.M.; Burton, D.; Manna, B. The influence of spine and trunk deformity on preoperative idiopathic scoliosis patients’ health-related quality of life questionnaire responses. Spine 2004, 29, 861–868. [Google Scholar] [CrossRef] [PubMed]
- Glattes, R.C.; Burton, D.C.; Lai, S.M.; Frasier, E.; Asher, M.A. The reliability and concurrent validity of the Scoliosis Research Society-22r patient questionnaire compared with the Child Health Questionnaire-CF87 patient questionnaire for adolescent spinal deformity. Spine 2007, 32, 1778–1784. [Google Scholar] [CrossRef] [PubMed]
- Carreon, L.Y.; Sanders, J.O.; Polly, D.W.; Sucato, D.J.; Parent, S.; Roy-Beaudry, M.; Hopkins, J.; McClung, A.; Bratcher, K.R.; Diamond, B.E.; et al. Spinal appearance questionnaire: Factor analysis, scoring, reliability, and validity testing. Spine 2011, 36, E1240–E1244. [Google Scholar] [CrossRef] [PubMed]
- Sanders, J.O.; Harrast, J.J.; Kuklo, T.R.; Polly, D.W.; Bridwell, K.H.; Diab, M.; Dormans, J.P.; Drummond, D.S.; Emans, J.B.; Johnston, C.E., II; et al. The Spinal Appearance Questionnaire: Results of reliability, validity, and responsiveness testing in patients with idiopathic scoliosis. Spine 2007, 32, 2719–2722. [Google Scholar] [CrossRef] [PubMed]
- Clarkson, H.M. Joint Motion and Function Assessment: A Research-Based Practical Guide; Lippincott Williams & Wilkins: Philadelphia, PA, USA, 2005; p. xii, p. 366. [Google Scholar]
- Amendt, L.E.; Ause-Ellias, K.L.; Eybers, J.L.; Wadsworth, C.T.; Nielsen, D.H.; Weinstein, S.L. Validity and reliability testing of the Scoliometer. Phys. Ther. 1990, 70, 108–117. [Google Scholar] [PubMed]
- Mitchell, H.; Pritchard, S.; Hill, D. Surface alignment to unmask scoliotic deformity in surface topography. Stud. Health Technol. Inform. 2006, 123, 213–217. [Google Scholar] [PubMed]
- Emrani, M.; Kirdeikis, R.; Igwe, P.; Hill, D.; Adeeb, S. Surface reconstruction of torsos with and without scoliosis. J. Biomech. 2009, 42, 2200–2204. [Google Scholar] [CrossRef] [PubMed]
- Parent, E.C.; Zhang, P.Q.; Hill, D. Sensitivity-to-change of Full Torso Surface Topography Measurements in Adolescents with Idiopathic Scoliosis and a Main Thoracic Curve. Stud. Health Technol. Inform. 2012, 176, 484. [Google Scholar]
- Hill, S.; Franco-Sepulveda, E.; Komeili, A.; Trovato, A.; Parent, E.; Hill, D.; Lou, E.; Adeeb, S. Assessing asymmetry using reflection and rotoinversion in biomedical engineering applications. Proc. Inst. Mech. Eng. H 2014, 228, 523–529. [Google Scholar] [CrossRef] [PubMed]
- Du Prel, J.B.; Hommel, G.; Rohrig, B.; Blettner, M. Confidence interval or p-value? Part 4 of a series on evaluation of scientific publications. Dtsch. Ärzteblatt Int. 2009, 106, 335–339. [Google Scholar]
- Fleiss’ Kappa. Available online: http://www.real-statistics.com/reliability/fleiss-kappa/ (accessed on 27 February 2015).
- Landis, J.R.; Koch, G.G. The measurement of observer agreement for categorical data. Biometrics 1977, 33, 159–174. [Google Scholar] [CrossRef] [PubMed]
- Silver, C.N.; Dunlap, W.P. Averaging correlation coefficients: Should Fisher’s z transformation be used? J. Appl. Psychol. 1987, 72, 146–148. [Google Scholar] [CrossRef]
- Grivas, T.B.; Vasiliadis, E.S.; Koufopoulos, G.; Segos, D.; Triantafyllopoulos, G.; Mouzakis, V. Study of trunk asymmetry in normal children and adolescents. Scoliosis 2006, 1. [Google Scholar] [CrossRef]
- Ullrich, P.F. Scoliosis Types. Available online: http://www.spine-health.com/conditions/scoliosis/scoliosis-types (accessed on 2 March 2015).
- Konieczny, M.R.; Senyurt, H.; Krauspe, R. Epidemiology of adolescent idiopathic scoliosis. J. Child. Orthop. 2013, 7, 3–9. [Google Scholar] [CrossRef] [PubMed]
- Morais, T.; Bernier, M.; Turcotte, F. Age- and sex-specific prevalence of scoliosis and the value of school screening programs. Am. J. Public Health 1985, 75, 1377–1380. [Google Scholar] [CrossRef] [PubMed]
- Dickson, G. Gynecomastia. Am. Fam. Physician 2012, 85, 716–722. [Google Scholar] [PubMed]
- Rull, G.; Bonsall, A.; Harding, M. Gynaecomastia. Available online: http://www.patient.co.uk/doctor/gynaecomastia (accessed on 2 March 2015).
- Teyhen, D.S.; Bluemle, L.N.; Dolbeer, J.A.; Baker, S.E.; Molloy, J.M.; Whittaker, J.; Childs, J.D. Changes in lateral abdominal muscle thickness during the abdominal drawing-in maneuver in those with lumbopelvic pain. J. Orthop. Sports Phys. Ther. 2009, 39, 791–798. [Google Scholar] [CrossRef] [PubMed]
- Gill, N.W.; Mason, B.E.; Gerber, J.P. Lateral abdominal muscle symmetry in collegiate single-sided rowers. Int. J. Sports Phys. Ther. 2012, 7, 13–19. [Google Scholar] [PubMed]
- Song, Y.; Forsgren, S.; Liu, J.X.; Yu, J.G.; Stal, P. Unilateral muscle overuse causes bilateral changes in muscle fiber composition and vascular supply. PLoS ONE 2014, 9. [Google Scholar] [CrossRef] [PubMed]
- Munn, J.; Herbert, R.D.; Gandevia, S.C. Contralateral effects of unilateral resistance training: A meta-analysis. J. Appl. Physiol. 2004, 96, 1861–1866. [Google Scholar] [CrossRef] [PubMed]
- Hides, J.; Stanton, W.; Freke, M.; Wilson, S.; McMahon, S.; Richardson, C. MRI study of the size, symmetry and function of the trunk muscles among elite cricketers with and without low back pain. Br. J. Sports Med. 2008, 42, 809–813. [Google Scholar] [CrossRef] [PubMed]
- Simons, D.G.; Travell, J.G.; Simons, L.S.; Travell, J.G. Travell & Simons’ Myofascial Pain and Dysfunction: The Trigger Point Manual, 2nd ed.; Williams & Wilkins: Baltimore, MD, USA, 1999; Volume 1. [Google Scholar]
- HowToMedica Inc. Abdominal Head of Pectoralis Major Muscle. Available online: http://www.innerbody.com/image_musfov/musc10-new2.html (accessed on 2 March 2015).
© 2015 by the authors; licensee MDPI, Basel, Switzerland. This article is an open access article distributed under the terms and conditions of the Creative Commons Attribution license (http://creativecommons.org/licenses/by/4.0/).