Abstract
With the increase in the number of music files on various devices, it can be difficult to locate a desired file, especially when the title of the song or the name of the singer is not known. We propose a new query-by-singing/humming (QbSH) system that can find music files that match what the user is singing or humming. This research is novel in the following three ways: first, the Fourier descriptor (FD) method is proposed as the first classifier; it transforms the humming or music waveform into the frequency domain. Second, quantized dynamic time warping (QDTW) using symmetrical search space and quantized linear scaling (QLS) are used as the second and third classifiers, respectively, which increase the accuracy of the QbSH system compared to the conventional DTW and LS methods. Third, five classifiers, which include the three already mentioned along with the conventional DTW using symmetrical search space and LS methods, are combined using score level fusion, which further enhances performance. Experimental results with the 2009 MIR-QbSH corpus and the AFA MIDI 100 databases show that the proposed method outperforms those using a single classifier and other fusion methods.1. Introduction
With the increase in the variety of multimedia devices available, such as MPEG-1 audio layer-3 (MP3) players, smart phones, and portable media players, many people download more and more music files. Thus, audio fingerprinting systems have been developed for music files on mobile devices [1]. In addition, automatic music recommendation systems have been developed, which perform automatic genre classification, music emotion classification, and music similarity query [2].
With the increase in the number of music files, people also find it difficult to locate a particular desired music file, especially in case that the title of the song or the name of the singer is not known. Query-by-singing/humming (QbSH) methods have been introduced as a consequence, which allows the users to find music files that match singing or humming input. There have been many studies on QbSH systems [3–14]. They can be classified in terms of the used features and the matching method. Based on the former, the previous QbSH systems can be further categorized into note-based and frame-based methods [3–5]. Frame-based methods use the original pitch data as a feature [6–9]. In the note-based method, the pitch data is segmented into notes that are represented as quantized values and it can also have additional information such as interval, duration, and tempo [10–14]. Based on the matching method, QbSH systems can be categorized into those that use top-down and bottom-up methods [3,4]. The top-down method compares the global shape of the input query with that of the reference music file [6,7,10]. The bottom-up method compares the input query to the reference musical instrument digital interface (MIDI) file using a local feature [8,9,11–14].
These methods use only one classifier for matching [6–14]. In order to enhance the matching accuracy, previous QbSH systems combine a few matchers. Nam et al. proposed a two-classifier-based method using a quantized binary (QB)-code-based LS algorithm and pitch-based DTW algorithm based on score fusion using the MIN rule [3]. Nam et al. also proposed a multi-classifier based method based on pitch-based linear scaling (LS), pitch-based DTW, QB-code-based LS, local maximum and minimum-point-based LS, and pitch distribution feature-based LS [4]. However, since the matching accuracies of local maximum and minimum point-based LS and pitch distribution feature-based LS are relatively lower than those of other classifiers, there is still room for enhancement in performance.
In previous research [15] proposed a method for improving the searching speed and accuracy of a query by humming (QBH) system including feature fusion, reduction of candidates set, and rescoring of multiple similarity measurement based on piecewise aggregate approximation (PAA), earth mover’s distance (EMD), and dynamic time warping (DTW) methods. Li et al. proposed the QBH system based on the multi-stage matching of coarse matching using EMD and precise matching using DTW [16]. In a previous study [17], Stasiak et al. proposed the QBH system based on the adaptive approach in DTW method using tune following which can solve the pitch alignment problem. Itakura et al. proposed the method of speech recognition using dynamic programming (DP) algorithm based on minimum prediction residual and linear prediction coefficients (LPC) [18].
In our research, a new QbSH system that combines multiple classifiers using score level fusion is proposed. Five classifiers are used to calculate the dissimilarity between the input query and the reference songs: the Fourier descriptor (FD), pitch-based DTW using symmetrical search space, pitch-based LS, quantized DTW (QDTW) using symmetrical search space, and quantized LS (QLS). The five calculated matching scores from the five classifiers are combined using the Weighted SUM of Log rule. Table 1 shows the summarized comparisons of the proposed method to previous researches.

The rest of this paper is organized in the following manner: The proposed method is explained in Section 2. The experimental results and conclusions are presented in Sections 3 and 4, respectively.
2. Proposed Method
2.1. Overview of the Proposed Method
Figure 1 shows a flowchart of the proposed method. First, the pitch value is extracted from the input humming data by musical note estimation [3,4]. Then, the extracted pitch values are normalized [3,4]. The 0 values in the extracted data are then removed, because they do not possess any feature information. In general, the pitch range of the input humming is different from that of the musical instrument digital interface (MIDI) data. In addition, the pitch contour of the input query has considerably more noise than the MIDI data. Thus, a normalization process is performed, which includes median filtering, average filtering, and min-max scaling methods.
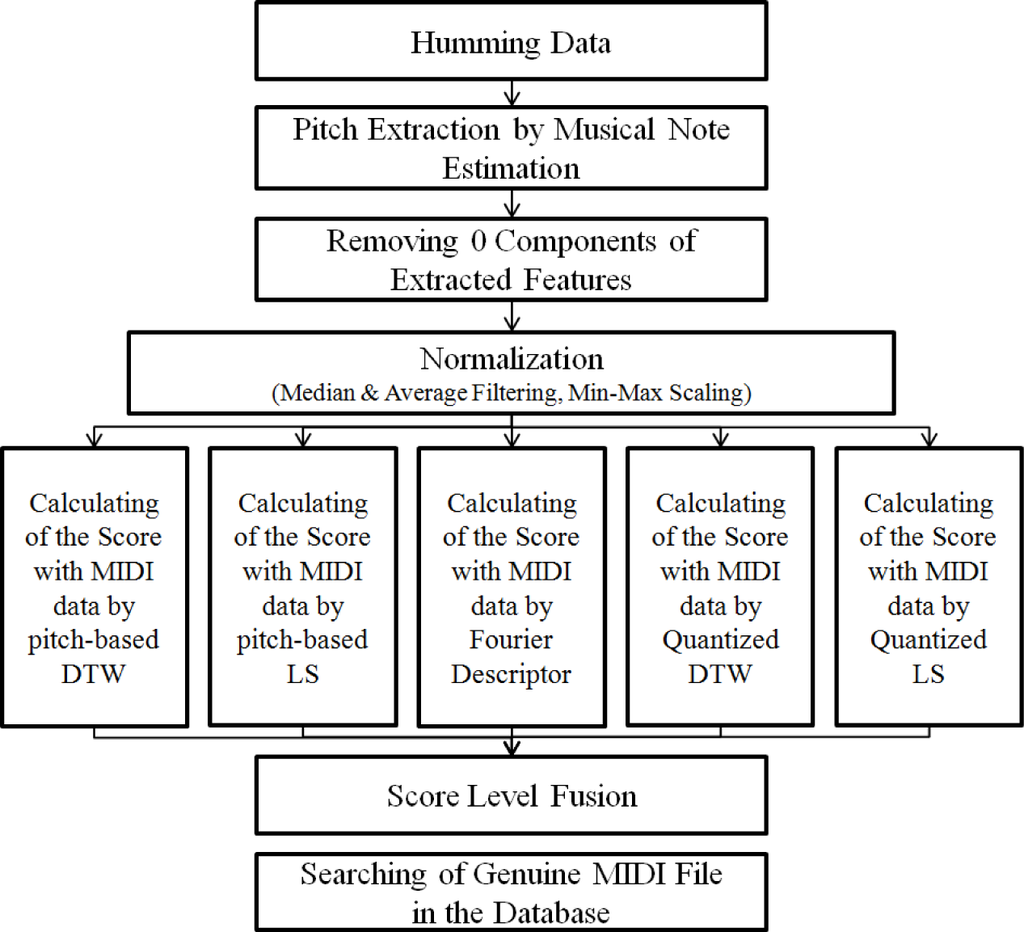
The five scores from the five classifiers are then calculated. The five classifying methods are FD, pitch-based DTW, pitch-based LS, QDTW, and QLS. The five calculated scores are combined using score level fusion in order to match the input query to a corresponding reference MIDI file. By using this combined score, the MIDI file with the minimum score is identified as a match.
2.2. Pitch Extraction and Normalization
From the input humming data, the pitch values are extracted. The pitch value is extracted every 32 ms. A voice-activity detection algorithm (VAD) is used to reduce the pitch extraction error by extracting the pitch data in the voiced frames [3,4,19]. Then, the pitch values are extracted using the spectral-temporal autocorrelation (STA) method, which utilizes both spectral autocorrelation (SA) and temporal autocorrelation (TA) simultaneously [3,4,20]. Figure 2a,b shows the pitch value extracted from the input humming and reference music data, respectively, according to time.
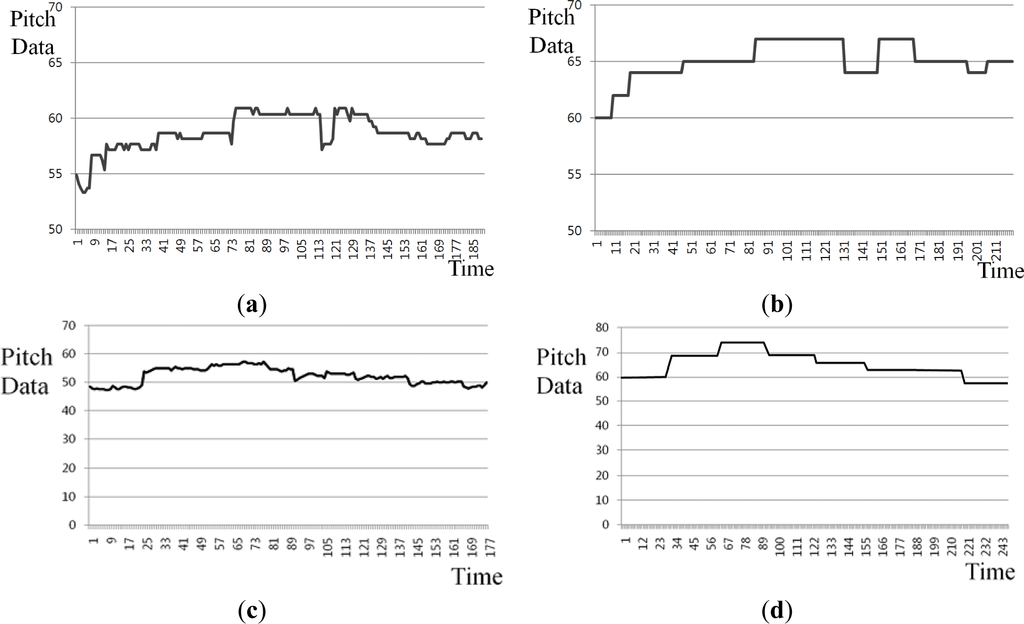

As shown in Figure 2, the range of pitch value of input humming data are usually different from those of reference music data, which is caused by the individual variations, gender, and ages. In addition, noises can occur during the user’s singing or humming, because of surrounding and line noise through microphone. All of these factors degrade the matching accuracy between the input humming and the reference music data, which requires the normalization method. Therefore, the proposed method normalizes the pitch values of both the input humming and MIDI data. The normalization methods include median filtering, average filtering, and min-max scaling [3,4].
Firstly, the input query data includes considerable noises such as impulse noises. These are caused by the input line and the surrounding noise during recording, and also by the user’s movements. Since these noises can be factors that degrade the matching accuracy, additional normalization processes, including median filtering and average filtering, are performed. Median filtering eliminates the peak noise in accordance with the order-statistics method [21]. It selects the filtered value as the median value for the entire mask. The peak noise in the data is eliminated by median filtering. Average filtering replaces the filtered value with the average for the entire mask. The input query data includes considerable vibration and shaking, whereas the MIDI data does not. In order to compensate for this difference, average filtering is used, which smoothes out the noise data. Finally, min-max scaling is used to ensure that the pitch ranges in both the input query and MIDI data are the same. Through the normalization process, the problems caused by input query noise are overcome, and the differences in the ranges between the input query and MIDI data are thereby compensated. That is, as shown in Figure 2, the min, max, and range of input query are different from those of reference MIDI although they are same song. Therefore, in our research, we perform the min-max scaling in the range of −5 to 5, and we can reduce these differences between input query and reference MIDI as shown in Figure 3.
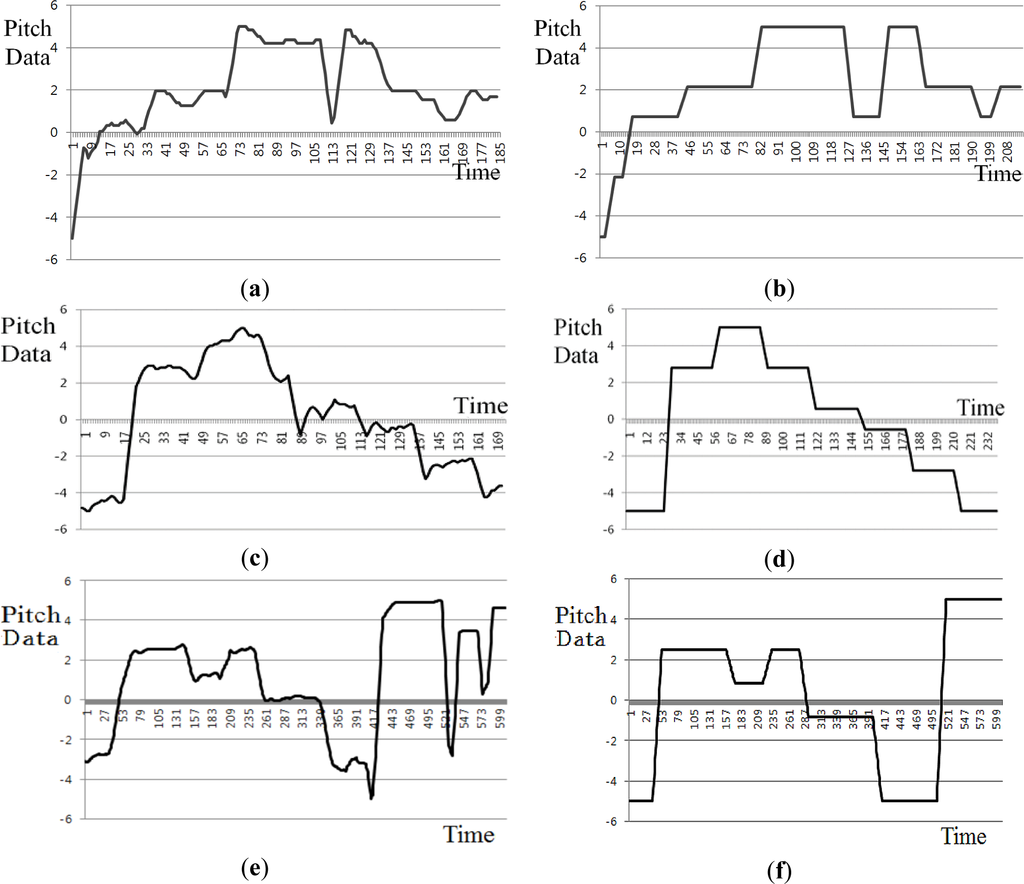
For example, with Figure 2c,d, the min, max, and range of input query are about 48, 58, and 10, respectively, which are different from those of reference MIDI (about 58, 75, and 17, respectively) although they are same song. However, the min, max, and range of the input query and reference MIDI are adjusted to be same as −5, 5, and 10, respectively, as shown in Figure 3c,d, which can enhance the similarity between the input query and reference MIDI. As the other example with Figure 2e,f, the min, max, and range of input query are about 40, 60, and 20, respectively, which are different from those of reference MIDI (about 56, 68, and 12, respectively) although they are same song. However, the min, max, and range of the input query and reference MIDI are adjusted to be same as −5, 5, and 10, respectively, as shown in Figure 3e,f, which can enhance the similarity between the input query and reference MIDI. To prove this, we compared the accuracies without min-max scaling to those with min-max scaling (See details in Section 3).
2.3. Matching Algorithms
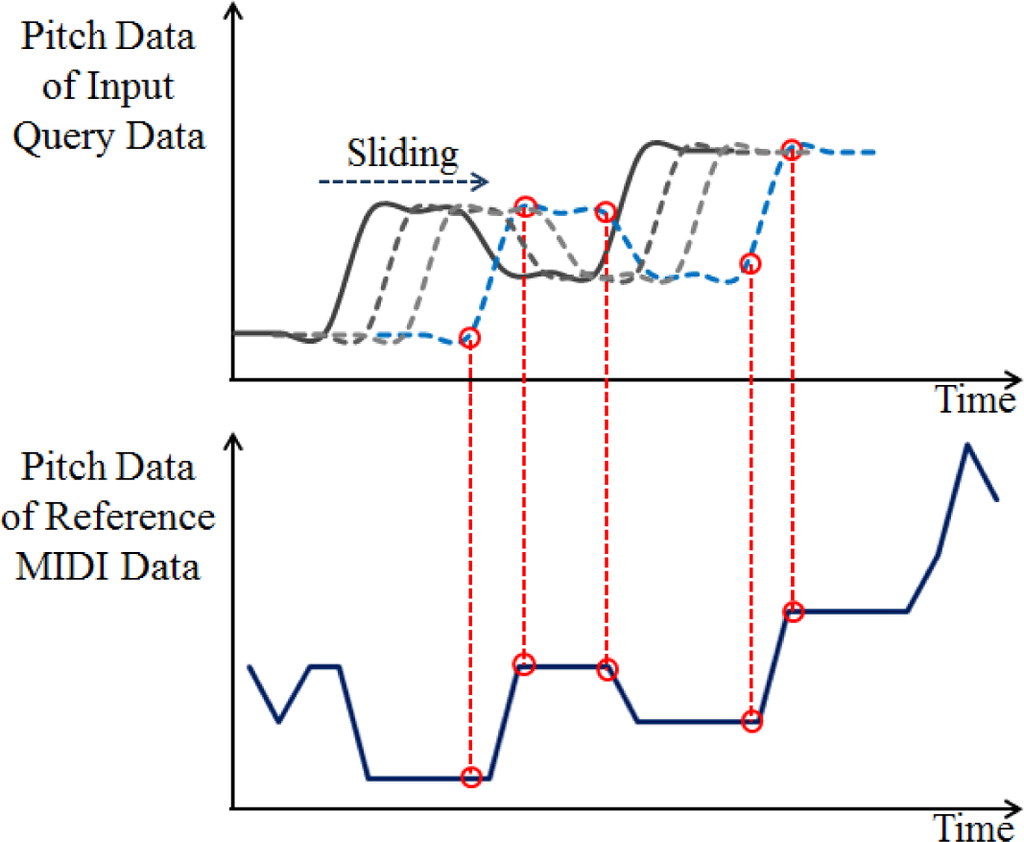
The starting position of input query is not usually same to that of the reference MIDI data, making the user’s singing or humming unmatchable. Therefore, the pitch data of the input humming are matched with the MIDI data by moving the start position, as shown in Figure 4. Generally, the user sings or hums the opening lines of some phrases in the reference music. Thus, the proposed system estimates all start positions for phrases in the reference data before the matching procedure, and tries to match the estimated start positions of phrases by moving the input query data. The start positions of phrases are estimated based on the change position from zero to non-zero pitch in the MIDI data. However, the end positions are difficult to be estimated, and the proposed method performs the matching between the input query and the part of reference MIDI data based on only the start position (without the knowledge of end position) by shrinking or stretching the length of the input query. This procedure of matching is iterated at each start position of the MIDI data. Then, the end position in the MIDI data can be estimated as the position with which the smallest dissimilarity is measured by matching between the input query and MIDI data. The proposed method uses the following five algorithms for matching.
2.3.1. Fourier Descriptor
Fourier transform is used to analyze the global and local feature patterns in the frequency domain. Through the transform from the spatial or time domain to the frequency domain, complex coefficients called the Fourier descriptor (FD) are obtained [21]. The FD represents the shape of the data in the frequency domain [22].
In order to apply this method in the QbSH system, the proposed method considers the pitch contour as the shape of the data, and performs the Fourier transform on the pitch contour. The transformed data includes the amplitudes of low-frequency and high-frequency components, which represent the global shape and detailed (local) shape of the pitch contour, respectively. In general, the amplitude by the Fourier transform is affected by the magnitude of the original signal. To overcome this problem, the amplitude values obtained from the Fourier transform are normalized by the direct current (DC) component obtained from the Fourier transform as shown in Equation (1).
The number of coefficients included in the descriptor FD is 246 by excluding the 10 higher-frequency coefficients among the total 256 coefficients (including 1 DC coefficient). The optimal number of higher-frequency coefficients to be excluded was experimentally determined, by which the highest MRR was obtained. Detail explanations about the MRR are shown in Section 3. All the coefficients included in the descriptor FD are treated equally (by a plain Euclidean distance). Through the min-max scaling of the normalization stage, the mean value is not zero and the consequent DC value of descriptor FD is also non-zero. The normalization by DC value in Equation (1) is used to obtain shift invariance. In order to prevent the case of the division by zero in Equation (1), we use a non-zero offset value in the denominator of Equation (1) only if the calculated DC value is zero.
In order to measure the dissimilarity, the normalized amplitudes of the FD of the input query are compared to those of the reference MIDI on the basis of the Euclidean distance (ED).
2.3.2. Dynamic Time Warping Algorithm
Generally, the entire length of the input humming is different from the reference MIDI. In addition, the length of the part of the humming can be shorter or longer than that found in the reference MIDI, because a user may hum some part quickly and some parts slowly. In order to overcome this problem, DTW is widely used [3–5,9]. The main concept behind the DTW algorithm is to search for the corresponding path between the input humming and the reference MIDI through insertion and deletion.
There is the following constraint required when using the DTW algorithm [3,4]. The constraint concerns the search space, as shown in Figure 5, and can reduce the processing time. Although the lengths of the input query and reference MIDI are different, the difference in length is not too great, generally. Therefore, the distance does not need to be calculated in all positions in the search space. In Figure 5, the horizontal and vertical axes represent the reference MIDI and input query data, respectively. Line (A1A3) is the optimal path denoting that the input query and reference MIDI are perfectly matched without any difference in length. In the DTW algorithm, which matches two patterns through insertion and deletion, the search space of the DTW algorithm can be the entire area (A1A2A3A4).
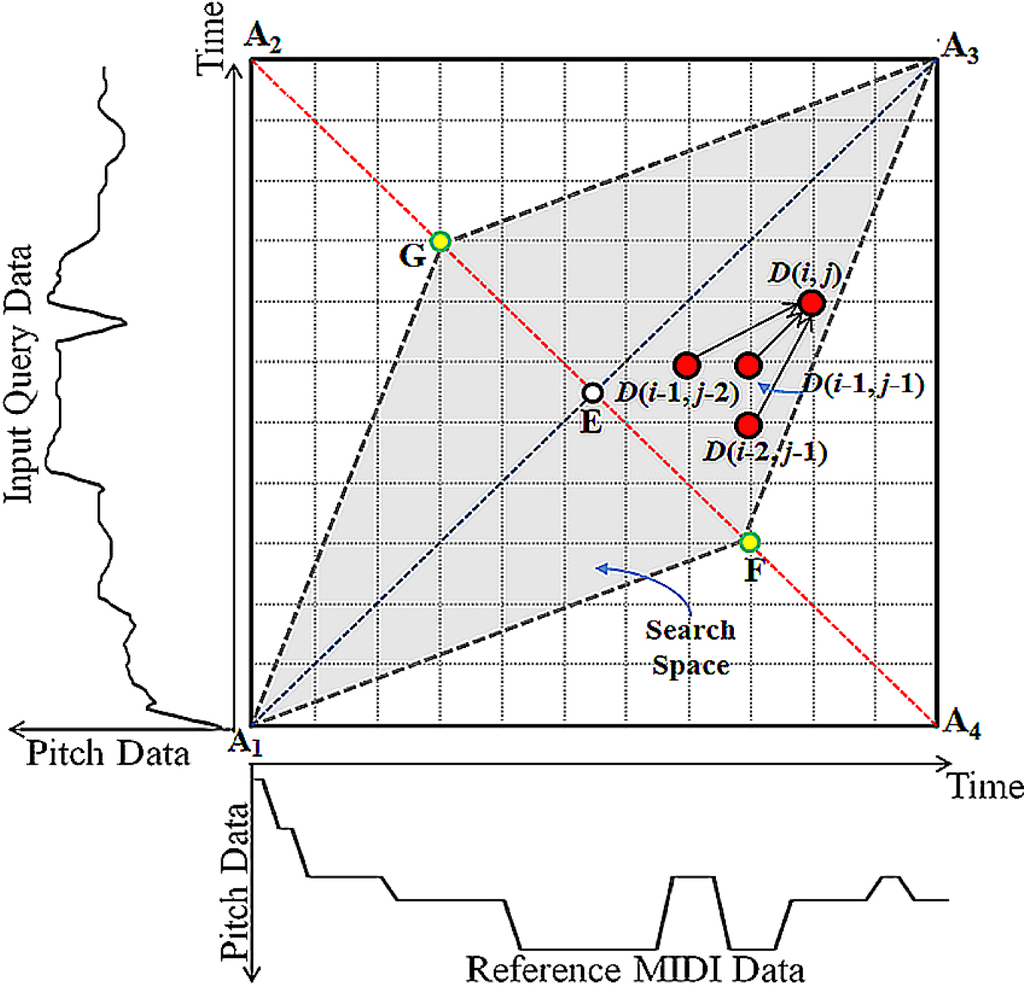
The processing time can be reduced by reducing the search space to the parallelogram (A1GA3F) which is symmetrical based on line (A1A3) [18]. In the parallelogram (A1GA3F), the difference between the input query and the reference MIDI is not too great, as mentioned in [3,4]. Experimental results showed that the matching accuracy of the DTW algorithm for different search space sizes was best when the parallelogram (A1GA3F) is symmetrical based on line (A1A3) and the length ratio of line (GE) to line (A2E) was 0.5.
In this system, the distance between the input query and the reference MIDI at each position is calculated by the absolute difference as shown in Equation (2).
2.3.3. Linear Scaling
The LS algorithm is one of the most simple and effective matching algorithms that has been used in QbSH systems. The main concept behind the LS algorithm is that it compares the input query with the reference MIDI by shrinking and stretching the length of the input query data linearly [3,4]. Figure 6 shows an example of the operation of the LS algorithm.
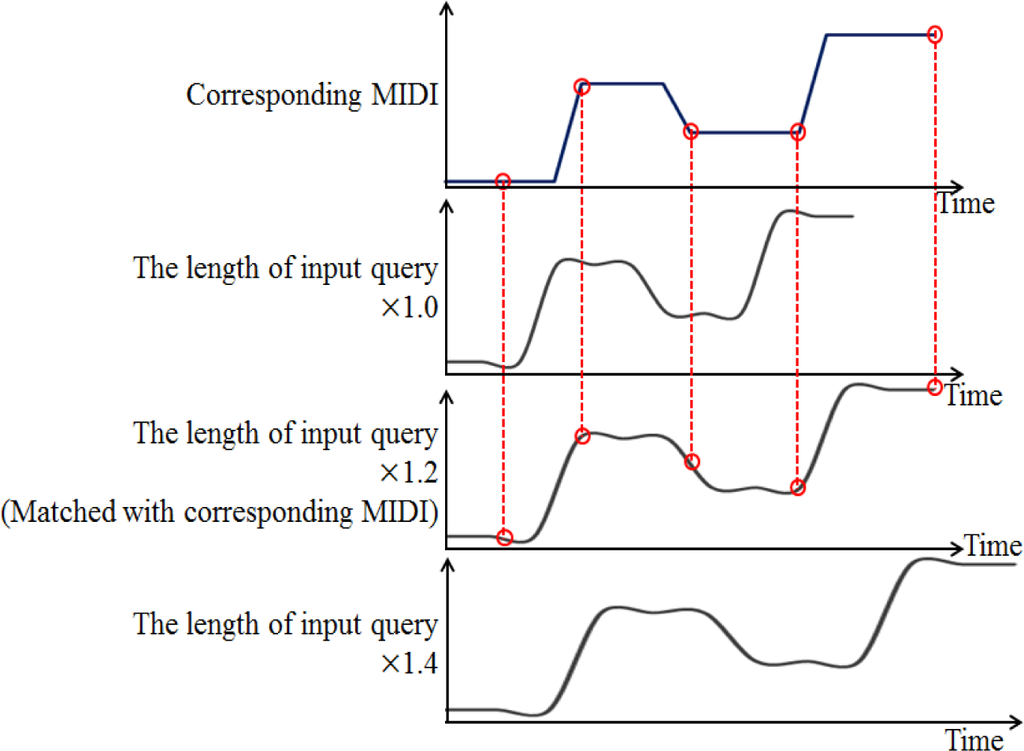
The proposed method stretches the length of the input query from 1 to 2 times in increments of 0.01 times for matching. The optimal parameters were determined in terms of the matching accuracy. The dissimilarity between the input query and reference MIDI data is measured on the basis of the ED.
2.3.4. Quantized DTW and Quantized LS
QDTW and QLS are modifications of the DTW and LS methods. The original DTW and LS methods use a real number for the original pitch value. Actually, a small amount of variation remains in the pitch contour (represented as real number) of the input query even after normalization, which can cause false matching. In order to overcome this problem, we use the QDTW and QLS methods.
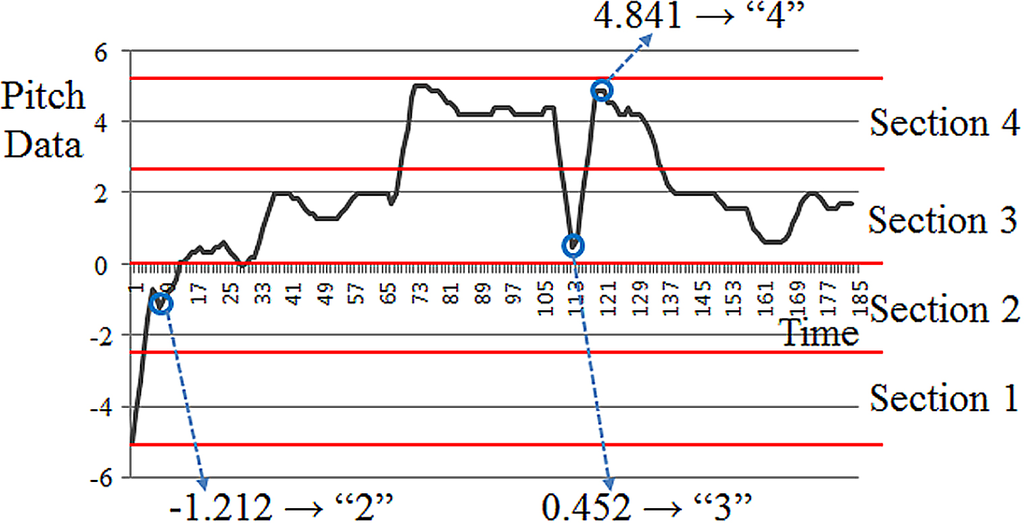
These methods convert the pitch data into quantized integer code, as shown in Figure 7. In order to obtain the quantized code, it uniformly divides the range into a number of sections [3,4]. In Figure 7, the range is divided into four sections, each represented by an integer: “1”, “2”, “3”, and “4” in Figure 7. In this manner, the pitch data values −1.212, 0.452, and 4.841 are represented as “2”, “3”, and “4”, respectively. The optimal number of sections was experimentally determined as 24 in terms of matching accuracy. By representing the pitch value into the quantized value of 1–24, the problem of false matching caused by the small amount of variation in the original pitch contour of the input query represented as real number can be solved.
After obtaining the quantized code by QDTW, the dissimilarities between the input query and the reference MIDI are calculated by using the absolute difference in Equation (2) using symmetrical search space of Figure 5. In case of QLS, the ED is used for measuring the dissimilarities. In previous researches, a QB-code-based LS algorithm is used, where the quantized value is represented as a binary number instead of an integer.
2.4. Fusion of Five Matching Scores
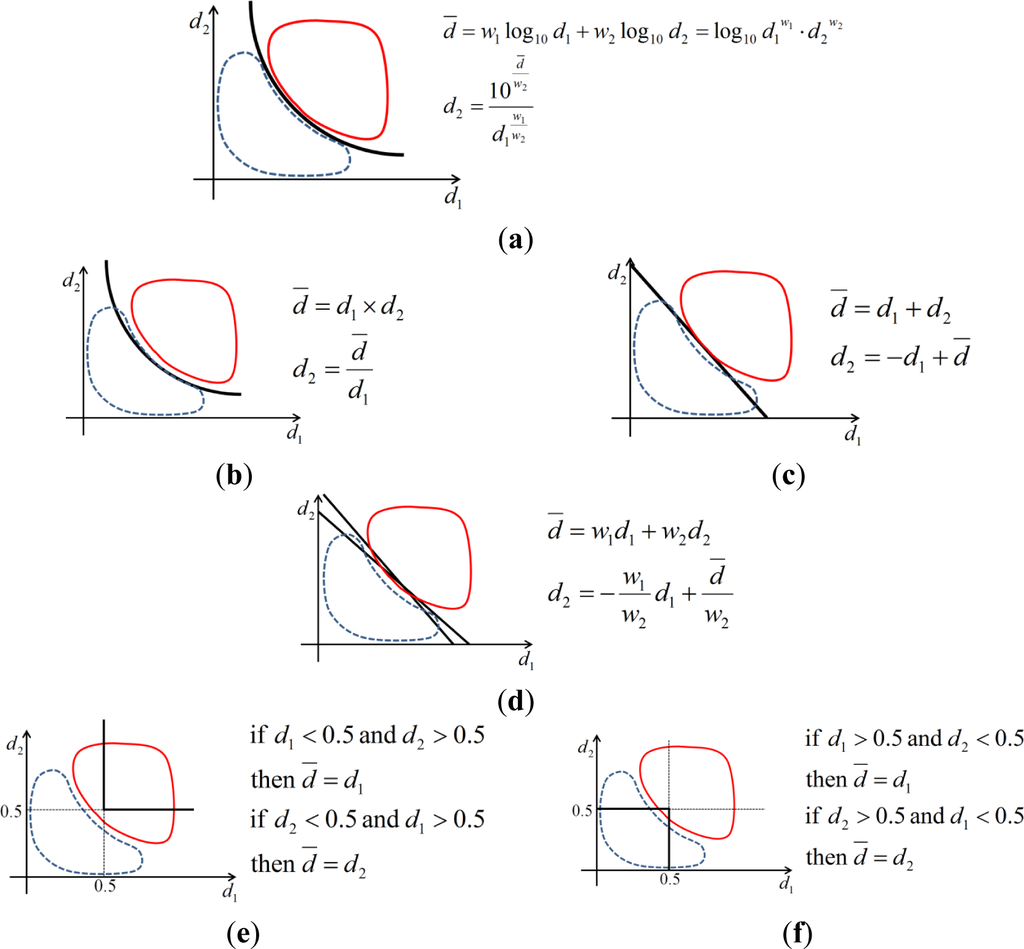
In general, score level fusion enhances performance by combining the scores of each classifier. There are various methods used for score level fusion, such as MIN, MAX, SUM, Weighted SUM, and PRODUCT rules [23]. The MIN rule determines the minimum one of all the scores as a final matching score. For example, supposing that five scores by each classifier are 0.3, 0.5, 0.2, 0.4, and 0.7, respectively, 0.2 is determined as final matching score by the MIN rule. Otherwise, the MAX rule chooses the maximum one of 0.7 as the final matching score. The SUM and PRODUCT rules select the summation and product values of all scores, respectively. Therefore, 2.1 (=0.3 + 0.5 + 0.2 + 0.4 + 0.7) and 0.0084 (=0.3 × 0.5 × 0.2 × 0.4 × 0.7) are selected as the final matching score, respectively. The Weighted SUM rule is a modified type of SUM rule. It gives the weights to each score when calculating the summation of the scores. If the weights are 1, 2, 3, 4, and 5, the final score is 7 [=(1 × 0.3) + (2 × 0.5) + (3 × 0.2) + (4 × 0.4) + (5 × 0.7)]. In addition, the accuracy by Weighted SUM of Log rule is also compared in our research. The Weighted SUM of Log rule is a modified type of PRODUCT rule as shown in Figure 8a,b. It gives the weights to each score when calculating the summation of the log scores. If the weights are 1, 1, 3, 2, and 1, the final score is log10(1.344 × 10⁻⁴) [=(1 × log100.3) + (1 × log100.5) + (3 × log100.2) + (2 × log100.4) + (1 × log100.7)].
Through experiments, the Weighted SUM of Log rule was selected in this research as it afforded the highest matching accuracy as shown in Tables 2–12.


We show the theoretical reason why the Weighted SUM of Log rule produces the higher accuracy compared to other fusion methods. As shown in Figure 8, we show the classifier based on Weighted SUM of Log, PRODUCT, SUM, Weighted SUM, MIN, and MAX rules. For simplicity, we explain them with the fusion method using two scores, which means that two classifiers are used. In Figure 8, the horizontal and vertical axes represent the two matching scores (distances) of d1 and d2, respectively. With an input humming file, we can obtain two matching scores of d1 and d2 per each reference file. If the input humming data corresponds to the reference file (humming and reference file are same songs), the matching distances of d1 and d2 are inevitably small because the characteristics of the input humming are similar to those of the reference file. If the input humming data does not correspond to the reference file (these two data are different songs), the matching distances of d1 and d2 are inevitably large. Therefore, the distribution of matching samples of the former case (humming and reference file are same songs) is positioned closed to the origin of the graph (region shaped by blue dotted line of the Figure 8). However, the distribution of matching samples of the latter case (humming and reference file are different songs) is distributed in the right-upper area (region shaped by red solid line of the Figure 8). Here, the region shaped by blue dotted line is named as the distribution of genuine matching cases (DGMC), and that shaped by red solid line is called as the distribution of imposter matching cases (DIMC).
The classifier lines based on Weighted SUM of Log rule, PRODUCT, SUM, Weighted SUM, MIN, and MAX rules are shown in black solid lines in Figure 8, respectively. Although the matching case actually belongs to the DGMC, and it is incorrectly determined as the DIMC, we call it as false rejection error (FRR) case. In contrast, although the matching case is actually the DIMC, and it is incorrectly determined as the DGMC, we call it as false acceptance error (FAR) case [23].
As shown in Figure 8, the classifier lines based on the SUM, Weighted SUM, MIN, and MAX rules are linear, which have the limitations of completely separating the DGMC from the DIMC, and the consequent FAR and FRR cases occur. However, the classifier lines based on the Weighted SUM of Log and PRODUCT rules are non-linear, which has the superior ability of separating the DGMC from the DIMC, and the consequent FAR and FRR cases are reduced.
As shown in Figure 8a,b, because the classifier line based on the Weighted SUM of Log rule can have more various shape (due to the weights of w1 and w2) than that by the PRODUCT rule, the consequent FAR and FRR by the Weighted SUM of Log rule become smaller than those by the PRODUCT rule. In the actual case of calculation for the Weighted SUM of Log rule, we added the same offset value to d1 and d2 of Figure 8a in order to prevent the d1 and d2 from becoming 0 because log 0 cannot be calculated. Same analyses can be applied in case of using five matching scores (distances) by the five classifiers. Therefore, the accuracy of score-fusion based on Weighted SUM of Log rule is higher than those of other methods as shown in Tables 2–12.
3. Experimental Results
Two databases were used for the experiment. The 2009 MIR-QbSH corpus was used as the first database [24]. It consists of 48 MIDI files that represent original melodies and 4431 singing and humming queries stored as wav files. The singing and humming queries were recorded by 118 persons in various environments on telephones, microphones, etc. The recording time of each query is 8 s and the period for pitch extraction is 32 ms. Therefore, the number of pitch values is 250 [(8000 ms)/(32 ms)] per query. Notably, the 2009 MIR-QbSH corpus also provides pitch vector (PV) files that include manually extracted pitch data.
The second database was the audio feature analysis (AFA) MIDI 100. It consists of 100 MIDI files and 1000 singing and humming queries recorded via microphone. It includes 84 Korean songs, 6 children’s songs, and 10 pop songs. The recording time is 12 s; there are 375 [(12000 ms)/(32 ms)] pitch values in each query because the pitch value is also extracted every 32 ms. The anchor position (the position hummed or sung by user) is at the beginning in case of the 2009 MIR-QbSH corpus dataset. However, in AFA MIDI 100 database, each participant sung or hummed at the arbitrary positions in MIDI files which he wants. Therefore, the matching by moving the start position of the input query of Figure 4 is performed (based on the estimated change position from zero to non-zero pitch in the MIDI data) in case of the AFA MIDI 100 database. With each query and the part of reference to be compared, the normalization of Section 2.2 including min-max scaling are performed.
To measure the performance, we measured the matching accuracy for each algorithm. The mean reciprocal rank (MRR), shown in Equation (4), was used to represent the matching accuracy, as it has been widely used in MIREX contests [3,4,25].
For the first experiment, we used the PV files of the 2009 MIR-QbSH corpus in order to exclude the pitch extraction error (by extracting pitch values manually). The results of the first experiment show that the accuracy of proposed method is better than the other single classifier methods and the other score level fusion methods, as shown in Table 2. In addition, in order to measure the effect of the pitch extraction method on the matching accuracy, we include the Gaussian random noise (sigma value (σ) is 0.5) into the extracted pitch values of the PV files. The accuracies are shown in Table 3, and the proposed method shows the best performance. In addition, in order to measure the accuracy with more noise MIDI files, we add 100 MIDI files of the AFA MIDI 100 database to the 48 MIDI files of the 2009 MIR-QbSH corpus database. Therefore, the number of reference MIDI files is 148. In order to measure the robustness to the noise, we include the Gaussian random noise (sigma value (σ) is 0.5) in the 100 MIDI files of the AFA MIDI 100 database. The accuracies are shown in Table 4, and the proposed method shows the best performance, also. Comparing the Tables 2–4, we can confirm that the reduction of the accuracy of the proposed method by the noise of the pitch values or the additional noisy MIDI files is very small.
For the next experiment, we measured the matching accuracy of the proposed method with 2009 MIR-QbSH corpus database which includes 2048 MIDI data. The 2048 MIDI data consist of original 48 MIDI data of 2009 MIR-QbSH corpus database, and additional 2000 noise data of AFA MIDI 100 database by adding Gaussian random noises with 20 different sigma values into each MIDI file (20 sigma values × 100 MIDI files). As a result, the matching accuracy by our method with these 2048 MIDI data is similar to those with the smaller data of Tables 2–4 and 6–12, and we can confirm that the proposed method has better matching accuracy than others with these large data, as shown in Table 5.
Next, we used the pitch files extracted from the 2009 MIR-QbSH corpus by the method described in Section 2.2. The results show that the proposed method was the best, as shown in Table 6. In addition, in order to measure the effect of the pitch extraction method on the matching accuracy, we include the Gaussian random noise (sigma value (σ) is 0.5) into the extracted pitch values of the pitch files. The accuracies are shown in Table 7, and the proposed method shows the best performance. In addition, in order to measure the accuracy with more noise MIDI files, we add 100 MIDI files of the AFA MIDI 100 database to the 48 MIDI files of the 2009 MIR-QbSH corpus database. Therefore, the number of reference MIDI files is 148. In order to measure the robustness to the noise, we include the Gaussian random noise (sigma value (σ) is 0.5) in the 100 MIDI files of the AFA MIDI 100 database. The accuracies are shown in Table 8, and the proposed method shows the best performance, also. Comparing the Tables 6–8, we can confirm that the reduction of the accuracy of the proposed method by the noise of the pitch values or the additional noisy MIDI files is very small.
In the third experiment, we measured the matching accuracy for the AFA MIDI 100 database. The proposed method showed the best matching accuracy, as shown in Table 9. In addition, in order to measure the effect of the pitch extraction method on the matching accuracy, we include the Gaussian random noise (sigma value (σ) is 0.5) into the extracted pitch values of the pitch files. The accuracies are shown in Table 10, and the proposed method shows the best performance. In addition, in order to measure the accuracy with more noise MIDI files, we add 48 MIDI files of the 2009 MIR-QbSH corpus database to the 100 MIDI files of the AFA MIDI 100 database. Therefore, the number of reference MIDI files is 148. In order to measure the robustness to the noise, we include the Gaussian random noise (sigma value (σ) is 0.5) in the 48 MIDI files of the 2009 MIR-QbSH corpus database. The accuracies are shown in Table 11, and the proposed method shows the best performance, also. Comparing the Tables 9, 10, and 11, we can confirm that the reduction of the accuracy of the proposed method by the noise of the pitch values or the additional noisy MIDI files is very small.
Table 12 compares the accuracies of the previous methods with the proposed method. Since the previous methods did not measure the performance with the AFA MIDI 100 database [3,4], we just compared the accuracies with the PV and pitch files of the 2009 MIR-QbSH corpus. The proposed method showed better matching accuracy than previous methods, as shown in Table 12.
As the next experiment, we performed the comprehensive comparisons with other multi-level/multi-classifier approaches. The method of [17] is single-classifier based one, and the system of [18] is for speech recognition instead of QBH. In addition, the algorithm of [15] including PAA is not open. Therefore, we compared the performance of method [16] to that of our method. In addition, we compared the performance of other method [26] to that of our method. In [26], they proposed the QBH system based on the multi-stage matching like [16], but they used linear scaling (LS) and quantized DTW as the coarse matching and precise matching, respectively. As shown in Tables 13 and 14, we can confirm that our method outperforms previous methods [16,26].


As shown in Tables 2–11, and 13, 14, we can confirm that the accuracies with min-max scaling are higher than those without min-max scaling, and the min-max scaling is necessary for our normalization stage of Section 2.2.
4. Conclusions
In this research, a new QbSH system is proposed that combines multiple classifiers using score level fusion. In experiments, the matching accuracy of the proposed method was better than that of previous methods using a single classifier and other fusion methods.
In future work, learning-based matching algorithms such as hidden Markov models (HMM) and support vector machines (SVMs) will be researched in order to enhance the performance of the QbSH system for increased input and reference data. In general, it would be better to support audio signals such as MP3 files compared to MIDI data, because there are a tremendous number of music audio signals in the world. However, most of the audio signals such as MP3 files are composed of polyphonic melodies, and it is very difficult to accurately extract the main melody among them. In addition, the noises in the MP3 files are much larger than those in the MIDI files. Therefore, further researches are required to support the audio signals in future work.
Acknowledgments
This research was supported by Basic Science Research Program through the National Research Foundation of Korea (NRF) funded by the Ministry of Education (NRF-2012R1A1A2038666).
Author Contributions
Gi Pyo Nam designed the overall QbSH system. Kang Ryoung Park implemented various score fusion methods and helped the experiments. In addition, they wrote and revised the paper.
Conflict of Interests
The authors declare no conflict of interest.
References
- Son, W.; Cho, H.T.; Yoon, K.; Lee, S.P. Sub-fingerprint masking for a robust audio fingerprinting system in a real-noise environment for portable consumer devices. IEEE Trans. Consum. Electron. 2010, 56, 156–160. [Google Scholar]
- Zhu, X.; Shi, Y.-Y.; Kim, H.-G.; Eom, K.-W. An integrated music recommendation system. IEEE Trans. Consum. Electron. 2006, 52, 917–925. [Google Scholar]
- Nam, G.; Park, K.; Park, S.J.; Lee, S.P.; Kim, M.Y. A new query-by-humming system based on the score level fusion of two classifiers. Int. J. Commun. Syst. 2012, 25, 717–733. [Google Scholar]
- Nam, G.; Luong, T.T.T.; Nam, H.H.; Park, K.; Park, S.J. Intelligent query by humming system based on score level fusion of multiple classifiers. EURASIP J. Adv. Signal Process. 2011, 21, 1–11. [Google Scholar]
- Kim, K.; Park, K.; Park, S.J.; Lee, S.P.; Kim, M.Y. Robust query-by-singing/humming system against background noise environments. IEEE Trans. Consum. Electron. 2011, 57, 720–725. [Google Scholar]
- Wu, X.; Li, M.; Liu, J.; Yang, J.; Yan, Y. A top-down approach to melody match in pitch contour for query by humming. Proceedings of the International Symposium of Chinese Spoken Language Processing, Singapore, Singapore, 13–16 December 2006; pp. 669–680.
- Ryynanen, M.; Klapuri, A. Query by humming of MIDI and audio using locality sensitive hashing. Proceedings of the IEEE International Conference on Acoustics, Speech and Signal Processing, Las Vegas, NV, USA, 31 March–4 April 2008; pp. 2249–2252.
- Ghias, A.; Logan, J.; Chamberlin, D.; Smith, B.C. Query by humming: Musical information retrieval in an audio database. Proceedings of the ACM International Conference on Multimedia, San Francisco, CA, USA, 5–9 November 1995; pp. 231–236.
- Jang, J.-S.R.; Gao, M.-Y. A query-by-singing system based on dynamic programming. Proceedings of the International Workshop on Intelligent Systems Resolutions, Hsinchu, Taiwan, 11–12 December 2000; pp. 85–89.
- Typke, R.; Giannopoulos, P.; Veltkamp, R.C.; Wiering, F.; Oostrum, R.V. Using transportation distances for measuring melodic similarity. Proceedings of the International Conference on Music Information Retrieval, Baltimore, MD, USA, 27–30 October 2003; pp. 107–114.
- McNab, R.J.; Smith, L.A.; Witten, I.H.; Henderson, C.L.; Cunningham, S.J. Toward the digital music library: Tune retrieval from acoustic input. Proceedings of the ACM International Conference on Digital Libraries, Bethesda, MD, USA, 20–23 March 1996; pp. 11–18.
- McNab, R.J.; Smith, L.A.; Bainbridge, D.; Witten, I.H. The New Zealand digital library melody index. D-Lib Mag. 1997, 3, 4–15. [Google Scholar]
- Blackburn, S.; DeRoure, D. A tool for content based navigation of music. Proceedings of the ACM International Conference on Multimedia, Bristol, UK, 13–16 September 1998; pp. 361–368.
- Kornstadt, A. Themefinder: A web-based melodic search tool. Comput. Musicol. 1998, 11, 231–236. [Google Scholar]
- Wang, L.; Huang, S.; Hu, S.; Liang, J.; Xu, B. Improving searching speed and accuracy of query by humming system based on three methods: Feature fusion, candidates set reduction and multiple similarity measurement rescoring. Proceedings of the 9th Annual Conference of the International Speech Communication Association, Brisbane, Australia, 22–26 September 2008; pp. 2024–2027.
- Li, J.; Han, J.; Shi, Z.; Li, J. An efficient approach to humming transcription for query-by-humming system. Proceedings of the 3rd International Congress on Image and Signal Processing, Yantai, Shandong, China, 16–18 October 2010; pp. 3746–3749.
- Stasiak, B. Follow that tune—Adaptive approach to DTW-based query-by-humming system. Arch. Acoust. 2014, 39, 467–476. [Google Scholar]
- Itakura, F. Minimum prediction residual principle applied to speech recognition. IEEE Trans. Acoust. Speech Signal Process. 1975, 23, 67–72. [Google Scholar]
- Cohen, I. Noise spectrum estimation in adverse environments: Improved minima controlled recursive averaging. IEEE Trans. Speech Audio Process. 2003, 11, 466–475. [Google Scholar]
- Cho, Y.D.; Kim, M.Y.; Kim, S.R. A spectrally mixed excitation (SMX) vocoder with robust parameter determination. Proceedings of the IEEE International Conference on Acoustics, Speech and Signal Processing, Seattle, WA, USA, 15 May 1998; pp. 601–604.
- Gonzalez, R.C.; Woods, R.E. Digital Image Processing; Prentice Hall: Upper Saddle River, NJ, USA, 2002. [Google Scholar]
- Kang, B.J.; Park, K.R. Multimodal biometric method based on vein and geometry of a single finger. IET Comput. Vis. 2010, 4, 209–217. [Google Scholar]
- Ross, A.; Jain, A. Information fusion in biometrics. Pattern Recognit. Lett. 2003, 24, 2115–2125. [Google Scholar]
- Wang, C.-C.; Jang, J.-S.R.; Wang, W. An improved query by singing/humming system using melody and lyrics information. Proceedings of the International Society for Music Information Retrieval Conference, Utrecht, The Netherlands, 9–13 August 2010; pp. 45–50.
- Salamon, J.; Rohrmeier, M. A quantitative evaluation of a two stage retrieval approach for a melodic query by example system. Proceedings of the International Society for Music Information Retrieval Conference, Kobe, Japan, 26–30 October 2009; pp. 255–260.
- Nam, G.P.; Park, K.R. Fast query-by-singing/humming system that combines linear scaling and quantized dynamic time warping algorithm. Int. J. Distrib. Sens. Netw. 2015. in press. [Google Scholar]
- Essen Associative Code and Folksong Database, Available online: http://www.esac-data.org./ accessed on 9 May 2015.
© 2015 by the authors; licensee MDPI, Basel, Switzerland This article is an open access article distributed under the terms and conditions of the Creative Commons Attribution license (http://creativecommons.org/licenses/by/4.0/).