Lubricating and Waxy Esters. VI. Effect of Symmetry about Ester on Crystallization of Linear Monoester Isomers

Abstract
: The crystal structure development of jojoba-like esters incorporating either 1-decenoic acid and/or 1-decenol, namely octadec-9-enyl dec-9-enoate (JLE-281), and its isomer dec-9-enyl oleate (JLE-282) was investigated to reveal the effect of symmetry about the ester group on crystallization of aliphatic fatty monoesters. The phase transformation path was investigated with temperature-time resolved X-ray diffraction during stepped isothermal crystallization, and while cooling from the melt at a fixed rate. Startling differences in phase behavior were uncovered between the isomers. When stepped isothermals were used, selective extinctions occurred at a transition temperature for JLE-281 but not for JLE-282. The extinctions, which are due to dramatic changes in the electronic density of certain families of planes, indicate a phase transition attributed to a brusque rearrangement of the oxygen atoms in the crystal subcell. The phase transition did not occur when the JLEs were cooled continuously. The crucial role played by the position of the alkyl chain and its orientation relative to the easy rotation site of the C–O bond in the phase trajectories of the JLEs was particularly highlighted.1. Introduction
Ester compounds are versatile materials used in many industries. They possess unique properties suitable for a wide variety of applications ranging from lubricants to cosmetics, medical formulations, and foods [1]. Monoesters, such as those found in jojoba oil, are known to be very functional as lubricants and performance waxes [2,3]. They are a particularly interesting family of compounds which can be exploited to custom design novel functional materials. However, fundamental studies on this important class of materials are very limited. Furthermore, the effect of structure on their physical properties is poorly understood, hindering our ability to optimize function based on structure.
In this regard, the “Trent Center for Biomaterials Research”, has been investigating a series of ester model materials, starting with pure aliphatic mono-, di, and tri-esters and their branched derivatives. The syntheses, crystallization and melt, polymorphism, solid fat content, rheology, and modeling are parts of a comprehensive approach taken to better understand the phase behavior of these compounds, and uncover the relationships between their physical properties and structural features. Some of this work has already been published [4–8].
Phase trajectories and polymorphism are very important in defining the physical properties of ester compounds. The path through which the crystal structure of esters develops as crystallization proceeds is very complex. It depends on the structural details of the molecule such as chain length, symmetry, and other carbon chains or groups that might be added to functionalize them, as well as the thermal protocol used. It is well established that the trajectories through which ester molecules approach each other to form the initial nucleus are determined by directional non-bonding interactions [9] in which the weak C–H···O contacts formed by the alkyl group play a central role [10]. The ester molecules initially adjust and optimize themselves through the influence of the weakly directional and electrostatic long-range interactions then start to close pack at shorter distances with the optimization of short range van der Waals interactions to achieve close packing with maximum density. The final close-packed structure with minimum free energy is determined by the interplay between the directional interactions, van der Waals contribution and symmetry considerations.
Variable-temperature techniques, such as variable-temperature X-ray diffraction (XRD), are powerful approaches for studying crystal phase transitions and probing the diverse interactions involved and their evolution and interplay during the transformation [9,11]. The crystal structure data collected at several temperatures is in fact an in-situ fingerprint which allows the direct visualization of the crystal phase trajectories, and a depiction of the polymorphism of the material.
We have recently reported on the synthesis, crystallization and melting behavior, solid content evolution and rheology of three pure jojoba-like esters (JLE) incorporating either 1-decenoic acid and/or 1-decenol and oleic acid and/or oleoyl alcohol, namely octadec-9-enyl dec-9-enoate (JLE-281), dec-9-enyl oleate (JLE-282) and dec-9-enyl dec-9-enoate (JLE-20) [6]. 1-decenoic acid or 1-decenol is a fatty acid/fatty alcohol whose unique terminal double bond structure has not before been investigated in monoester formulations. These relatively simple single-molecule esters were easily produced from cheap fatty acid feedstock. The findings suggested that they are materials that can be exploited well as lubricants, and waxes in applications such as greases, cosmetics and pharmaceuticals. Their thermal and flow behavior was well correlated to the structural complexity of the molecule (position of the central cis-double bond relative to the C–O–C bond of the ester group and rotations hindrance). In the present work, the phase trajectories and polymorphism of JLE-281 and JLE-282 were investigated on a conventional X-ray diffractometer by temperature-time resolved XRD during stepped isothermal crystallization, and during cooling from the melt at a constant rate.
X-Ray Data Analysis and Polymorphism of JLEs
The common crystal structure models for waxes and related aliphatic compounds were established in numerous studies. The molecules take different orientations relative to their neighbors by rotation around their long axis, forming different crystal structure symmetries of the methylene subcells [12]. Three basic symmetries, commonly denoted as α, β′ and β, are described in the literature [13]. The chains of the α-polymorph either pack in a hexagonal symmetry with nonspecific chain-chain interactions or they can rotate around the long axis (so-called rotator phase). The α-polymorph is characterized by one strong wide-angle reflection in the XRD pattern at a lattice spacing of ∼4.2 Å, originating from the 100α basal plane reflection. The common subcell packing of the β′- polymorph is orthorhombic, with the alternate acyl chains packing in planes almost perpendicular to each other (O⊥), and is characterized by two strong wide-angle reflections at lattice spacings of 4.2–4.3 Å originating from the 110β′ reflection and 3.7–3.9 Å originating from the 200β′ reflection. The chains packing of the β′-polymorph form an angle of tilt between 50° and 70°. The hydrocarbon chains of the β-polymorph are commonly packed parallel to each other in a triclinic (or monoclinic, if the angles α and γ are 90 °C) parallel subcell (T//). The β-form is characterized in the wide-angle region by a lattice spacing of ∼4.6 Å originating from the 010β reflection and a number of other strong reflections around 3.6–3.9 Å. The β-polymorph is the most stable crystal form, with the highest melting temperature, and the α-polymorph is the least stable crystal form, with the lowest melting temperature [14,15].
The “long spacing” peaks provide information about the layer order. The d-value of the β (001)-reflection represents the thickness of the molecular layers [16]. A series of higher order (00l)-reflections indicates a regular, periodic structure and represents the periodical sequence of electronic density differences in multiple layers. In the case of hydrocarbons, such as alkanes, the series of (00l)-peaks originates from the region of lower scattering density in the gap between the molecular layers [17,18]. The acyl chains of the α-polymorph do not form an angle of tilt; whereas those of β′- and β-polymorphs form an angle of tilt between 50° and 70° [19,20].
2. Results
2.1. Thermal Transitions of the JLEs during Cooling from the Melt
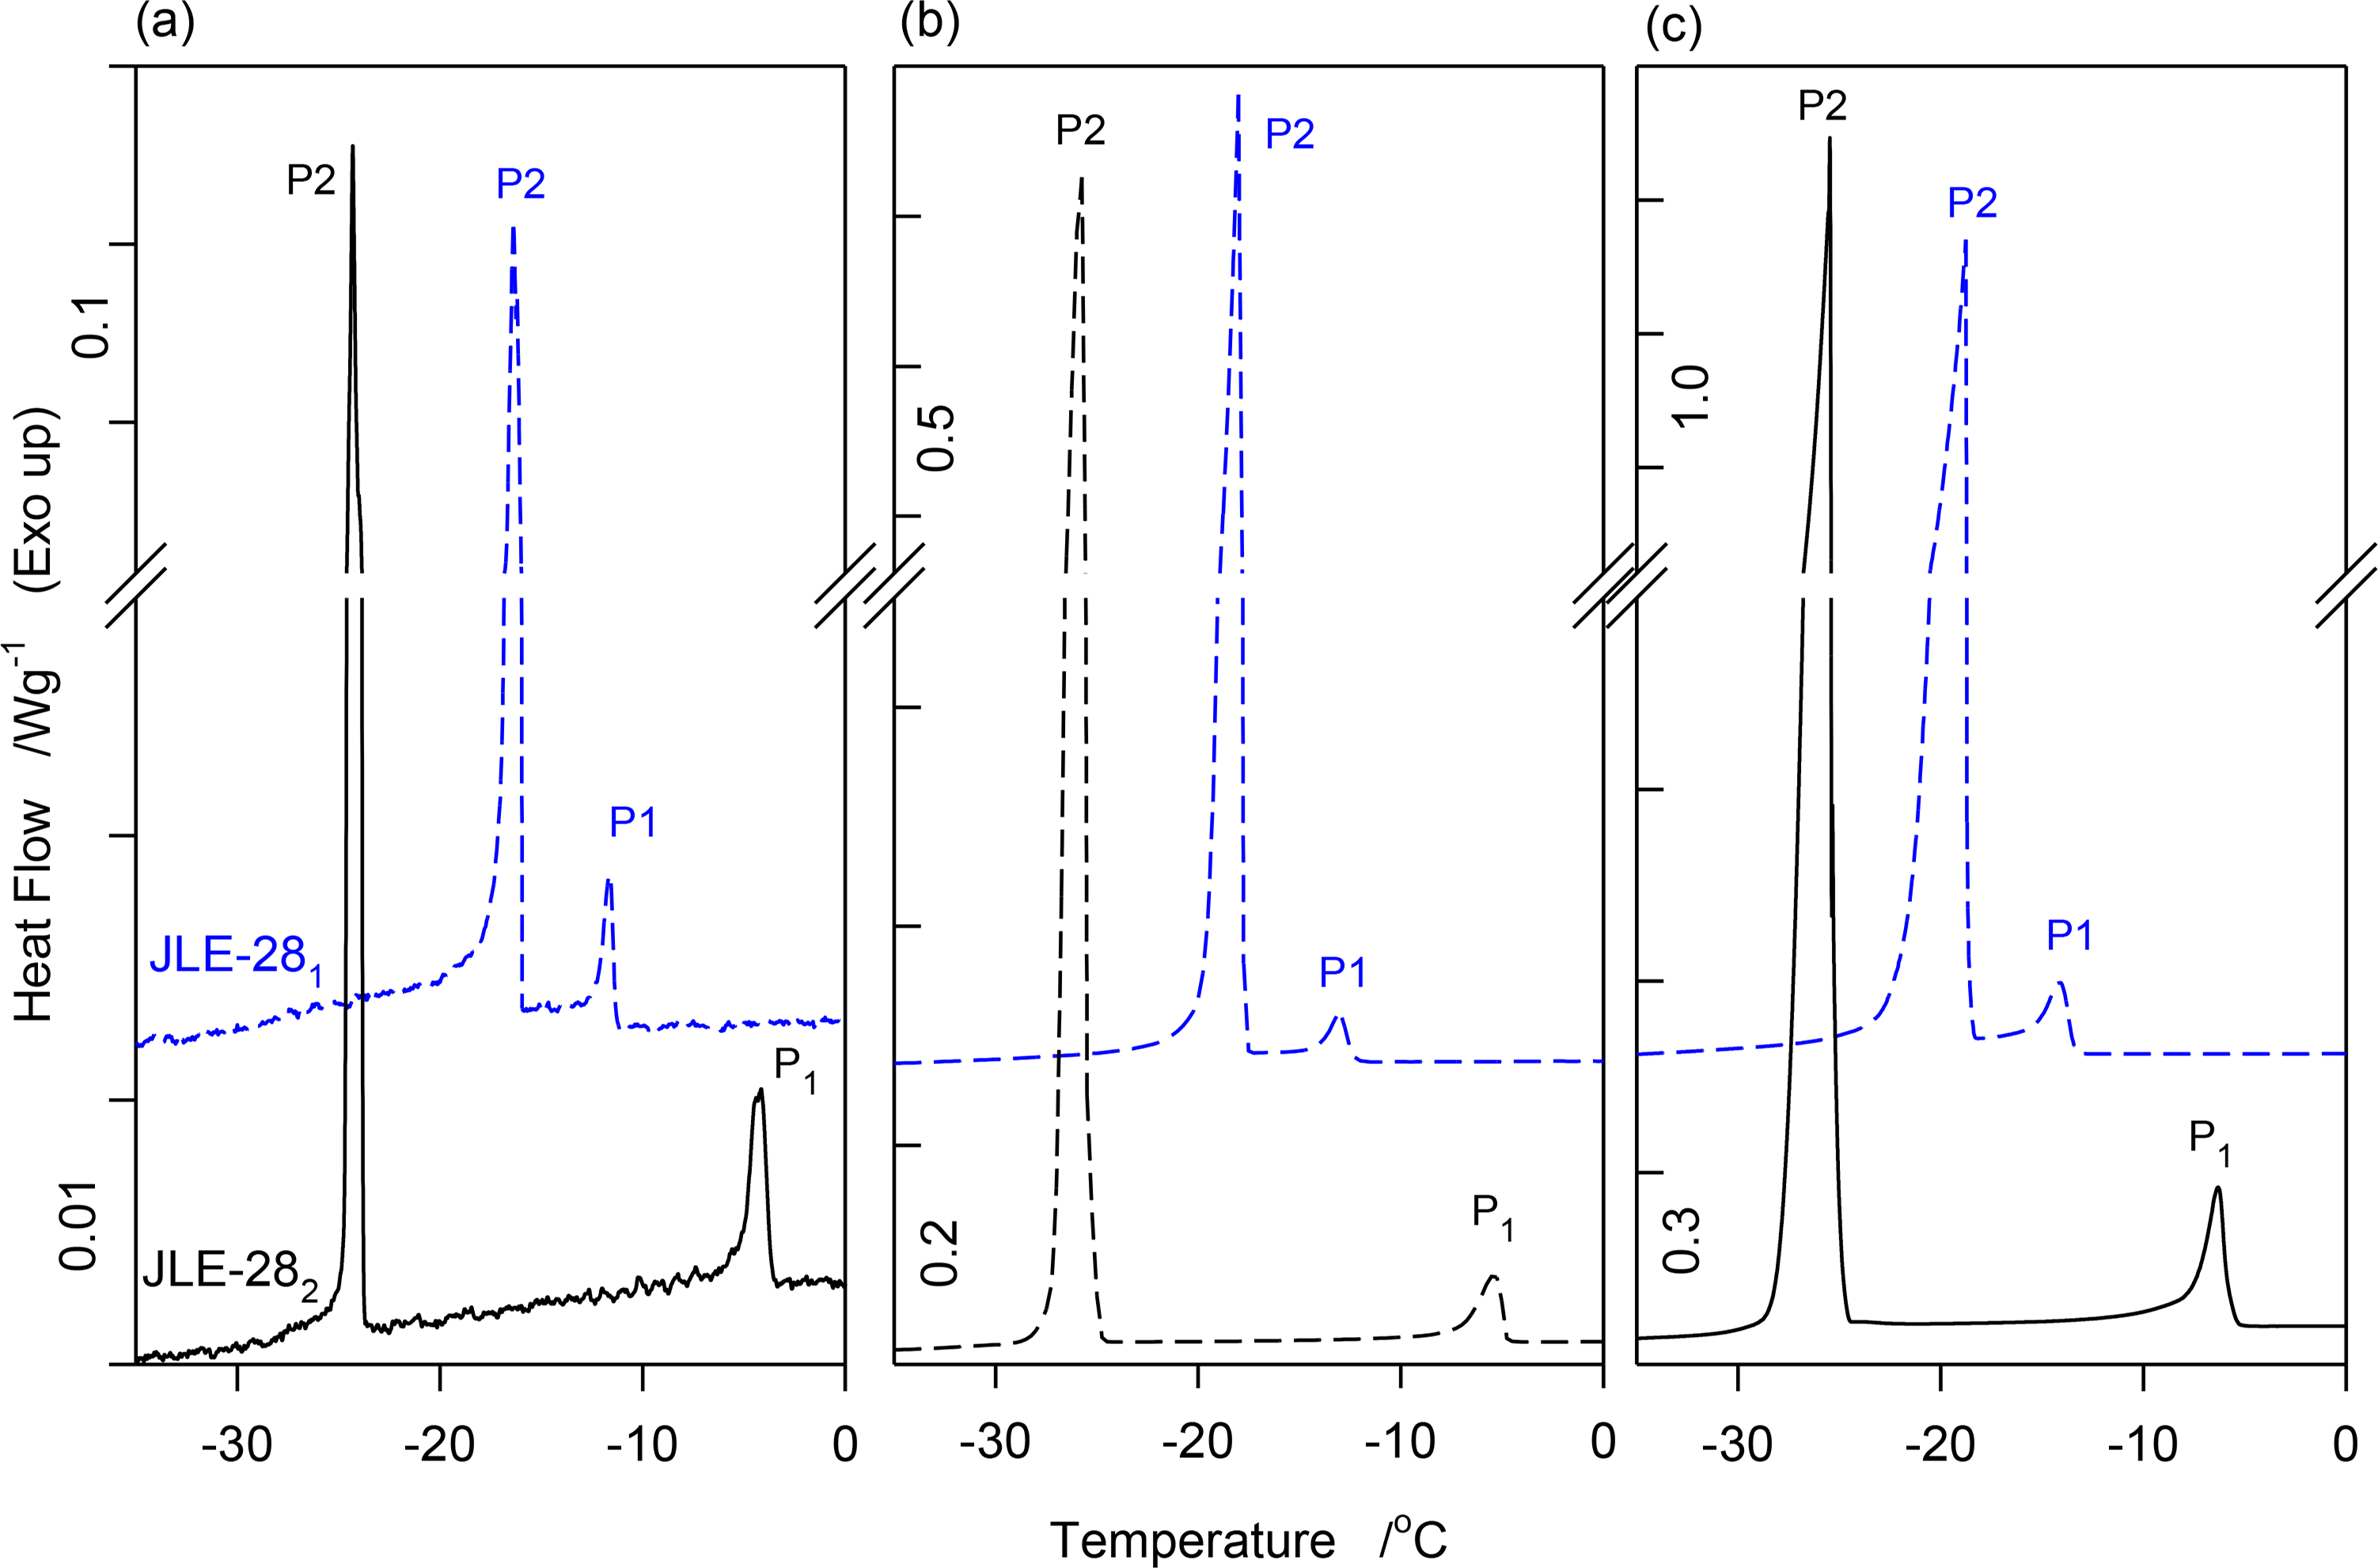
In order to obtain the crystallization profiles, the samples were cooled in the DSC) from the melt (50 °C) down to −90 °C at a constant rate (0.1, 1.0 and 3.0 K/min). The DSC cooling traces of the JLEs obtained in the 0.1, 1.0 and 3.0 K/min experiment are shown in Figure 1a–c, respectively, and the corresponding thermodynamic data are listed in Table 1. Note that whether cooled rapidly (3.0 K/min) or slowly (0.1 K/min), JLE-281 and JLE-282 presented similar crystallization profiles with a small leading peak (P1 in Figure 1a–c) followed by a main exotherm (P2 in Figure 1a–c). Furthermore, the relative magnitude of these events did not change significantly with cooling rate. For instance, the enthalpy of the leading exotherm in both JLE-281 and JLE-282 was about 5%–10% of the total at all the cooling rates used. The DSC results indicate that the fundamental behavior and transformation path of the JLEs were not altered significantly by cooling rate. The phase development of JLE-281 and JLE-282 can be captured by means of conventional XRD accurately with experiments at the convenient rate of 1 K/min.
As evident in Figure 1 and Table 1, JLE-281 presented a crystallization span (ΔTC) much shorter than JLE-282. The extended crystallization in the isomer molecules was due to the long alkyl end chain, and the remarkable difference between them is attributable to easier rotation of the alkyl end chain in JLE-281 compared to JLE-282. JLE-281 presented a main exotherm at a temperature higher than JLE-282, suggesting that it crystallized in a less stable polymorph, and highlighting the role of the alkyl chain and its position relative to the alkoxy oxygen, on the crystallization process.
2.2. Crystal Phase Development of JLE-281
In order to facilitate the presentation and discussion of the results, only the wide- (WAXD) and their corresponding small-angle (SAXD) patterns measured at selected temperatures are presented in the figures. The d-spacing values are also represented in the figures on top of the WAXD reflections.
2.2.1. Phase Trajectory of JLE-281 in the Stepped Isothermal Experiments
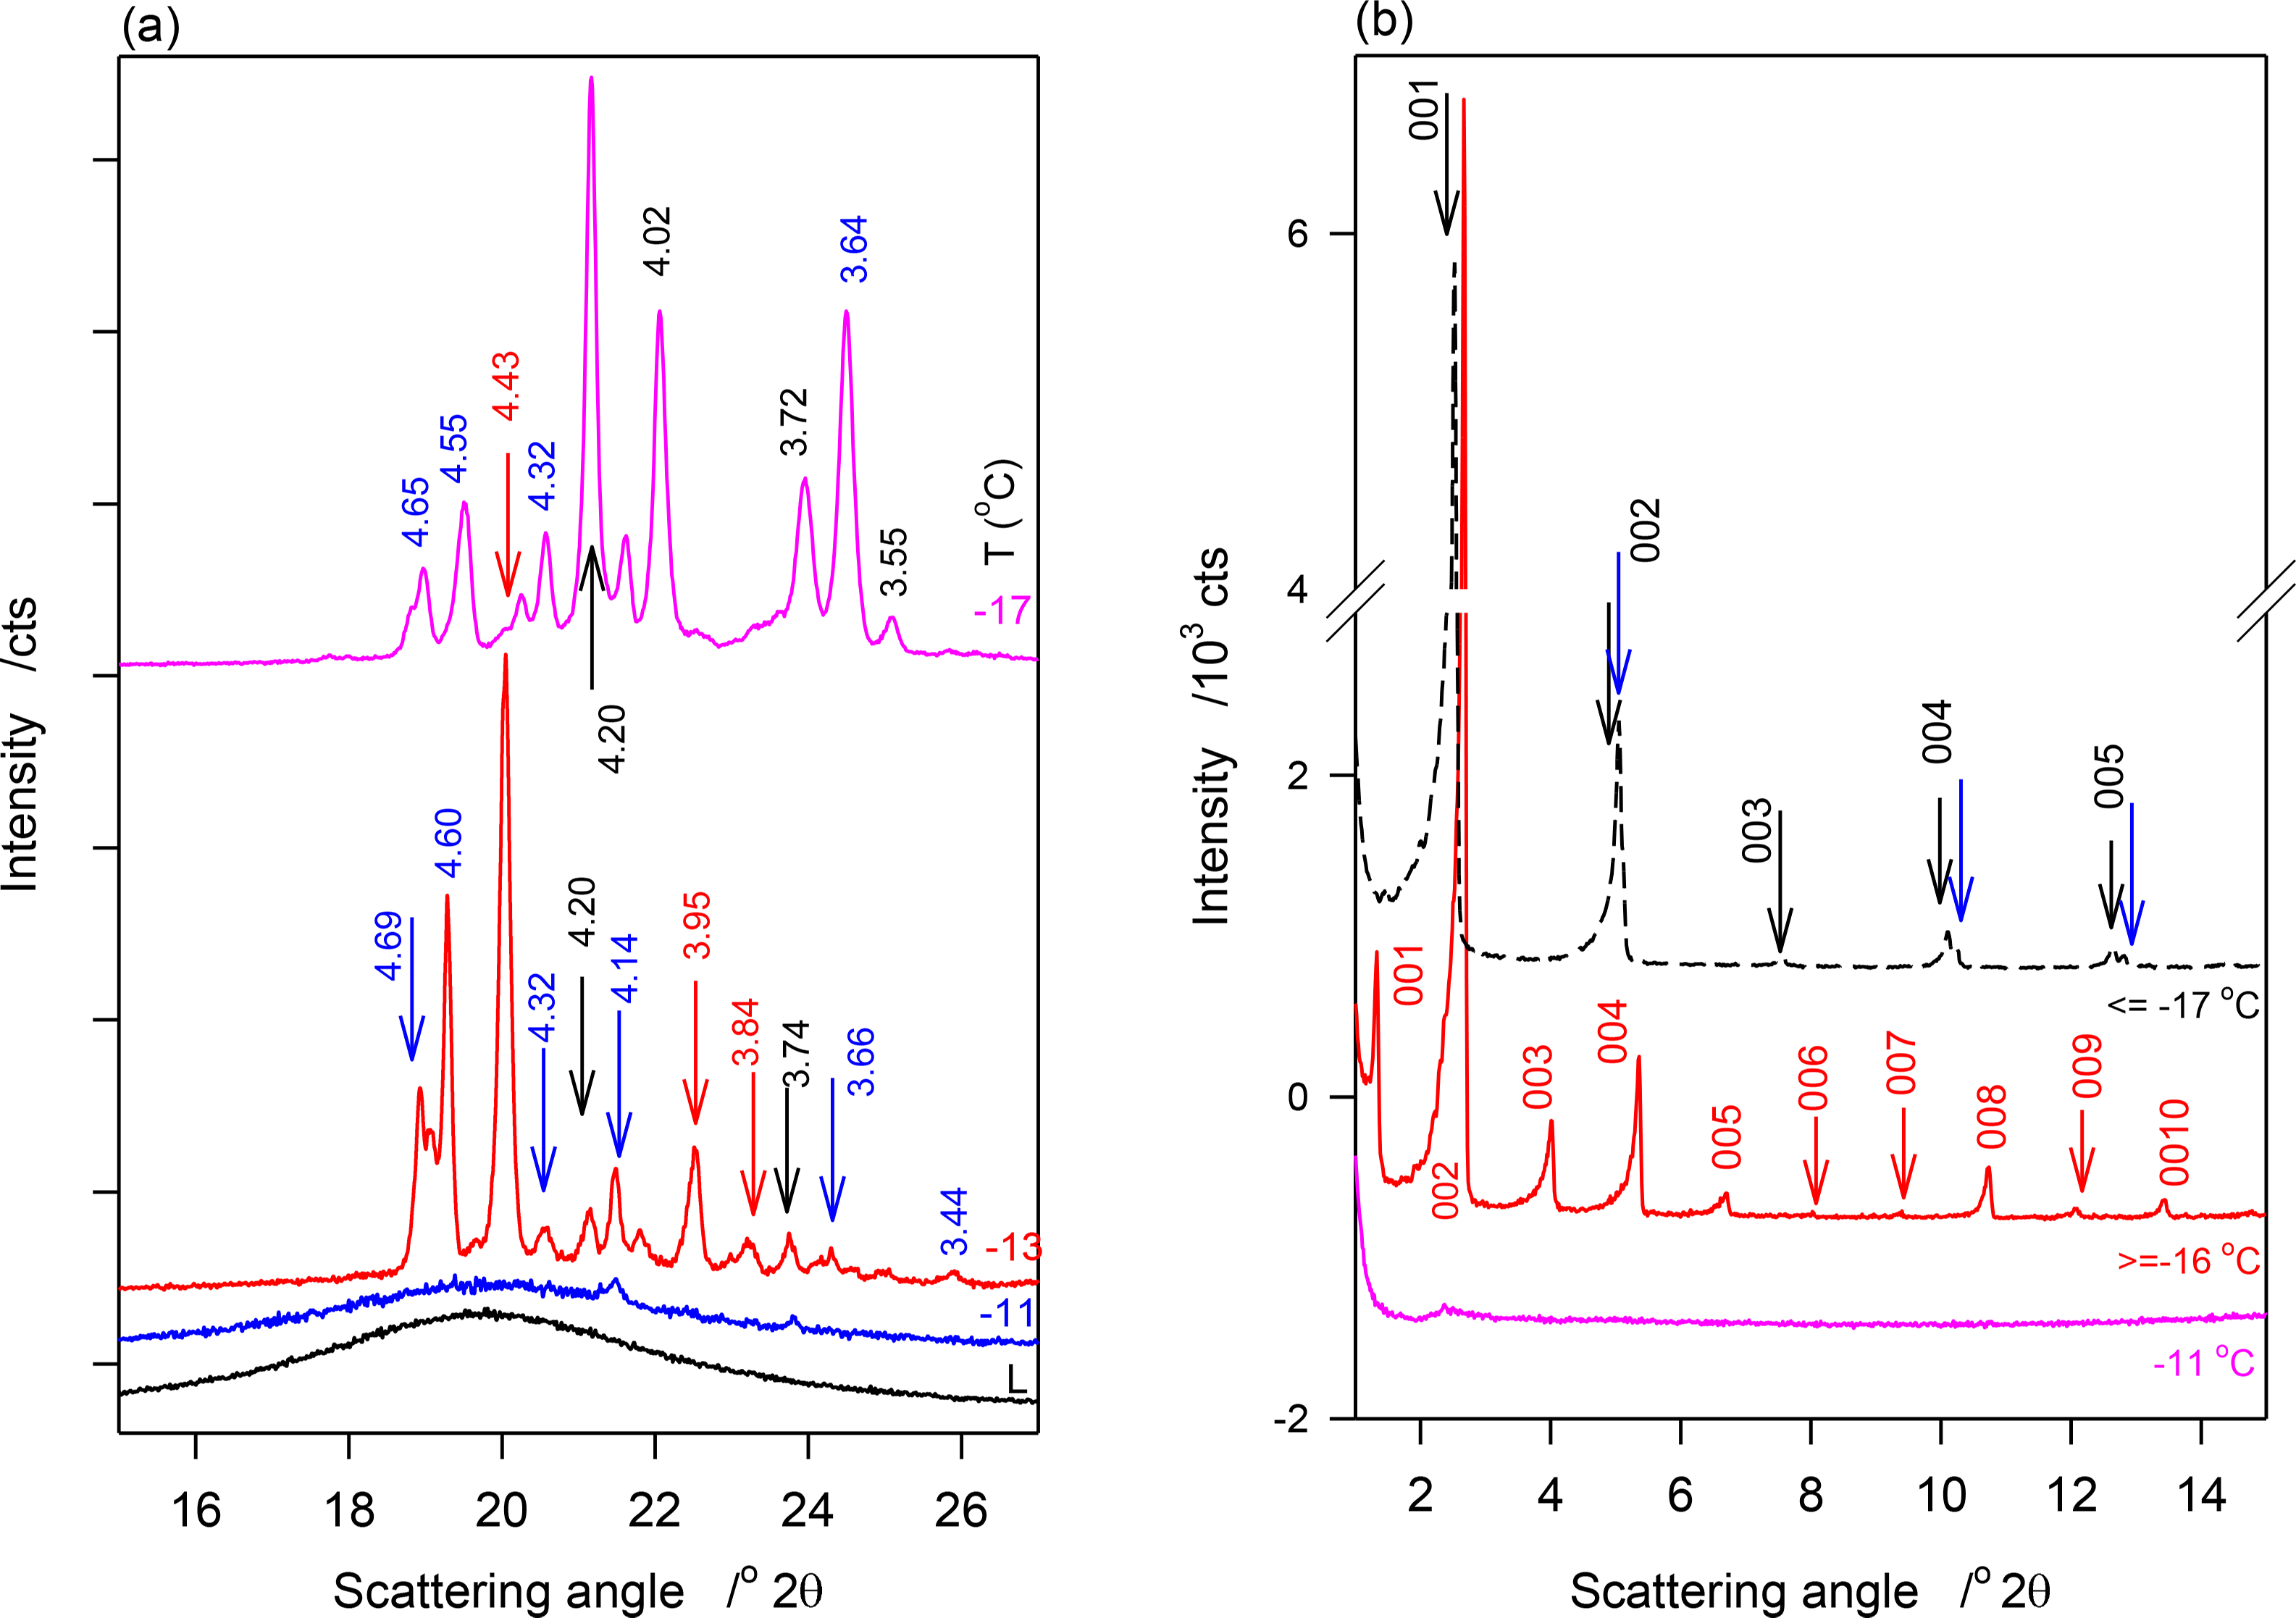
WAXD and SAXD patterns of JLE-281 obtained at selected temperatures in the stepped isothermal experiments are shown in Figure 2a,b respectively. Relevant structural and indexation data are listed in Table 2.
WAXD of JLE-281 in the Stepped Isothermal Experiments
No crystalline phase was detected by XRD in JLE-281 at temperatures higher than −11 °C. At −11 °C, the WAXD pattern of JLE-281 presented three small and broad peaks at 4.20, 4.14 and 3.74 Å (Figure 2a), attributable to the (110)β′, (1̄10)β′ and (200)β′ reflections, respectively, of an orthorhombic subcell (β′-phase). Note that although not obvious in the figure, the peak at 4.20 is quite distinct and discernible in the analysis software view. These peaks were superimposed to a wide and large halo, indicating that the β′-crystals were very small and dispersed in a very large liquid phase.
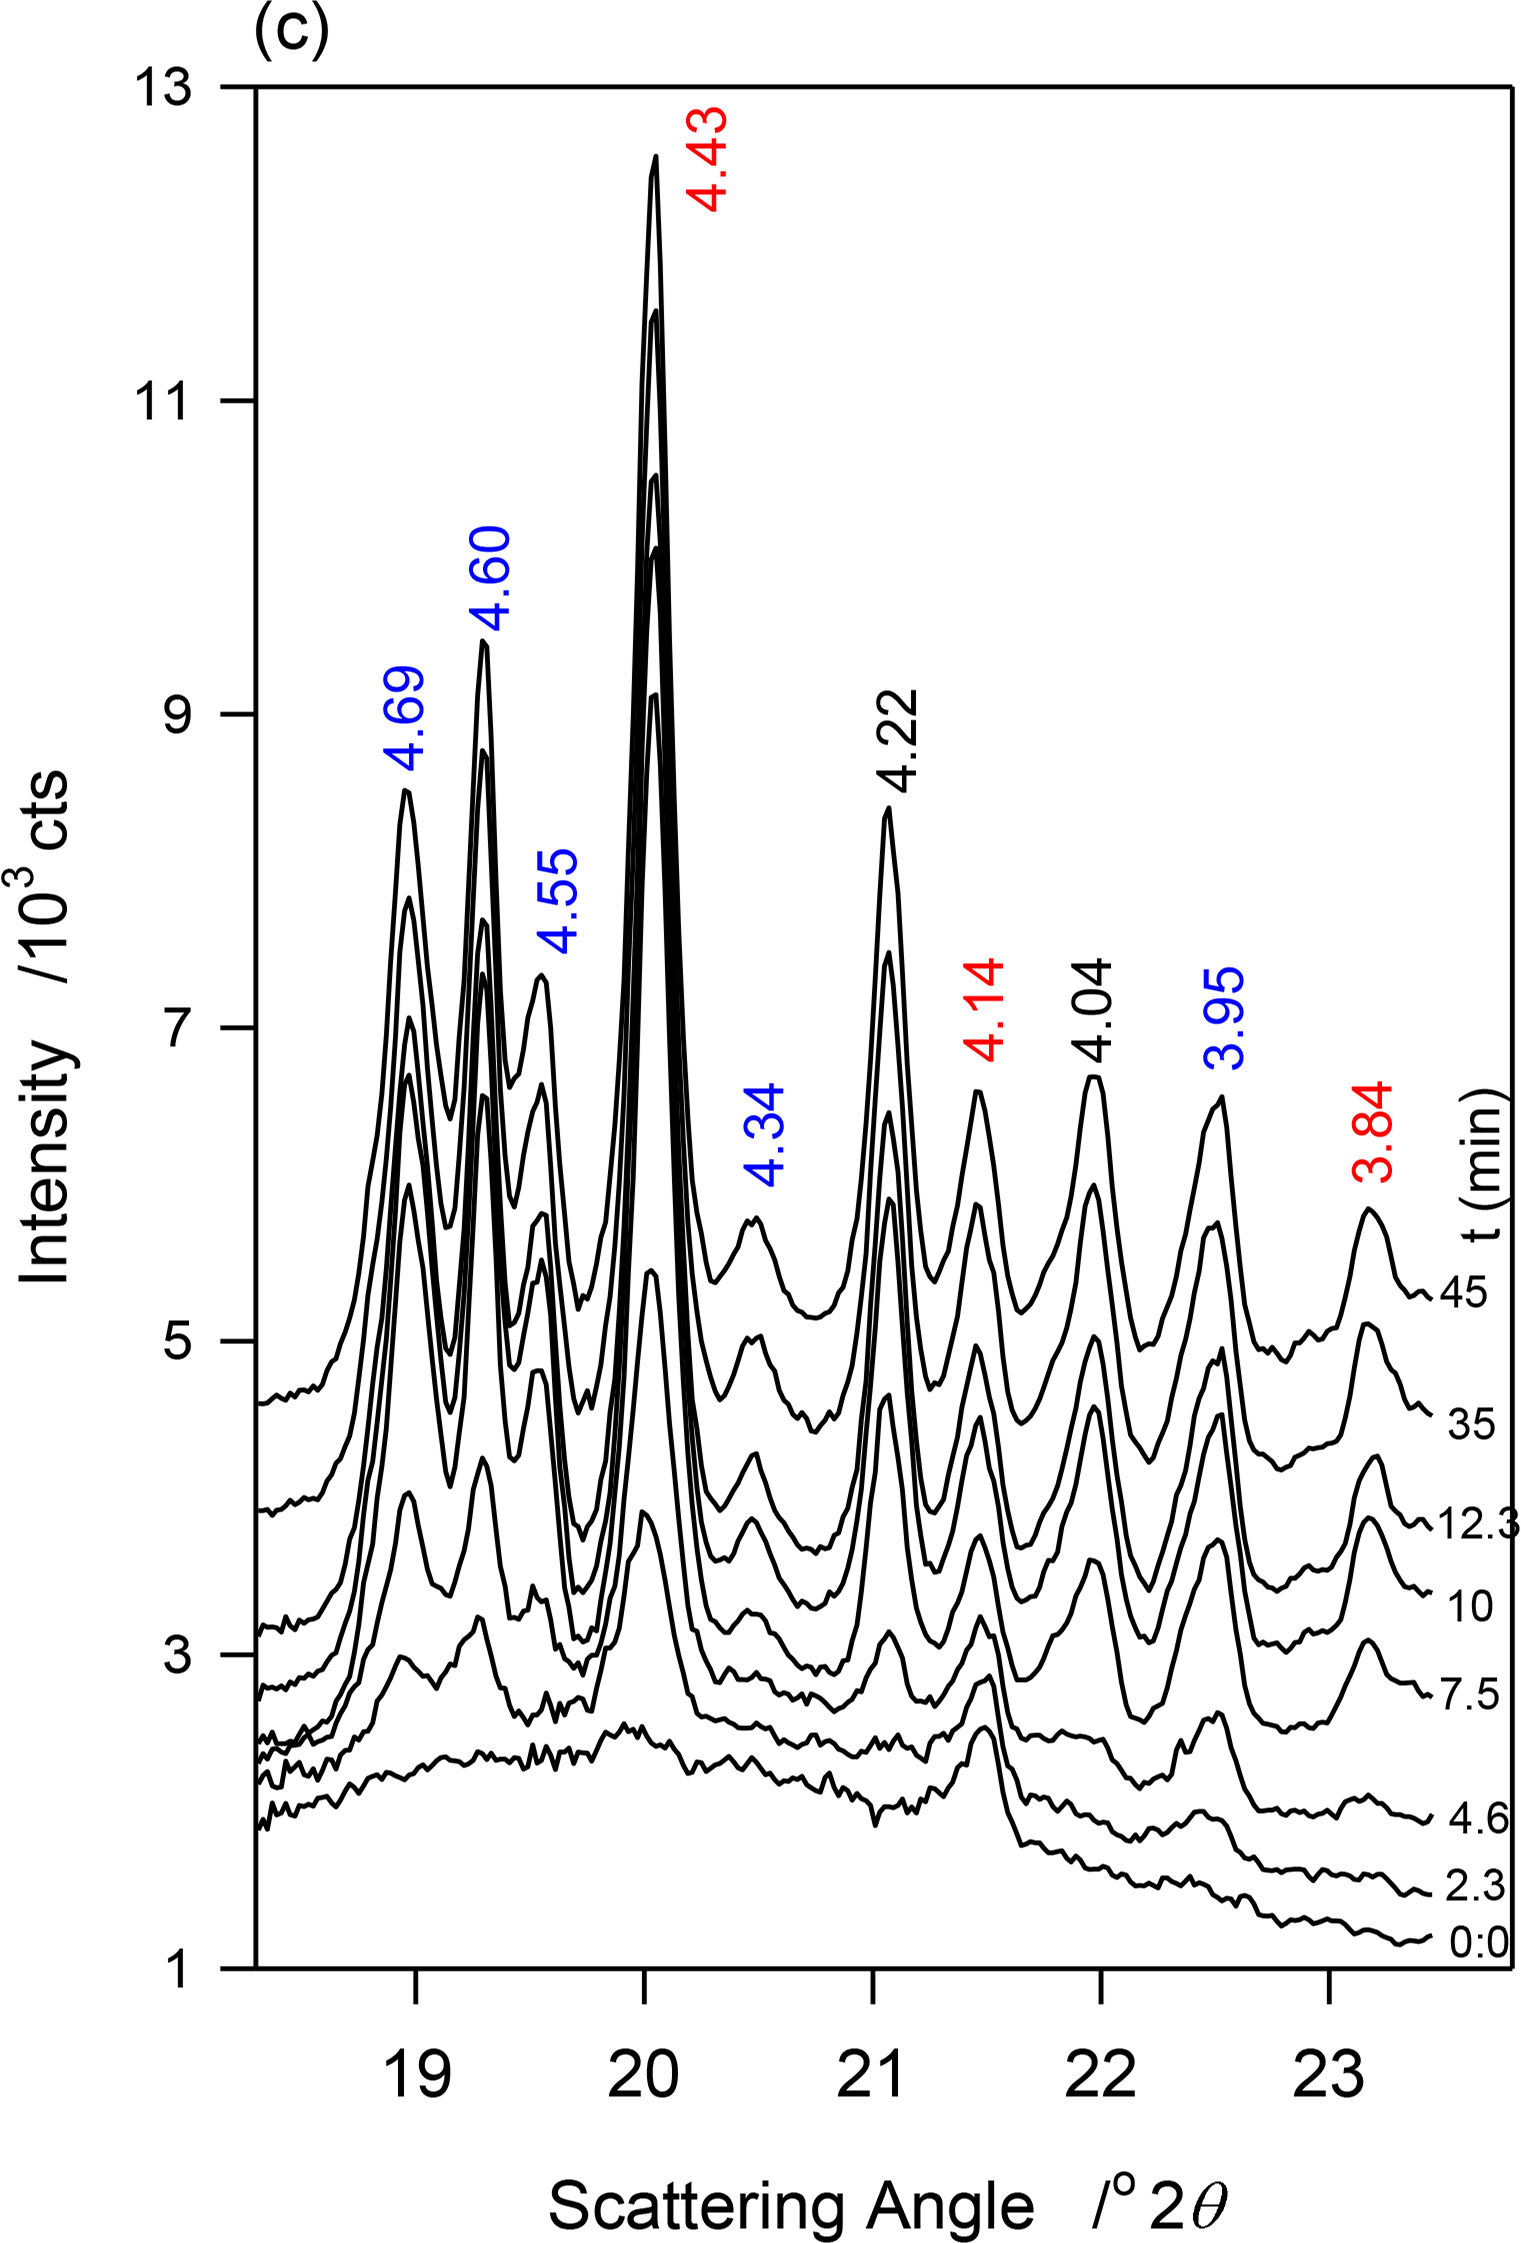
At −13 °C, a temperature matching the onset temperature of crystallization of JLE-281, several very sharp extra peaks appeared in the WAXD (Figure 2a). At least nine reflections associated with a triclinic subcell (β-phase) were unambiguously indexed (Table 2). As shown in the time resolved XRD patterns of JLE-281 at −13 °C (Figure 2c), the peaks of the β-polymorph appeared with those of β′ and evolved concurrently. The halo characteristic of the liquid phase disappeared after ∼10 min at −13 °C, indicating that the crystallization of JLE-281 was complete. Note that the peaks of both phases increased with time indicating that the two phases grew together. The XRD patterns recorded between −13 and −16 °C were very similar to the XRD trace recorded at −13 °C.
Temperature Induced Phase Transition in JLE-281 at −17 °C
Surprisingly, when the temperature was decreased from −16 °C to −17 °C (Ttr), the peaks at 4.43, 3.95 and 3.84 Å ((010β), (102β) and (1̄10)β) of the β-form, respectively) did not show in the WAXD of JLE-281 or any other lower temperature (Figure 2a), indicating the occurrence of a phase transition. At this temperature (Ttr = −17 °C), (100β) shifted from 4.60 Å to 4.55 Å; whereas, (101β) remained at the same position. Furthermore, FWHM of (100β) and (101β) increased noticeably (Figure 2a), indicating a deterioration of homogeneity and a decrease of the crystal order of the β-phase. Concurrently to the deterioration of the β-phase, the β′-phase improved dramatically, as indicated by the dramatic increase of the intensity of its (110β′) and (200β′) reflections. There were no further changes in the XRD patterns of JLE-281 measured at lower temperatures, indicating that the transformation was complete at −17 °C. It is worth noting that Ttr corresponds to the onset temperature of the second DSC exotherm of JLE-281.
SAXD of JLE-281 in the Stepped Isothermals Experiments
JLE-281 presented two completely different SAXD patterns below and above Ttr (Figure 2b). One series of ten reflections (d001 = 66 Å, Table 2) was presented before the transition and is associated with the packing structure of the β′-phase, and a doublet series of five reflections each was presented at Ttr and below (d001 = 35.0 and 34.6 Å, S1 and S2 in Table 2). The doublet series probably originated from the lateral and horizontal periodicities of the tilted subcell [19,20].
2.2.2. Phase Trajectory of JLE-281 in the Continuous Experiments
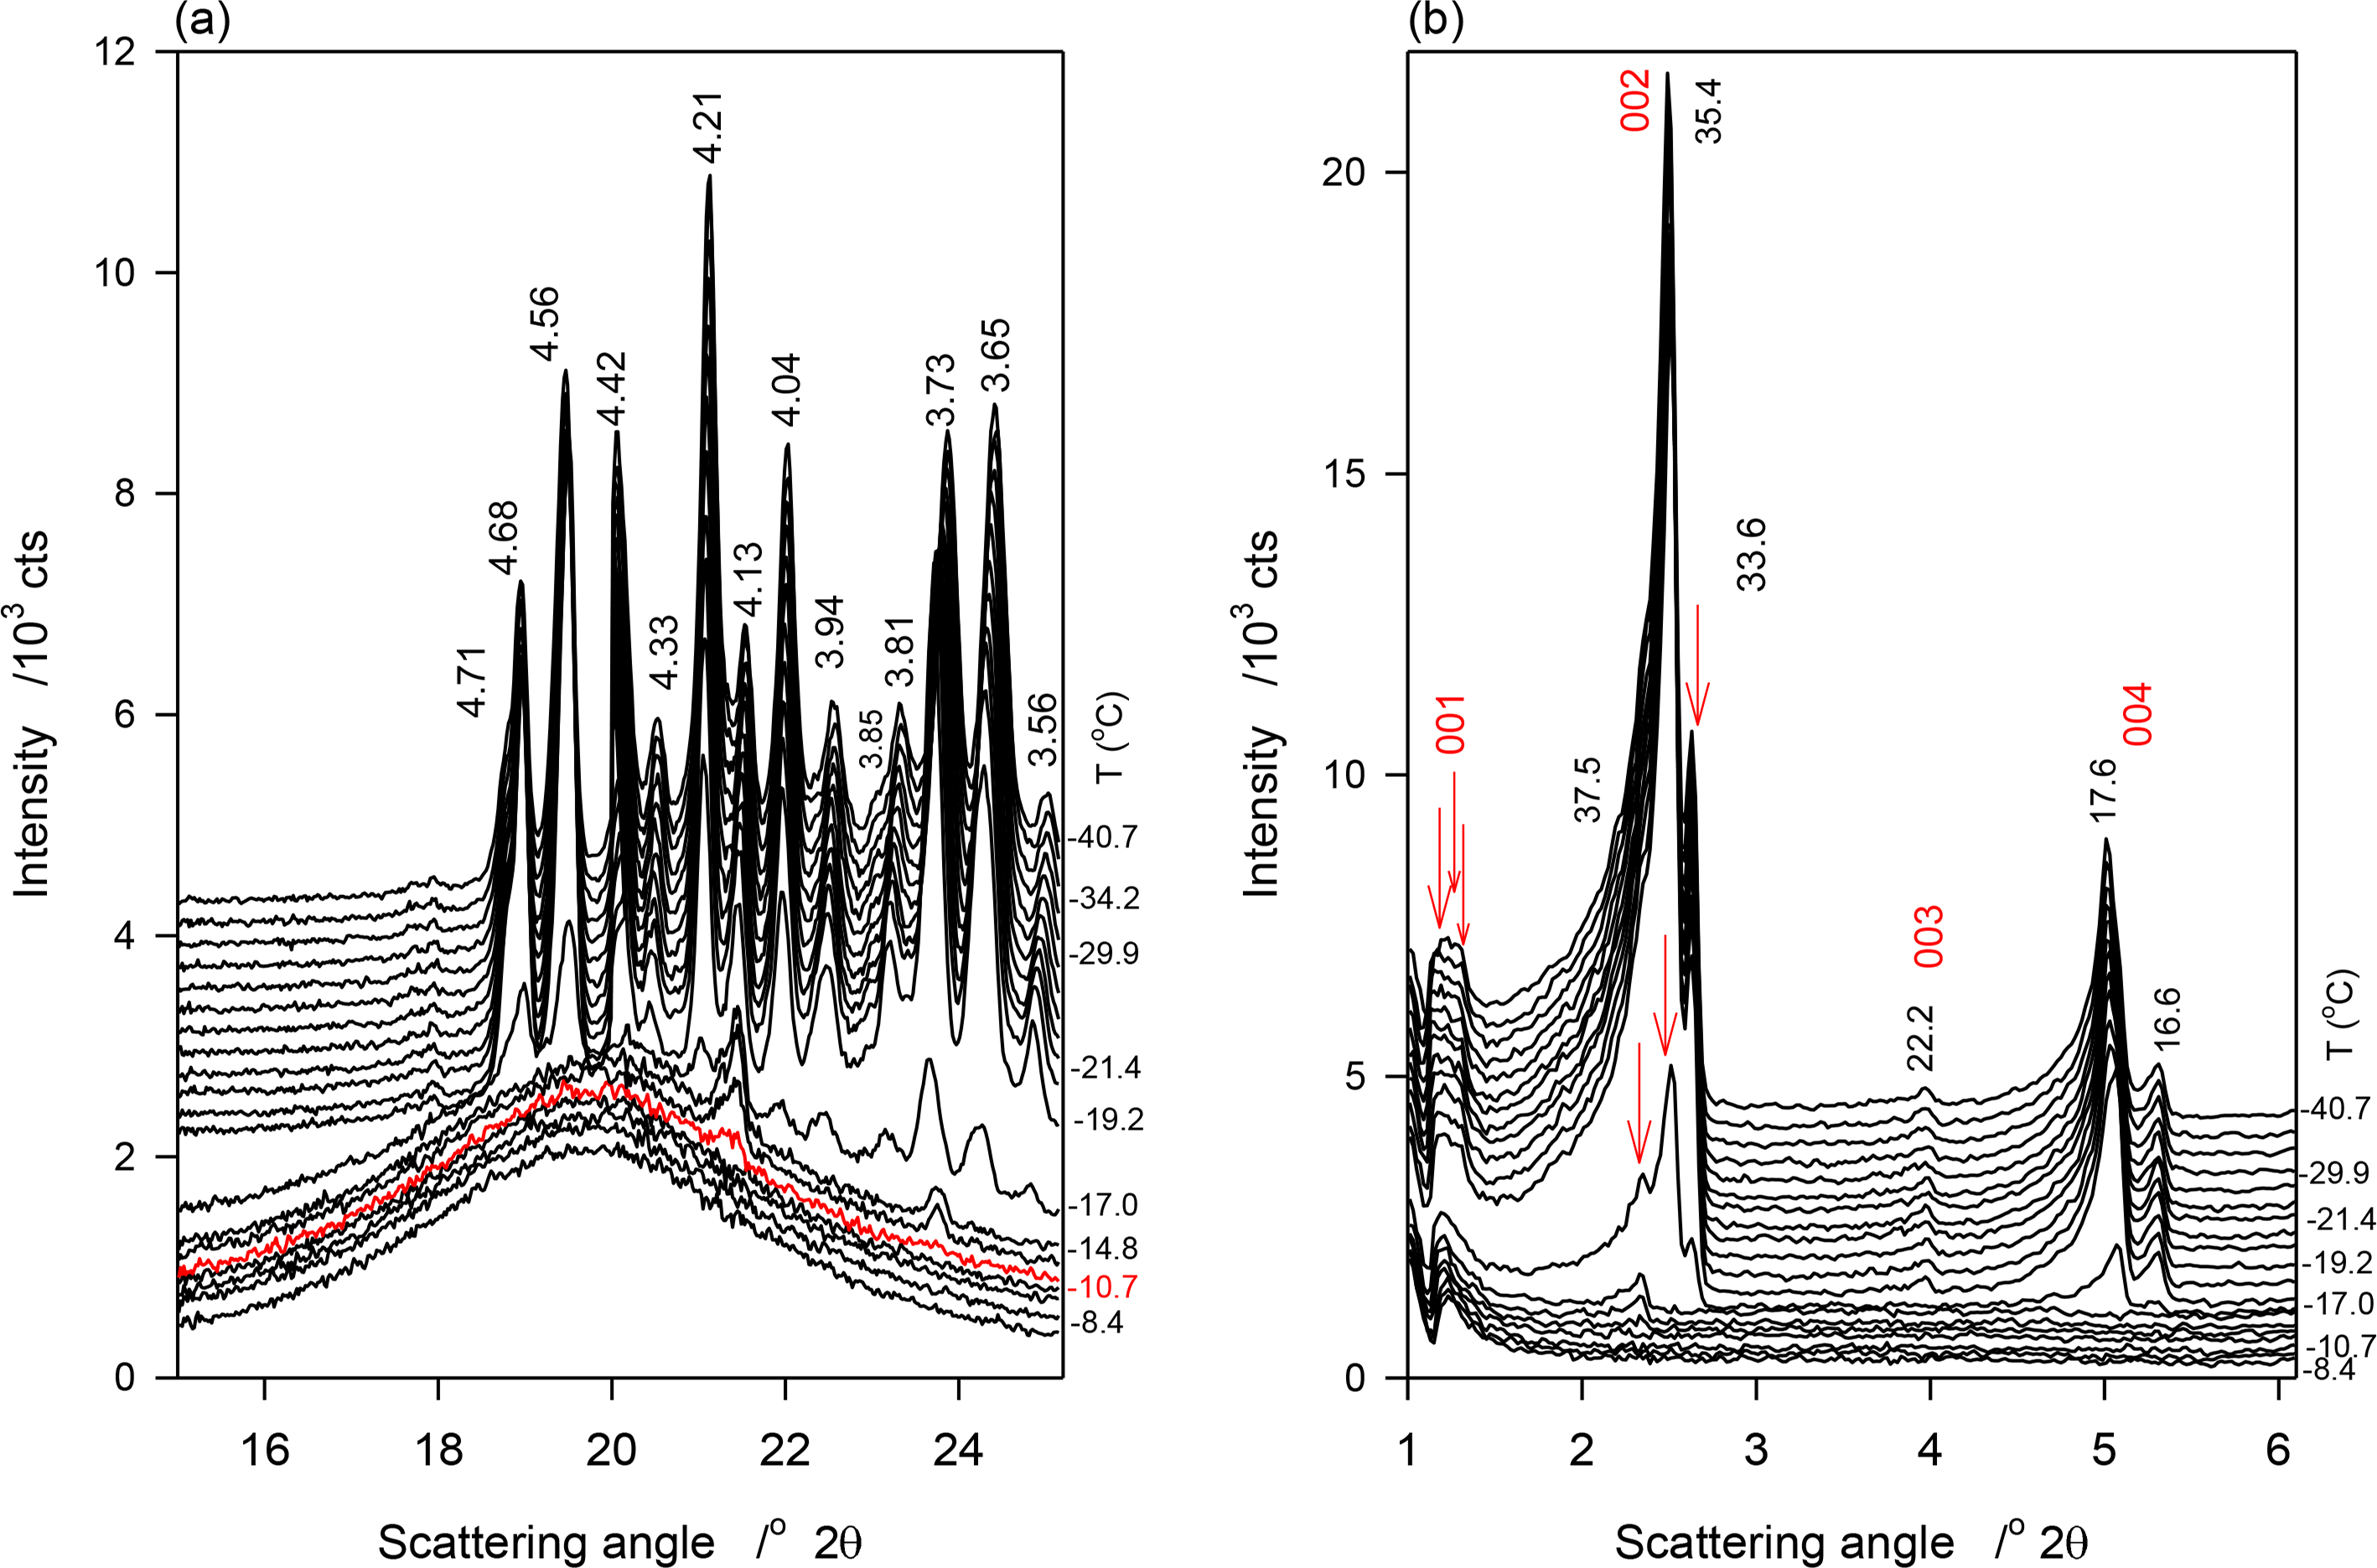
Figure 3a,b show selected temperature-resolved WAXD and SAXD patterns obtained during the continuous crystallization (1 K/min) of JLE-281, respectively. Relevant structural and indexation data are listed in Table 3.
Similar to the stepped experiments, three small and broad peaks, at 4.20, 4.14 and 3.74 Å of the β′-phase appeared at −11 °C in the WAXD pattern of JLE-281 during the continuous experiments (Figure 3a). These peaks remained weak and broad, superimposed to a wide and large halo, until −17 °C where a large number of reflections from the β- and β′-phases appeared alongside the first three peaks. The intensity of the peaks of both phases increased as the sample was cooled further (Figure 3a, Table 3).
The SAXD patterns evolved similarly to the WAXD. One series of two wide and broad peaks appeared above −17 °C (S0 in Table 3), indicating a loose packing of the JLE-281 molecules. At −17 °C, two new series of very close doublet peaks (S1 and S2 in Table 3) appeared together with S0. As evident in Figure 3b, the peaks of these series increased much more than those of S0. As discussed below (Section 4.1.2) S1 and S2 are attributable to the parallel and perpendicular periodicities of the packing structure of the β-phase.
2.3. Crystal Phase Development from the Melt of JLE-282
2.3.1. Phase Trajectory of JLE-282 in the Stepped Isothermal Experiments
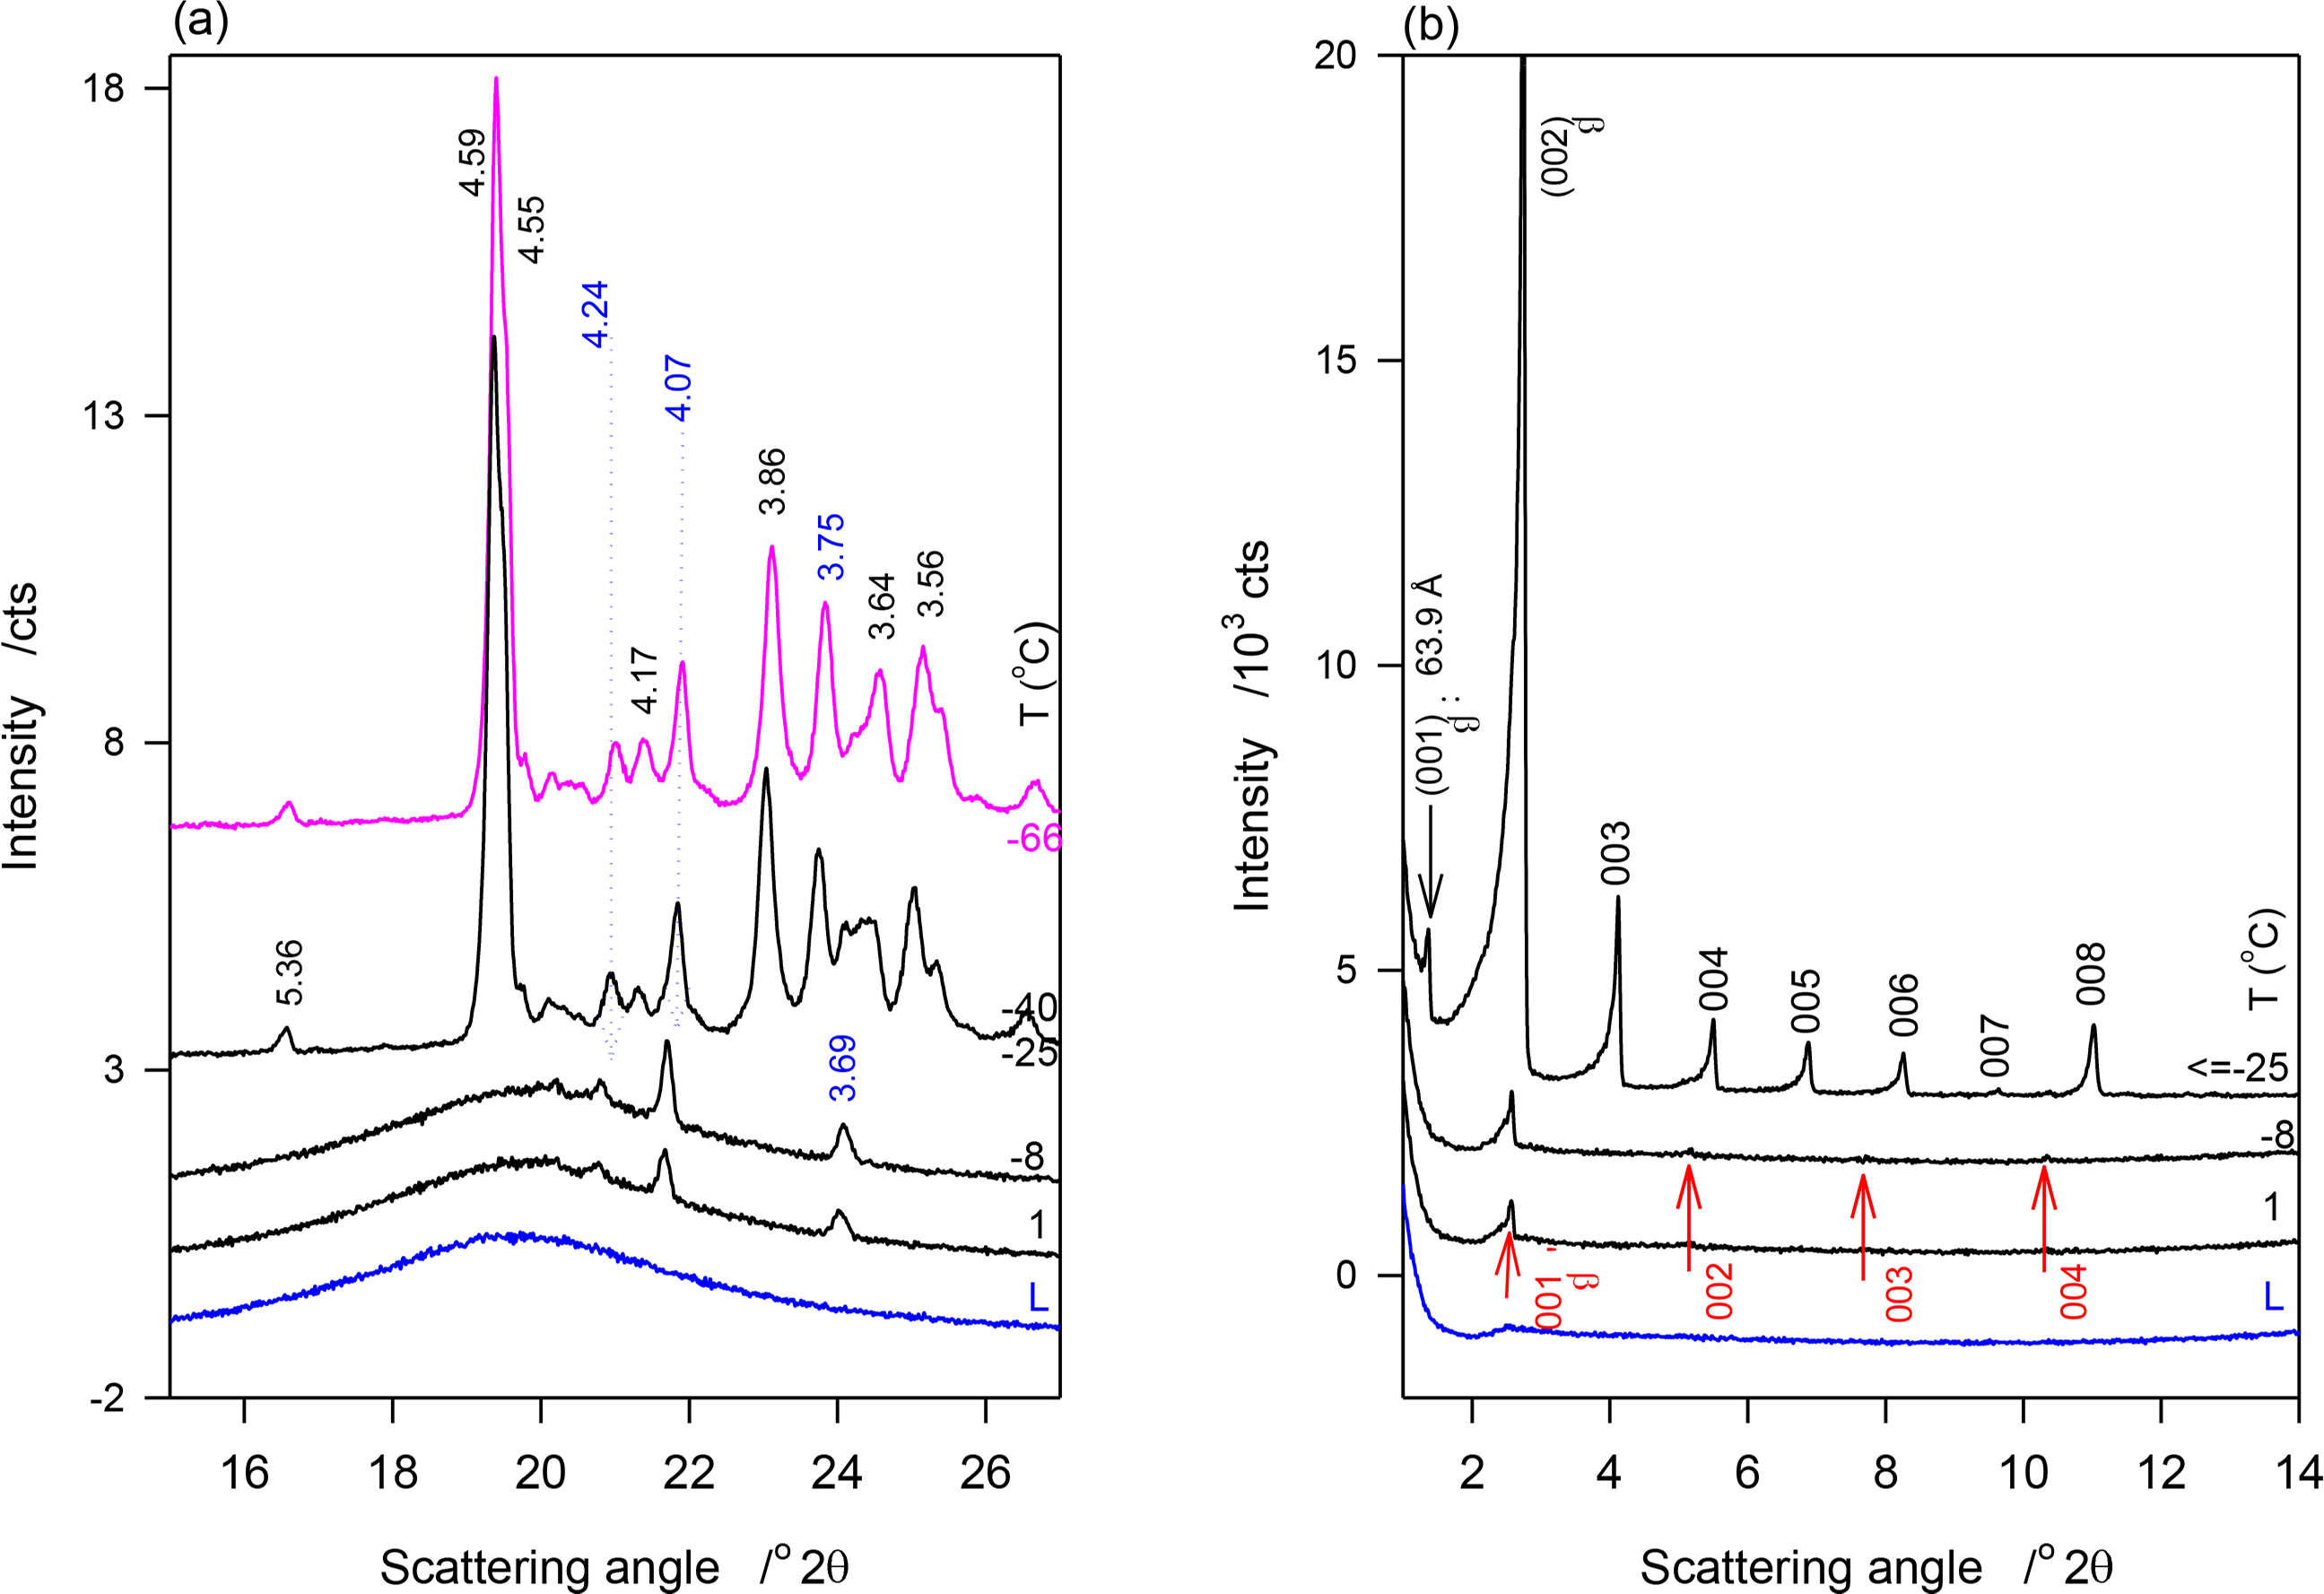
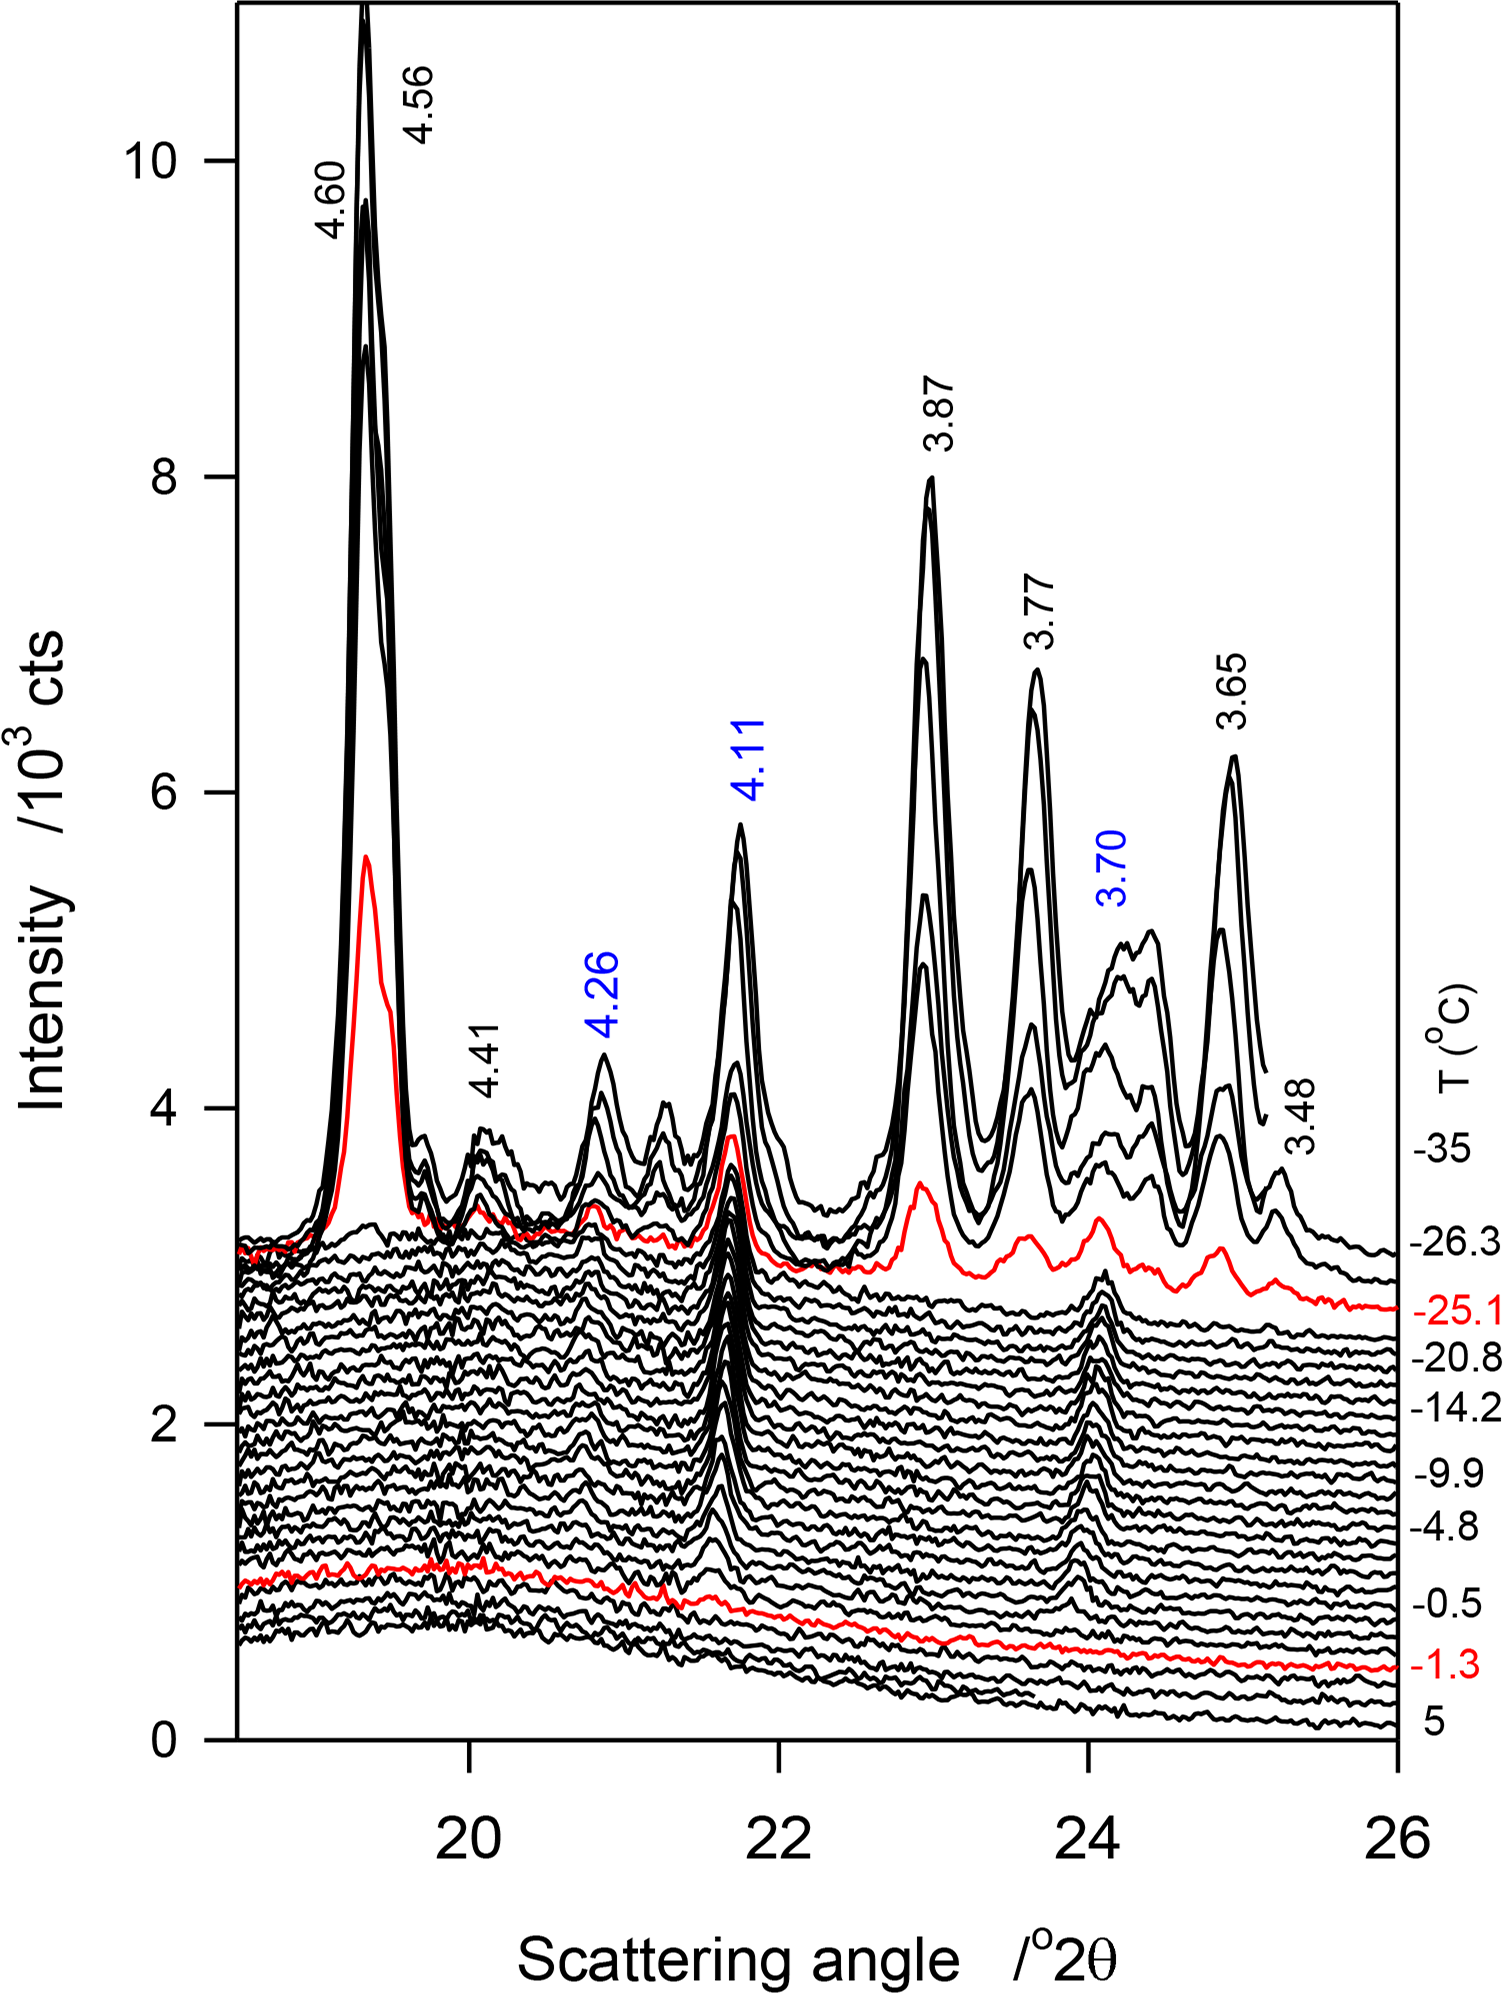
Figure 4a,b show the SAXD and WAXD patterns of JLE-282, respectively, obtained at selected temperatures in the stepped experiments. The relevant d-spacing and corresponding Miller indices are listed in Table 4. As shown in Figure 4a, the reflections at 4.24, 4.10 and 3.69 Å of the β′-phase ((110)β′, (020)β′ and (200)β′, respectively) were first detected at 1 °C. These peaks were the only WAXD reflections present above −25 °C, indicating that at this point, only the β′-phase was formed. Up to −25 °C, the peaks were superimposed to a large halo indicating that only a small amount of the β′-phase was crystallized. Note that as estimated from the relative intensity of the WAXD crystalline peaks, the β′-phase increased with decreasing temperature reaching a plateau of ∼8% at −9 °C. Several reflections of the β-phase, notably at 4.59, 4.55, 3.86 and 3.64 Å, appeared at −25 °C (Figure 4a, Table 4). No extra peaks or intensity change were observed in the WAXD patterns measured at lower temperatures, indicating that the crystallization of JLE-282 was complete during the isothermal crystallization at −25 °C. Recall that −9 °C is the offset temperature of the leading DSC exotherm and −25 °C the onset temperature of the second DSC exotherm of JLE-282.
The SAXD of JLE-282 mirrored its WAXD. As can be seen in Figure 4b, SAXD patterns obtained above −25 °C were noticeably different from those obtained at −25 °C and below, revealing different chain stacking in the β′- and β-phases. Peaks of one SAXD series (00l, l = 1–4, Figure 4b, Table 4) started to appear at 1 °C and were the only peaks present above −25 °C. This series of peaks coincided with the appearance of the peaks of the β′-polymorph and is therefore associated with the chain packing structure of the β′-phase. Similar to the WAXD peaks, they were very weak and broad indicating a small and poorly organized solid phase in a large liquid phase. Furthermore, their intensity which increased with decreasing temperature plateaued also at −9 °C.
After 30 min at −25 °C, the SAXD of JLE-282 presented a series of strong and sharp reflections (00l, l = 1–8, Figure 4b, Table 4) that did not change below −25 °C. This second series is associated with packing structure of the β-phase of JLE-282. Note that, the fundamental repeat unit d001β of the second series, representing the chain packing of the β-phase, was almost double of d001β of the first series, representing the chain packing of the β′-phase (Table 4).
2.3.2. Phase Trajectory of JLE-282 in the Continuous Experiments
Figure 5 shows selected temperature-resolved WAXD patterns obtained during the continuous crystallization (1 K/min) of JLE-282. Relevant structural and indexation data are listed in Table 5.
The phase trajectories of JLE-282 revealed by the continuous experiment were similar to the stepped experiments. The characteristic peaks of the β′-phase (4.28 Å (110)β′, 4.11 Å (1̄10)β′ and 3.70 Å (200)β′) showed starting at −1.3 °C. Similar to the stepped isothermal experiments, they were the only peaks detected at temperatures higher than −25 °C (Figure 5). However, although relatively slowly, they evolved steadily. The reflections of the β-phase started to appear at −25 °C. The peaks of both phases increased dramatically as the temperature was decreased further, reaching a plateau at ∼−30 °C. There was no significant difference between the SAXD obtained in the continuous and the stepped isothermals experiments (See Tables 4 and 5).
3. Analysis and Discussion
3.1. Phase Development of JLE-281 from the Melt
3.1.1. Phase Trajectory of JLE-281 in the Stepped Isothermals Experiment
The crystallization of JLE-281 as revealed in the stepped isothermal experiments is very peculiar. The first crystal peaks were detected only at −11 °C, a slightly higher temperature than TOn (−13 °C). As indicated by the evolution of the intensity of the XRD peaks, the sample crystallized fully during the isothermal crystallization at −13 °C. The crystallization fraction (Xc), estimated from the relative area of the crystal peaks, was ∼2% after 30 min at −11 °C. As indicated by the strength and shape of the XRD peaks, the solid phase at this point was constituted of very small and dispersed crystals. This suggests that growth rate of both phases at this stage of crystallization was very limited, and that nucleation was the dominant mechanism.
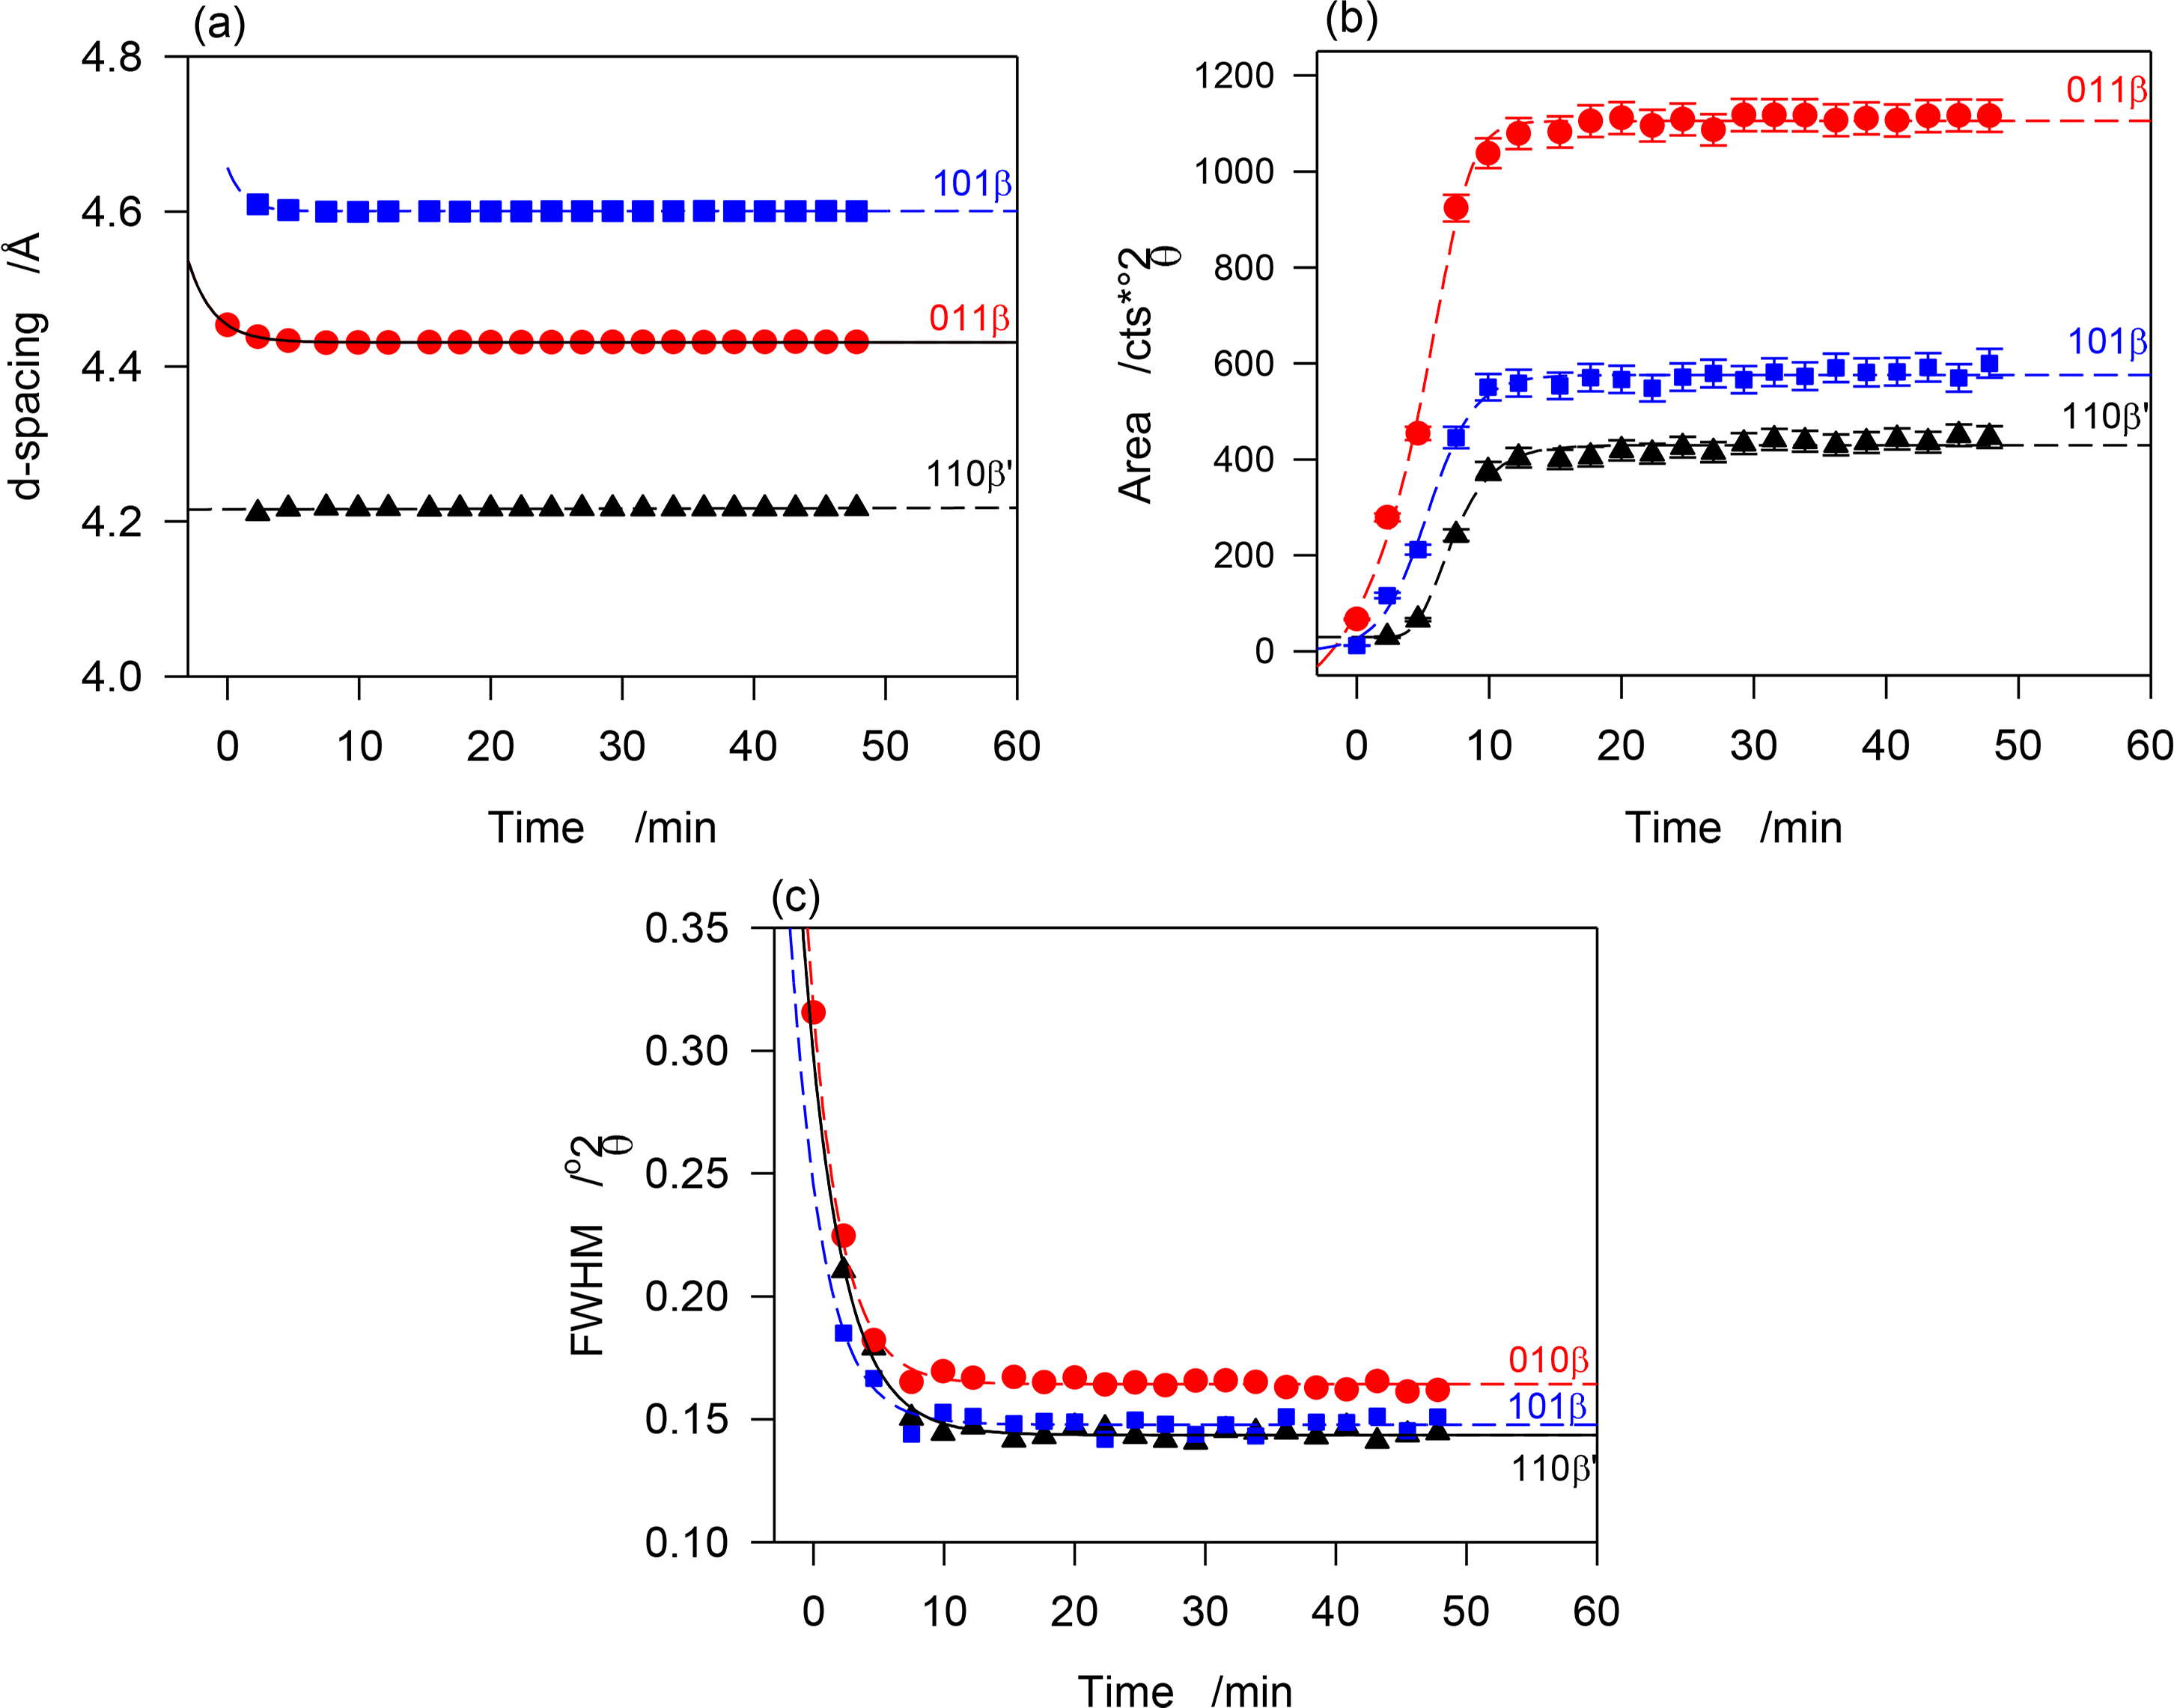
The β′ and β-phases of JLE-281 evolved together at T = −13 °C. The time resolved WAXD during the isothermal crystallization at T = −13 °C (Figure 2c) revealed a concurrent but somehow different growth of the β- and β′-phases. The interplanar spacing of the β-phase (see for example d101β and d011β in Figure 6a) decreased very slightly with time (exponential characteristic decay time ∼ 2 min); whereas, the dimensions of the β′-subcell (see d110β′ in Figure 6a) remained constant. This indicates that while the triclinic subcell of the β-phase reorganized to reach minimum energy, the orthorhombic subcell of the β′-phase retained the dimensions of its crystal nuclei. As can be seen in Figure 6b, representing the intensity versus time curves of characteristic reflections of the two forms, the β- and β′-phases developed concurrently, reaching maximum content practically at the same time, i.e., 12 min at −13 °C. The β′-phase was about a fourth of the total as estimated with intensity ratio of characteristic reflections. The FWHM of the diffraction peaks decreased exponentially with time (Figure 6c, characteristic time ∼3 min), plateauing at half their initial values. This indicates that while steadily growing, the phases increased in homogeneity, and improved in crystal size and perfection. Note that crystal size and lattice perfection continued to increase after the lattice parameters reached equilibrium as indicated by the difference in characteristic times between d-spacing and FWHM.
The intensity vs. time curves of the reflections of both β- and β′-phases presented sigmoidal shapes characteristic of an Avrami-type crystallization (dashed lines in Figure 6b) that show clearly that the growth rate of the β-phase was higher than that of the β′-phase. This was probably combined with a strong nucleation rate of the β-phase. The similar patterns recorded between −13 and −16 °C indicate that the driving force for crystallization was high enough at −13 °C to induce the complete crystallization of JLE-281 in less than 12 min. The SAXD of the JLE-281 is consistent with its WAXD. The evolution of the FWHM of the SAXD reflections revealed the steady increase of coherence length at −13 °C. The sharp and strong SAXD reflections observed at −13 °C and down to −16 °C, are indicative of very well packed molecules in large crystals.
3.1.2. Temperature Induced Pseudo Phase Transition in JLE-281 at T = −17 °C
The sudden disappearance at −17 °C of the (010β), (102β) and (1̄10β) peaks of the triclinic subcell (β-phase) was due to a dramatic change in the crystal structure of JLE-281. This is typical of XRD extinctions resulting from a space reorganization of the electronic density at the level of the families of planes involved in the transformation. Generally, the relative intensities of the XRD peaks are very sensitive to the direction and nature of the interactions in a crystal. The alcohol hydrogen within the unit cell of the JLEs is a structural feature that is particularly important in the interactions map of the crystals. Its position and subsequent electronic density distribution is critical in determining the relative intensities of XRD reflection. The abrupt extinctions indicates that as soon as the temperature was toggled to Ttr, the balance of forces is disrupted, allowing a dramatic redistribution of the electronic density in the triclinic subcell. It is probable that they are caused by a change in the relative positions of the oxygen atoms of adjacent JLE-281. At this tipping point, the van der Waals contributions became the major driving force towards the minimum energy, locking in the new electronic distribution. This is a phase transition with a transformation mechanism very likely similar to the mechanism reported by [21] using simulations on a series of model crystals with hydrogen bonding positions. Of course, the specifics would differ because of different bonds, and the strength of the effect would depend on the environment of the bond, the geometry of the functional groups involved, the structure of the bond’s network, and the crystalline environment. Because the rotations of the molecules around their long axis are the drivers of the transformation occurring at the methylene structure level [12], the transformation at Ttr was probably achieved because of easy rotations about the C–O bond.
The SAXD revealed also an abrupt change in the packing of JLE-281 concomitant with the brusque extinctions observed at Ttr in the WAXD patterns. It manifested by a reduction of the repeat unit length by almost half (66.0 ± 0.1 Å and 35.0 ± 0.1 Å before and after the transition, respectively). This dramatic change can be explained by the adjustment of the oxygen atoms of adjacent JLEs that would trigger the WAXD extinctions. Assuming the accepted reference distance for the C–C single bond of 1.5 Å, two JLE-281 molecules would be involved in the repeat unit when d001 = 66 Å and one JLE-281 molecule when d001 = 35Å. It is reasonable to suggest for the latter, a packing in which the ester head groups closely face each other and the long hydrocarbon chains nestle at the double bond kinks. In this situation, the oxygen atoms will be closest and their electrons will fill up the surrounding space (high density), allowing for the WAXD extinctions to occur. The involvement of two JLE-281 molecules in the repeat unit before the transition suggests a packing in which the boomerang shaped ester head groups face the kinks at the double bond. In this case, the oxygen atoms and their electrons would be relatively well separated allowing for the related WAXD reflections to occur. This dramatic change in the chain length packing is consistent with a “layer-slippage” which would displace the molecules in such a way that the repeat unit involves only one JLE-281 instead of two. It is probable that during the temperature drop from 16 °C to Ttr, that energy was optimized via the formation of planar sheets similar to those observed in polyesters polymers [22,23]. Such a configuration would have fundamentally disturbed the electronic density map, favoring the extinction of select reflections.
As discussed in Section 3.2.1, the different concomitant shift of the (100)β and (101)β reflections is indicative of a directional transformation due to sudden change in the intermolecular interactions, probably in the form of a dramatic weakening along certain crystal planes. The transformation also caused a deterioration of crystal perfection and homogeneity of the β-phase, an increase of lattice strain, and the degradation of long-range order, as indicated by the widening of these peaks. Concomitantly, the long range order of the β′-phase increased dramatically, as evidenced by the dramatic change in the intensity ratio of their characteristic reflections. For example, the ratio between the intensities of the 110β and 100β reflections, i.e., , was ∼4 at Ttr and lower temperatures, and 0.12 above Ttr. This may be due to a rotational disorder of the molecule along the c long axis and its subsequent order, analogous to the phase transition occurring in n-alkanes from a disordered to an ordered orthorhombic form [24]. The change in lattice parameters with temperature in fact occurs to accommodate a better order in the a,b plane and seems to be occurring at the expense of some disorder in the c-axis.
3.1.3. Phase Trajectory of JLE-281 in the Continuous Experiments
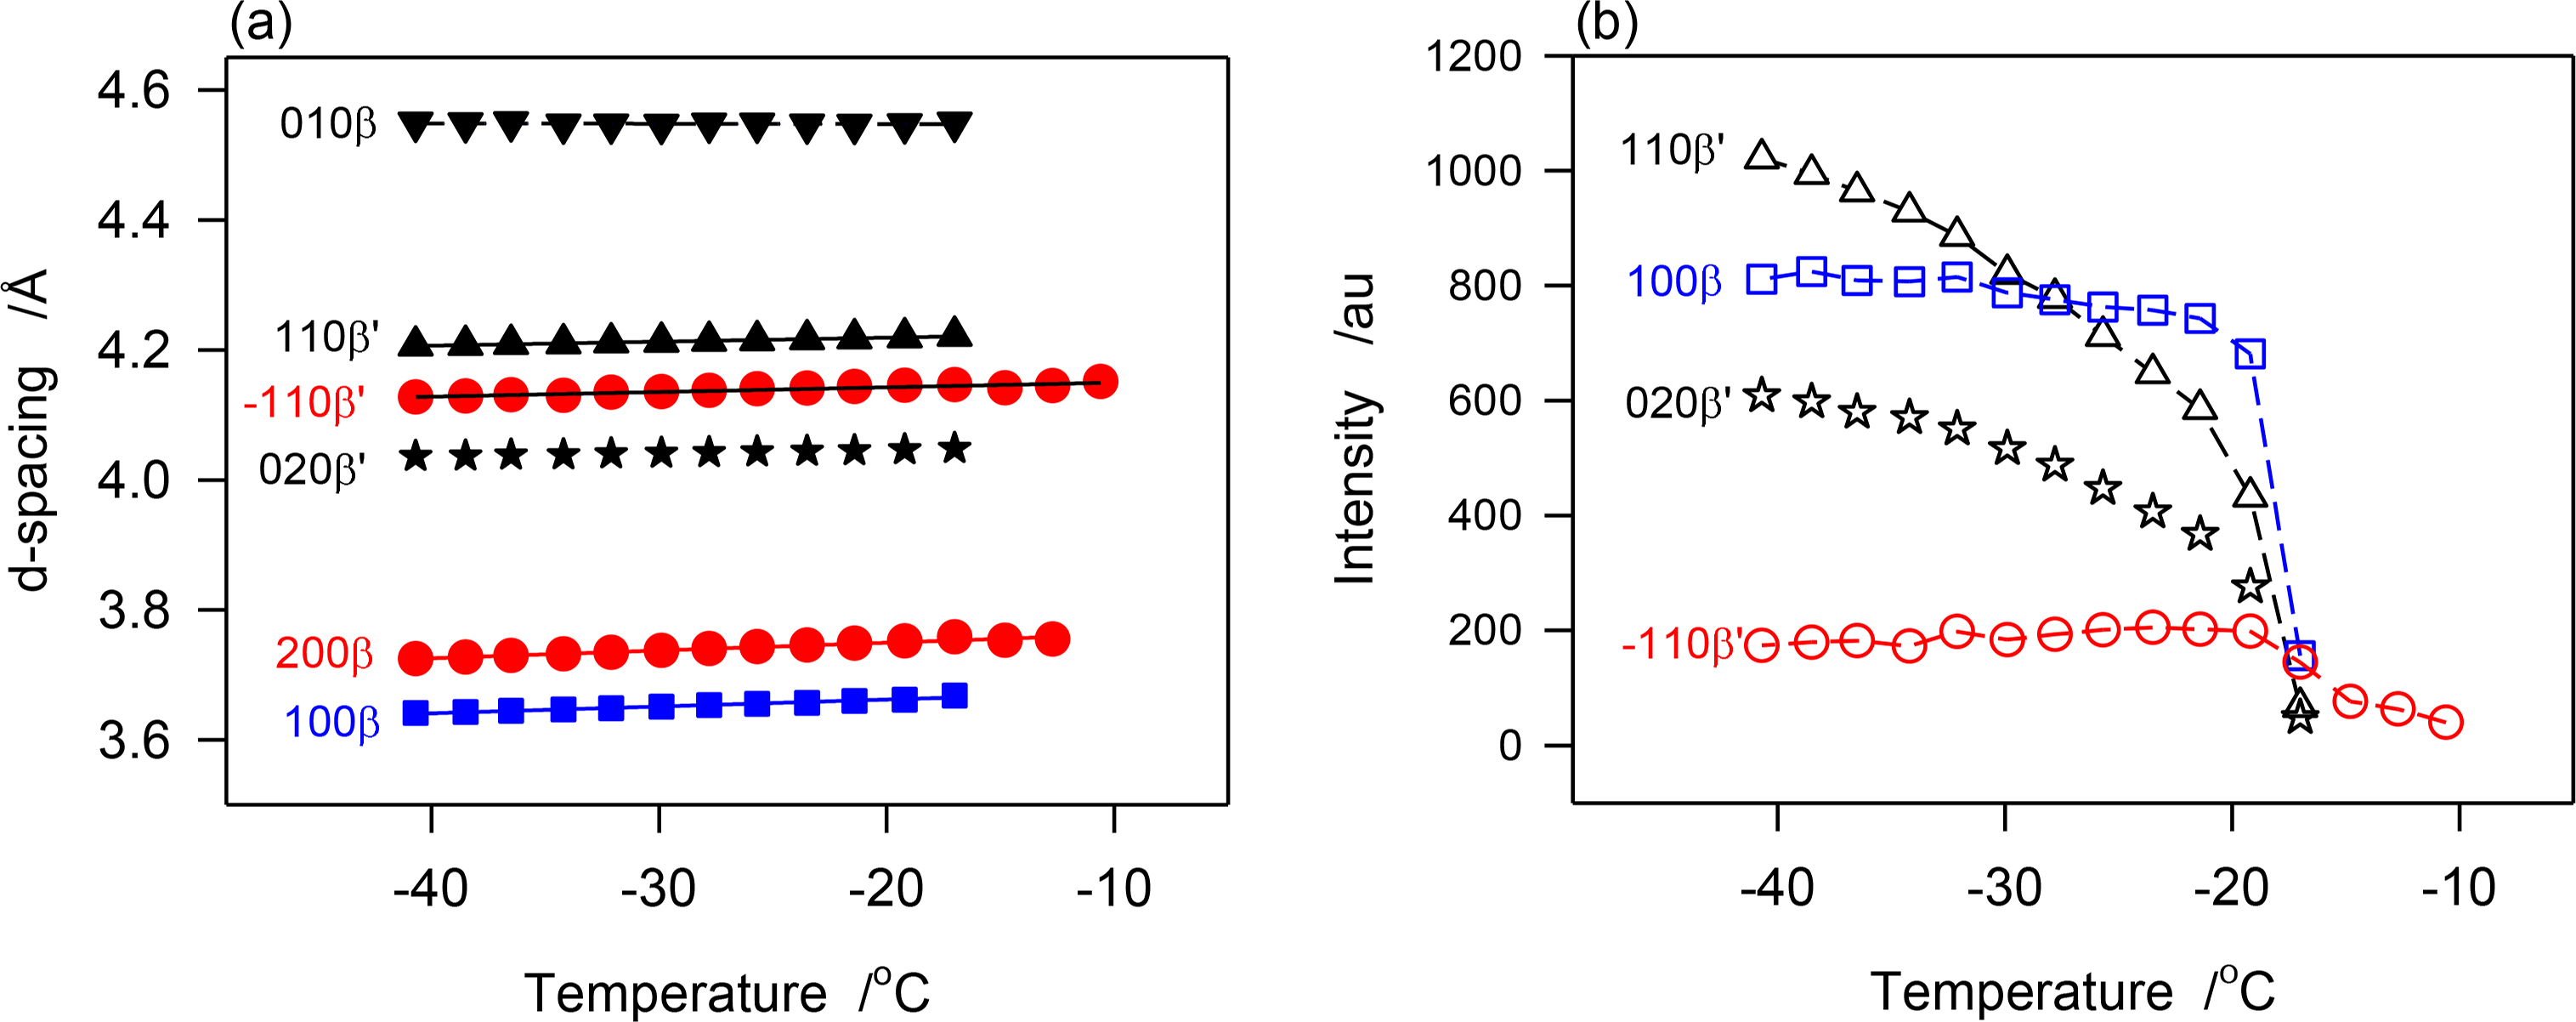
The d-spacing and intensity vs. temperatures curves of characteristic peaks obtained during the continuous cooling of JLE-281 are displayed in Figure 7a,b, respectively. As illustrated with d1̄10β′ shown in Figure 7a, the β′-phase has nucleated from the melt at ∼−11 °C and crystallized via two distinct steps. The phase grew only slightly from ∼−11 °C to −17 °C into small and imperfect crystals then developed very rapidly into well-organized crystals. For example, and during the 6 °C incubation period, the height of the (200)β′ reflection reached less than 2% of its value at complete crystallization. The β-phase appeared at −17 °C and grew very rapidly, concomitantly with the β′-phase. However, as indicated by the variation of the intensity of their respective reflections, such as (200)β′ and (100)β represented in Figure 7, the β-phase reached its maximum almost immediately (−20 °C), whereas, the β′-phase improved more slowly and reached its equilibrium at ∼−35 °C. This indicates that the growth rate of the β-phase was much higher than β′-phase. There was no evidence of any transformation from the β′- to the β-phase during the crystallization process.
The SAXD patterns that appeared above −17 °C (S0 in Table 3) is evidently associated with the packing of the β′-phase that was identified in the WAXD. The two wide and broad peaks of the series (S0 in Table 3) indicate also a loose packing of the JLE-281 molecules in this phase. the intensity of the peaks of the two new doublet series (S1 and S2 in Table 3) that appeared together with S0 at −17 °C, coincided with the nucleation and growth of the β-phase, and are therefore attributable to its packing structure. Furthermore, as evident in Figure 3b, the peaks of S1 and S2 increased so much more rapidly than those of S0, that they overwhelmed its signal right below −17 °C. The chain length packing of the β′-phase remained very close to its initial value (d00l ∼ 75.5 Å); whereas, the molecules of the β-phase adjusted to a tighter, tilted packing (d00l ∼ 72.5 Å) as the sample was cooled further.
Note that contrary to the stepped isothermal crystallization, the growth of the β- and β′-phases was not interrupted with any phase transition.
3.2. Phase Development of JLE-282 from the Melt
3.2.1. Phase Trajectory of JLE-282 in the Stepped Isothermals Experiments
The two steps crystallization observed by DSC in the transformation path of JLE-282 was corroborated and clarified by the XRD. The evolution of the XRD characteristics of the β′-and β-phases of the JLE matched the path described by its first and second DSC exotherms, respectively. Note that the first crystals were detected at 1 °C, a temperature higher than the onset of crystallization, due to sufficient driving force and time. As is evident from the intensity of its WAXD peaks, the β′-phase content increased with the successive isothermals to only ∼8% ± 2% of the material at −9 °C, a temperature at which it did not grow significantly. The same trend was also followed by the accompanying SAXD (00l) reflections (Figure 4b).
The β-phase nucleated and achieved complete crystallization at −25 °C. As indicated by the intensity of its characteristic reflections, and particularly clearly by (010)β (peak at 4.60 Å in Figure 4a), the growth of the β-phase of JLE-282 was complete during the 30-min isothermal crystallization at −25 °C. There was no evidence of any transformation of the orthorhombic (β′-) form to the triclinic (β-) form during any of the thermal processes. The temperature range separating the leading and second exotherm (between the offset of the first DSC exotherm at −9 °C and the onset of the second DSC exotherm at −25 °C) was obviously an incubation region for the nucleation of the β-form. As estimated with the relative intensity of the WAXD crystalline peaks, the β′-phase, was ∼12% ± 2% of the fully crystallized material, indicating that, although very slowly, it continued to grow to some extent alongside the β-phase.
The information gathered for JLE-282 from the SAXD (Figure 4b) matches perfectly the WAXD. The (00l) reflections obtained above −25 °C are obviously associated with the layering structure of the β′-phase, as it was the only one present, and those obtained at −25 °C and below are attributable to the layering structure of the β-phase. Although the β′-phase was still present alongside the β-phase, its SAXD reflections were not fully resolved at −25 °C and below, due to their relative weakness. As apparent in Figure 4b, these were overwhelmed completely by the much stronger reflections of the β-phase. The repeat unit of the β′-phase (d001β′ = 34.44 Å) was almost half that of the β-phase (d001β′ = 63.90 Å) indicating that one JLE-282 molecule was involved in the chain packing of the β-form, and two in the packing of its β-form.
3.2.2. Phase Trajectory of JLE-282 in the Continuous Experiments
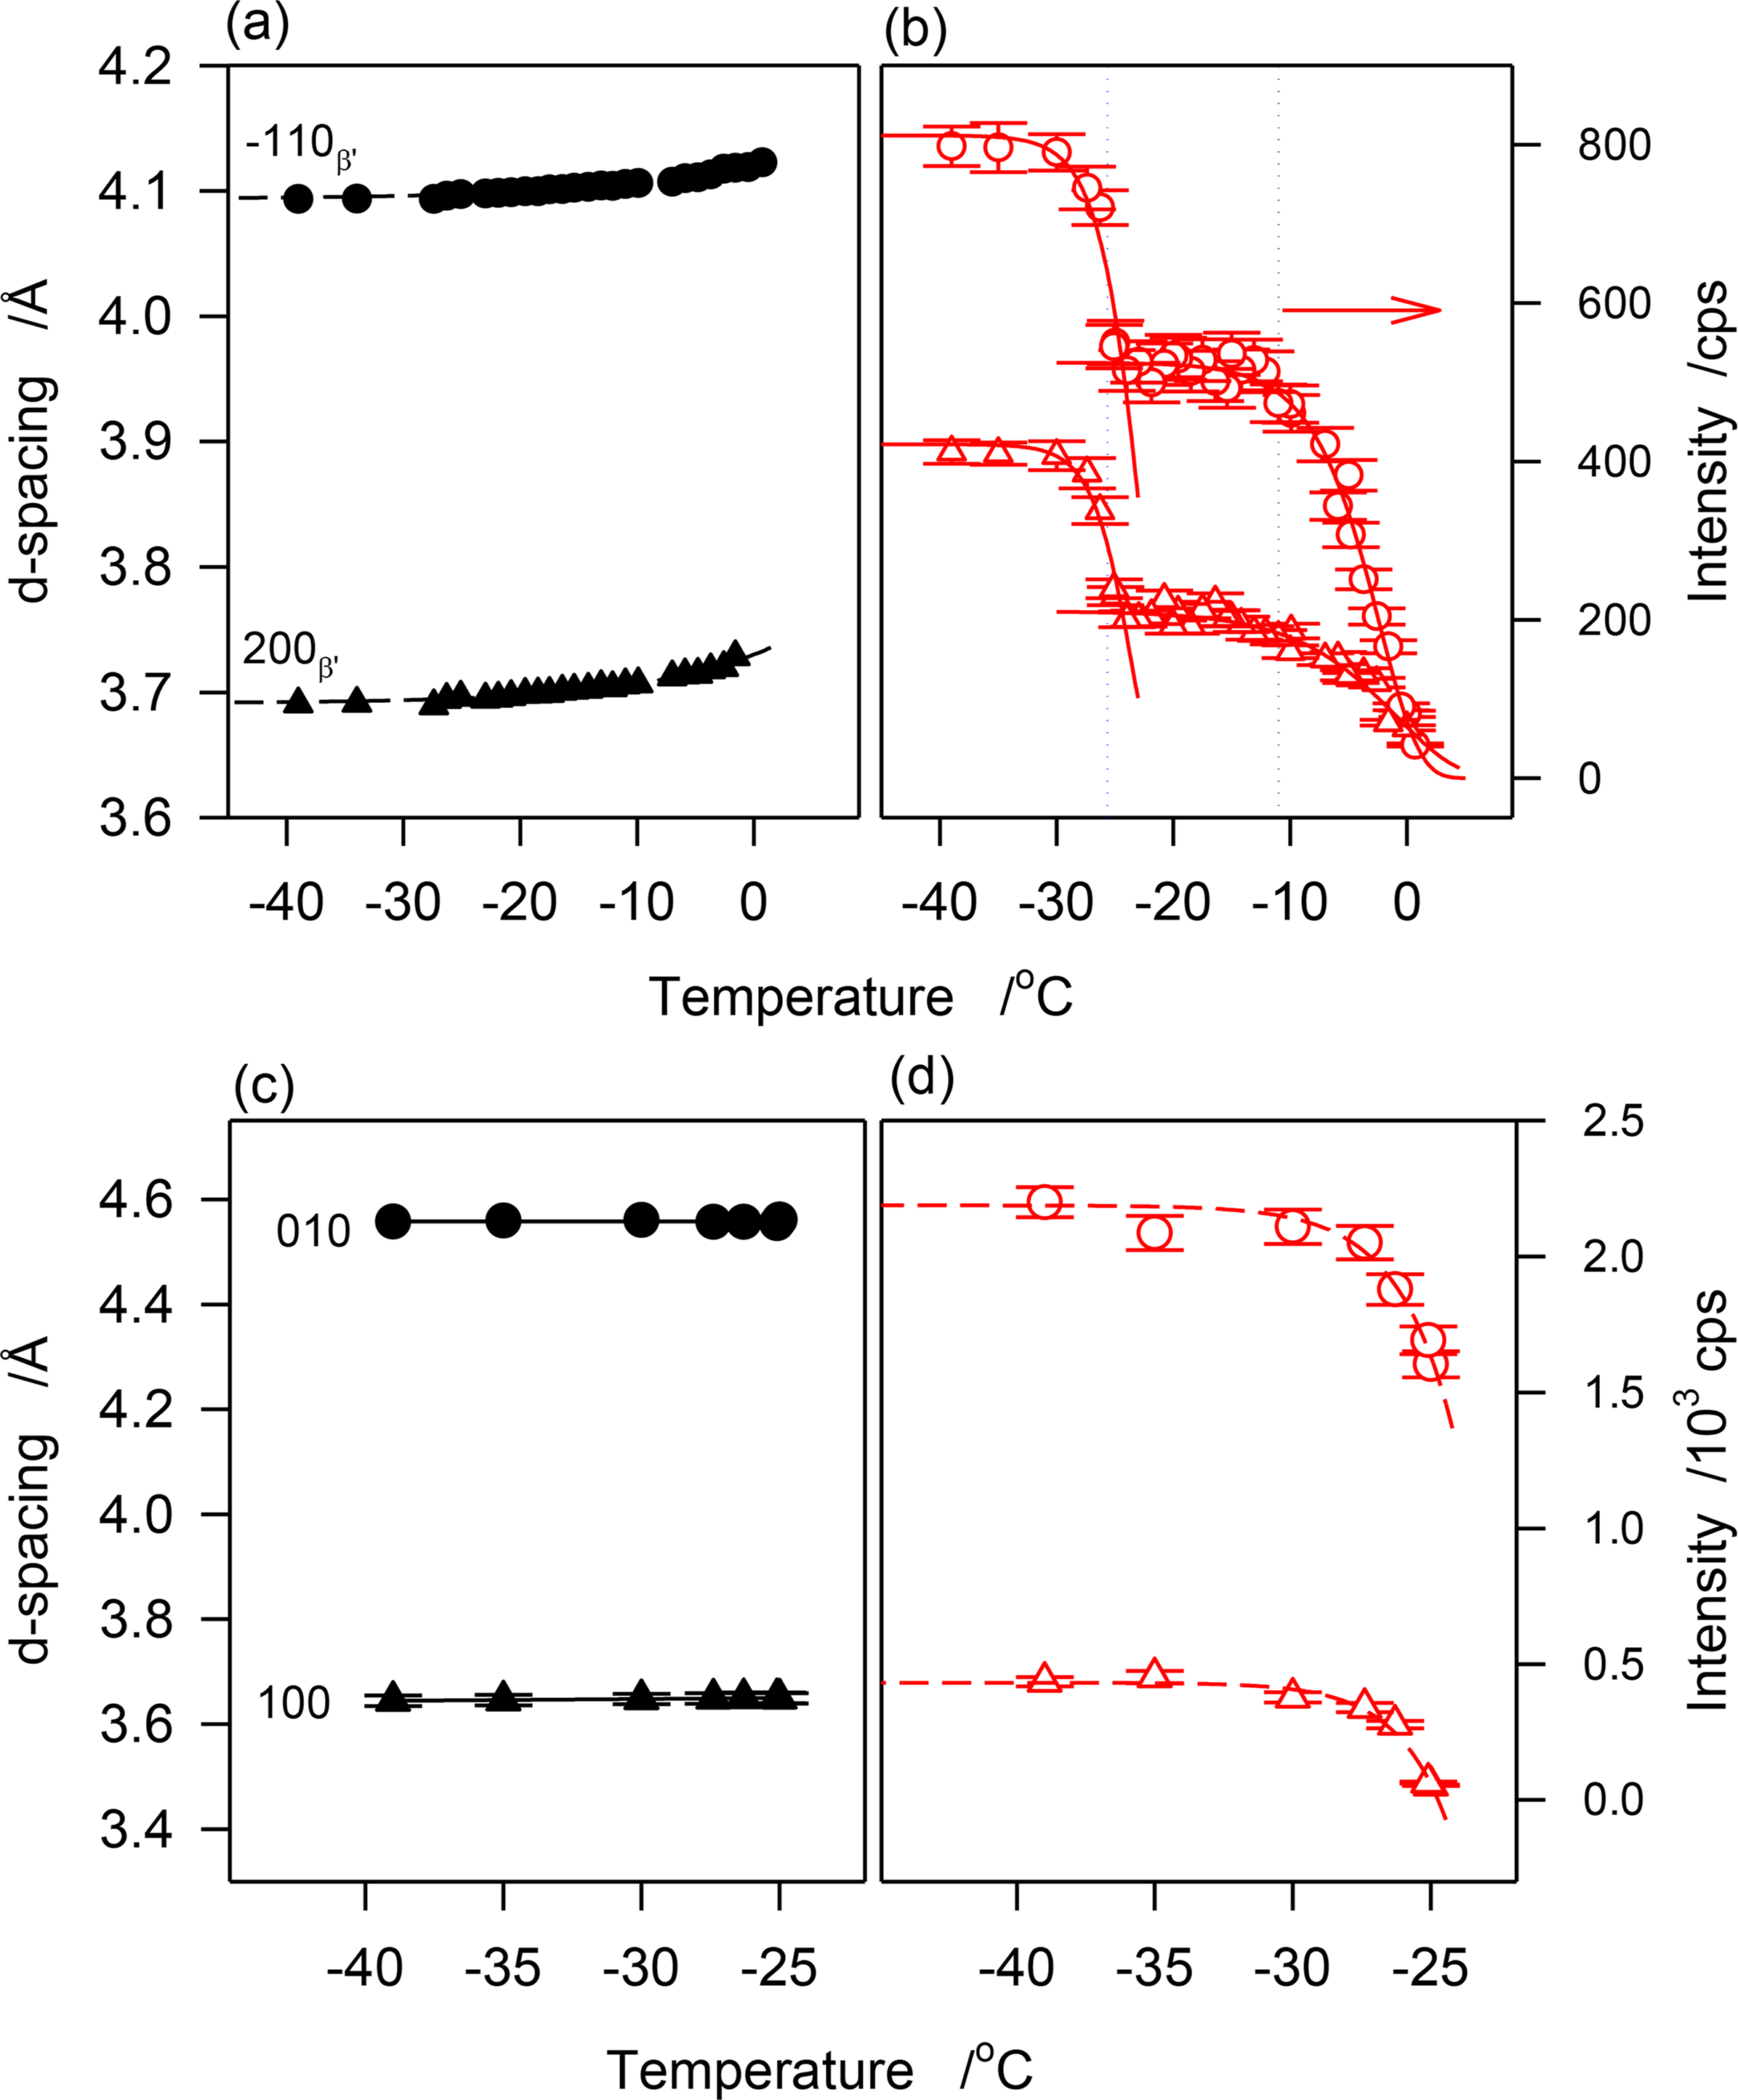
The crystallization behavior of JLE-282 as uncovered by the continuous experiments was similar to the stepped isothermals. The temperature at which the first β′-crystal peaks of JLE-282 appeared corresponded to the onset temperature of the leading DSC exotherm and the temperature at which the reflections of the β-form started to appear corresponded to the onset temperature of the second DSC exotherm. The variation of the d-spacing and intensity of reflections characteristic of the β′-phase ((1̄10)β′ at 4.11 Å and (200)β′ at 4.3.72 Å) are presented in Figure 8a,b, respectively, and those of the β-phase ((010)β at 4.55 Å and (100)β at 3.65 Å) are presented in Figure 8c,d, respectively.
As can be seen in Figure 8a, d(1̄10)β′ and d(200)β′ decreased monotonously with the decrease of temperature indicating a continuous improvement of the β′-lattice. A fit of d(1̄10)β′ and d(200)β′ to exponential decay functions (R2 > 0.9877) yielded characteristic temperatures of −14.5 and −12.6 °C, respectively, and equilibrium values of 4.094 ± 0.001 Å and 3.6891 ± 0.001 Å, respectively. The 0.3 Å gained in the interplanar spacing to reach equilibrium are a relatively small improvement from the initial state given that it was achieved practically at the end of the crystallization process. The FWHM of these reflections followed the same trend, suggesting that subcell dimensions evolved concomitantly with the increase of crystal size.
Interestingly, the intensity vs. temperature curves of the peaks of the β′-phase demonstrated two very well separated sigmoids (Figure 8b) indicating a two-step crystallization process. Furthermore, the temperature limits of the sigmoids matched those of the DSC exotherms. The first sigmoid plateaued at ∼−11 °C, correspondent to the offset temperature of the leading exotherm of JLE-282, and the second sigmoid which started at −25 °C, correspondent to the onset temperature of the second DSC exotherm, plateaued at a temperature very close to its offset temperature. The second sigmoid matched the evolution of the β-phase but there is no reason to infer any contribution from the β-reflections to the peaks of the β′-phase. This segment may be attributed to a different growth mode of the β′-phase following a secondary nucleation that was due to a change in supersaturation in the presence of β-crystals.
The cell dimensions of the β-phase (d(101)β and in Figure 8c) remained constant indicating that it achieved minimum energy during the nucleation process. According to modern theory of nucleation developed in the past decade that describes nucleation as a two-step process where molecules aggregate to form an amorphous cluster in the first step, move slowly to form a crystal lattice, and transform as nuclei in a second step on cooling [25,26], the long incubation period starting from the quasi-completion of the β′-phase crystallization (at ∼−9 °C) was probably used for the formation of amorphous clusters in the supercooled melt, so-called first nucleation step, then, as soon as the thermodynamic conditions were met, the molecules moved to the lattice points and formed a stable nuclei, so-called second nucleation step, probably at ∼−25 °C when the first β-reflections were detected. The WAXD data suggest that the stable polymorphic phase was achieved at this stage of nucleation itself. This may explain the very rapid increase in the intensity of the characteristic reflections of the β-form ((101)β and (010)β in Figure 8d). The fit of the data to exponential rise to maximum functions (dashed lines in Figure 8d) indicate that the β-phase reached its maximum two minutes after it was detected. At this point the sample crystallized fully. Note that during this stage, although with much lower content, the β′-phase reached its maximum value in a similar way. This may indicate that this latter phase grew from the same amorphous clusters that did not reach the required thermodynamic condition to form β-crystals, but that were provided the same driving force to achieve similar rate of growth.
4. Experimental Section
4.1. Materials
The JLEs of this work were prepared from oleic acid, 9-decenic acid and their related alcohols by Steglich esterification [27] with 4-dimethylaminopyridine as the catalyst, or from their related chlorides with their alcohols in the presence of pyridine [6]. Their structures are shown in Table 6.
4.2. Differential Scanning Calorimetry Measurements
DSC analysis was carried out on a Q200 model (TA Instruments, New Castle, DE, USA). The main characteristics of the peaks were obtained using the “TA Universal Analysis” software together with a method developed in our group [28]. The reported values (temperature and enthalpy) and the uncertainty attached are the average and standard deviation, respectively of at least three runs.
4.3. Cryo X-Ray Diffraction
A Panalytical Empyrean X-ray diffractometer (PANalytical B.V., The Netherlands) equipped with a filtered Cu-Kα radiation source (λ = 0.1542 nm) and a PIXcel3D detector used in the 2D mode (255 channels, path radius = 155.0 mm, active 2θ-window = 5.181 degrees). The XRD patterns were recorded at 45 kV and 40 mA. A glass capillary (0.5 mm diameter) was almost fully filled with the liquid JLE and sealed at both ends. The sample was crystallized in the XRD chamber using a 700 Series Cryostream Plus cooling system (Oxford Cryosystems, Oxford, UK). The temperature was controlled to better than ±0.1 °C. The data were processed and analyzed using the Panalytical’s X’Pert HighScore V3.0 software (PANalytical B.V., Almelo, The Netherlands). The XRD reflections were indexed with the help of comparative data mined from the literature.
XRD Data were collected at regular temperature intervals in two types of experiments: (1) stepped isothermal measurements: the melted sample was cooled at 3.0 K/min and measured sequentially every 2 °C isothermally for 30 min; and (2) continuous experiments: the data were collected every ∼2 min while the sample was cooling from the melt at 1.0 K/min. The crystallization rate was chosen to allow the continuous monitoring of all the thermal events observed in the DSC, and collect accurate data in time intervals for which the crystallization process is not compromised. The measurement temperature intervals and data collection times were designed for each JLE based on the DSC cooling trace in order to collect structural data at all characteristic points of the transformation path, particularly considering the full width at half maximum (FWHM), onset, peak and offset temperatures (TOn, Tp and TOff, respectively) of the different exotherms. In both sets of experiments, very good quality data were collected at all targeted temperatures.
5. Conclusions
The crystallization path and polymorphism of jojoba-like ester (JLE) isomers with shortened chain length and terminal double bonds were investigated by temperature-time resolved XRD. The two linear monoesters, octadec-9-enyl dec-9-enoate (JLE-281) and dec-9-enyl oleate (JLE-282), were synthesized from fatty acids and fatty alcohols based on the asymmetrization of the fully symmetrical dec-9-enyl dec-9-enoate (JLE-20).
Not surprisingly, XRD crystal peaks were first observed in both JLEs around the onset temperature of crystallization (TOn), evolved gradually following a path that can be related to the temperature limits of the thermal events observed in the corresponding DSC cooling trace. Indeed, from the melt to complete crystallization, JLE-281 and JLE-282 presented two distinct groups of patterns indicating a two-stage crystallization for both materials. The temperature limits of these stages corresponded to the limits of the two exotherms of their respective DSC cooling thermograms. The first group of patterns was recorded from the onset temperature of crystallization to the onset of the main exotherm, and the second from the onset to the offset temperatures of the second DSC exotherm. Noticeably, the first crystallization stage indicated very little crystal phase. In fact, the crystallization fraction (Xc), as estimated by the relative area of the crystal peaks to the total area in the wide angle region, was less than 8%, a value which roughly compares with the normalized enthalpy of crystallization of the first exotherm. The XRD patterns obtained below the offset temperature of crystallization (TOff) were exactly similar and did not present the halo characteristic of the liquid phase, confirming that crystallization was complete.
In both JLE-281 and JLE-282, the first group of patterns originated exclusively from the β′-phase, whereas, the second originated from β′- and β-phases. During the second stage of crystallization of both JLEs, the contribution from the liquid phase disappeared quickly concomitantly to a rapid increase of the intensity and decrease of the FWHM of the XRD peaks. This indicates a large increase in crystal size and perfection, paralleling the very sharp main DSC exotherms obtained in the same temperature range. One can notice that overall, the rate of growth of the β-phase was much higher than the β′-phase.
Striking differences were observed in the transformation path of JLE-281 and JLE-282. The intensity of the β-phase of JLE-281 achieved its final order at the early stages of the growth process. Whereas, JLE-282 varied continuously and steadily, a sign of a continuous rearrangement of the β-subcell parameters. This is explained by the difficulty of its terminal alkyl chain to rotate due to its position relative to the easy rotation site C–O bond.
Remarkably, a phase transition occurred when JLE-281 was cooled isothermally at −17 °C from an already fully crystallized state at −16 °C. The phase transformation involved directional intermolecular interactions that improved dramatically the β′-phase and deteriorated significantly the homogeneity and crystal order and perfection of the β-phase. The transformation was also characterized with a dramatic change in the chain length packing that is consistent with a “layer-slippage” which would displace the molecules along the chain layer. This transformation did not occur in JLE-282 or when JLE-281 was cooled continuously. The temperature drop (3 K/min) was brusque enough to disturb fundamentally the electronic density map of JLE-281 but not JLE-282, probably because of easier rotation of the alkyl chain.
The phase development of the aliphatic ester molecules is explained by the competition of the interplay between the short-range molecular π–π attractions due to the ester groups, and short-range van der Waals forces. The restriction to participation of the molecules in crystallization is due to structural complexities, particularly the position of the central cis-double bond relative to the C–O bond of the ester group and the rotation hindrances.
Acknowledgments
The financial support of Elevance Renewable Sciences, NSERC, Grain Farmers of Ontario, Greater Peterborough Area Economic Development Corporation (GPA-EDC), Industry Canada, and Trent University is gratefully acknowledged.
Author Contributions
The original idea to synthesize these compounds and study the effect of symmetry on crystal structure and phase transformation was proposed by Suresh Narine. Shaojun Li performed all the synthesis in done in the preparation of the compounds. Laziz Bouzidi performed all of the XRD and other physical measurements and performed all the analysis of XRD, DSC, etc. Laziz Bouzidi prepared the first draft of the manuscript and Narine and Li then contributed to the modification of the manuscript, including explanation of the results.
Conflicts of Interest
The authors declare no conflict of interest.
References
- Patel, S.; Nelson, D.R.; Gibbs, A.G. Chemical and physical analyses of wax ester properties. J. Insect Sci 2001. Available online: http://www.insectscience.org/1.4/ (accessed on 1 August 2014). [Google Scholar]
- Le Dréau, Y.; Dupuy, N.; Gaydou, V.; Joachim, J.; Kister, J. Study of jojoba oil aging by FTIR. Anal. Chim. Acta 2009, 642, 163–170. [Google Scholar]
- Wisniak, J. Potential uses of jojoba oil and meal—A review. Ind. Crops Prod 1994, 3, 43–68. [Google Scholar]
- Bouzidi, L.; Li, S.; di Biase, S.; Rizvi, S.Q.; Dawson, P.; Narine, S.S. Lubricating and waxy esters II: Synthesis, crystallization, and melt behavior of branched monoesters. Ind. Eng. Chem. Res 2012, 51, 14892–14902. [Google Scholar]
- Bouzidi, L.; Li, S.; di Biase, S.; Rizvi, S.Q.; Narine, S.S. Lubricating and waxy esters, 1. Synthesis, crystallization, and melt behavior of linear monoesters. Chem. Phys. Lipids 2012, 165, 38–50. [Google Scholar]
- Bouzidi, L.; Li, S.; di Biase, S.; Rizvi, S.Q.; Narine, S.S. Lubricating and waxy esters. 4. Synthesis, crystallization behavior, melt behavior, and flow behavior of linear monoesters incorporating 9-Decenol and 9-Decenoic acid. Ind. Eng. Chem. Res 2013, 52, 2740–2749. [Google Scholar]
- Raghunanan, L.; Narine, S.S. Influence of structure on chemical and thermal stability of aliphatic diesters. J. Phys. Chem. B 2013, 117, 14754–14762. [Google Scholar]
- Raghunanan, L.; Yue, J.; Narine, S. Synthesis and characterization of novel diol, diacid and di-isocyanate from oleic acid. J. Am. Oil Chem. Soc 2014, 91, 349–356. [Google Scholar]
- Joseph, S.; Sathishkumar, R.; Mahapatra, S.; Desiraju, G.R. Crystal packing and melting temperatures of small oxalate esters: the role of C-H...O hydrogen bonding. Acta Crystallogr. Sect. A 2011, 67, 525–534. [Google Scholar]
- Desiraju, G.R. C–H···O and other weak hydrogen bonds. From crystal engineering to virtual screening. Chem. Commun 2005, 41, 2995–3001. [Google Scholar]
- Seiler, P.; Isaacs, L.; Diederich, F. The X-ray crystal structure and packing of a hexakis-adduct of C60: Temperature dependence of weak C–H···O interactions. Helv. Chim. Acta 1996, 79, 1047–1058. [Google Scholar]
- Larsson, K. Lipids-Molecular Organization, Physical Functions and Technical Applications; Oily Press: Dundee, Scotland, 1994; Volume 5, p. 290. [Google Scholar]
- Larsson, K. Physical properties-structural and physical characteristics. In The Lipid handbook; Gunstone, F.D., Harwood, J.L., Padley, F.B., Eds.; Chapman and Hall: London, UK, 1986; pp. 335–377. [Google Scholar]
- Ghotra, B.S.; Dyal, S.D.; Narine, S.S. Lipid shortenings: A review. Food Res. Int 2002, 35, 1015–1048. [Google Scholar]
- Timms, R.E. The Confectionary Fats Handbook: Properties, Production, and Application. Chapter 2: Physical Chemistry; The Oily Press: Bridgewater, UK, 2003; Volume 14, pp. 9–63. [Google Scholar]
- Fahey, D.A.; Small, D.M.; Kodali, D.R.; Atkinson, D.; Redgrave, T.G. Structure and polymorphism of 1,2-dioleoyl-3-acyl-sn-glycerols-3-layered and 6-layered structures. Biochemistry 1985, 24, 3757–3764. [Google Scholar]
- Dorset, D. The crystal structure of waxes. Acta Crystallogr. Sect. B Struct. Sci 1995, 51, 1021–1028. [Google Scholar]
- Dorset, D.L. From waxes to polymers-crystallography of polydisperse chain assemblies. Struct. Chem 2002, 13, 329–337. [Google Scholar]
- Larsson, K. Qassification of glyceride crystal forms. Acta Chem. Scand 1966, 20, 2255–2260. [Google Scholar]
- Himawan, C.; Starov, V.M.; Stapley, A.G.F. Thermodynamic and kinetic aspects of fat crystallization. Adv. Colloid Interface Sci 2006, 122, 3–33. [Google Scholar]
- Assender, H.E.; Windle, A.H. Crystallinity in poly(vinyl alcohol). 1. An X-ray diffraction study of atactic PVOH. Polymer 1998, 39, 4295–4302. [Google Scholar]
- Suehiro, K.; Chatani, Y.; Tadokoro, H. Structural studies of polyesters. VI. Disordered crystal structure (Form II) of Poly([beta]-propiolactone). Polym. J 1975, 7, 352–358. [Google Scholar]
- Tadokoro, H. Structure and properties of crystalline polymers. Macromol. Chem. Phys 1979, 2, 155–167. [Google Scholar]
- Metivaud, V.; Rajabalee, F.; Mondieig, D.; Haget, Y.; Cuevas-Diarte, M.A. Solid-solid and solid-liquid equilibria in the heneicosane–docosane binary system. Chem. Mater 1998, 11, 117–122. [Google Scholar]
- Kovacs, T.; Christenson, H.K. A two-step mechanism for crystal nucleation without supersaturation. Faraday Discuss 2012, 159, 123–138. [Google Scholar]
- Erdemir, D.; Lee, A.Y.; Myerson, A.S. Nucleation of crystals from solution: classical and two-step models. Acc. Chem. Res 2009, 42, 621–629. [Google Scholar]
- Neises, B.; Steglich, W. Simple method for the esterification of carboxylic acids. Angew. Chem. Int. Ed. Engl 1978, 17, 522–524. [Google Scholar]
- Bouzidi, L.; Boodhoo, M.; Humphrey, K.L.; Narine, S.S. Use of first and second derivatives to accurately determine key parameters of DSC thermographs in lipid crystallization studies. Thermochim. Acta 2005, 439, 94–102. [Google Scholar]


| Rate (K/min) | JLE-281 | JLE-282 | ||||
|---|---|---|---|---|---|---|
| 0.1 | 1.0 | 3.0 | 0.1 | 1.0 | 3.0 | |
| TOn1/°C | −11.3 ± 0.1 | −12.5 ± 0.1 | −13.3 ± 0.1 | −3.65 ± 0.14 | −4.8 ± 0.1 | −5.8 ± 0.1 |
| TP1/°C | −11.7 ± 0.1 | −12.9 ± 0.1 | −14.0 ± 0.2 | −4.2 ± 0.2 | −5.4 ± 0.2 | −6.3 ± 0.1 |
| FWHM1/°C | 0.6 ± 0.1 | 0.9 ± 0.1 | 1.2 ± 0.2 | 0.9 ± 0.1 | 1.2 ± 0.2 | 1.5 ± 0.2 |
| TOn2/°C | −16.0 ± 0.1 | −17.6 ± 0.1 | −18.5 ± 0.2 | −23.8 ± 1.1 | −25.7 ± 1.4 | −25.1 ± 0.1 |
| TP2/°C | −16.4 ± 0.1 | −17.8 ± 0.1 | −17.8 ± 1.3 | −24.3 ± 1.3 | −25.8 ± 1.3 | −25.0 ± 0.1 |
| TOff/°C | −16.7 ± 0.7 | −19.2 ± 0.6 | −20.6 ± 0.1 | −24.6 ± 0.1 | −26.9 ± 0.1 | −27.7 ± 0.6 |
| FWHM2/°C | 0.5 ± 0.1 | 0.6 ± 0.1 | 4.0 ± 0.1 | 0.3 ± 0.1 | 0.7 ± 0.2 | 2.4 ± 0.1 |
| ΔHC/Jg−1 | 145.1 ± 1.7 | 131 ± 2 | 133 ± 5 | 123.2 ± 5.1 | 119 ± 5 | 139 ± 2 |
| ΔH1/Jg−1 | 3.0 ± 0.2 | 3 ± 1 | 8 ± 1 | 8.0 ± 0.6 | 6 ± 1 | 5 ± 1 |
| WAXD | |||||||||||
| T/°C | β′-form | β-form | |||||||||
| dhkl (Å) | d110 | d1̄10 | d020 | d200 | – | d101 | d100 | d011 | d013 | d102 | d1̄00 |
| −11.0 | – | 4.14 | – | 3.74 | – | – | – | – | – | – | – |
| −13 to −16 | 4.20 | 4.14 | 4.06 | 3.74 | 4.69 | 4.65 | 4.60 | 4.43 | 4.32 | 3.95 | 3.66 |
| −17 to −40 | 4.20 | 4.12 | 4.03 | 3.71 | 4.72 | 4.68 | 4.55 | 4.43 | 4.32 | 3.94 | 3.64 |
| SAXD | d00l (Å) | ||||||||||
| T/°C | Series | l = 1 | 2 | 3 | 4 | 5 | 6 | 7 | 8 | 9 | 10 |
| >−17 | S0 | 66.02 | 32.96 | 21.99 | 16.47 | 13.18 | 11.03 | 9.42 | 8.23 | 7.32 | 6.59 |
| ≤−17 | S1 | 35.00 | 17.49 | 11.66 | 8.73 | 6.98 | 6.16 | 4.99 | – | – | – |
| S2 | 34.56 | 17.28 | – | 8.64 | 6.91 | – | 4.93 | – | – | – | |
Note:aStepped isothermal measurements: the melted sample was cooled at 3.0 K/min and measured sequentially every 2 °C isothermally for 30 min.
| WAXD | ||||||||||||
| T/°C | β′-form | β-form | ||||||||||
| dhkl (Å) | d110 | d1̄10 | d020 | d200 | – | d101 | d100 | d011 | d013 | d102 | d1̄00 | |
| −11 to >−17 | – | 4.13 | 3.73 | – | – | – | – | – | – | – | ||
| ≤−17 | 4.21 | 4.13 | 4.03 | 3.73 | 4.71 | 4.68 | 4.56 | 4.42 | 4.33 | 3.94 | 3.65 | |
| SAXD | d00l (Å) | |||||||||||
| T/°C | Series | l = 1 | 2 | 3 | 4 | 5 | 6 | 7 | 8 | 9 | 10 | |
| >−17 | S0 | 75.4 | 37.72 | – | – | – | – | – | – | – | – | |
| ≤−17 | S0 | 75.7 | 37.50 | – | – | – | – | – | – | – | – | |
| S1 | 72.5 | – | 35.40 | 22.24 | 17.58 | – | 11.73 | 8.78 | – | – | ||
| S2 | 67.3 | – | 33.55 | – | 16.61 | – | – | 8.27 | – | – | ||
| WAXD | ||||||||||
|---|---|---|---|---|---|---|---|---|---|---|
| T/°C | β′-form | β-form | ||||||||
| dhkl (Å) | d110 | d020 | d200 | d101 | d010 | d01̄0 | d1̄10 | d100 | – | d110 |
| 1 to −8 | 4.24 | 4.08 | 3.69 | – | – | – | – | – | – | – |
| −9 to −25 | 4.20 | 4.06 | 3.70 | – | – | – | – | – | – | – |
| ≤−25 | 4.20 | 4.06 | 3.70 | 4.59 | 4.55 | 4.17 | 3.86 | 3.64 | 3.56 | 3.48 |
| SAXD | d00l (Å) | |||||||
|---|---|---|---|---|---|---|---|---|
| T/°C | l = 1 | 2 | 3 | 4 | 5 | 6 | 7 | 8 |
| 1 to −8 | 34.44 | 17.19 | – | – | – | – | – | – |
| −9 to −25 | 34.20 | 17.08 | 11.47 | 8.55 | – | – | – | – |
| ≤−25 | 64.21 | 32.19 | 21.30 | 15.99 | 12.81 | 10.67 | 9.18 | 8.01 |
| WAXD | |||||||||
|---|---|---|---|---|---|---|---|---|---|
| T/°C | β′-form | β-form | |||||||
| dhkl (Å) | d110 | d1̄10 | d020 | d200 | d101 | d010 | d110 | d1̄10 | d100 |
| 1 to −24 | – | 4.26 | 4.11 | 3.70 | – | – | – | – | – |
| ≤−25 | 3.48 | 4.20 | 4.06 | 3.70 | 4.60 | 4.56 | 4.41 | 3.87 | 3.65 |
| SAXD | d00l (Å) | |||||||
|---|---|---|---|---|---|---|---|---|
| T/°C | l = 1 | 2 | 3 | 4 | 5 | 6 | 7 | 8 |
| 1 to −24 | 34.44 | 17.19 | − | − | − | − | − | − |
| ≤−25 | 64.21 | 32.19 | 21.30 | 15.99 | 12.81 | 10.67 | 9.18 | 8.01 |
| JLE | Carbon number | Structure and IUPAC name |
|---|---|---|
| JLE-281 | 28 | 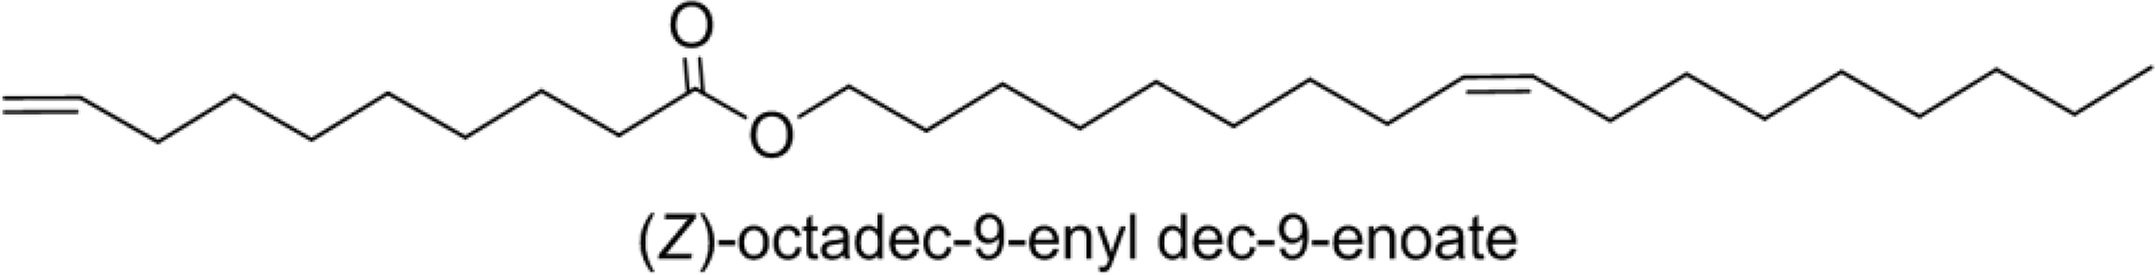 |
| JLE-282 | 28 |  |
© 2014 by the authors; licensee MDPI, Basel, Switzerland This article is an open access article distributed under the terms and conditions of the Creative Commons Attribution license (http://creativecommons.org/licenses/by/3.0/).
Share and Cite
Bouzidi, L.; Li, S.; Narine, S.S. Lubricating and Waxy Esters. VI. Effect of Symmetry about Ester on Crystallization of Linear Monoester Isomers. Symmetry 2014, 6, 655-676. https://doi.org/10.3390/sym6030655
Bouzidi L, Li S, Narine SS. Lubricating and Waxy Esters. VI. Effect of Symmetry about Ester on Crystallization of Linear Monoester Isomers. Symmetry. 2014; 6(3):655-676. https://doi.org/10.3390/sym6030655
Chicago/Turabian StyleBouzidi, Laziz, Shaojun Li, and Suresh S. Narine. 2014. "Lubricating and Waxy Esters. VI. Effect of Symmetry about Ester on Crystallization of Linear Monoester Isomers" Symmetry 6, no. 3: 655-676. https://doi.org/10.3390/sym6030655
APA StyleBouzidi, L., Li, S., & Narine, S. S. (2014). Lubricating and Waxy Esters. VI. Effect of Symmetry about Ester on Crystallization of Linear Monoester Isomers. Symmetry, 6(3), 655-676. https://doi.org/10.3390/sym6030655