Dynamic Processes in Prochiral Solvating Agents (pro-CSAs) Studied by NMR Spectroscopy
Abstract
: Several dynamic processes, including tautomerism and macrocyclic inversion, in 1H-NMR prochiral solvating agents (pro-CSAs) are investigated. Various features of pro-CSA, including modes of interaction for complex formation, stoichiometry, binding strength and temperature effects were compared for three representative pro-CSA molecules. Structural effects of conjugated tetrapyrrole pro-CSA on the mechanism of enantiomeric excess determination are also discussed. Detailed analysis of species (complexes) and dynamic processes occurring in solution and their 1H-NMR spectral manifestations at various temperatures is presented.1. Introduction
Chirality is a universal feature of living systems. Chiral molecules possess a non-superimposable mirror image (analogous with left and right hands) and their properties can strongly depend on the handedness, e.g., menthol, where one form is fragrant, the other pungent. For the same reason, a chiral drug when administered commonly exhibits different clinical effects depending on whether it is “left-” or “right-” handed. Therefore, determination of chiral purity (i.e., enantiomeric excess, ee) at high precision is of importance in, for example, pharmaceutical science.
Various optical methods (e.g., UV/Vis [1,2], circular dichroism [3,4] and fluorescence [5,6]) are available for determination of chirality and enantiopurity (in this case “optical purity”). These methods rely on a special optical source where circularly or linearly polarized light is applied and compared to a reference light beam. In some cases, chiral material (in e.g., UV/Vis methods [1,2]) can be used to form diastereomeric (chemically non-equivalent) species (i.e., complexes with analytes) in solution which respond differently to light. Optical methods are not always the best choice since “optical purity” and true “enantiomeric purity” might differ. For example, optical rotation is not always related linearly to enantiomeric composition [7,8]. This is likely to occur in systems where molecules self-associate by formation of diastereomeric dimers. In order to increase precision and reliability of enantiomeric purity analyses, a great deal of attention has been concentrated on development of NMR methods.
Enantiomeric excess (ee) of analyte is defined in Equation (1)
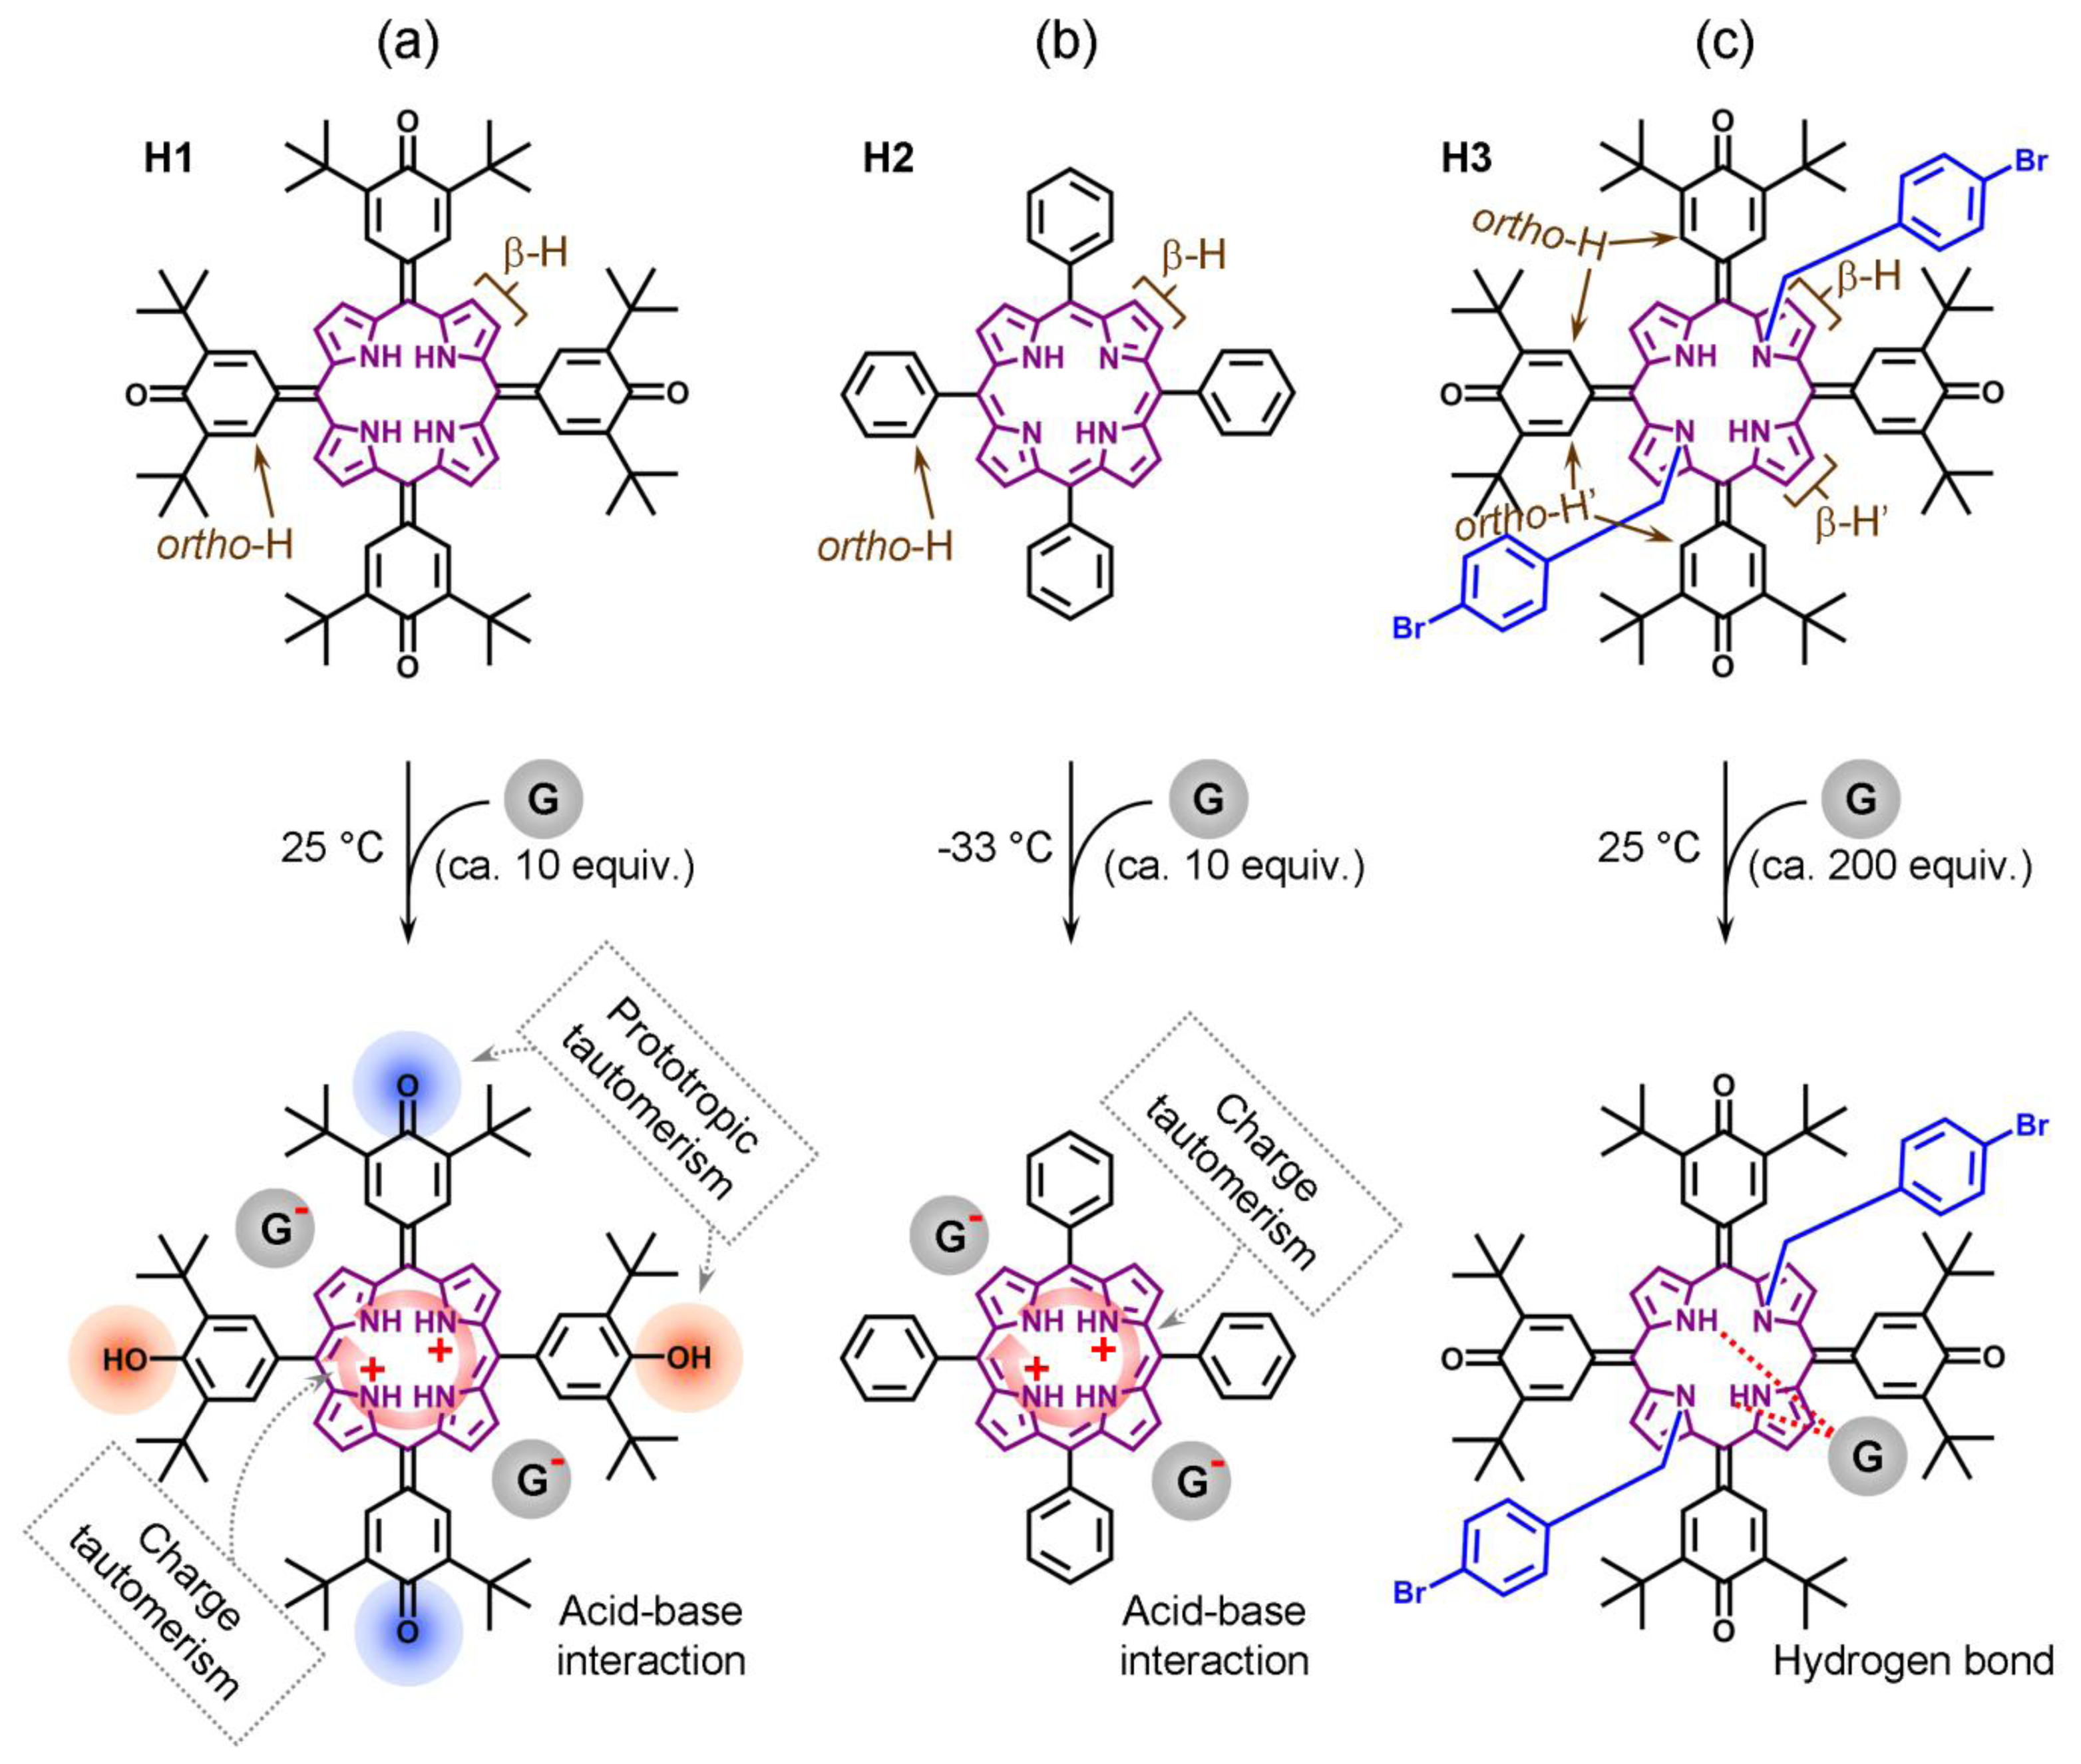
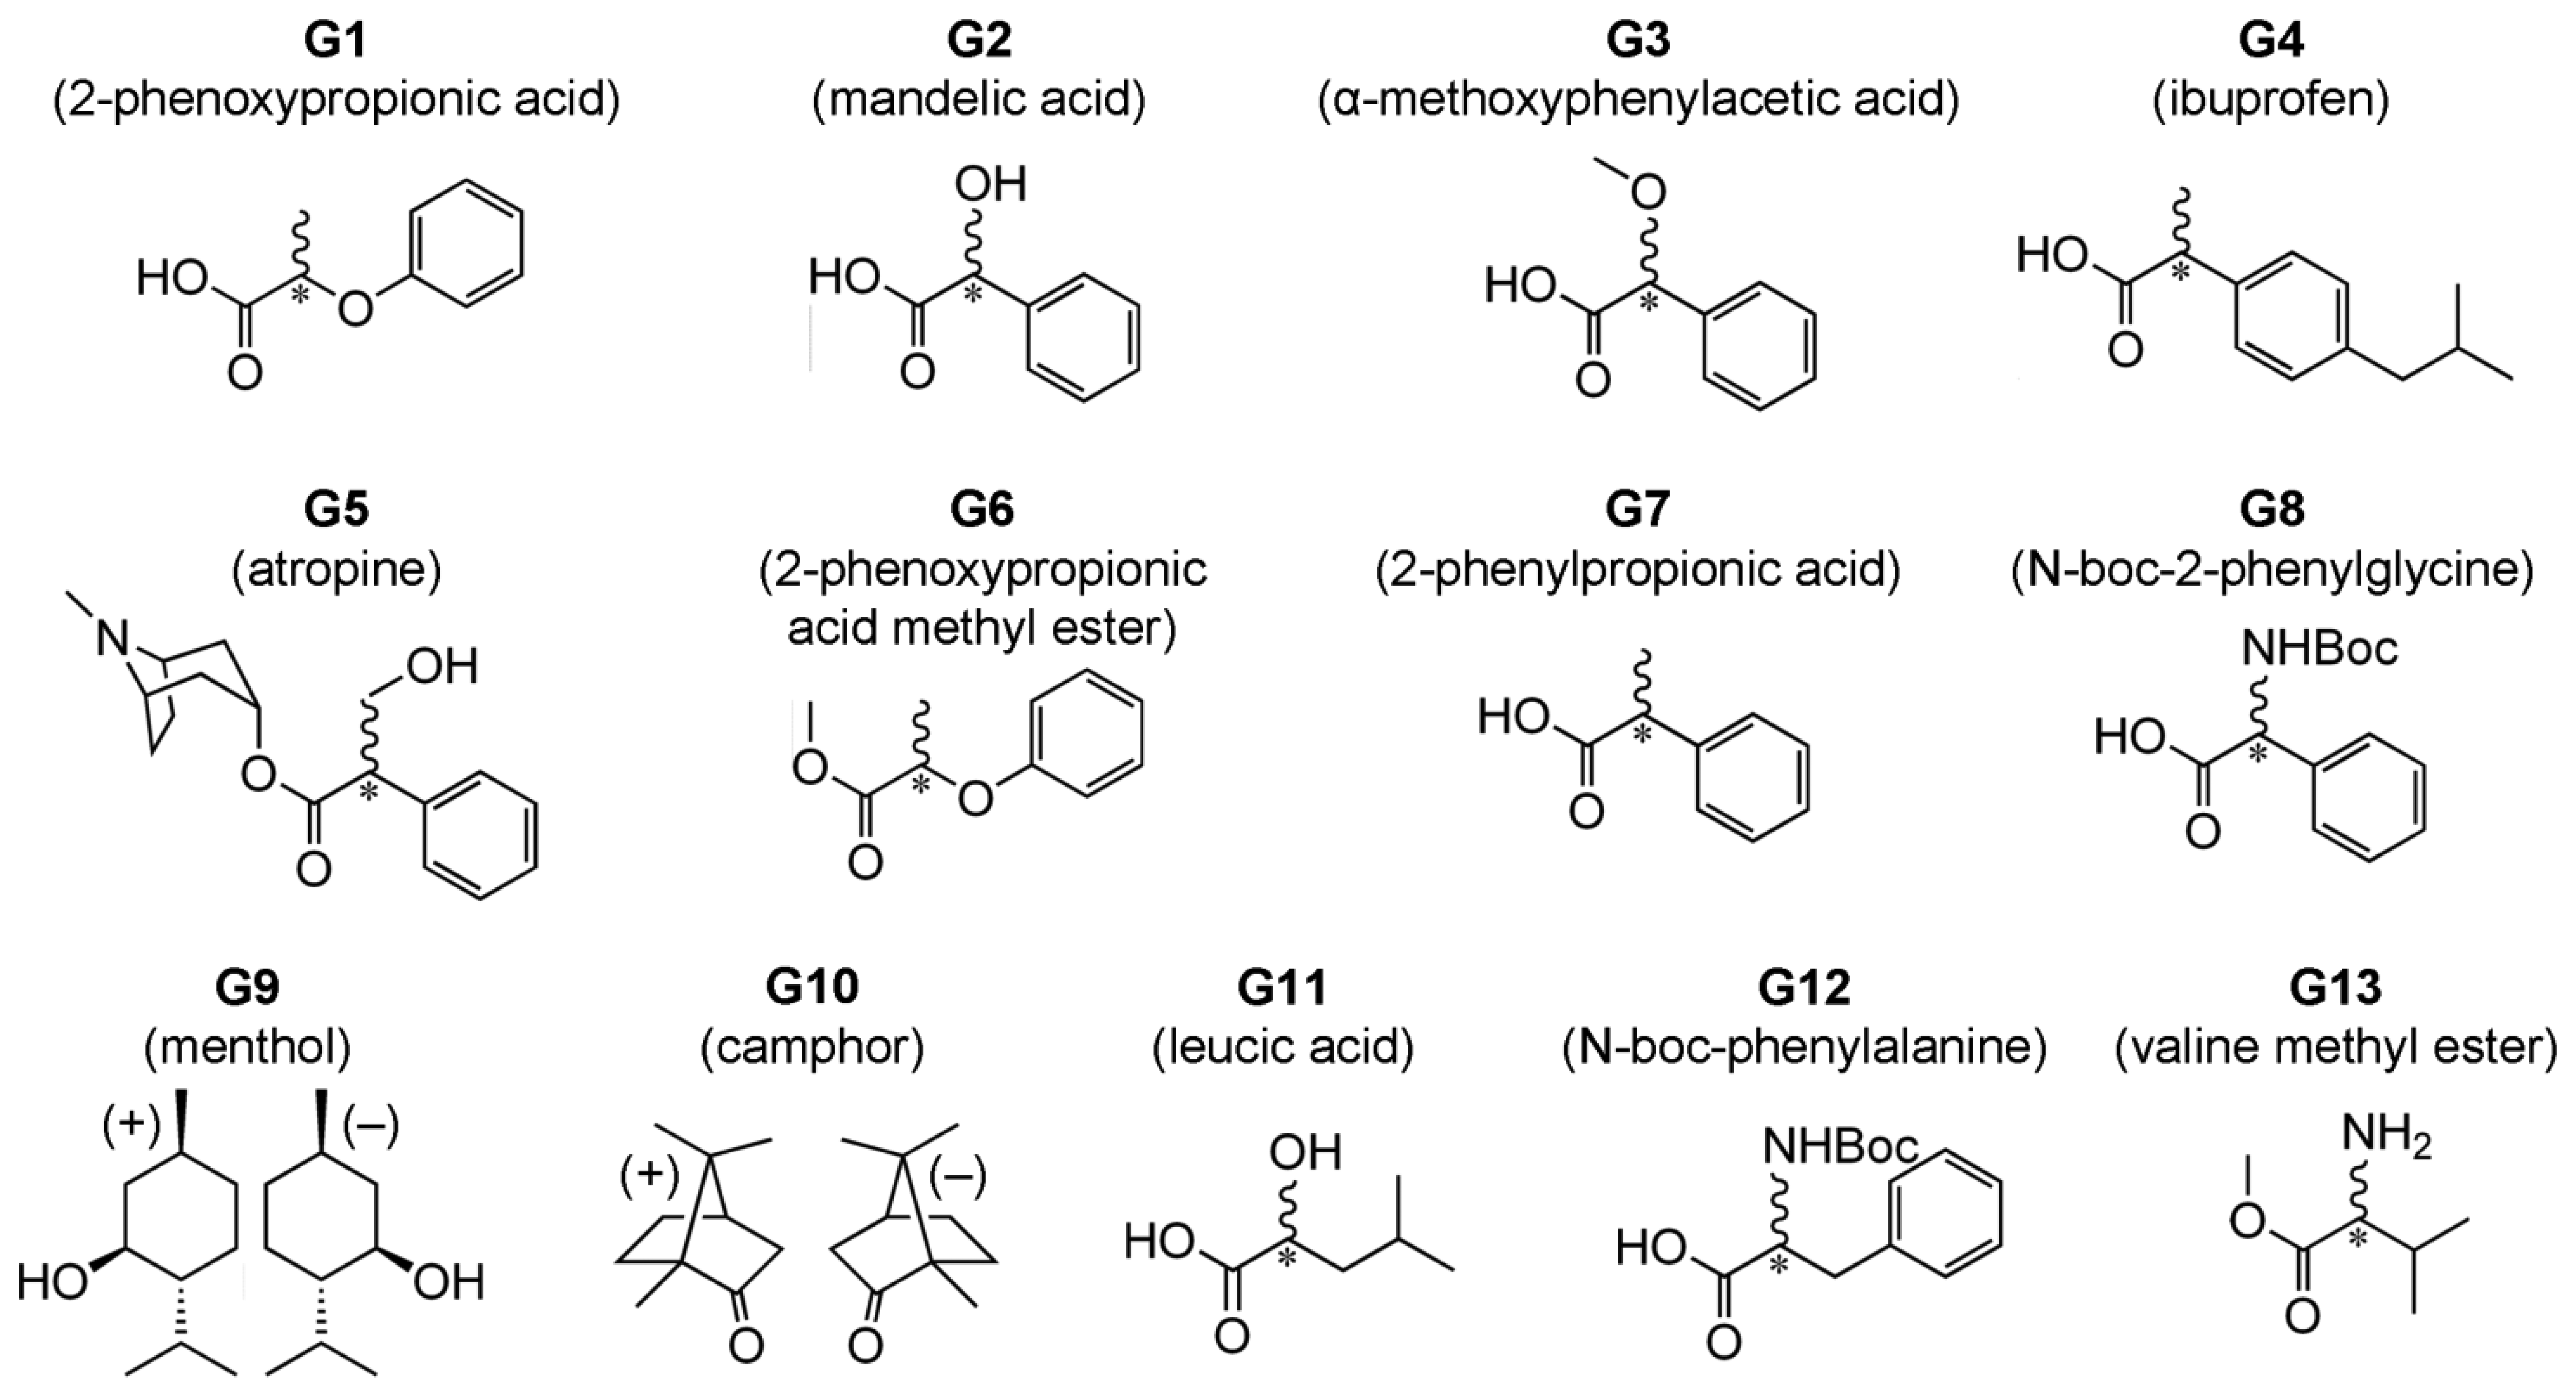
We recently introduced a method for detection of ee which does not rely on formation of diastereomeric complexes in solution. This involves various symmetrical (achiral) conjugated tetrapyrrole molecules H1, H2 and H3 (Figure 1—upper structures) [13–15] as detectors of ee for a wide range of chiral analyte molecules, including carboxylic acids and their esters, N-protected amino acids and terpenoids (Figure 2). These ee detectors (hosts) form non-covalent host–guest complexes with chiral analytes (guests) (Figure 1—lower structures) and can be referred to as prochiral solvating agents (pro-CSA) since the binding mode is similar to classical CSAs but the host molecule is prochiral (meaning that upon interaction with chiral analyte the originally achiral host becomes chiral). The chiral information (ee) is translated from guest to host and induces chemical shift non-equivalency (anisochrony) in some of the host’s reporting groups (often pyrrolic β-protons, Figure 1).
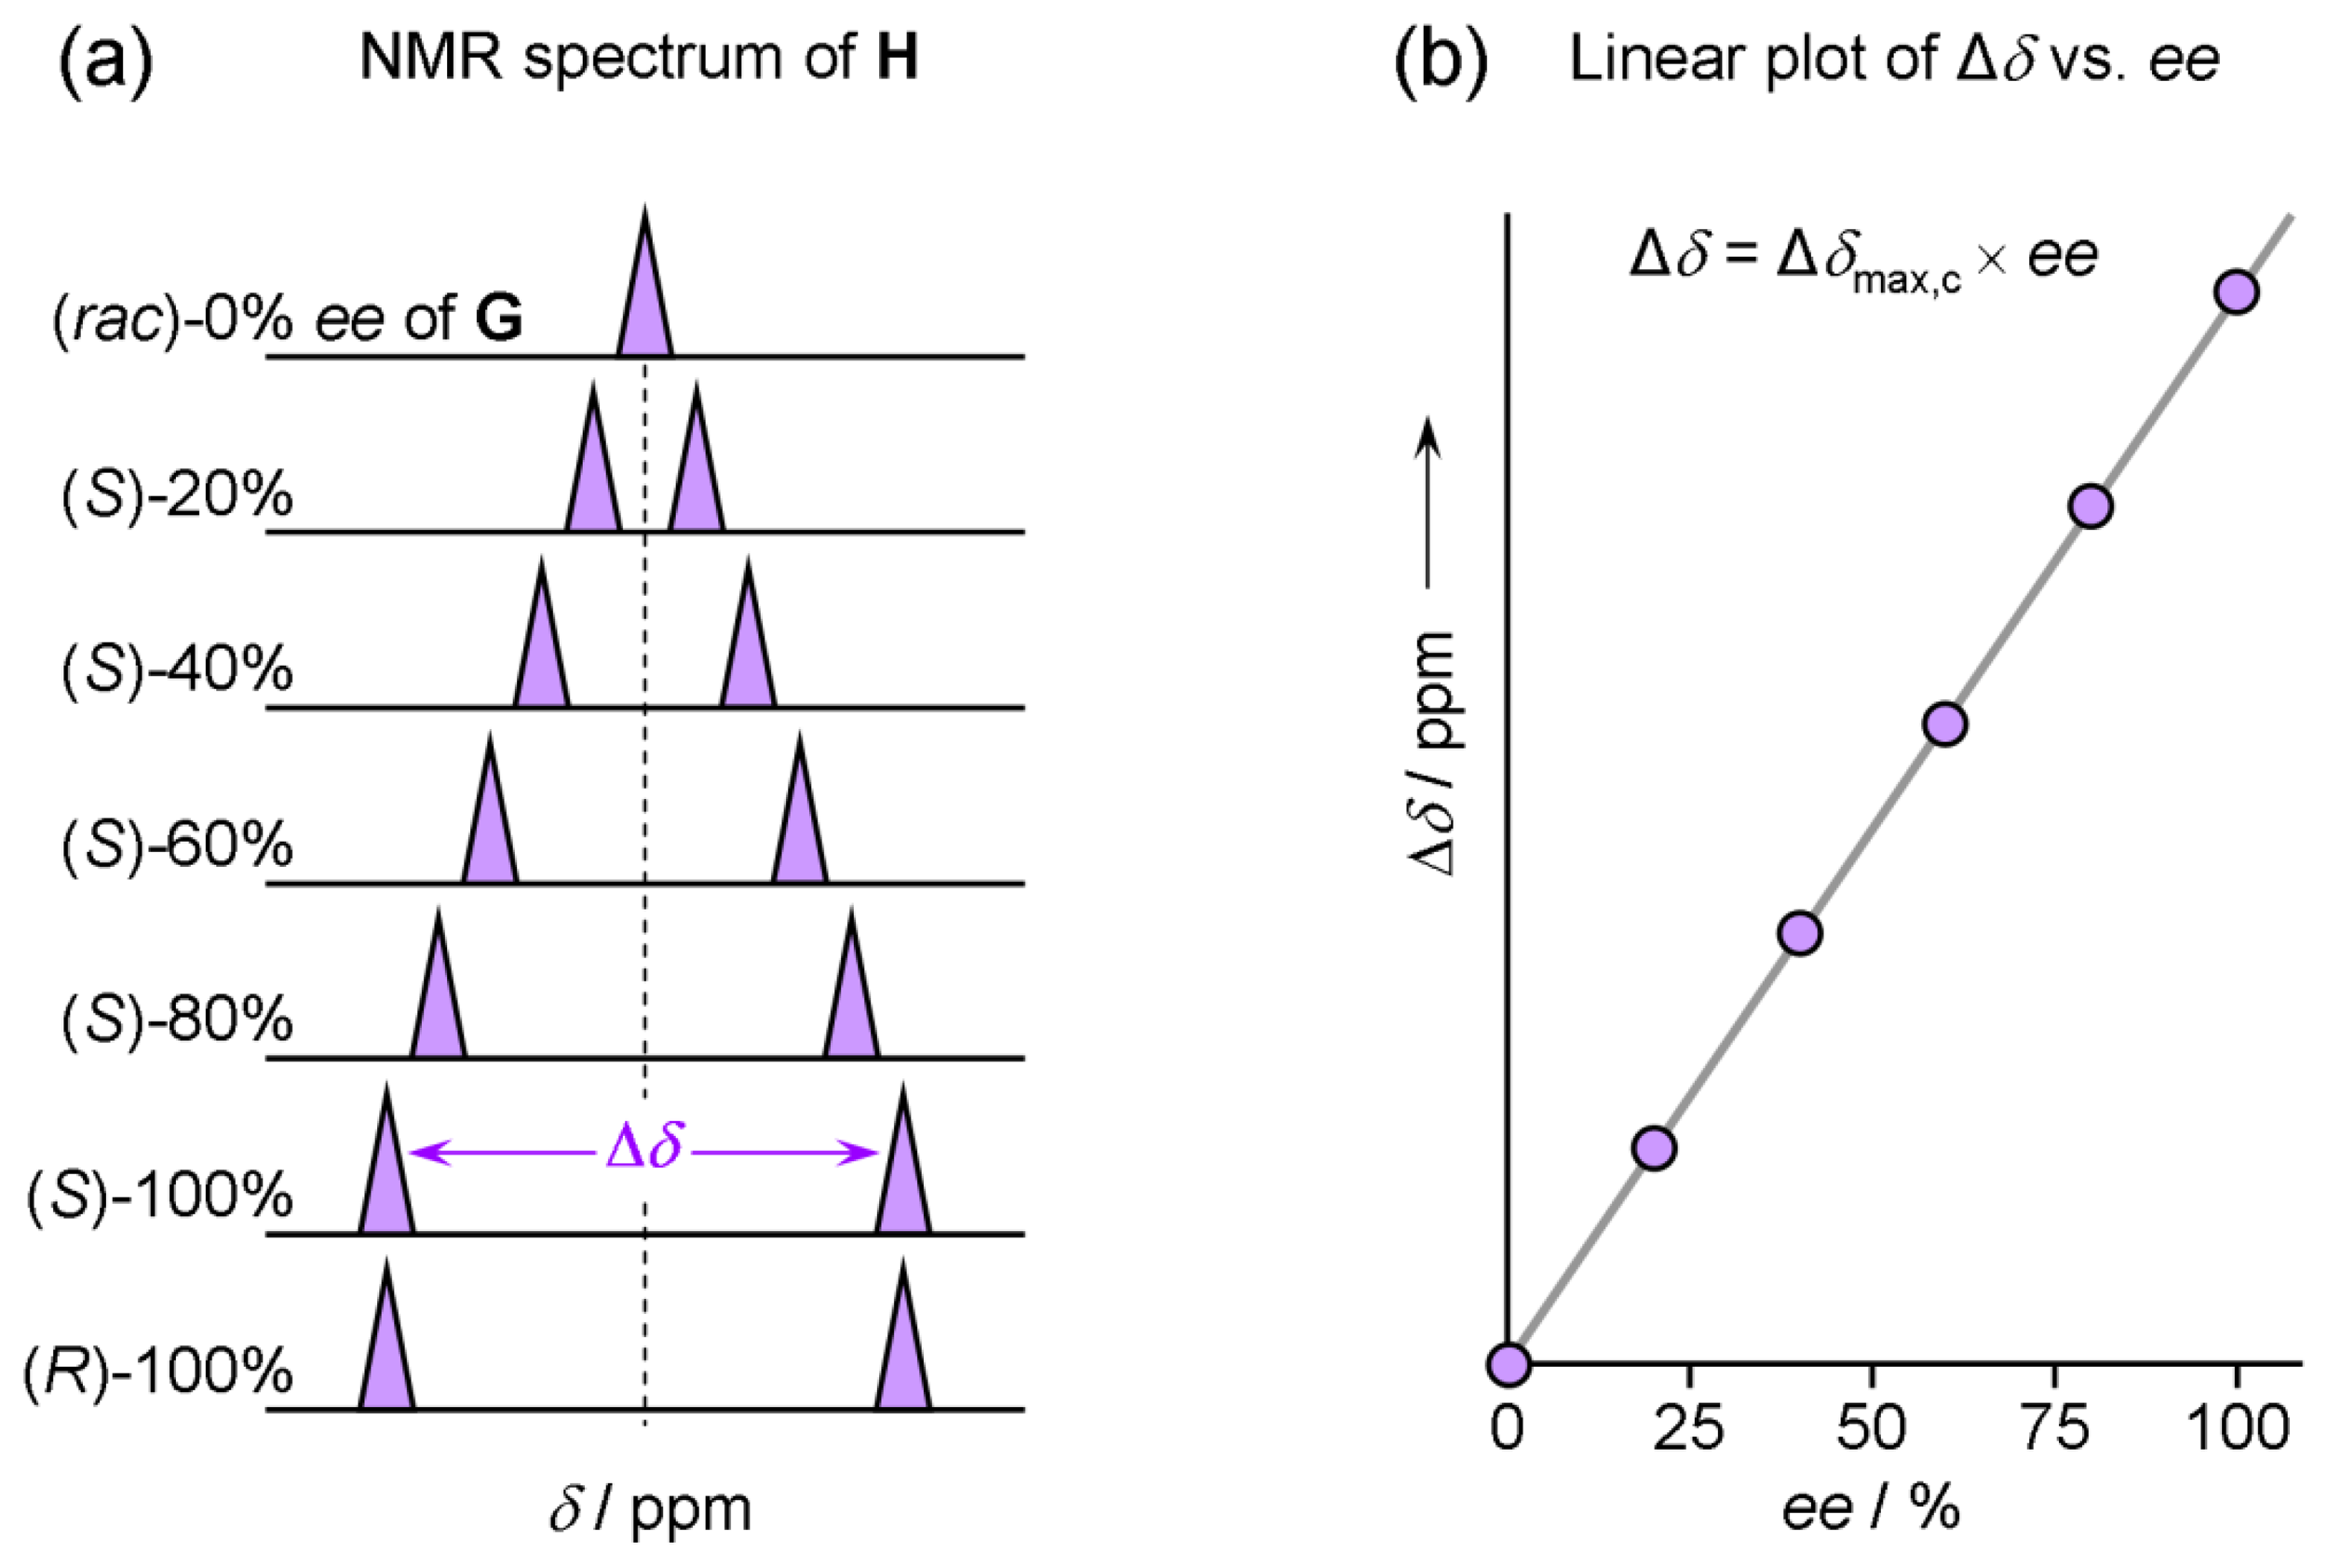
Split NMR resonances of the ee reporting groups always have the same integrations but their magnitude of chemical shift non-equivalency Δδ varies depending on ee as illustrated in Figure 3a and for some particular host–guest pairs in Figure 4. The chemical shift non-equivalency Δδ is always linearly dependent on ee (Figure 3b). In order to estimate ee of some sample a calibration curve is required to be constructed in the form of Equation (2).
Recent studies of pro-CSAs [13–15] have been aimed at proving that diastereomers are not formed and are not necessary for operation of pro-CSAs. However, other processes of a dynamic nature that are involved in those systems were not resolved. Those processes affect significantly the ee sensing properties. Thus, further understanding of the limitations of the pro-CSA sensing mechanism is desirable. In the present study, we have compared and reconsidered the previously obtained results from the point-of-view of dynamical processes. These are dependent on the type of interaction involved in complex formation, the stoichiometry, binding strength and temperature. At the early stages of our research on pro-CSA [13,14] the identification and description of the dynamical processes was not possible since the problem was too complex. Very recently, a detailed study of the macrocycle dynamics of H1 with chiral acids [20] has provided a means for interpreting previous observations.
2. Results and Discussion
From previous work on pro-CSA [13–15] two types of interaction (Type I and II, see below) can be recognized which dominate complex formation, including charge-transfer (acid-base) interactions or hydrogen bonding. They have significant influence on the performance of the system in terms of stoichiometry and type and quantity of chiral guest that can be detected.
2.1. Charge-Transfer (Acid-Base) Interactions—Type I Binding Mode
Type I systems which involve acid-base interactions are represented by H1 and H2 hosts (Figure 1a,b). Upon addition of relatively strong (pKa < 3.4) chiral acid they become diprotonated and form 1:2 host–guest complexes. Weak acids (or non-acidic guests) are not capable of host protonation. Complex formation is accompanied by significant UV/Vis spectral changes and, for example, upon addition of G2 a chloroform solution of H1 (at 25 °C) [13] changes color from purple to red. Host H2 reacts to the presence of chiral guest G1 (at −33 °C, in CDCl3) [14] by changing color from purple to green. 1H-NMR resonances of reporting groups of Type I systems (Figure 4a,b) are relatively broad (compared to Type II systems, see Figure 4c). Diprotonation of the host molecule is slow on the NMR timescale so that during titration a new set of resonances emerges while the original free host resonances diminish (Figure 5a). However, the exchange of chiral guest acid at the host’s binding site is fast (acid molecules exchange proton H+ while host remains diprotonated). The latter is true at an optimal temperature which is different for each host. For H1 and H2 this temperature is respectively 25 °C and −33 °C (Figure 4a,b). It should also be noted that during titration (Figure 5a) the emerging resonances corresponding to the diprotonated form of host have an almost constant value of their maximum chemical shift non-equivalency (Δδax) from an early stage of titration. In other words the characteristic value of Δδmax (obtained from extrapolation to infinite analyte concentration) is almost identical to Δδmax,c. That is, since Δδmax ≈ Δδmax,c, a relatively small quantity of analyte can be used to determine its ee. It is important to achieve complete diprotonation of all host molecules. The fraction of mono- and diprotonated host f (as determined from integration of spectra during titration) is shown in Figure 5b. It can be seen that this is attained when 10 molar equivalents (equiv.) of guest is present.
2.2. Interaction through Hydrogen Bonding—Type II Binding Mode
Another type of system represented by the host molecule H3, forms hydrogen bonds with analyte molecules (Figure 1c). H3 forms a 1:1 host–guest complex with a chiral guest analyte and is coupled by dipolar interaction (hydrogen bond). There is almost no change in the UV/Vis spectrum upon complexation even when a large quantity of analyte is added [15] and the binding mode is relatively weak compared to Type I systems. Type II binding mode leads to sharp well-resolved resonances in 1H-NMR spectra (Figure 4c). There is fast exchange between guests at the host’s binding site, which is maintained at any temperature. Reporting group resonances in the 1H-NMR spectrum of H3 during titration with analyte exhibit gradual shifts and increasing chemical shift non-equivalency (Δδ) dependent on analyte concentration (Figure 5c). Moreover, the value of Δδmax varies strongly with analyte concentration (Figure 5b) so that the value of Δδmax should be obtained from fitting the 1:1 binding model to the experimental data for each guest. It can be seen that a relatively large quantity of analyte (ca. 200 equivalents) is required to obtain reasonable splitting for ee determination. Despite this, 200 equivalents often represents a modest amount (ca. 20 mg) of analyte. Therefore, in practical use the analyte’s concentration must be kept constant and a calibration curve (Figure 3b) should be constructed (i.e., the value Δδmax,c) at a convenient concentration for each chiral guest. Additionally, concentration of water (which might be contained as an impurity) in chloroform solutions should be maintained constant. Since host molecule binding involves hydrogen bonding, it can also interact with water in addition to the chiral guest in 1:1 stoichiometry in a competitive binding mode [15]. The binding mechanism can also be described by a weak binding approximation which is applicable here and which is shown in Appendix 1.
Type II systems are more versatile in terms of type of chiral guests available for ee detection. It is not restricted to strong acids and can be also applied to the analysis of esters of carboxylic acids, N-protected amino acids and terpenoids (G1 and G4–G13, Figure 2).
2.3. Quantitative Analysis of 1H-NMR Properties of Type I and Type II Binding Modes
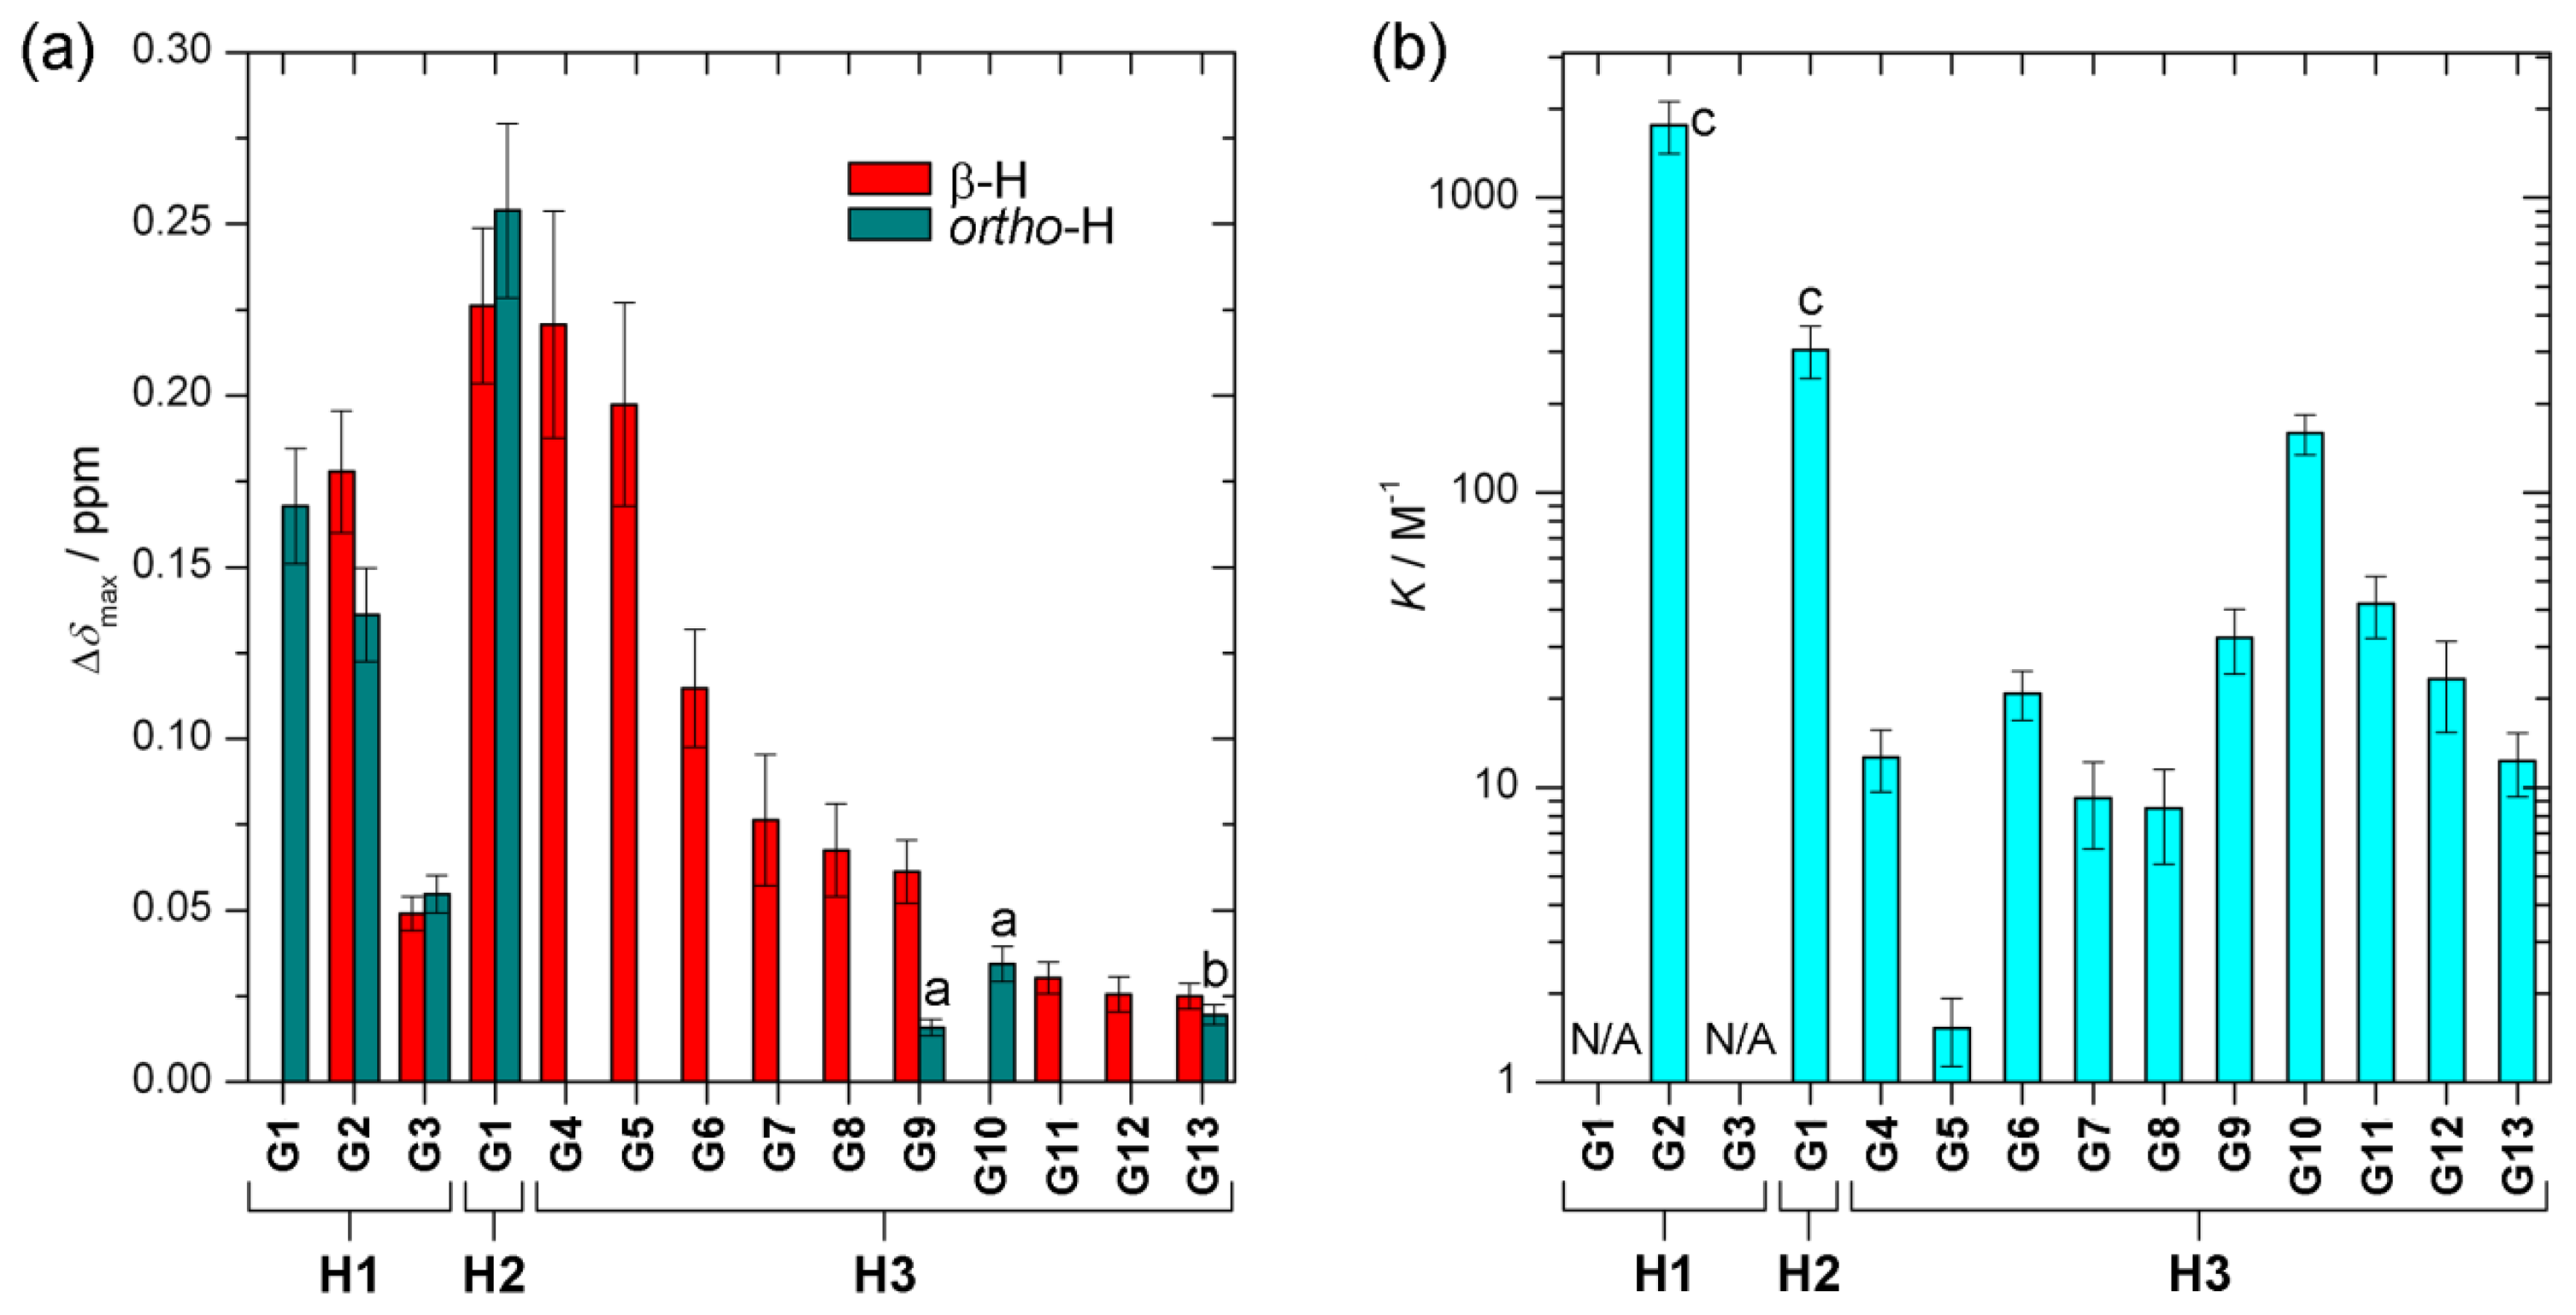
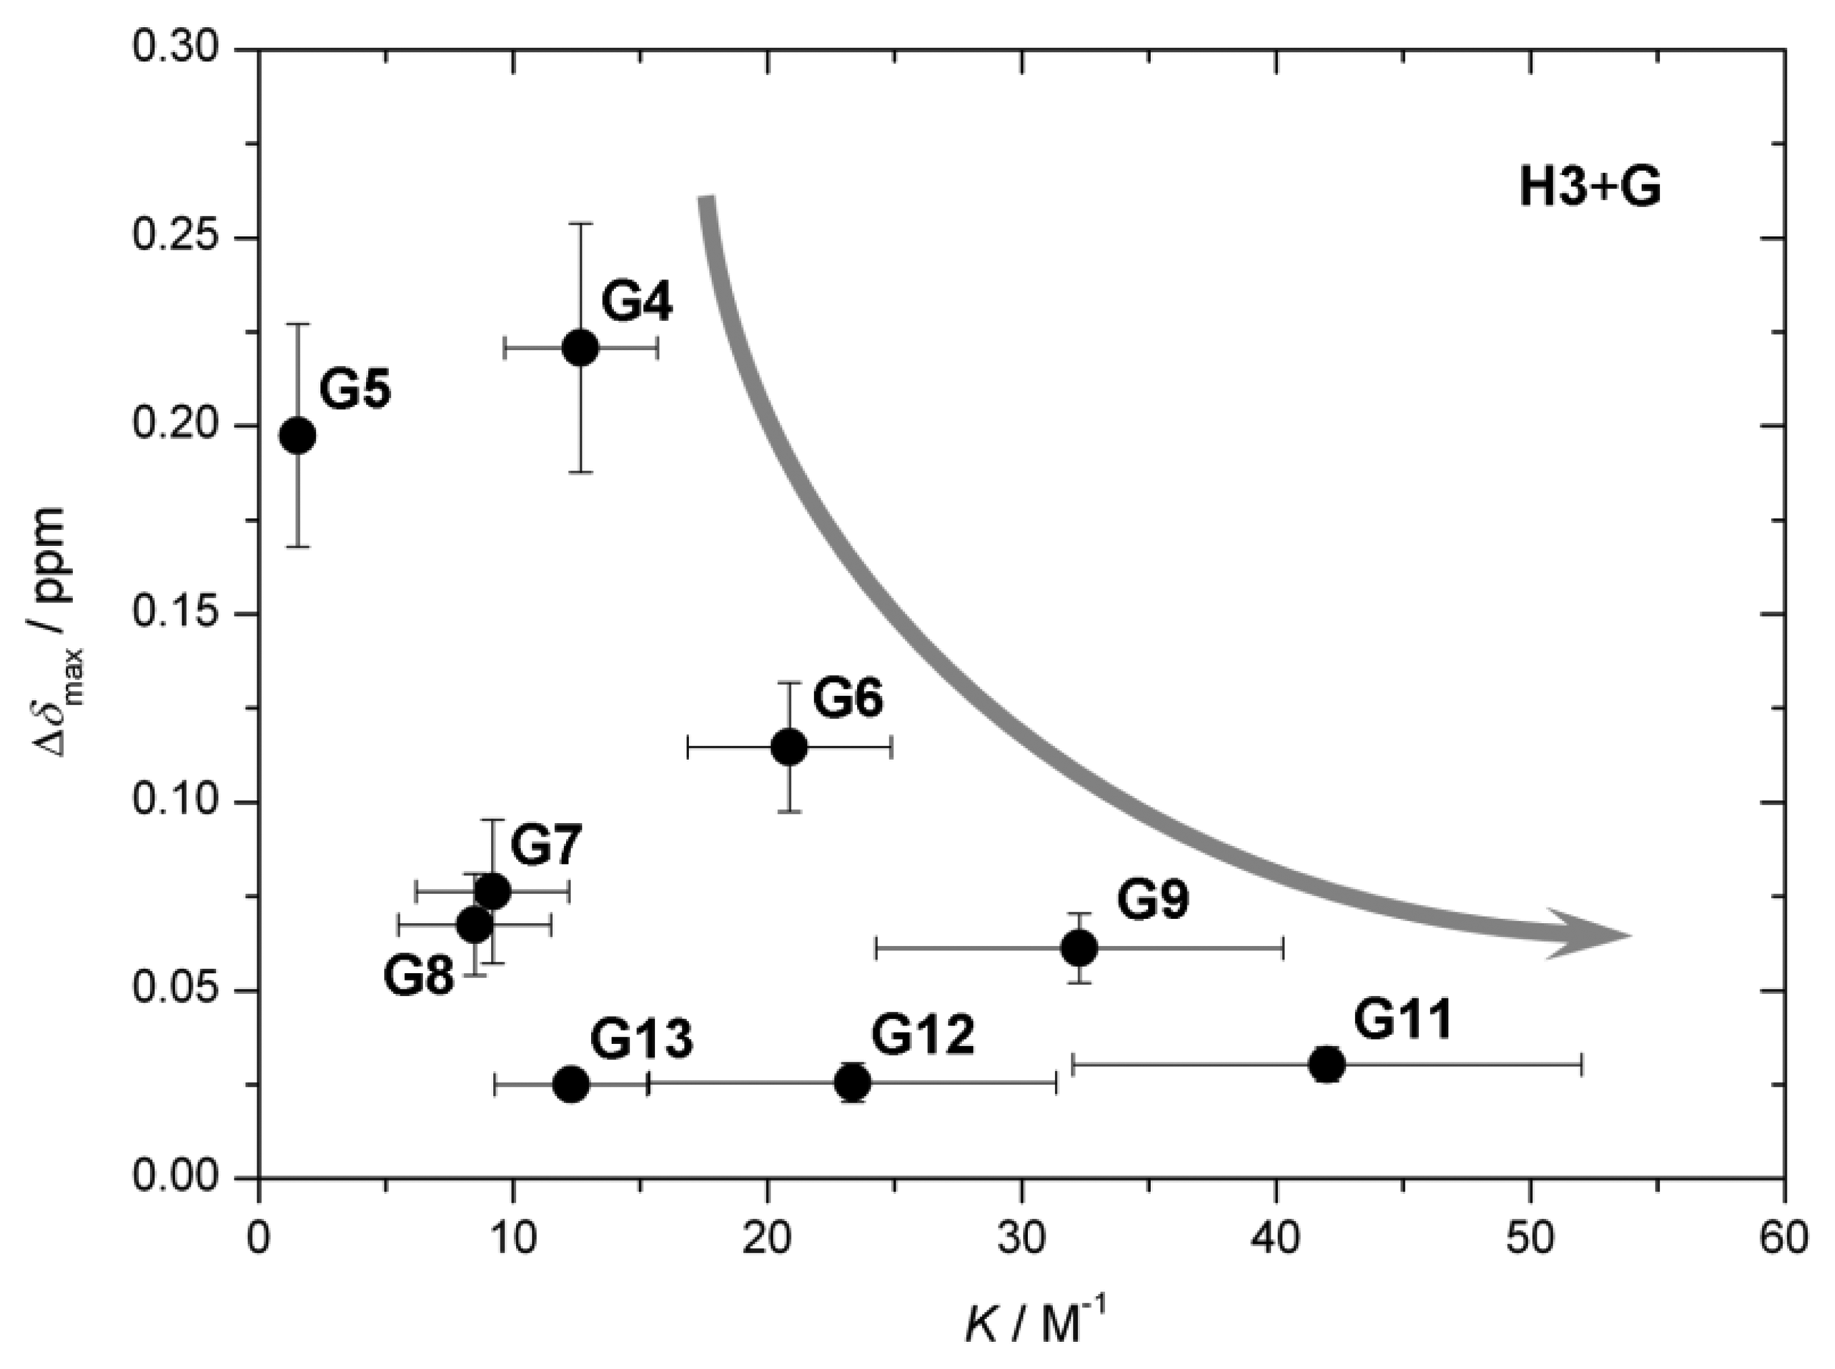
The value of the characteristic parameter Δδmax of each host–guest pair combination can usually be obtained from at least one of the reporting groups within the structure of the host, e.g., pyrrolic β-protons or hemiquinonoid ortho-H (Figure 1). The values of Δδmax vary from 0.03 ppm to 0.25 ppm [13–15,20] as can be seen in Figure 6a. The values are comparable to induced chemical shift nonequivalence for standard CSAs [21]. Figure 6b shows binding constants for each host–guest pair examined [13–15]. The values vary by three orders of magnitude. Type I systems possess significantly larger binding constants than Type II, which is predictable given that acid-base interactions are usually much stronger than hydrogen bonding interactions. Interestingly, in the case of the Type II binding mode, larger binding constants seem to be connected with lower induced nonequivalence in chemical shift, which might be counterintuitive (Figure 7). However, there seems to be no apparent connection between this behavior and the structures of the guests.
2.4. Effects of Stoichiometry on ee Detection Mechanism
Type I systems with 1:2 stoichiometry form ternary complexes [13,14] (Figure 8a,b). Thus, diastereomers (e.g., H/2R and H/RS) are present in solution. Despite this, the ee determination protocol is not affected when there is fast exchange (at NMR time scale) of guests at the binding site of the host molecule. Fast exchange between homo (H/2R, H/2S) and hetero (H/RS) complexes is especially important. This applies to Type I systems at optimal temperature.
When temperature is too low and guest exchange is slow on NMR time scale we obtain splitting of reporting group resonances even when a racemic analyte is used. When homo (H/2R, H/2S) and hetero (H/RS) complexes have other than statistical abundances the result is not only splitting (at low temperature) but also different intensity of the corresponding resonances (see below the analysis of dynamical processes in H1 and H2).
In Appendix 2 we have mathematically shown that in the presence of fast exchange of guests (including fast exchange between homo and hetero complexes at optimal temperature) the deviation from statistical distribution between homo and hetero complexes still yields a linear relationship between Δδ and ee. This indicates that at optimal temperature each binding site (or face) of the host molecule behaves as an individual ee detector. In Type II systems, the latter is not an issue since only one guest can be bound [15] (Figure 8c). Therefore, in both modes at optimal temperature the ee detection mechanism is not dependent on formation of diastereomers.
2.5. Temperature and Tautomerism Effects on ee Detection Mechanism
Temperature affects functionality of ee detectors in various ways, especially in that it alters the shapes and broadness of NMR resonances and the magnitude of induced non-equivalence. These factors should be considered in obtaining well resolved spectra and enable accurate ee discrimination of analytes.
There are several temperature sensitive dynamic processes occurring in host molecules including their spectral manifestation. These processes (which will be later discussed in detail for each H molecule) are:
- (1)
Prototropic phenol-hemiquinone tautomerism (a form of keto-enol tautomerism) (Figure 9a);
- (2)
Saddle-to-saddle macrocyclic inversion (ring-flip) (Figure 9b);
- (3)
Charge tautomerism (between inner pyrrolic NHs) (Figure 9c);
- (4)
Exchange of guests at the host binding site. There are two possible mechanisms for guest exchange in Type I systems (Figure 9d).
2.5.1. Dynamic Processes in H1
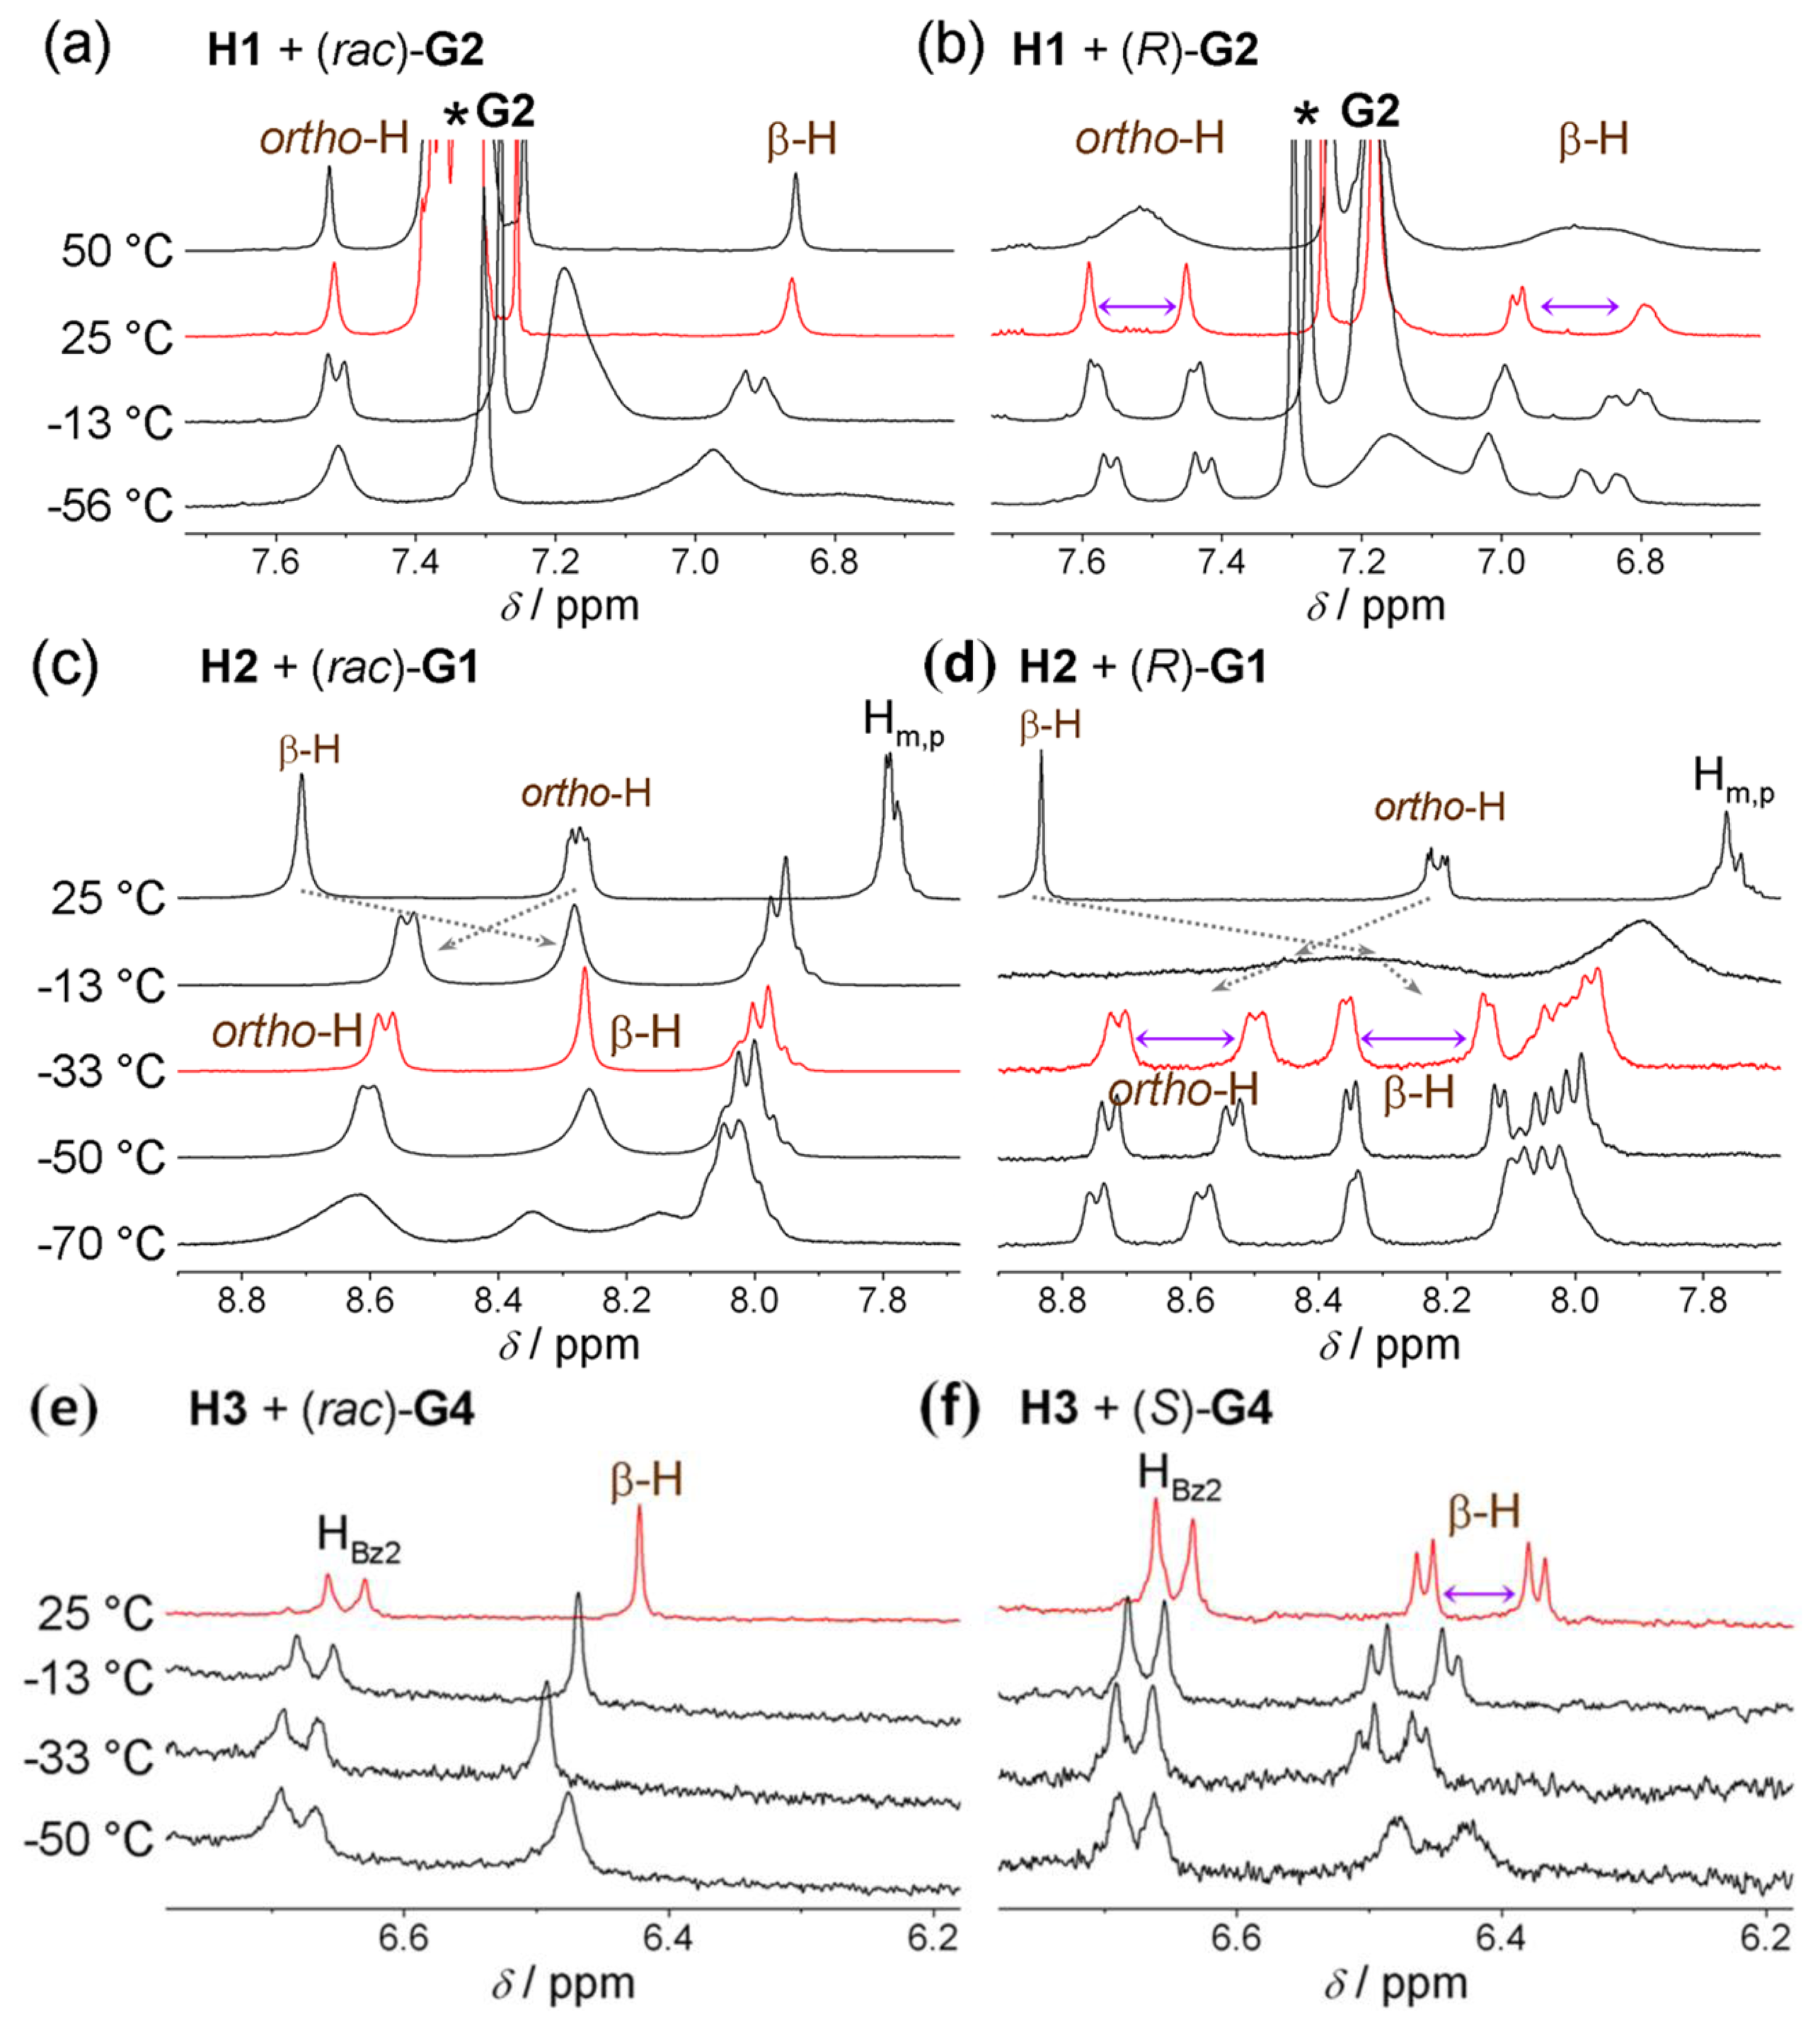
Host H1 (upon addition of chiral acid) undergoes all four of the abovementioned processes (Figure 9). Dynamic behaviour of H1 is therefore rather complex. However, these processes can be deconvoluted and the corresponding NMR spectral manifestation can be assigned [20]. Here, only those points which are connected with ee discrimination will be elaborated. Figure 10a shows VT 1H-NMR spectra of H1 with (rac)- and (R)-G2, respectively, where the spectrum at optimal temperature (25 °C) for ee discrimination is plotted in red. The effect of a reducing rate of prototropic tautomerism in H1 is manifested during cooling (from 25 °C to −56 °C) by additional splitting of both pyrrolic β-protons (6.9 ppm) and hemiquinonoid ortho-H (7.5 ppm).
For the H1/(R)-G2 system, at −56 °C these resonances (e.g., hemiquinonoid ortho-H) appear as two doublets (Figure 10a). Note that at this temperature ring-flip is arrested (this will be discussed below). At −56 °C, prototropic phenol-hemiquinone tautomerism is virtually arrested and H1 (in its diprotonated state) possesses two enantiomeric forms (+)-H1 and (−)-H1, which cannot interconvert resulting in formation of two diastereomers (+)-H1/2(R)-G2 and (−)-H1/2(R)-G2 (Figure 11b). What appeared to be two doublets (e.g., hemiquinonoid ortho-H around 7.5 ppm) are two pairs of singlets, where inner and outer pairs belong to different diastereomers. A similar situation applies for pyrrolic β-protons (6.9 ppm) [20].
For the H1/(rac)-G2 system at −56 °C, there appears a single broad resonance due to hemiquinonoid ortho-H at 7.5 ppm (Figures 10a and 11a). It seems to be a broad singlet, however, there exist six species in solution: (+)-H1/2(R)-G2, (−)-H1/2(R)-G2, (+)-H1/2(S)-G2, (−)-H1/2(S)-G2, (+)-H1/(R)-G2/(S)-G2 and (−)-H1/(R)-G2/(S)-G2 under a moderate rate of exchange. They can be divided into three groups (i, ii and iii) of two enantiomers each (having the same NMR spectrum). The groups, however, are mutual diastereomers having different NMR spectra. The groups are (i) (+)-H1/2(R)-G2, (−)-H1/2(S)-G2; (ii) (−)-H1/2(R)-G2, (+)-H1/2(S)-G2 and (iii) (+)-H1/(R)-G2/(S)-G2, (−)-H1/(R)-G2/(S)-G2. This division into three groups of diastereomers means that there are three pairs of singlets (for hemiquinonoid ortho-H) in moderate exchange at −56 °C, which is the reason for broadening of the spectral line. If it was possible to slow down then completely arrest guest exchange there ought to be more profound splitting and eventually the abovementioned three pairs of singlets would be visible. However, slowing and arrest could not be achieved in this system since guest exchange at the host binding site remains at a moderate rate even close to the freezing point of the solvent used. At 25 °C, these pairs are averaged to resolved singlet resonances.
Interestingly, the slow exchange of guests at the host binding site in H1 with (R)-G2 system does not have any effect on broadening since (+)-H1/2(R)-G2 diastereomer cannot simply become (+)-H1/(R)-G2/(S)-G2 (or (+)-H1/2(R)-G2 cannot become (−)-H1/2(R)-G2 since ring-flip is already halted around 25 °C) [20].
Ring-flip is well manifested above 25 °C (Figure 10a) in H1 with (R)-G2 system where the originally well-separated resonances (reporting groups) merge due to possible H1 interconversion from (+)-H1/2(R)-G2 to (−)-H1/2(R)-G2. In the case of H1/(rac)-G2, no effects could be observed since enantiomer interconversion is simply another averaging mechanism (which only serves to sharpen the resonances).
Charge tautomerism between inner pyrrolic NHs seems to be fast at any temperature which might also be due to delocalization of the 2+ charge over the four pyrrolic nitrogen atoms.
Dynamic processes in H1 can obscure the ee discrimination mechanism. All can be affected by temperature change. The investigation described above suggests that optimal conditions can be found at 25 °C that permit effective ee discrimination.
2.5.2. Dynamic Processes in H2
Host H2 (upon addition of chiral acid) at 25 °C is not diprotonated as can be seen in Figure 10b. Upon cooling to −33 °C diprotonation does occur leading to dramatic changes in its NMR spectrum. At the optimal temperature of −33 °C, resonances are narrow and well-resolved. When the sample is further cooled the effects of charge tautomerism, ring-flip and exchange of guests at host’s binding place become apparent (note that prototropic tautomerism is not present). While the 1H-NMR spectrum of H2 with (R)-G1 at −70 °C remains well-resolved, H2 with (rac)-G1 exhibits significant broadening of the original resonance. Pyrrolic β-protons actually exhibit splitting. The well-resolved spectrum of H2 with (R)-G1 suggests that ring-flip is already arrested at −33 °C (and lower temperature) and does not play a role. It also seems that there is no effect of charge tautomerism on the spectrum, since no further splitting occurs upon cooling (for H2 with (R)-G1). This means that charge tautomerism is fast at any (observable) temperature and 2+ charge is delocalized over the four pyrrolic nitrogen atoms. The delocalization of charge and symmetry of host H2 indicates that its dipotonated form (H22+) is not chiral. Ring-flip of H22+ results in an identical structure in contrast to H12+ where protonation of hemiquinone moieties results in adoption of chiral symmetry D2 from the originally achiral D2d symmetry of H1 [20].
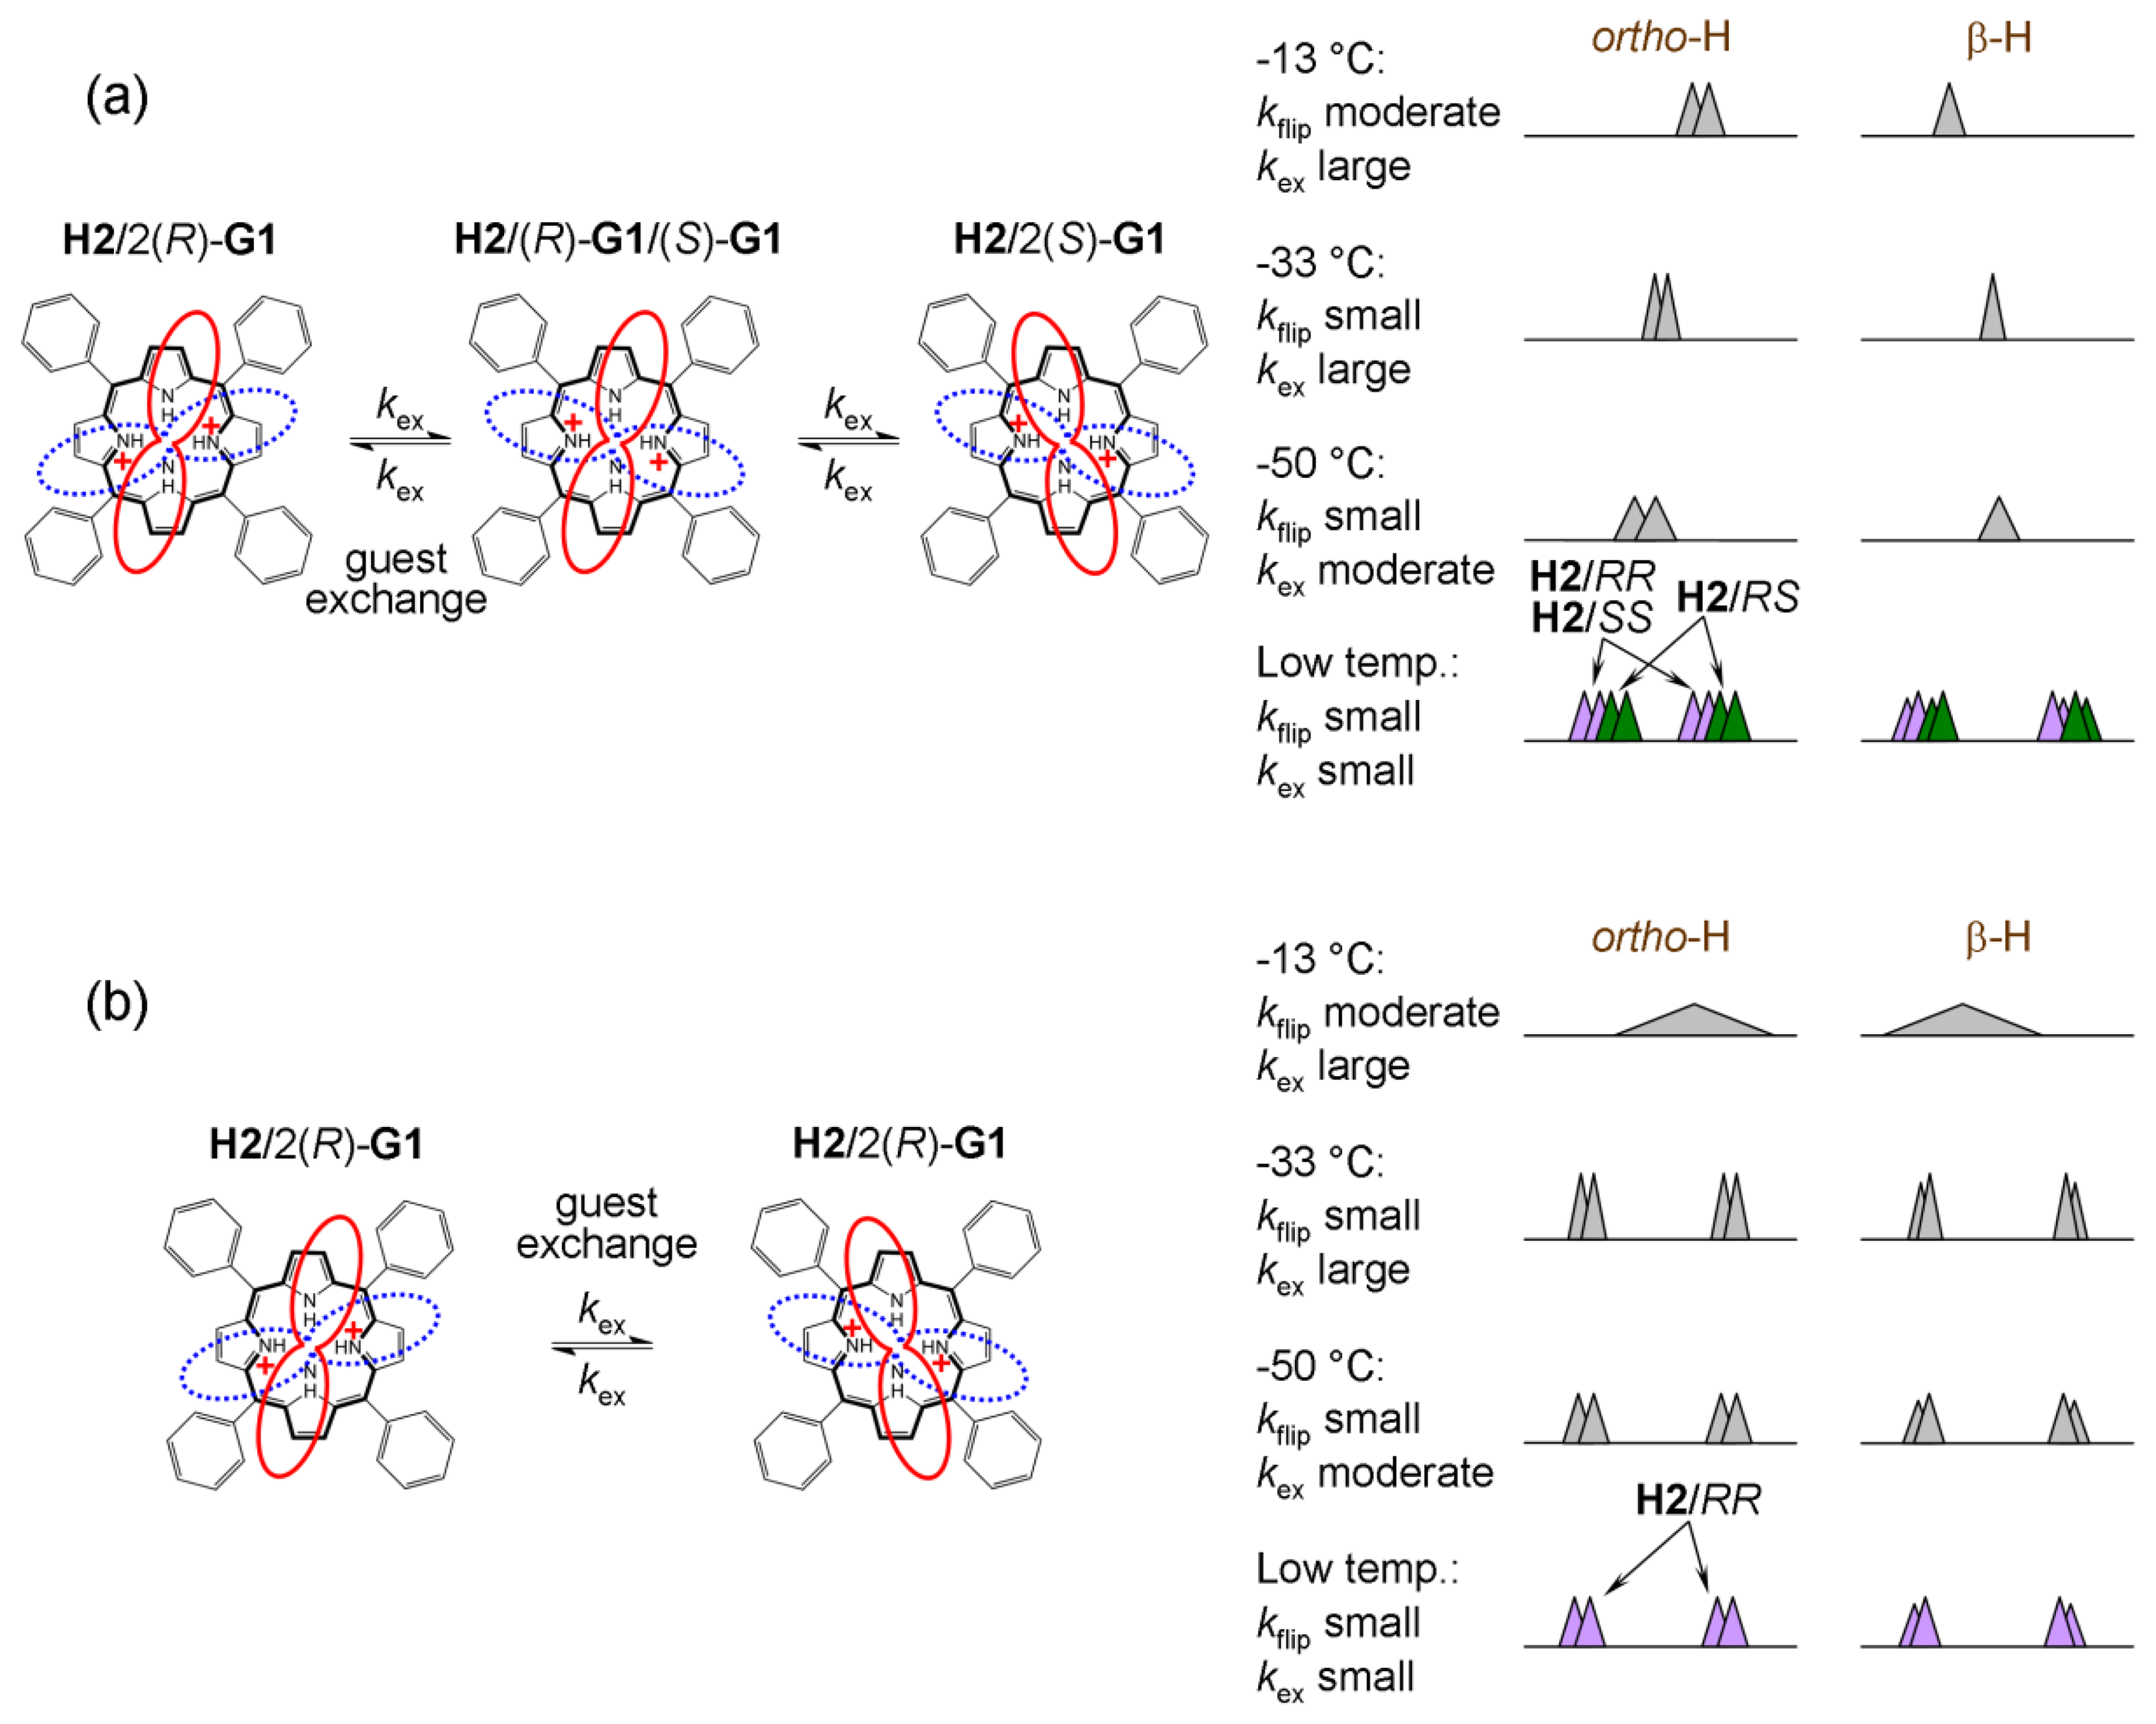
At −70 °C, dynamic processes in H2 are slow on the NMR timescale (Figures 10b and 12). H2 with (rac)-G1 can form two groups (i and ii) of enantiomers in slow exchange. These two groups are again diastereomeric with differing NMR spectra. The groups are (i) H2/2(R)-G1, H2/2(S)-G1 and (ii) H2/(R)-G1/(S)-G1 (Figure 12a). In NMR spectra, there appears initial broadening (at −50 °C) and (at −70 °C) two pairs of singlets (for hemiquinonoid ortho-H) or doublets (for pyrrolic β-H) are eventually resolved. They remain broad due to the presence of moderate-slow exchange. Therefore, using the spectrum at −70 °C, it is not possible to determine exactly the ratio of the two groups of enantiomers (i and ii). If the guest binding is statistical than the ratio should be i/ii = ½ since the hetero-complex H2/(R)-G1/(S)-G1 is twice as likely to occur as the homo-complex (in case of solutions of H2 with (rac)-G1).
If we assume that the rotation of bound guest at the host’s binding site is fast (but not guest exchange) there should be one pair of sharp doublets for H2 with (R)-G1 (as shown in Figure 10b and Figure 12b) and a pair of two sharp doublets for H2 with (rac)-G1 (as shown in Figure 10b and Figure 12a). The latter is due to presence of diastereomers with different NMR spectra.
In systems of 1:2 stoichiometry (Type I) even at very low temperature (i.e., guest exchange stopped), spectra with racemic mixtures of guests always show some degree of broadness. Unfortunately, it is not possible from the shape of spectra to determine the ratio between respective diastereomers because of significant peak overlap. For the H2 system, it seems that at −33 °C there should be an appropriate balance between full diprotonation and sufficiently fast exchange of guests in order to ensure reliable ee determination.
2.5.3. Dynamic Processes in H3
There is no form of tautomerism in Type II systems represented by H3. Ring-flip is not possible due to structural restrictions over H3. The only possible dynamic process is exchange of guests at the host’s binding site. In VT 1H-NMR spectra of H3 with G4 (Figure 10c), it can be seen that the magnitude of chemical shift non-equivalency Δδ decreases with decreasing temperature and at −50 °C broadening of all resonances (due to restricted mobility which increases the spin-spin relaxation rate) occurs. The decrease of Δδ upon cooling is the result of competitive binding of chiral guest and water to host H3. Binding affinity for water increases faster than for chiral guest, leading to a decrease in Δδ value. This feature is mathematically demonstrated in Appendix 1. In case of Type II system H3, it seems that the optimal temperature at which the magnitude of chemical shift non-equivalency reaches its maximum is 25 °C. H3 host molecule also provides a rare example where ee can be determined in the absence of diastereomer formation (in systems which are referenced in advance, i.e., Δδmax,c is already known).
3. Experimental Section
3.1. Materials
Chloroform-d (Cambridge Isotope Ltd., Tewkesbury, MA, USA) for 1H-NMR spectroscopy was used as received. (R)-mandelic acid (Wako Chem. Co., Tokyo, Japan), (S)-mandelic acid (Wako Chem. Co.), (S)-(−)-2-phenoxypropionic acid (Wako Chem. Co.), (rac)-(−)-2-phenoxypropionic acid (Wako Chem. Co.), (S)-(+)-α-methoxyphenylacetic acid (TCI Co. Ltd., Tokyo, Japan), (R)-ibuprofen (Nacalai Tesque, Kyoto, Japan), (S)-ibuprofen (TCI Co. Ltd.), (rac)-ibuprofen (TCI Co. Ltd.), (R)-2-phenylpropionic acid (Wako Chem. Co.), (rac)-2-phenylpropionic acid (TCI Co. Ltd.), N-boc-l-2-phenylglycine (TCI Co. Ltd.), N-boc-d-2-phenylglycine (TCI Co. Ltd.), N-boc-l-phenylalanine (TCI Co. Ltd.), N-boc-d-phenylalanine (TCI Co. Ltd.), l-leucic acid (TCI Co. Ltd.), dl-leucic acid (TCI Co. Ltd.), (−)-hyoscyamine (TCI Co. Ltd.), (±)-hyoscyamine (TCI Co. Ltd.), (+)-menthol (Sigma-Aldrich Co. LLC., St. Louis, MO, USA), (−)-menthol (Wako Chem. Co.), (+)-camphor (TCI Co. Ltd.), (−)-camphor (Wako Chem. Co.) were used as received. Meso-tetrakis(3,5-di-t-butyl-4-oxo-2,5-cyclohexadienylidene)porphyrinogen host (H1) molecule was prepared by a previously reported method [22–24]. Meso-tetraphenylporphine host (H2) (TCI Co. Ltd.) was purified according to a literature method [25]. Synthesis of the host molecule N21,N23-bis(4-bromobenzyl)-5,10,15,20-tetrakis(3,5-di-t-butyl-4-oxocyclohexadien-2,5-ylidene)porphyrinogen (H3) has been reported previously [23,24].
3.2. Spectroscopic Methods
1H-NMR spectra were obtained using an AL300BX spectrometer (JEOL) operating at 300.4 MHz. Variable temperature measurements (VT-1H-NMR) were performed using the appropriate JEOL temperature control unit (temperature fluctuation ± 0.3 °C). Prior to experiments, host molecule was dissolved in chloroform-d in an NMR tube and subsequently ligand (chiral guest or water) was added directly into the NMR tube. Molar ratio of ligand and host was determined by integration of the corresponding peaks in spectra. All spectra were referenced to tetramethylsilane. Binding models (for H1 and H2) with host–guest stoichiometry 1:2, NMR spectra and obtained binding constants are described in detail in [13,14,20]. 1:1 host–guest competitive binding model (for H3) in exact form is derived in [15] including NMR spectra and obtained binding constants. 2D NMR spectra at room and low temperature of H1 with (S)-G1, H1 with (R)-G2 and H1 with (S)-G3 are shown in supporting information in [20] including detailed analysis of resonance assignment.
4. Conclusions
In summary, we have described the various dynamic processes in prochiral solvating agents (pro-CSAs) studied using NMR spectroscopy. Various features of pro-CSA, including types of interactions in complex formation, stoichiometry, binding strength and temperature effects were compared for three representative pro-CSA molecules. The detailed analysis of species (complexes) occurring in solution, and their 1H-NMR spectral manifestations, were investigated in order to assess the possibility of optimization of ee sensing by pro-CSAs. We found that all the parameters studied to some extent affect the ee sensing and that some care is required in implementation of pro-CSA protocols. We have also discussed the various advantages and disadvantages inherent in the systems presented here. In particular, for the present pro-CSA compounds, it must be acknowledged that their relatively poor precision and the necessity for construction of a calibration curve (albeit from a single sample of known ee) will hinder practical applications. However, the achirality of pro-CSAs leads to potential niche applications, for instance, for in situ asymmetric reaction monitoring. Advantages of large portfolios of possible chiral guests also exist for pro-CSAs which can be analyzed using a single host. Thus, despite the inherent limitations of pro-CSA type sensing, it presents a method of ee determination which is complementary to existing methods and may find applications in specific analyses, particularly where use of standard CSAs is precluded. Future work on this subject will address some of these issues.
Acknowledgments
This work was partly supported by World Premier International Research Initiative (WPI Initiative), Ministry of Education, Culture, Sports, Science and Technology (MEXT), Japan, and Core Research for Evolutional Science and Technology (CREST) of Japan Science and Technology Agency (JST), Japan. The authors are also grateful for financial support of a Kurata Grant provided by The Kurata Memorial Hitachi Science and Technology Foundation.
Conflicts of Interest
The authors declare no conflict of interest.
Appendix 1
Competitive Binding Model in Approximate Analytical Solution
In competitive binding model (for Type II system H3), we assume that chiral guest G and water W are binding to host H (=H3) in competitive manner to form 1:1 host–guest complexes (H·G and H·W) described by equilibrium Equation (3). For reasons of symmetry, we also assume that chiral guest G with either (R)- or (S)-chirality has the same equilibrium binding constant.
In the derivation of binding isotherms, we assume fast exchange between the three states of host H·G, H and H·W and binding of (R)- or (S)-enantiomer to the host as statistical due to the symmetry of H. The water interaction with host molecule is reflected strongly by the downfield shift of pyrrolic NH resonance around 9 ppm. Therefore two binding isotherms for chemical shift of pyrrolic NH δNH and for induced chemical shift non-equivalency Δδ were fitted simultaneously. Then δNH and Δδ can be expressed in the form of Equations (6) and (7) [15], respectively.
An approximate analytical solution permits better understanding of the effect of equilibrium binding constants (KHG and KHW) on the magnitude of δNH and Δδ. The approximate solution is constructed based on weak binding condition in which Equation (4) have following form.
From Equation (9) the conditions for weak binding are following.
Considering the inequality [H]t ≥ [H] (which holds always) then we obtain limiting conditions for weak binding in the form of Equation (11).
Note that maximum values (at low [G]t) are KHG[H]t ≈ 0.12 and KHW[H]t ≈ 0.17, therefore, the approximation is applicable. At high [G]t where the ee discrimination usually takes place the values in Equation (10) are of one or two orders of magnitude smaller. Then it is permitted to state that [G] = [G]t and [W] = [W]t and Equations (4) and (5) take the form of Equations (12) and (13), respectively.
Substituting [HG] and [HW] from Equation (12) into Equation (13) after rearranging, yields the term for [H]. Substitution of this [H] back into Equation (12) followed by rearrangement gives [HG] and [HW] terms. Thus, [HG], [H] and [HW] will have the form of Equation (14).
From here the binding isotherms, Equations (6) and (7), in the weak binding approximation can be expressed in the form of Equations (15) and (16), respectively.
It should be noted that this approach approximates H3 system very accurately and can be used for various theoretical predictions of its behavior.
Temperature Effects on Magnitude of Induced Non-Equivalence Δδ in H3 System
The binding constants KHG and KHW (including Δδmax) were determined at 28 °C and −32 °C, respectively, for H3 with (S)-G4 guest using 1H-NMR titration experiments. The values are: KHG (28 °C) = 12.9 M−1, KHG (−32 °C) = 57.2 M−1, KHW (28 °C) = 355 M−1, KHW (−32 °C) = 14.3 × 10³ M−1, Δδmax (28 °C) = 0.21 ppm and Δδmax (−32 °C) = 0.40 ppm. From these values we can calculate Δδ at latter mentioned temperatures at typical host H3 (0.57 mM), water (10 mM, ca. 17.5 equiv.) and (S)-G4 guest (23 mM, ca. 400 equiv.) concentrations. The actual calculated values are Δδ (28 °C) = 0.085 ppm and Δδ (−32 °C) = 0.032 ppm. From this analysis is can be seen that decrease in Δδ upon cooling (Figure 10c) is due to water binding affinity which increases faster than that of chiral guest during cooling.
Appendix 2
Here we show that under fast exchange of guests (i.e., at optimal temperature) the deviation from statistical distribution between homo (H/2R and H/2S) and hetero (H/RS) complexes still yields a linear relationship between Δδ and ee. Therefore, it will not affect the ee determination protocol of Type I host molecules.
The ee determination mechanism in 1:2 host–guest Type I systems can be derived as follows. The populations of homo and hetero complexes are given in Equation (17).
Parameter α is a factor describing the deviation from statistical distribution. It can be seen that pH/2R + pH/2S + pH/RS = 1. Combining Equations (1) and (18) yields relations (19).
Substituting Equations (19) into (17) gives the following relation for populations.
The deviation from statistical distribution α is in the range −(1 − ee2)/2 ≤ α ≤ min[(1 + ee)2/2, (1 − ee)2/2, (1 + ee2)/2]. For example, a racemic mixture of guest (ee = 0) gives the range −½ ≤ α ≤ ½. There are three specific situations: α = 0 yields a statistical distribution, α = −½ yields formation of homo complexes only and α = ½ yields formation of hetero complexes only. The chemical shift of a particular β-proton in structures of each type of complex is shown schematically in Figure A1. There are two types of chemical shifts for homo and hetero complexes, respectively. Due to symmetry many β-protons in homo and hetero complexes have the same chemical shift. However, in general the chemical shifts of homo and hetero complexes are different as shown schematically in Figure A1a. The definition of chemical shifts is as follows. For example, the value δH/2R(Ha) corresponds to the chemical shift of Ha β-protons in H/2R homo complex (Figure A1b). The subscript to δ indicates the type of complex while the type of β-proton is indicated in brackets. Non-primed (Ha, Hb) and primed (H′a, H′b) β-protons are positioned above and below the host mean plane, respectively. In case of the fast exchange condition, the overall chemical shift of Ha (and H′a) protons denoted as δa is defined in Equation (21) and similarly for Hb (and H′b) protons, Equation (22).
The symmetry of complexes suggests that the following chemical shifts have the same value (Figure A1a): δH/2R(Ha) = δH/2R(H′a) = δH/2S(Hb) = δH/2S(H′b), δH/2R(Hb) = δH/2R(H′b) = δH/2S(Ha) = δH/2S(H′a), δH/RS(Ha) = δH/RS(H′b) and δH/RS(Hb) = δH/RS(H′a). Using this equivalence the chemical shift nonequivalence Δδ can be calculated from Equations (21) and (22):
From Equation (20) the term pH/2R − pH/2S = ee. Term δH/2R(Ha) − δH/2R(Hb) ≡ Δδmax,c is a characteristic value for each host–guest pair which also defines the gradient of the calibration curve. Despite any deviation from a statistical distribution (α), Δδ exhibits linear dependency on ee in the fast exchange regime:

References
- Kubo, Y.; Maeda, S.; Tokita, S.; Kubo, M. Colorimetric chiral recognition by a molecular sensor. Nature 1996, 382, 522–524. [Google Scholar]
- Zhu, L.; Anslyn, E. Facile quantification of enantiomeric excess and concentration with indicator-displacement assays: An example in the analyses of α-hydroxyacids. J. Am. Chem. Soc. 2004, 126, 3676–3677. [Google Scholar]
- Mizuno, Y.; Aida, T.; Yamaguchi, K. Chirality-memory molecule: Crystallographic and spectroscopic studies on dynamic molecular recognition events by fully substituted chiral porphyrins. J. Am. Chem. Soc. 2000, 122, 5278–5285. [Google Scholar]
- Nieto, S.; Lynch, V.M.; Anslyn, E.V.; Kim, H.; Chin, J. High-throughput screening of identity, enantiomeric excess, and concentration using MLCT transitions in CD spectroscopy. J. Am. Chem. Soc. 2008, 130, 9232–9233. [Google Scholar]
- James, T.D.; Sandanayake, K.R.A.S.; Shinkai, S. Chiral discrimination of monosaccharides using a fluorescent molecular sensor. Nature 1995, 374, 345–347. [Google Scholar]
- Matsushita, M.; Yoshida, K.; Yamamoto, N.; Wirsching, P.; Lerner, R.A.; Janda, K.D. High-throughput screening by using a blue-fluorescent antibody sensor. Angew. Chem. Int. Ed. 2003, 42, 5984–5987. [Google Scholar]
- Horeau, A.; Guetté, J.P. Interactions diastereoisomeres d’antipodes en phase liquide. Tetrahedron 1974, 30, 1923–1931. [Google Scholar]
- Jurczak, J.; Zamojskii, A. Condensation of 1-alkoxy-1,3-butadienes with optically active glyoxylic acid esters. Tetrahedron 1972, 28, 1505–1516. [Google Scholar]
- Parker, D. NMR determination of enantiomeric purity. Chem. Rev. 1991, 91, 1441–1457. [Google Scholar]
- Wenzel, T.J.; Chisholm, C.D. Assignment of absolute configuration using chiral reagents and NMR spectroscopy. Chirality 2011, 23, 190–214. [Google Scholar]
- Duddeck, H.; Gómez, E.D. Chiral recognition of ethers by NMR spectroscopy. Chirality 2009, 21, 51–68. [Google Scholar]
- Schwenninge, R.; Schlögl, J.; Maynollo, J.; Gruber, K.; Ochsenbein, P.; Bürgi, H.-B.; Konrat, R.; Kräutler, B. Metal complexes of a biconcave porphyrin with D4-structure—Versatile chiral shift agents. Chem. Eur. J. 2001, 7, 2676–2686. [Google Scholar]
- Shundo, A.; Labuta, J.; Hill, J.P.; Ishihara, S.; Ariga, K. Nuclear magnetic resonance signaling of molecular chiral information using an achiral reagent. J. Am. Chem. Soc. 2009, 131, 9494–9495. [Google Scholar]
- Labuta, J.; Ishihara, S.; Shundo, A.; Arai, S.; Takeoka, S.; Ariga, K.; Hill, J.P. Chirality sensing by nonchiral porphines. Chem. Eur. J. 2011, 17, 3558–3561. [Google Scholar]
- Labuta, J.; Ishihara, S.; Šikorský, T.; Futera, Z.; Shundo, A.; Hanyková, L.; Burda, J.V.; Ariga, K.; Hill, J.P. NMR spectroscopic detection of chirality and enantiopurity in referenced systems without formation of diastereomers. Nat. Commun. 2013, 4. [Google Scholar] [CrossRef]
- Soai, K.; Shibata, T.; Morioka, H.; Choji, K. Asymmetric autocatalysis and amplification of enantiomeric excess of a chiral molecule. Nature 1995, 378, 767–768. [Google Scholar]
- Klussmann, M.; Iwamura, H.; Mathew, S.P.; Wells, D.H., Jr.; Pandya, U.; Armstrong, A.; Blackmond, D.G. Thermodynamic control of asymmetric amplification in amino acid catalysis. Nature 2006, 441, 621–623. [Google Scholar]
- Perry, R.H.; Wu, C.; Nefliu, M.; Cooks, R.G. Serine sublimes with spontaneous chiral amplification. Chem. Commun. 2007, 43, 1071–1073. [Google Scholar]
- Fletcher, S.P.; Jagt, R.B.C.; Feringa, B.L. An astrophysically-relevant mechanism for amino acid enantiomer enrichment. Chem. Commun. 2007, 43, 2578–2580. [Google Scholar]
- Labuta, J.; Futera, Z.; Ishihara, S.; Kouřilová, H.; Tateyama, Y.; Ariga, K.; Hill, J.P. Chiral guest binding as a probe of macrocycle dynamics and tautomerism in a conjugated tetrapyrrole. J. Am. Chem. Soc. 2014, 136, 2112–2118. [Google Scholar]
- Yang, X.-F.; Ning, R.; Xie, L.-J.; Cui, Y.; Zhang, Y.-L.; Zheng, L.-Y. Macrocyclic Compound as NMR chiral solvating agent for determination of enantiomeric excess of carboxylic acids. Bull. Chem. Soc. Jpn. 2013, 86, 987–989. [Google Scholar]
- Milgrom, L.R. The facile aerial oxidation of a porphyrin. Tetrahedron 1983, 39, 3895–3898. [Google Scholar]
- Hill, J.P.; Hewitt, I.J.; Anson, C.E.; Powell, A.K.; McCarty, A.L.; Karr, P.A.; Zandler, M.E.; D’Souza, F. Highly nonplanar, electron deficient, N-substituted tetra-oxocyclohexadienylidene porphyrinogens: Structural, computational, and electrochemical investigations. J. Org. Chem. 2004, 69, 5861–5869. [Google Scholar]
- Hill, J.P.; Schmitt, W.; McCarty, A.L.; Ariga, K.; D’Souza, F. Structures, spectral and electrochemical properties of N-(naphth-2-ylmethyl)-appended porphyrinogens. Eur. J. Org. Chem. 2005, 2005, 2893–2902. [Google Scholar]
- Rousseau, K.; Dolphin, D. A purification of meso-tetraphenylporphyrin. Tetrahedron Lett. 1974, 15, 4251–4254. [Google Scholar]





© 2014 by the authors; licensee MDPI, Basel, Switzerland. This article is an open access article distributed under the terms and conditions of the Creative Commons Attribution license ( http://creativecommons.org/licenses/by/3.0/).
Share and Cite
Labuta, J.; Ishihara, S.; Ariga, K.; Hill, J.P. Dynamic Processes in Prochiral Solvating Agents (pro-CSAs) Studied by NMR Spectroscopy. Symmetry 2014, 6, 345-367. https://doi.org/10.3390/sym6020345
Labuta J, Ishihara S, Ariga K, Hill JP. Dynamic Processes in Prochiral Solvating Agents (pro-CSAs) Studied by NMR Spectroscopy. Symmetry. 2014; 6(2):345-367. https://doi.org/10.3390/sym6020345
Chicago/Turabian StyleLabuta, Jan, Shinsuke Ishihara, Katsuhiko Ariga, and Jonathan P. Hill. 2014. "Dynamic Processes in Prochiral Solvating Agents (pro-CSAs) Studied by NMR Spectroscopy" Symmetry 6, no. 2: 345-367. https://doi.org/10.3390/sym6020345
APA StyleLabuta, J., Ishihara, S., Ariga, K., & Hill, J. P. (2014). Dynamic Processes in Prochiral Solvating Agents (pro-CSAs) Studied by NMR Spectroscopy. Symmetry, 6(2), 345-367. https://doi.org/10.3390/sym6020345


