


Abstract
Drilling methods have been increasingly employed for shaft excavation in coal mines in western China. However, the rock fragmentation performance of milled-tooth roller cutters remains inadequate under Jurassic strata conditions. To address this issue, a numerical orthogonal simulation study based on the Finite-Discrete Element Method (FDEM) was conducted. Cutter tooth edge geometry, cutter diameter, cone angle, and penetration depth were considered as four factors at three levels. The effects of these factors on average force, specific energy, damage factor, and proportion of shear cracks were investigated. The efficiency coefficient method was then applied to identify the optimal cutter, and the 8# roller cutter was determined to be the most effective. The results indicated that cutter tooth edge geometry had the most significant influence on average force and specific energy, whereas penetration depth primarily affected the damage factor and proportion of shear cracks. Compared with the prototype cutter, the 8# cutter, characterized by a 370 mm large cone-end diameter, a 3° cone angle, and V-edged teeth, exhibited superior rock fragmentation efficiency, achieving a maximum improvement of 31%. These results provide a theoretical basis for the structural optimization of cutters used in shaft drilling in coal mines in western China.
1. Introduction
In recent years, as China’s coal industry has shifted westward, large-scale shaft construction projects for coal mines have increasingly been undertaken in western regions, such as Inner Mongolia, Shaanxi, and Ningxia. Among the various shaft sinking methods, shaft sinking by drilling has gained prominence owing to its high level of mechanization, enhanced safety, and favourable working conditions. This method has been successfully applied to the construction of both intake and return air shafts in a central shaft project in a western coal mine [1,2]. However, engineering practices have revealed several challenges [3,4,5]. Jurassic weakly cemented strata, which are prevalent in western mining areas, tend to undergo argillization and sandification when exposed to water. In such formations, severe cutter wear and low rock-breaking efficiency are commonly encountered during drilling operations. Initial studies indicate that the symmetrical structural design of the currently used milled-tooth roller cutters does not satisfy the efficiency requirements for rock fragmentation in weakly cemented Jurassic strata. This mismatch has been identified as a key factor contributing to poor cutter performance, highlighting the urgent need for targeted research and further optimization of symmetrical structures.
Laboratory experiments are commonly employed to optimize the structural parameters of roller cutters, including linear cutting tests [6,7,8,9,10], rotary cutting tests [11,12,13,14], and penetration tests [15,16,17,18,19]. To enhance the drilling performance of polycrystalline diamond compact (PDC) bits, Xiong et al. [20,21] conducted a series of linear cutting tests on PDC tools. Their results showed that Stinger PDC bits exhibited the lowest specific energy when the cutting tooth angle was 20°. Liu et al. [22] performed linear cutting tests on PDC bits with different cutter shapes and tooth spacings, revealing that an irregular three-plane tooth design achieved optimal rock-breaking performance. Zou et al. [23] conducted rotary cutting experiments to optimize the tooth arrangement of PDC bits. Their results indicated that an inclination angle below 20° was preferable for soft formations, whereas angles above 20° were more suitable for hard rocks. To improve the cutting efficiency of disc cutters, Tumac and Balci [24], Balci and Tumac [25], Rostami [6], Yao et al. [26], and Gong et al. [27] optimized structural parameters such as blade profile, tip width, and cutter diameter based on linear cutting test results. Specific energy was adopted as the evaluation criterion, and the results showed that V-shaped and round-shaped roller cutters achieved higher rock-breaking efficiency. Building on these studies, Mo et al. [28] and Chen and Labuz [29] further investigated the influence of cutter edge angle through granite penetration tests. Their findings demonstrated that disc-type roller cutters achieved the lowest specific energy when the edge angle was obtuse. Wu et al. [30] conducted rotary cutting experiments on granite to refine the design of inserted-tooth roller cutters, revealing that a larger spacing between spherical teeth enhances rock fragmentation performance. Ma et al. [31] and Wu and Li [32] performed penetration tests with various tooth shapes, and the results demonstrated that pick-shaped teeth were more effective in breaking granite than conical, wedge-shaped, and spherical teeth.
With the rapid advancement of computer technology, numerous studies have focused on optimizing the structural parameters of various roller cutters through numerical simulations. To enhance the stability and drilling speed of PDC bits, Chen et al. [33] employed the finite element method to simulate the rock-breaking processes of planar and non-planar PDC teeth. Their results showed that convex-ridge non-planar teeth provided superior stability. Dong et al. [34] also used ABAQUS to simulate the cutting processes of different tooth shapes. The results indicated that triangular teeth exhibited higher rock-breaking efficiency than other geometries. To refine the structural design of disc-type roller cutters, Tan et al. [35] applied the discrete element method and used crack length as the evaluation criterion, focusing on the optimization of tip width and cutter edge angle. Their findings suggested that the optimal tip width ranged from 10 to 15 mm, and the optimal cutter edge angle was between 10° and 20°. Su et al. [36] employed PFC software (3.0) to optimize the tooth profile of disc-type roller cutters based on crack number as the evaluation criterion. The results indicated that in hard formations, flat-edged roller cutters demonstrated superior rock-breaking performance compared with wedge tooth roller cutters. Li et al. [37] used the discrete element method to investigate the influence of edge angle on rock fragmentation behaviour, concluding that an increase in edge angle resulted in more shear cracks and larger plastic damage areas. In addition, Hou et al. [38] and Liu et al. [39] employed finite element analysis to optimize the tooth geometry, spacing, quantity, and cone angle of inserted-tooth roller cutters, using specific energy as the evaluation metric.
Originally developed by Munjiza [40], the Finite-Discrete Element Method (FDEM) integrates finite and discrete element formulations within a unified computational framework, enabling efficient simulation of complex rock-mechanical processes [41,42,43,44,45]. Using this method, Kang et al. [46] analyzed rock fragmentation produced by double-edged disc-type roller cutters under different tooth spacings. Their results showed that a spacing of 50 mm yielded the highest cutting efficiency and the greatest crack extension. Wang et al. [47] applied the FDEM coupled with a moisture migration–fracture model to simulate the cutting performance of double roller cutters. Their findings indicated that with increasing rock moisture content, rock fragmentation efficiency initially decreased and then increased. Wang et al. [48] also combined the FDEM with a fracture constitutive model for joint elements to explore the optimal cutter spacing for double roller cutters, concluding that optimal spacing increased under higher confining pressure. In addition, Wang et al. [49] employed the FDEM to optimize the tooth length and spacing of milled-tooth rolling cutters. However, studies on the structural optimization of such cutters for rock fragmentation during shaft sinking remain limited.
In summary, extensive experimental and numerical investigations have been conducted to explore the rock fragmentation mechanisms of roller cutters. These studies mainly focus on optimizing the structural parameters of rock-breaking tools using specific energy, crack length, and crack number as evaluation criteria. Such investigations provide both theoretical and practical references for the symmetrical structural optimization of milled-tooth roller cutters. However, studies by Wang et al. [49] and Cheng et al. [50] indicated that rock fragmentation by PDC bits was predominantly achieved through cutting, whereas disc-type and inserted-tooth roller cutters mainly relied on the rolling–compression mechanism. In contrast, milled-tooth roller cutters exhibit a combined rock fragmentation mode involving rolling–compression, shear, and tensile actions. Moreover, milled-tooth roller cutters differ from PDC bits, disc-type roller cutters, and inserted-tooth roller cutters in terms of cutter and tooth shape and size, as well as the rock fragmentation environment. Notably, the weakly cemented rocks encountered during the operation of milled-tooth roller cutters differ significantly in their physical properties from the hard rocks typically excavated by oil drilling rigs or tunnel boring machines. In addition, the existing literature lacks systematic studies on the optimization of diameter, cone angle, and tooth geometry of milled-tooth roller cutters used in drilling-based shaft excavation. Therefore, in this study, an orthogonal experimental scheme with four factors and three levels was developed based on the FDEM and the energy–strength criterion. This scheme was used to investigate the effects of various parameters on average force, specific energy, damage factor, and proportion of shear cracks in milled-tooth roller cutters. Subsequently, the efficacy coefficient method was applied to comprehensively assess these performance indicators and determine the optimal symmetrical structure of rock-breaking roller cutters. The findings of this study are expected to provide theoretical insights into the symmetrical structures and optimization of milled-tooth roller cutters employed in shaft excavations in western China.
2. Engineering Description
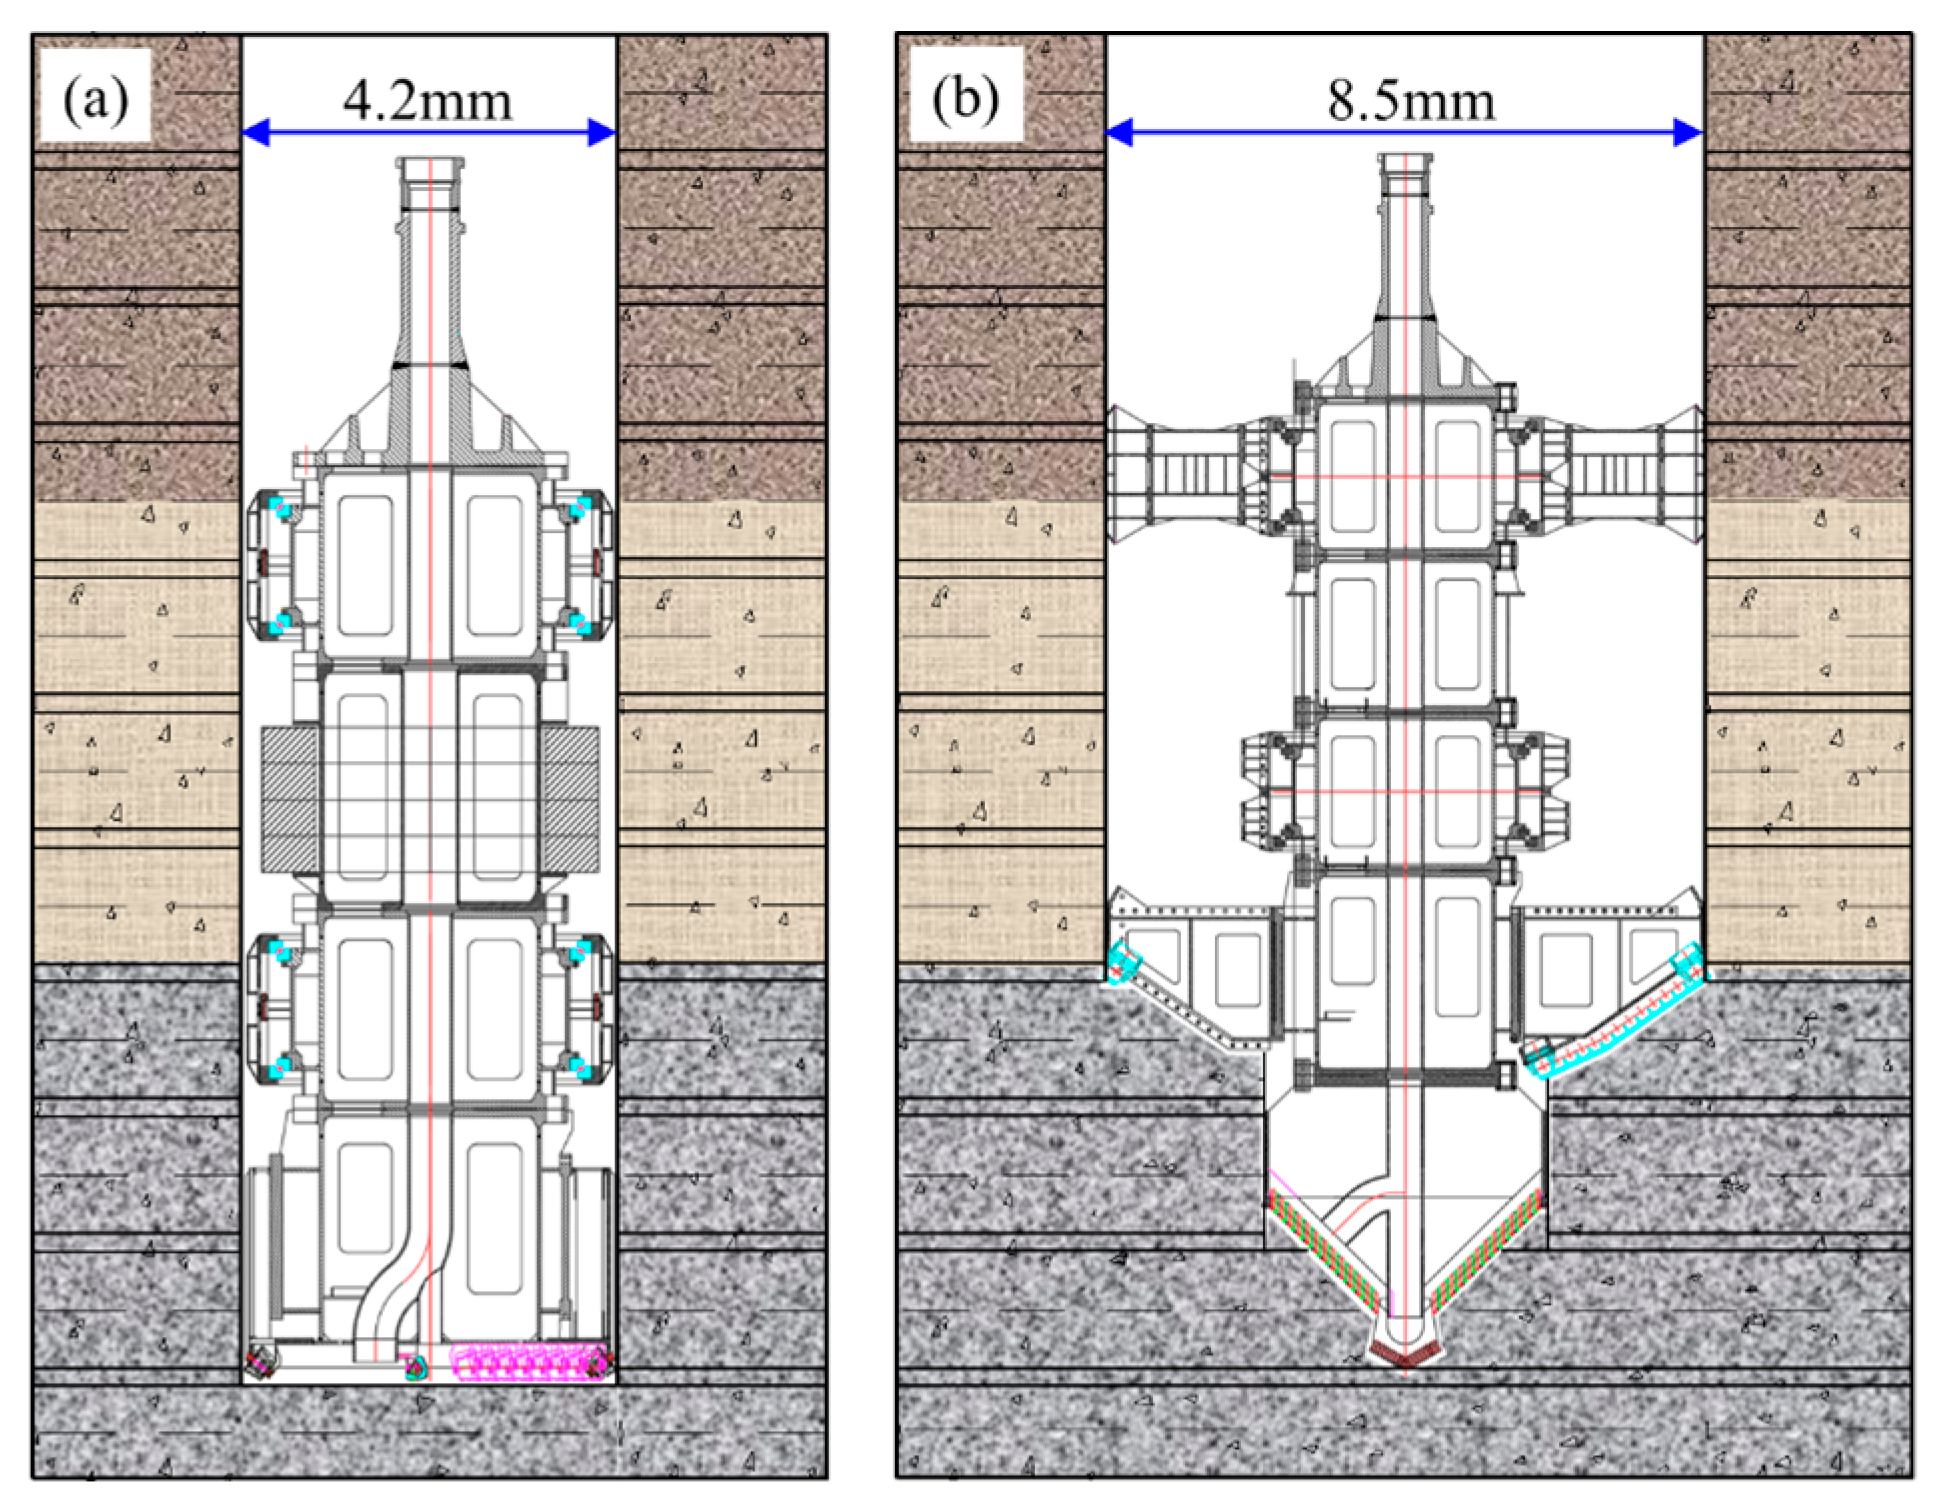
The mine, located in Yulin, Shaanxi Province, was designed for an annual production capacity of 10 million tons. The surface layout includes main and auxiliary shafts, a central ventilation system with intake and return air shafts, and an additional return air shaft at the northern ventilation site. The northern ventilation shaft was designed to reach a depth of 522.5 m, with an internal diameter of 6 m and a drilling diameter of 8.5 m. Its construction adopted a “one-drilling, one-expansion” scheme, using an advanced drilling diameter of φ4.2 m followed by an expansion diameter of φ8.5 m. The shaft penetrates the Quaternary surface soil layer, the Cretaceous Luohe Group, the Jurassic Anding Group, the Jurassic Zhiluo Group, and the Jurassic Yan’an Group. The Cretaceous strata are predominantly composed of fine-, medium-, and coarse-grained sandstones. In contrast, the Jurassic formations mainly consist of sandy mudstone, mudstone, siltstone, and fine- to medium-grained sandstones.
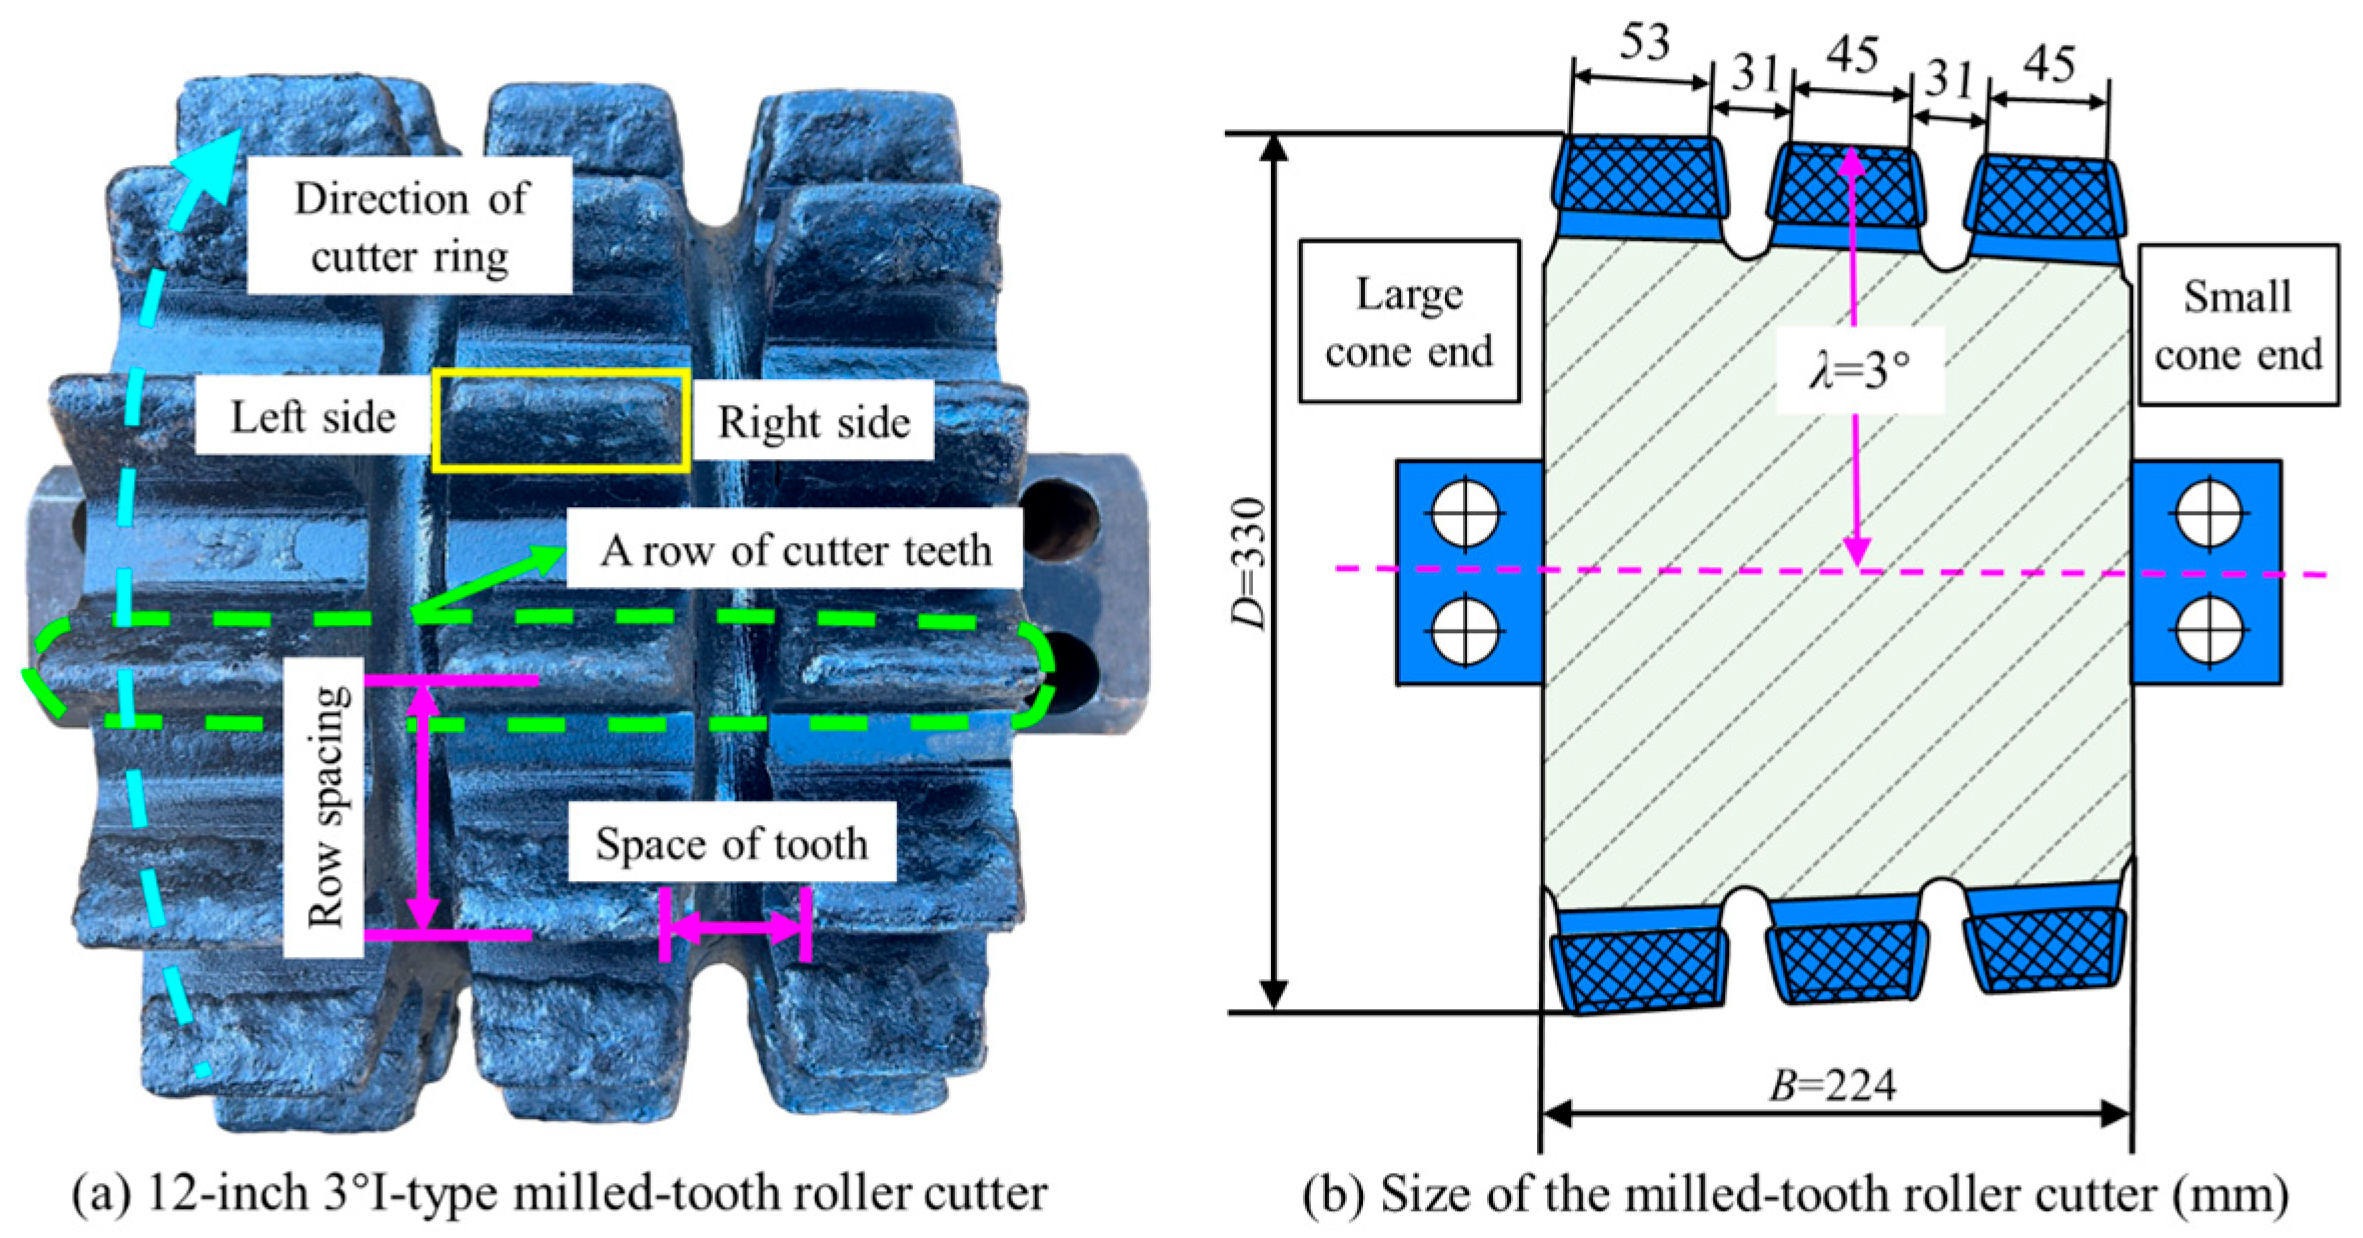
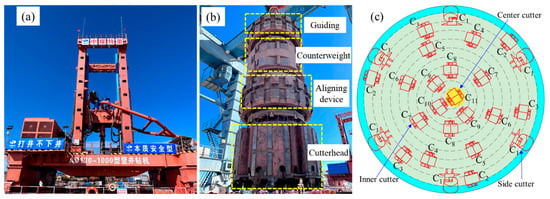
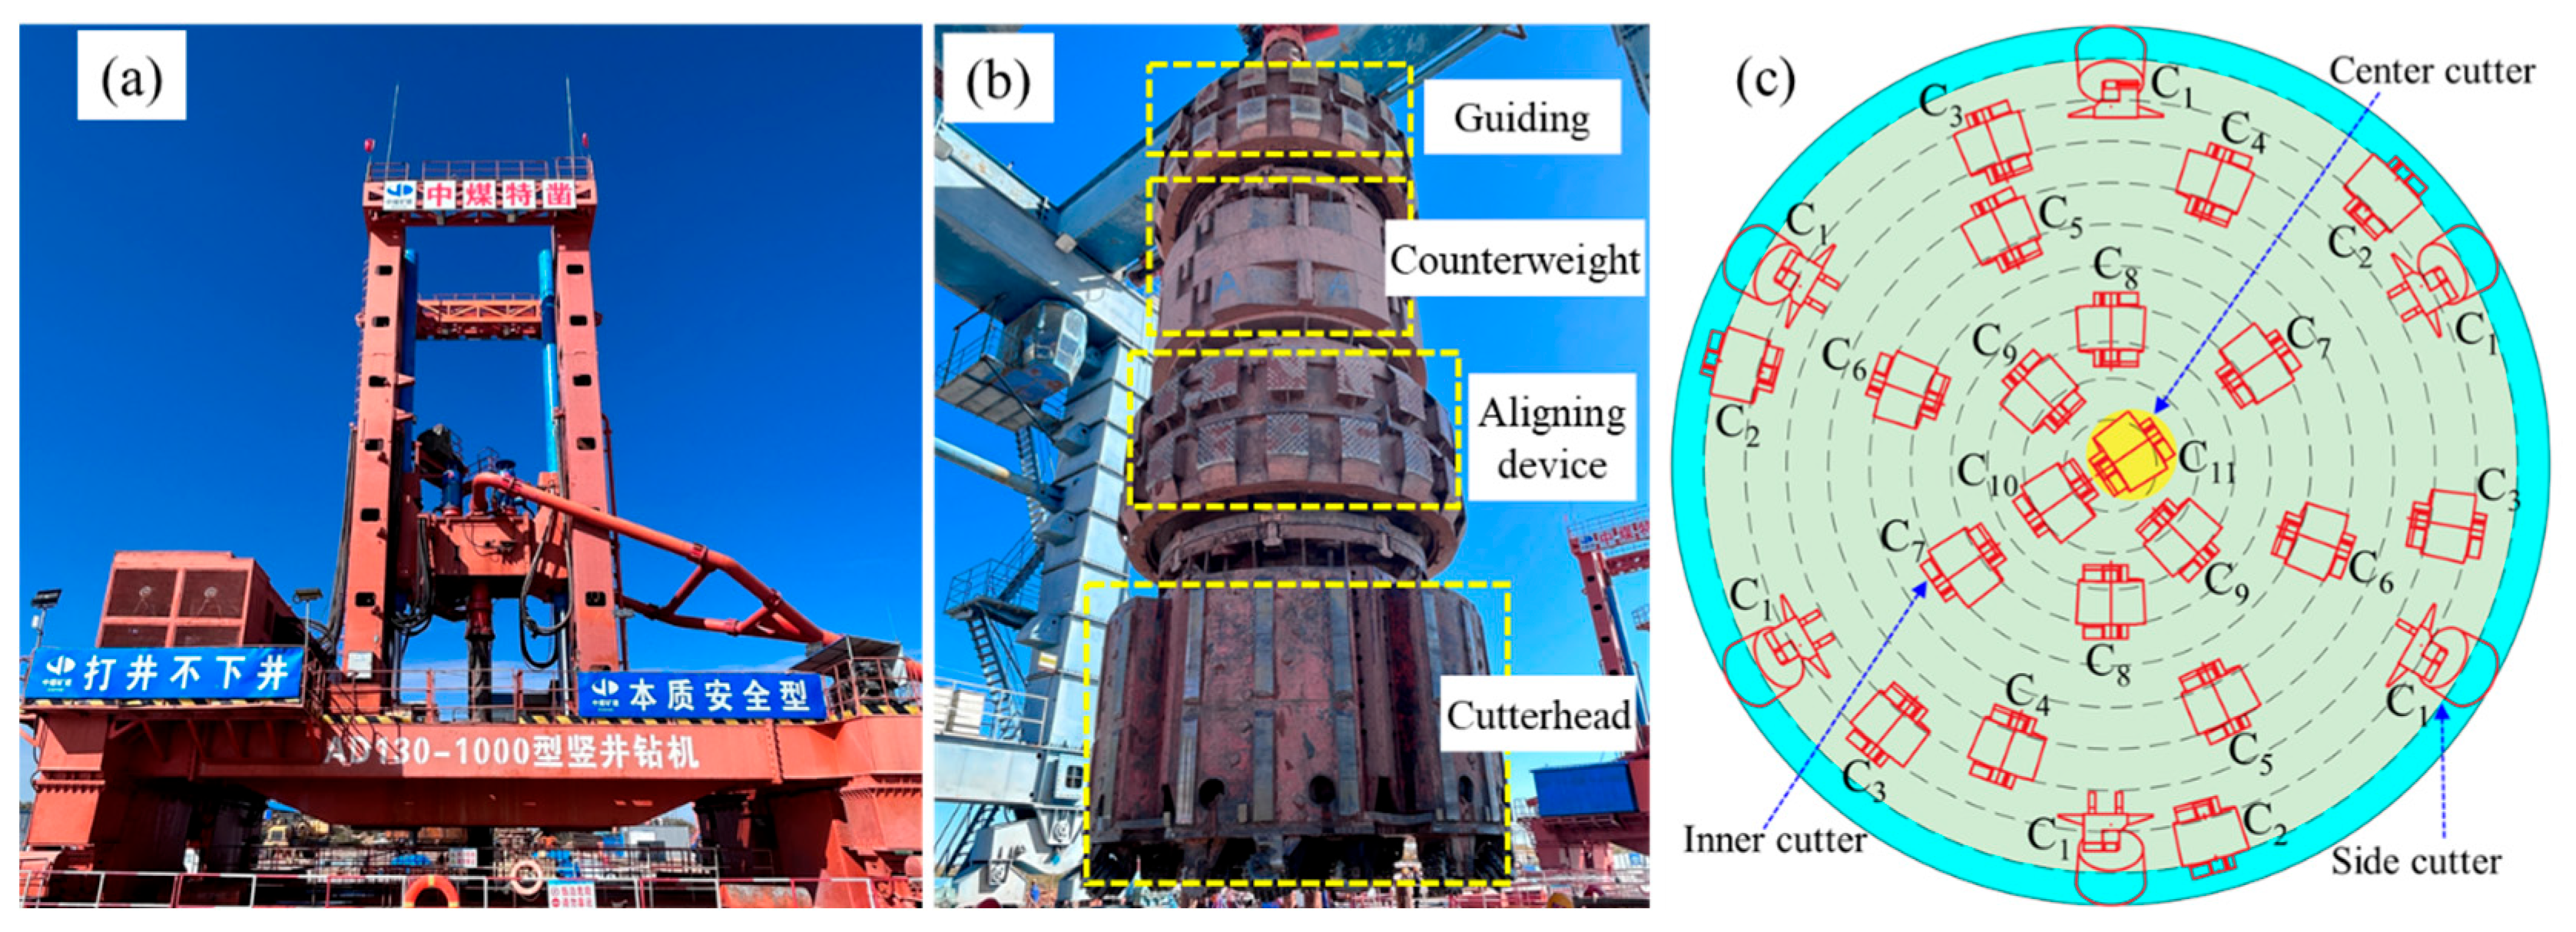
The northern return air shaft was excavated using an AD130/1000 full-hydraulic power-head drilling rig. Drill bits with diameters of φ4.2 m and φ8.5 m were employed in the pilot drilling and reaming stages, respectively (Figure 1). When equipped with a φ4.2 m bit, the AD130/1000 rig provides a maximum drilling pressure of 1200 kN and a maximum torque of 700 kN·m and is fitted with 26 roller cutters. During drilling in Jurassic strata, milled-tooth roller cutters are primarily used (Figure 2). The cutterhead layout of the AD130/1000 rig with the φ4.2 m drill bit is shown in Figure 3, and the corresponding installation radii of the roller cutters are listed in Table 1. The φ4.2 m bit is equipped with six side cutters (denoted as C1), 19 inner cutters (denoted as C2–C10), and one central cutter (denoted as C11).
Figure 1.
Schematic diagram of one-drilling and one-expansion. (a) φ4.2 m advance drilling bit; (b) φ8.5 m reaming drill bit.
Figure 2.
Schematic illustration of the structure of the milled-tooth roller cutter.
Figure 3.
Schematic diagram of the AD130/1000 shaft drilling rig. (a) AD130/1000 drilling rig; (b) φ4.2 m weighted drill bit; (c) plan view of the cutter layout for the φ4.2 m drill bit.
Table 1.
Installation radius of roller cutters for φ4.2 m cutterhead.
3. Introduction to FDEM and Numerical Simulation Scheme
3.1. Overview of Numerical Methods
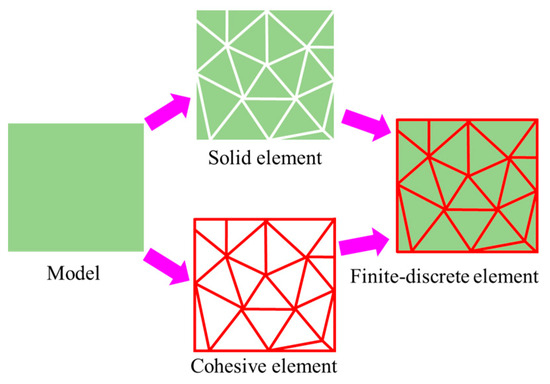
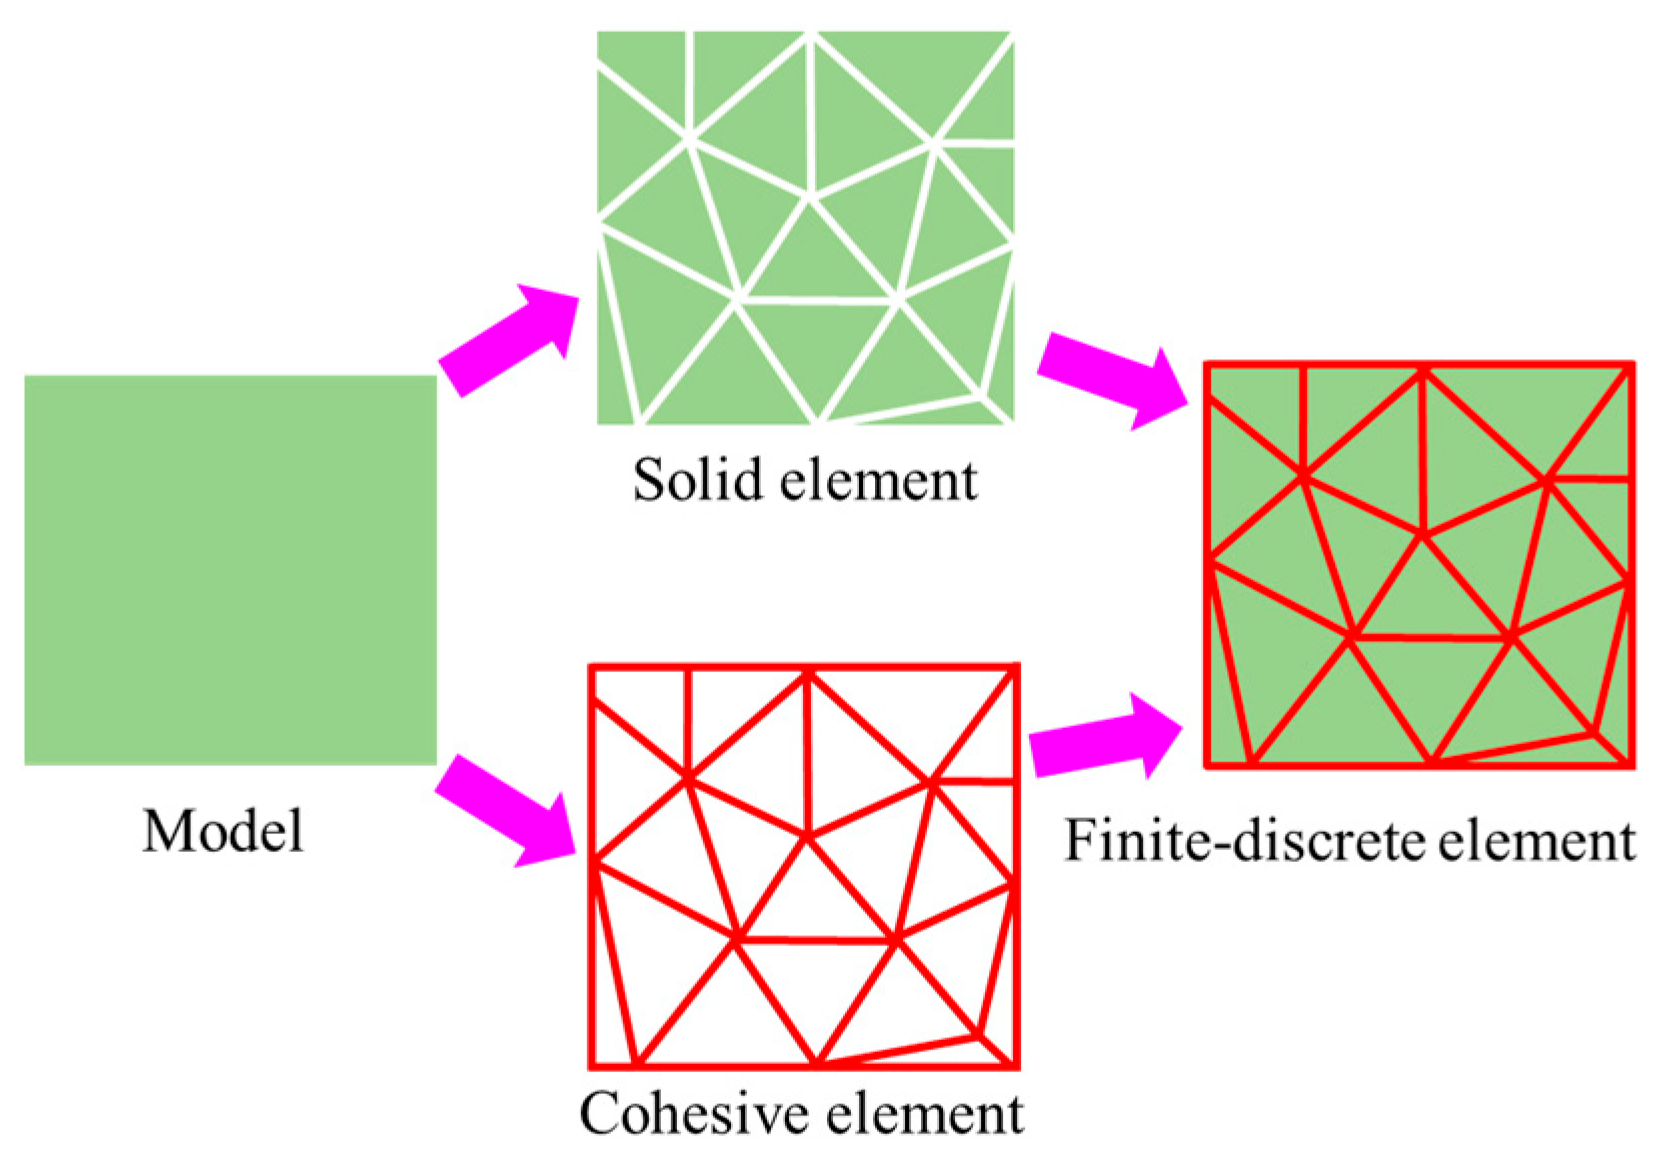
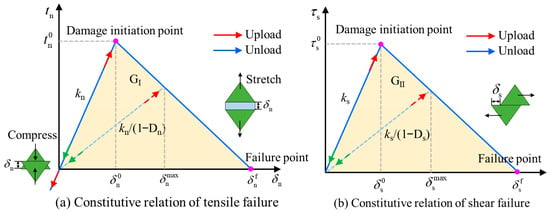
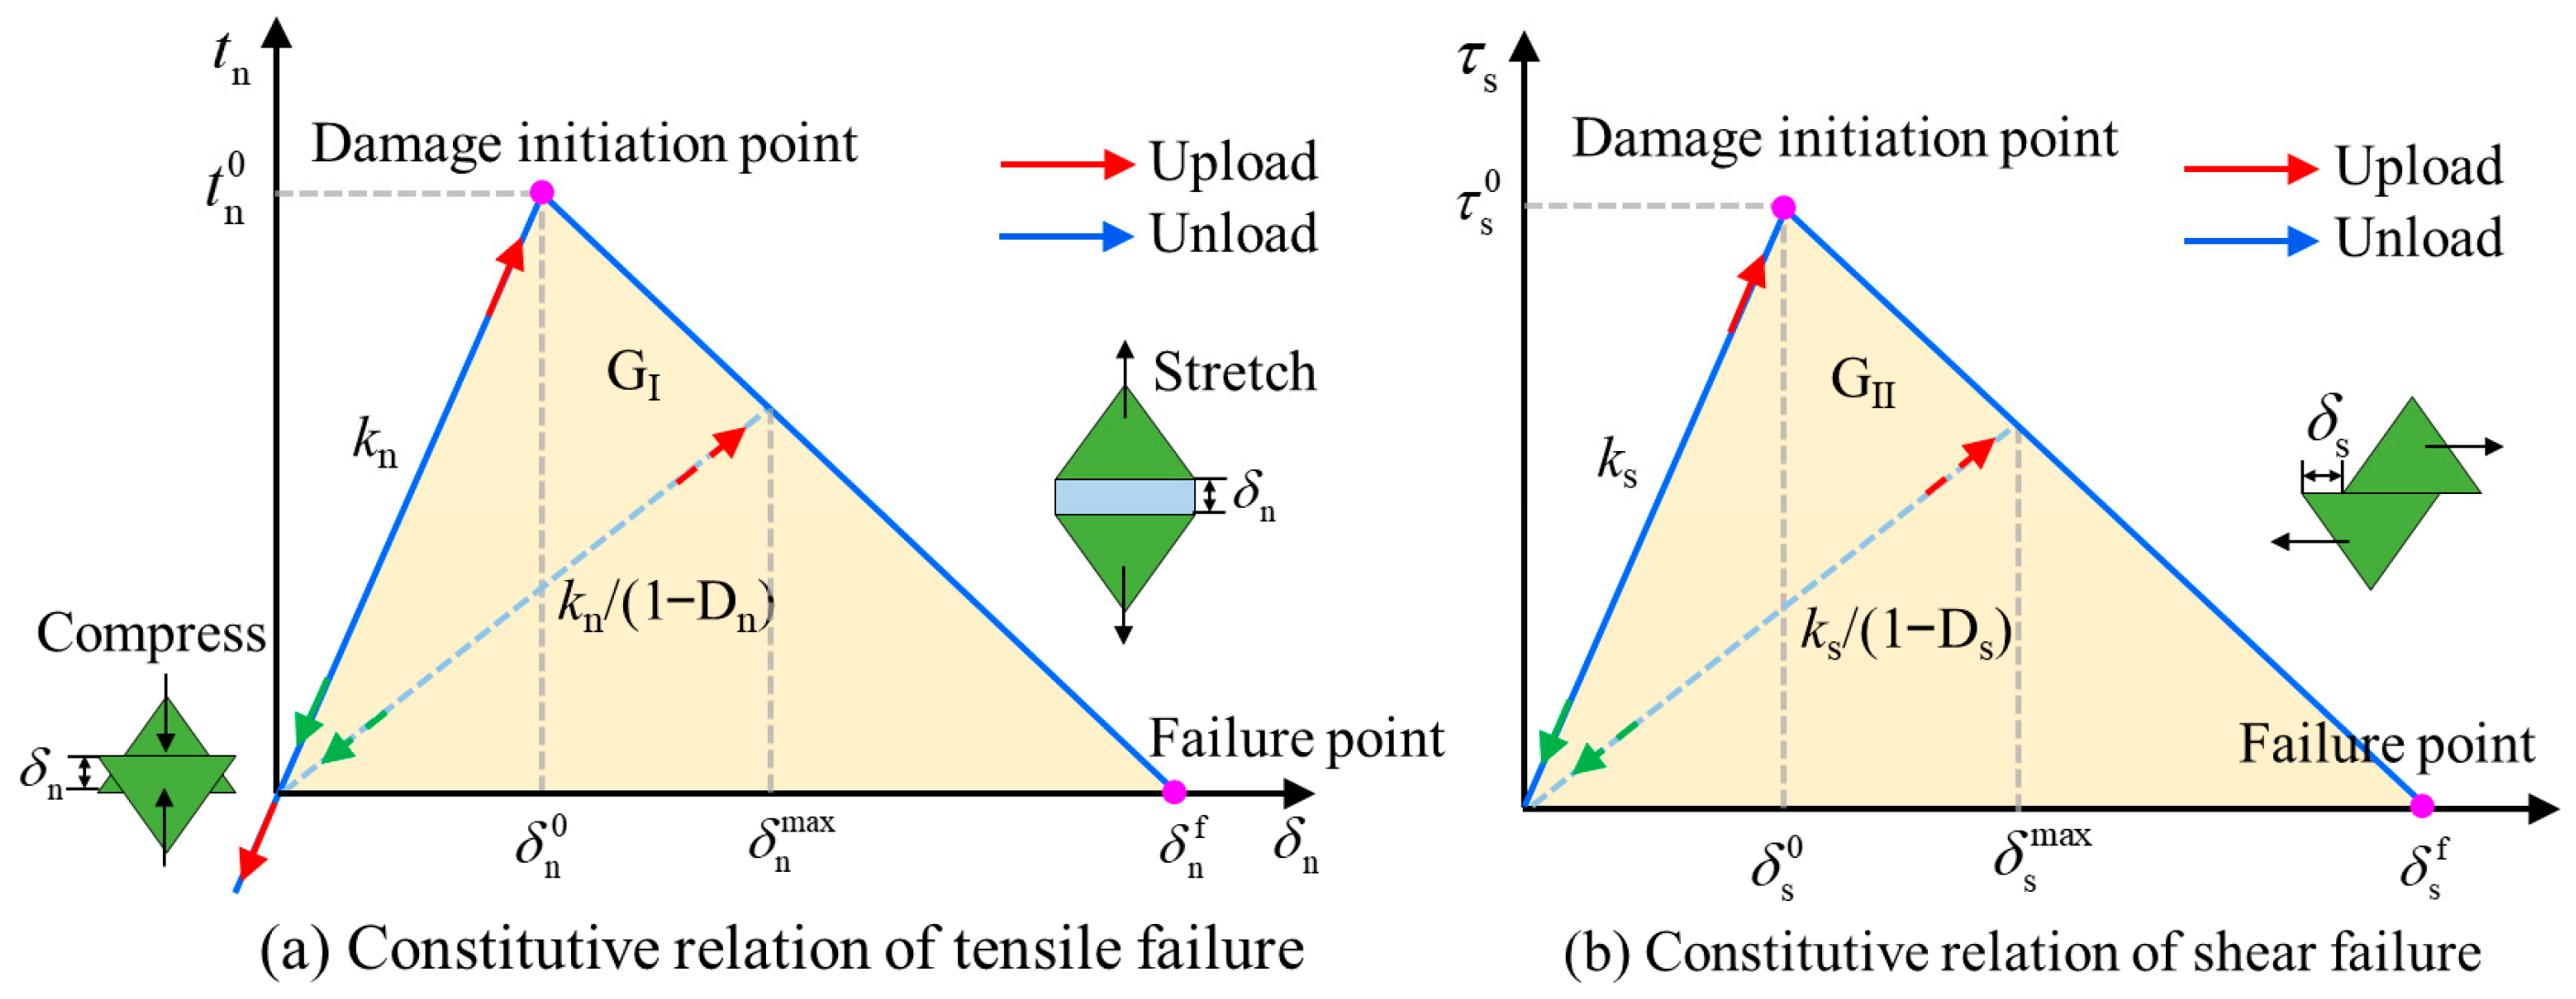
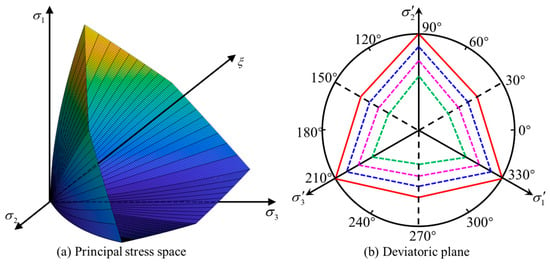
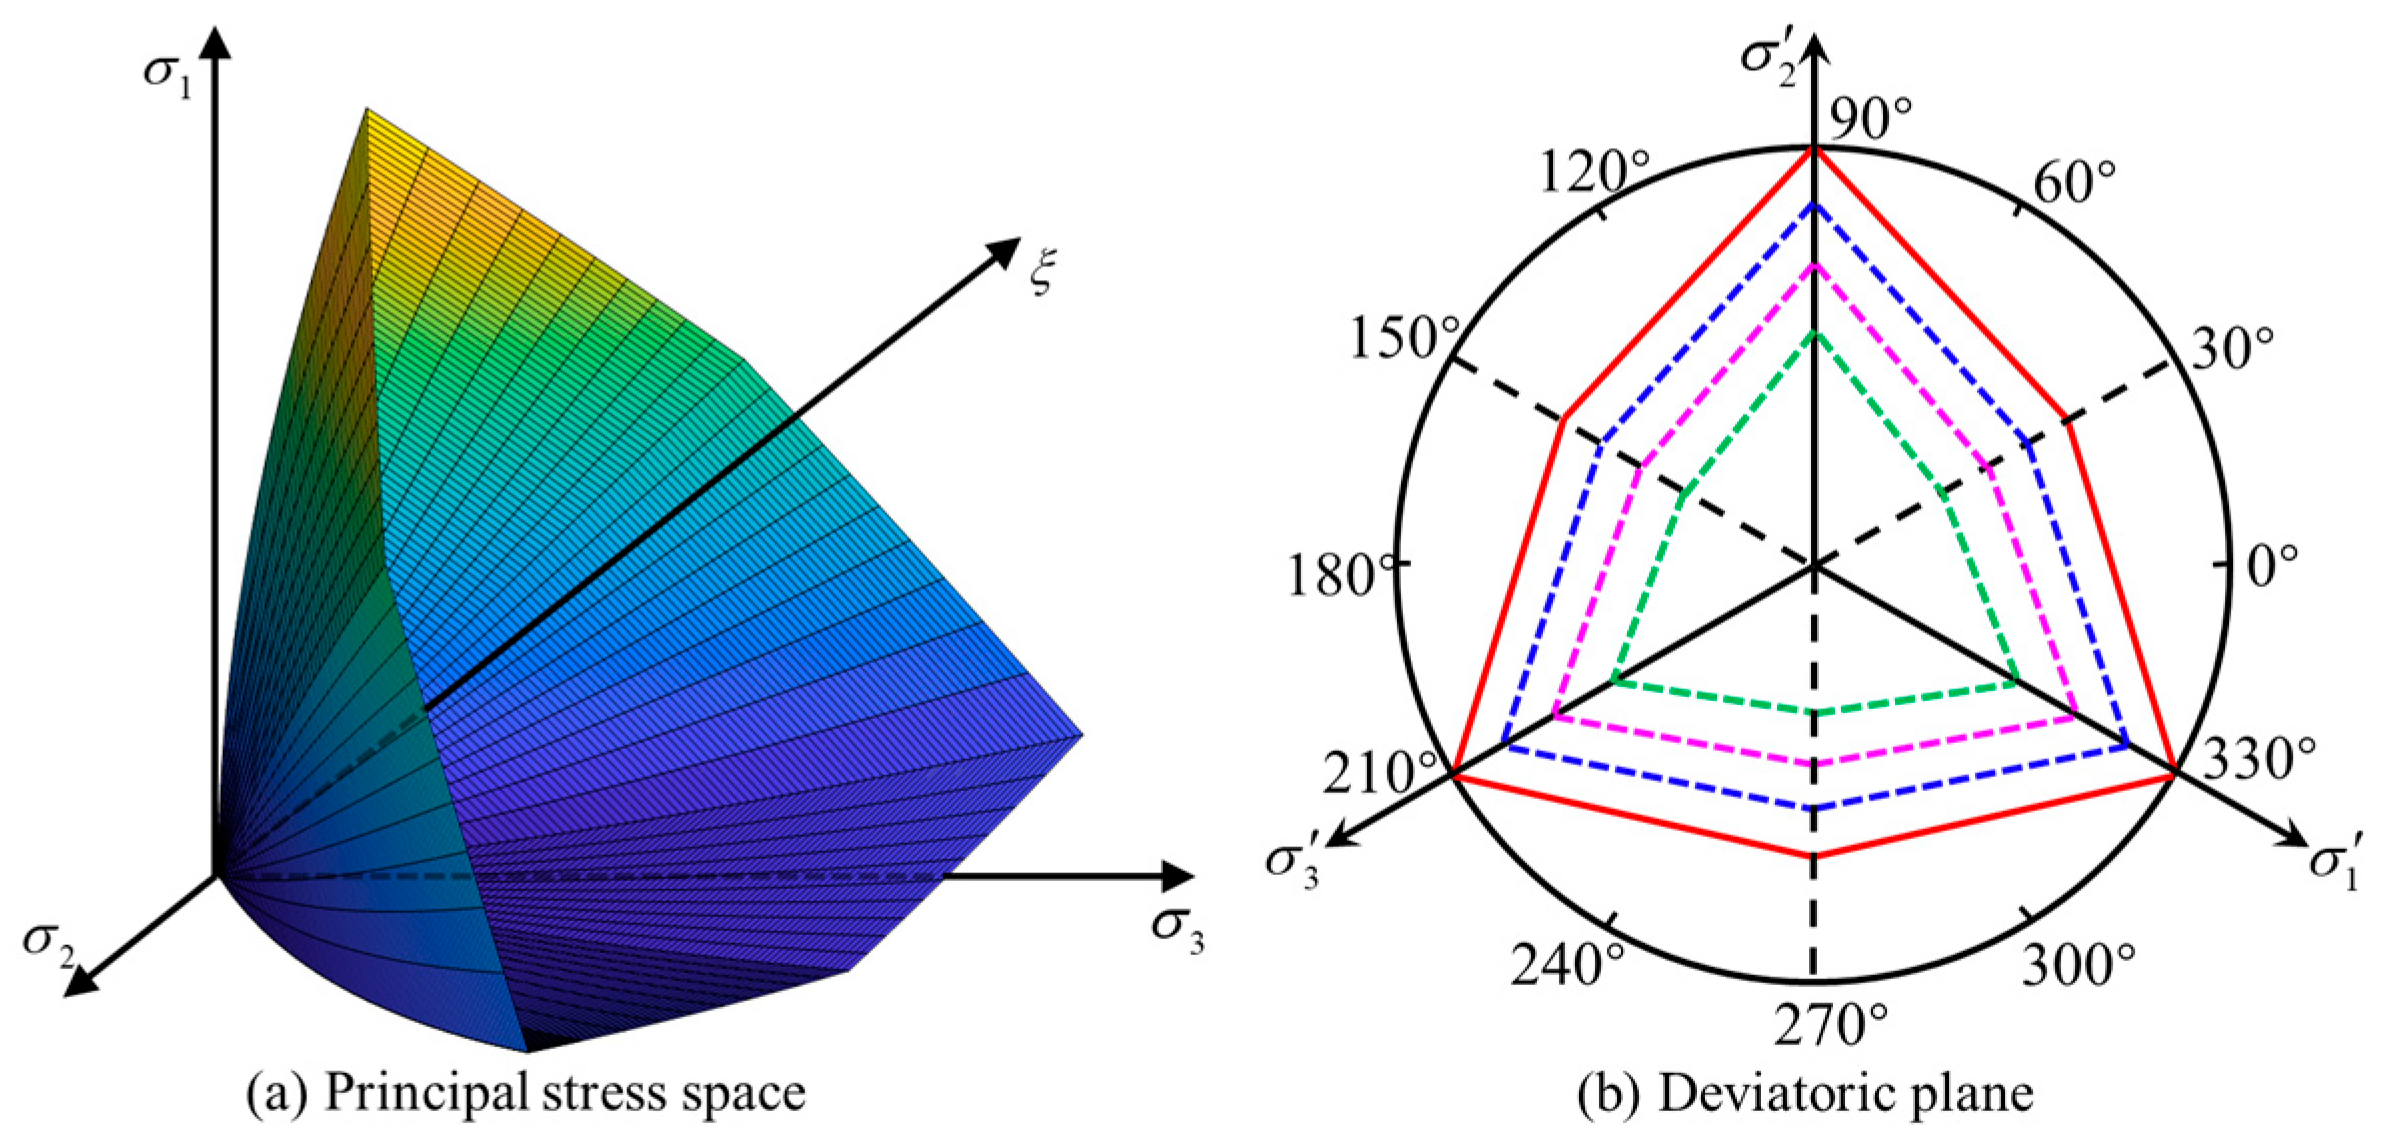
In the FDEM approach, zero-thickness fracture interface elements are inserted along the interfaces of solid elements (Figure 4) [40]. These fracture interface elements were used to capture the deformation, fracture, and crack propagation behaviour of rocks by incorporating their damage and failure properties. This method effectively combines the advantages of finite element and discrete element techniques. For a detailed description of the FDEM, the reader is referred to Wang et al. [49]. In this study, fracture interface elements were implemented using the BK mixed-mode fracture criterion (Figure 5), whereas the failure of solid elements followed an energy–strength criterion. The principal stress and stress-invariant expressions associated with the energy–strength criterion are defined in Equations (1) and (2), respectively. The corresponding yield surface is shown in Figure 6.
where represents the uniaxial compressive strength, which is 31.59 MPa for the rock material used in this study; E is the elastic modulus (GPa); corresponds to the first invariant of the stress tensor; denotes the second invariant of the deviatoric stress tensor; represents the Lode angle; and m and s are parameters of the energy–strength criterion, with m set to 0.023 and s set to 1 in this study. The energy–strength criterion was then incorporated into the numerical simulation. This implementation primarily involves two aspects: smoothing (or regularization) of the strength criterion and development of a stress update algorithm.
Figure 4.
Finite-discrete element model.
Figure 5.
Constitutive model of cohesive elements.
Figure 6.
Failure surface governed by energy–strength criterion [51].
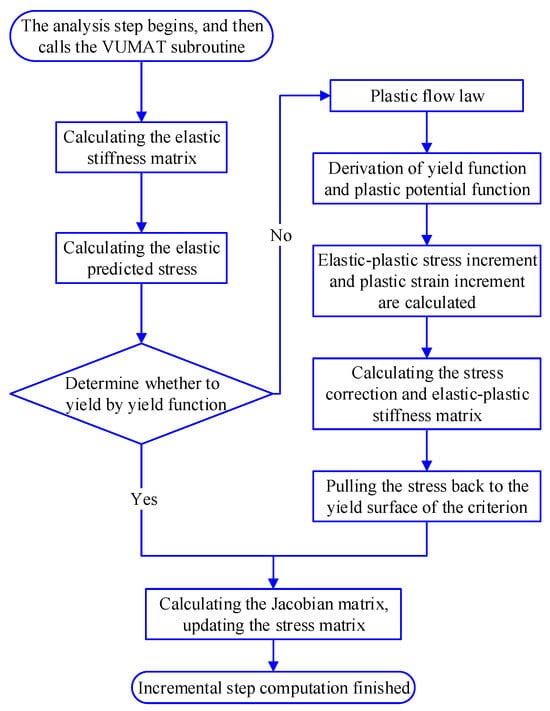
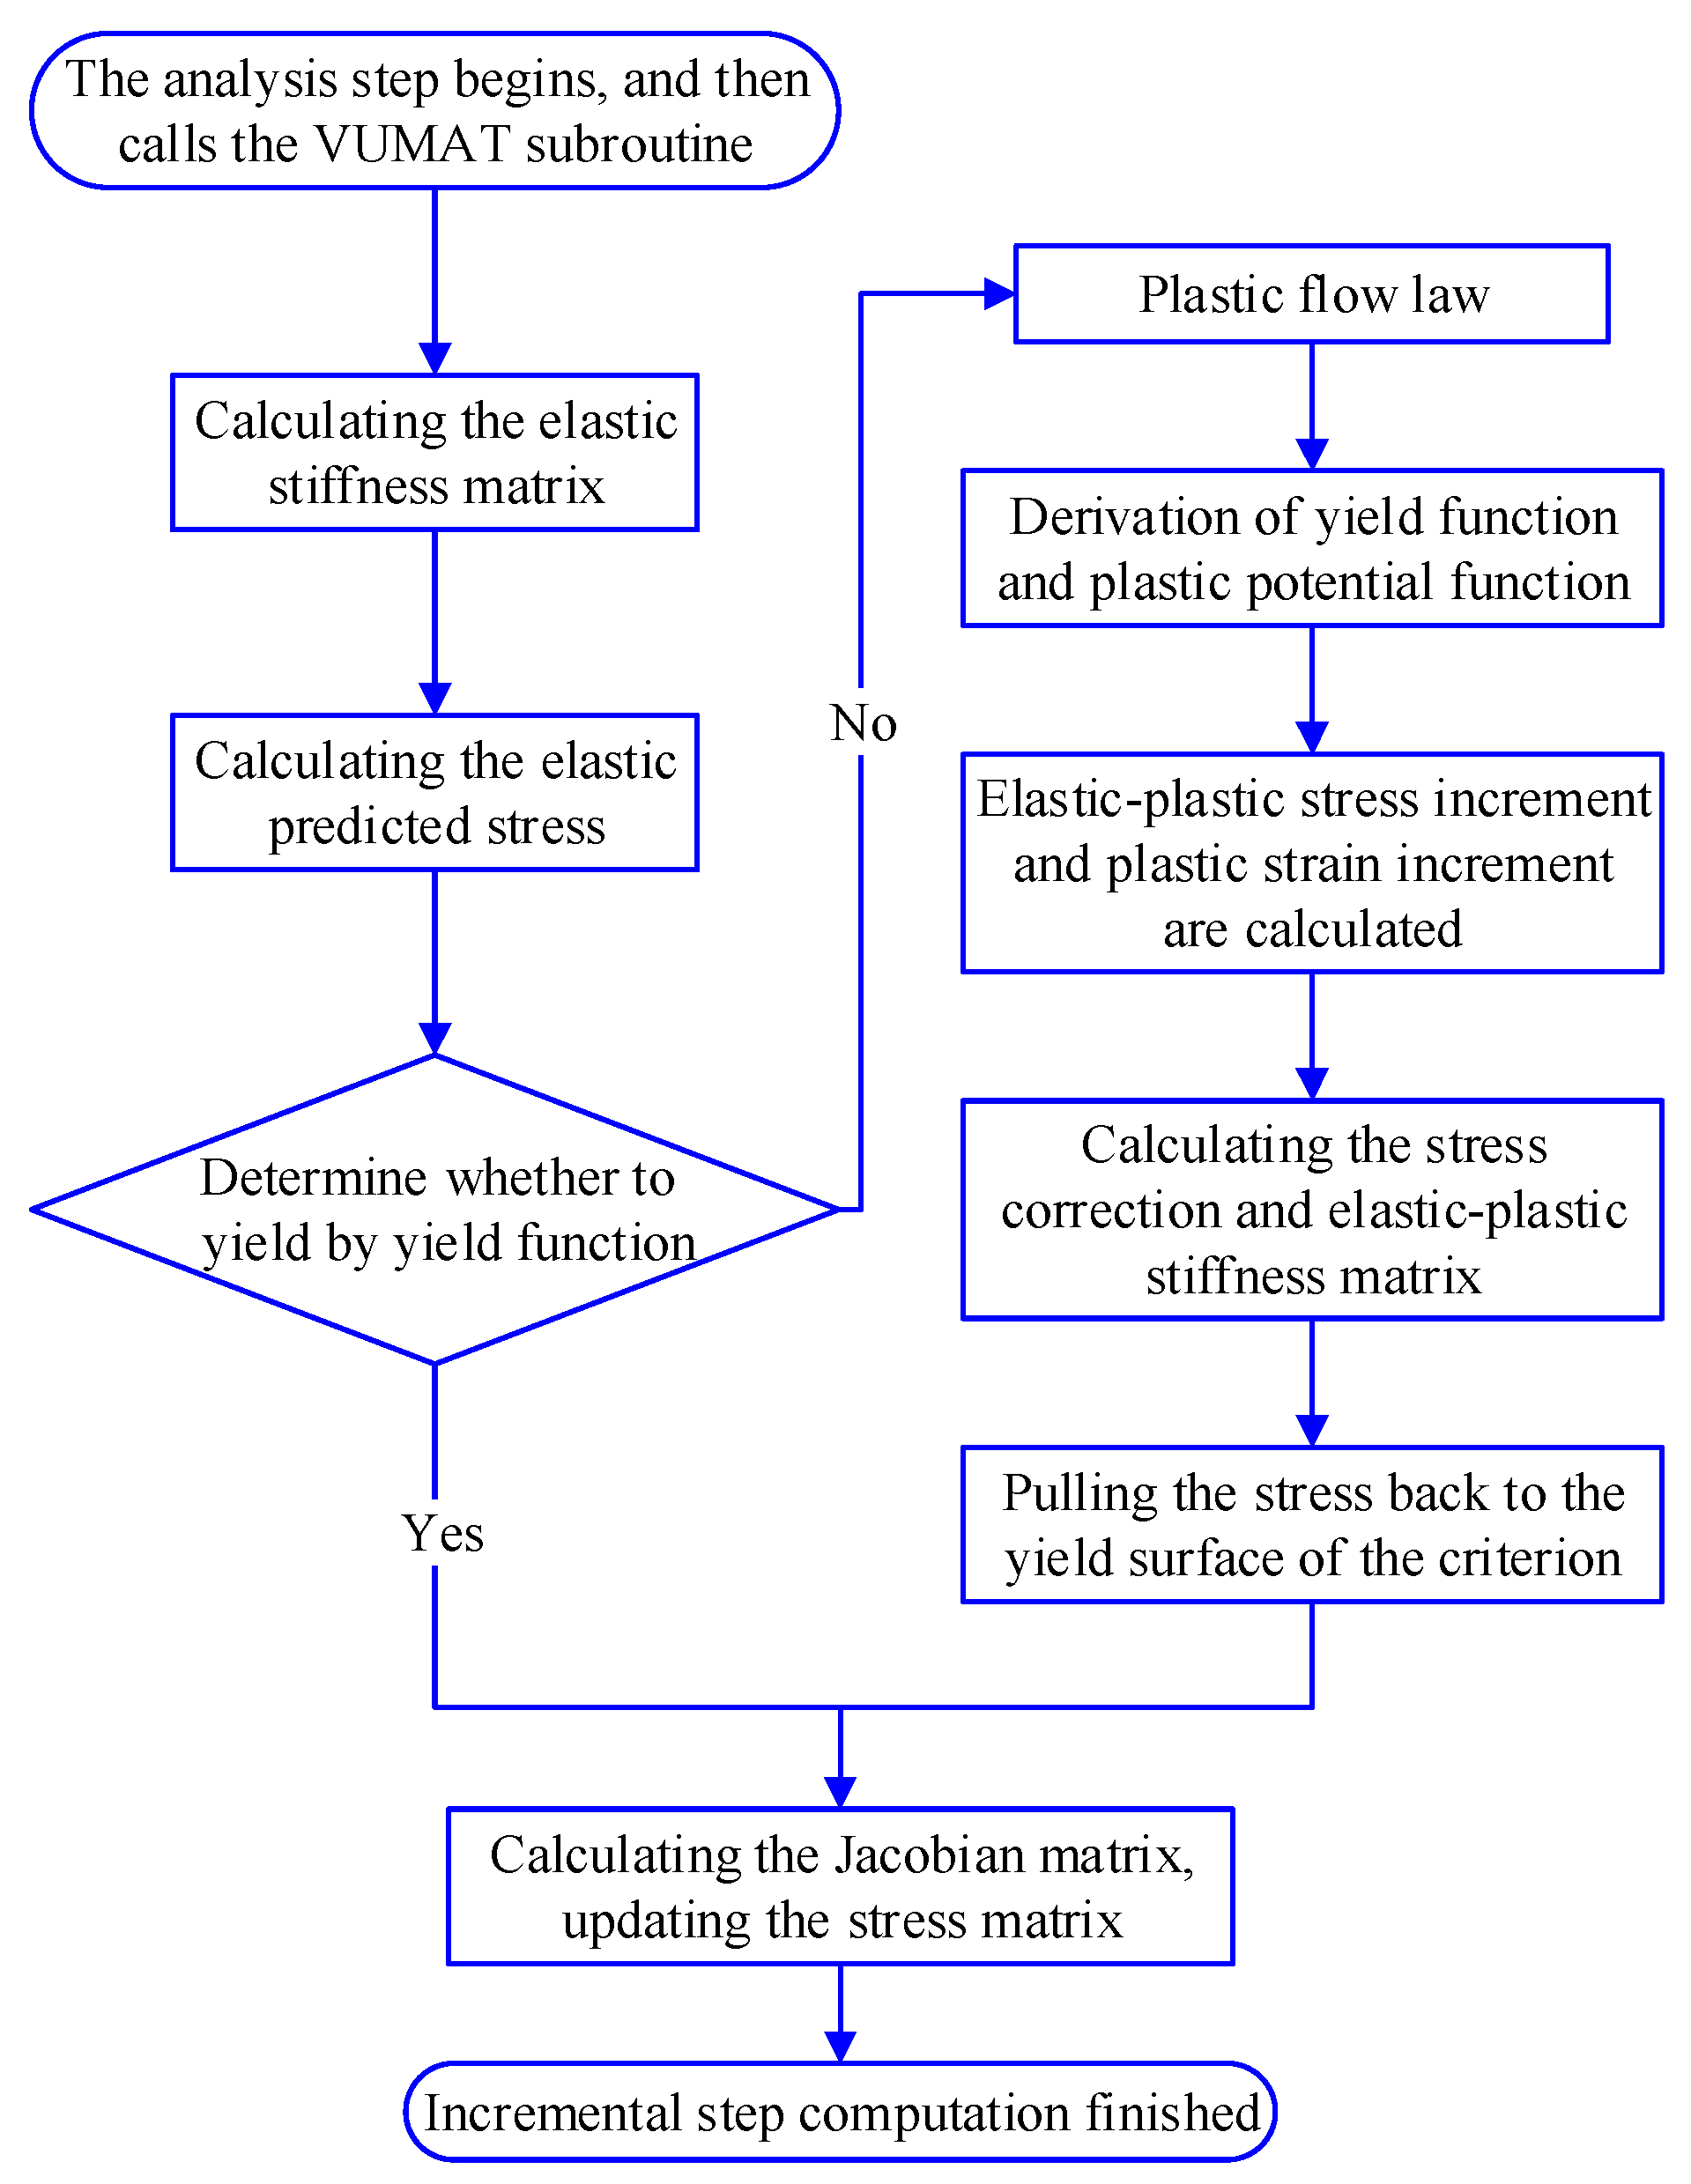
In this study, a VUMAT (user-defined material mechanical behaviour) subroutine based on the energy–strength criterion was developed using Fortran. The subroutine was then integrated into ABAQUS software (2023). At the beginning of each increment, the stress tensor from the previous step was input into the VUMAT subroutine. After the calculations were completed, an updated stress state was obtained. Within the VUMAT subroutine, the true stress and other state variables were determined using an iterative procedure. This process enabled the updating of hardening parameters as well as state variables, such as the bulk modulus and shear modulus. The tangent constitutive matrix was derived from the DDSDDE array. The computational workflow of the VUMAT subroutine is illustrated in Figure 7.
Figure 7.
Computational flowchart of VUMAT subroutine [49].
3.2. Parameter Calibration
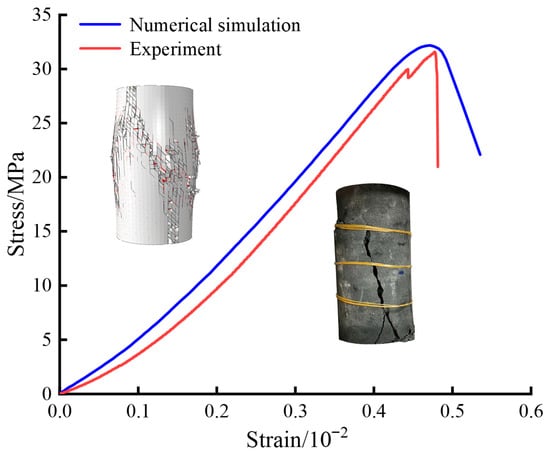
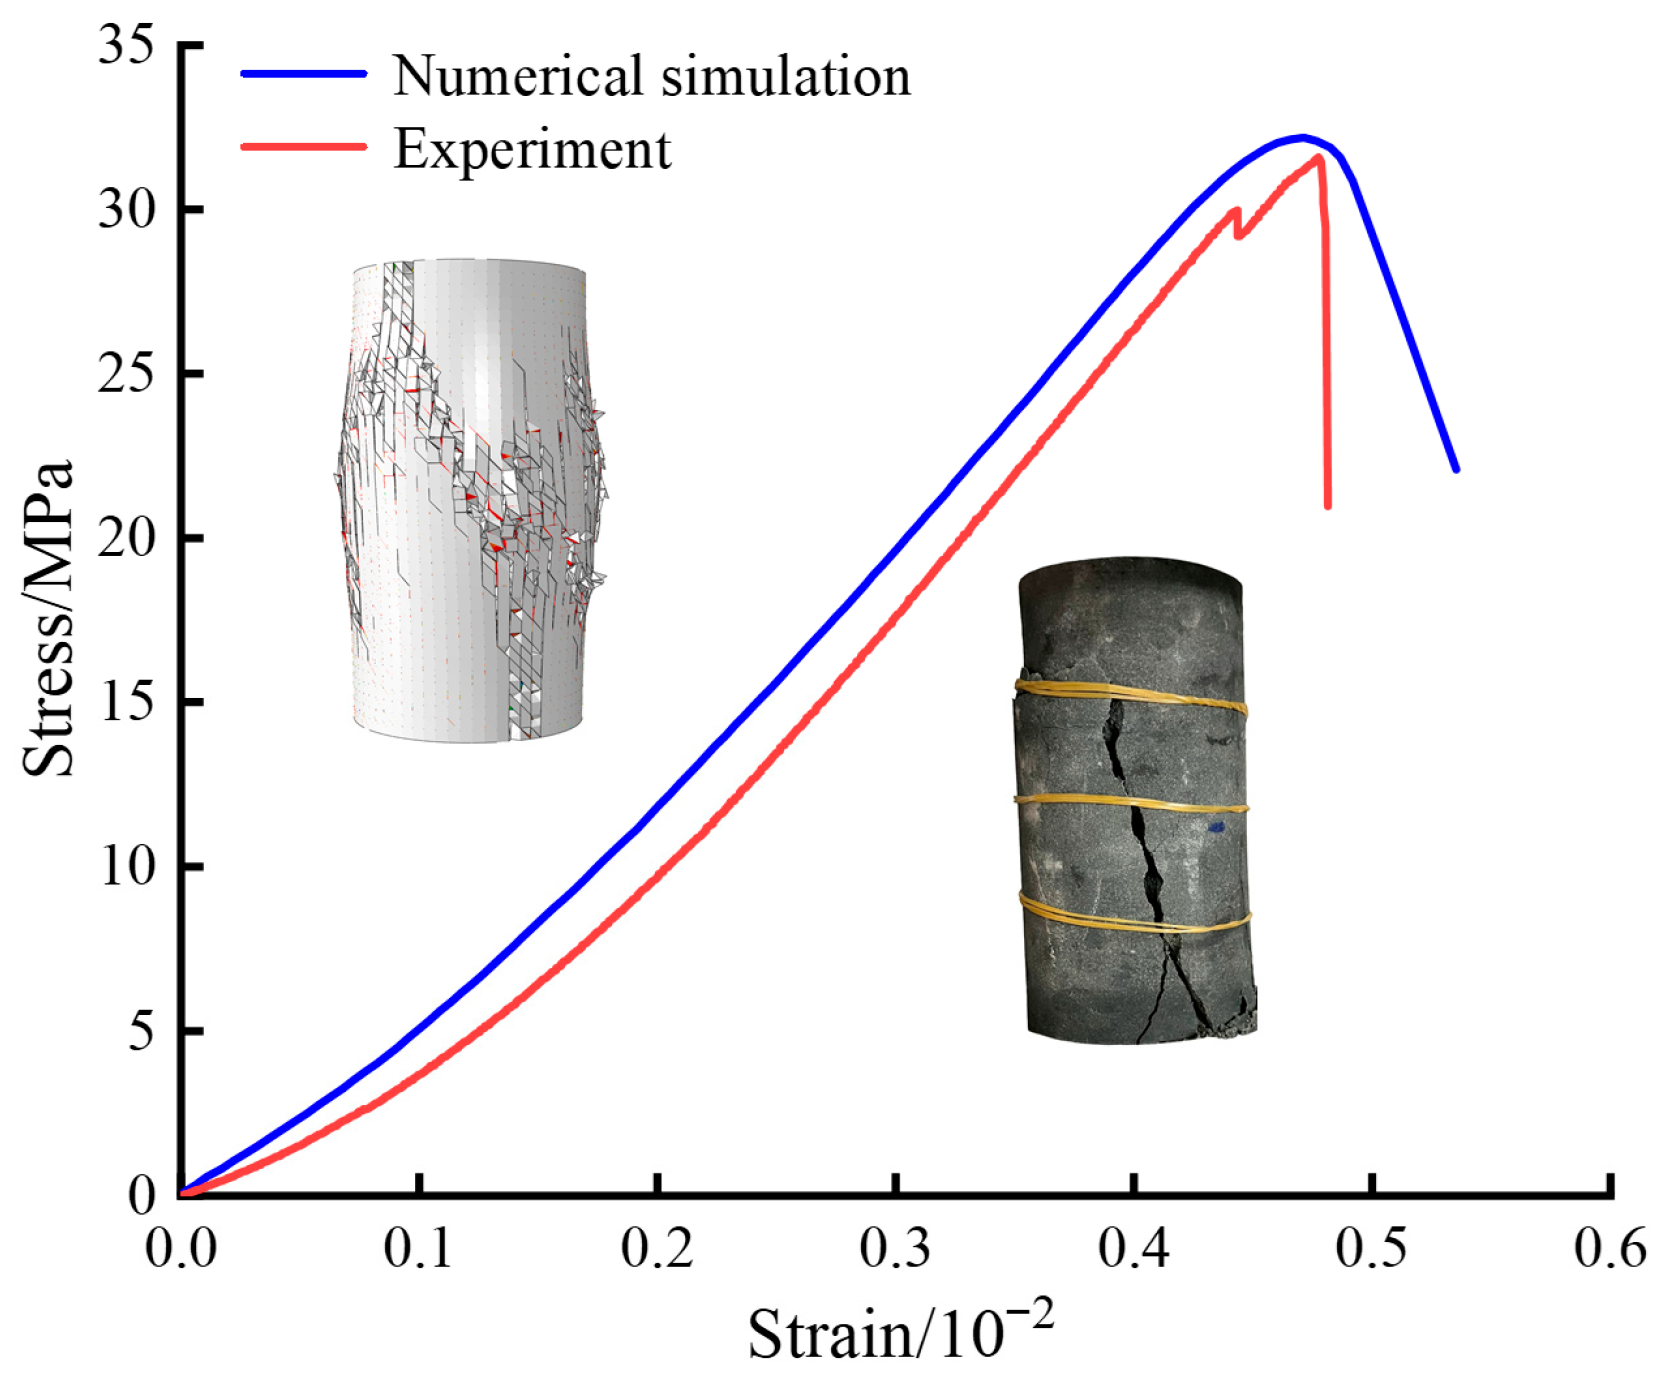
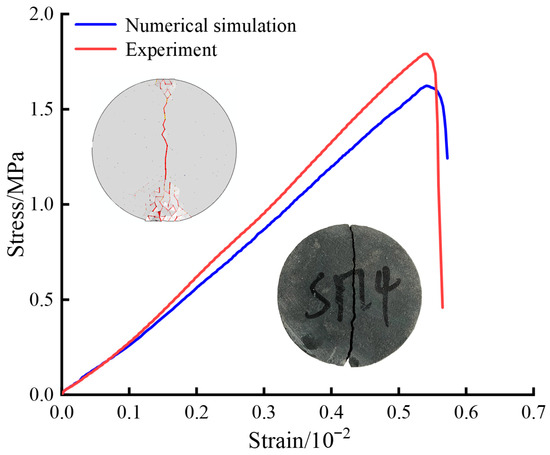
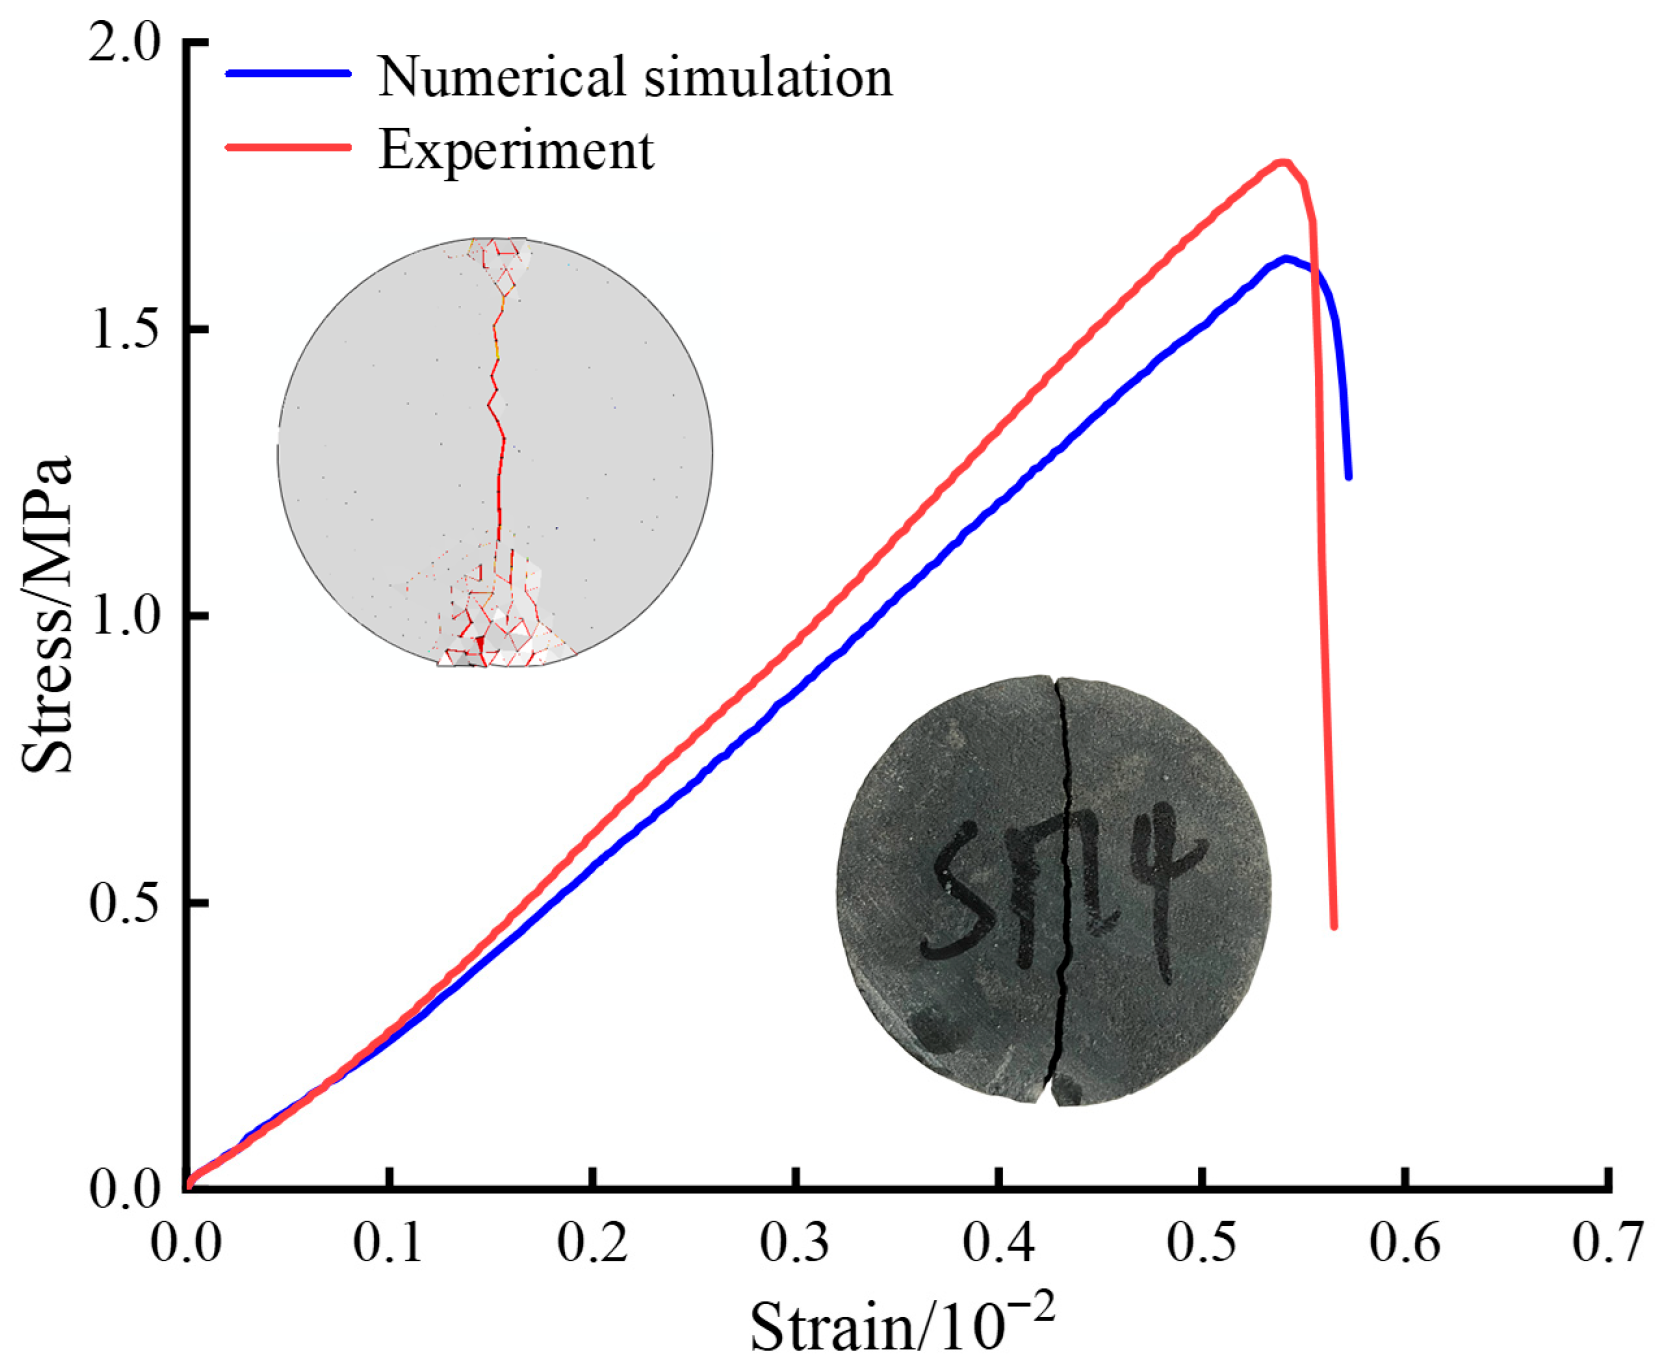
The parameters of the cohesive elements were calibrated based on uniaxial compression and indirect tensile testing. The specimens used in the uniaxial compression tests had dimensions of 50 mm in diameter and 100 mm in height, whereas those used in the indirect tensile tests had dimensions of 50 mm in diameter and 25 mm in thickness. In the numerical simulations of both tests, bulk material failure followed the energy–strength criterion, whereas the fracture interface elements followed the BK mixed-mode fracture criterion. Figure 8 and Figure 9 present the numerical responses of the model under uniaxial compression as well as Brazilian splitting tests, respectively.
Figure 8.
Stress–strain curves from uniaxial compression tests obtained from experiments and numerical simulations.
Figure 9.
Stress–strain curves from Brazilian splitting tests obtained from experiments and numerical simulations.
As shown in Figure 8 and Figure 9, the numerical simulation results showed excellent agreement with the experimental data. The maximum error in the uniaxial compression test was 2%, whereas that in the Brazilian splitting test was 9%. In addition, the simulated failure patterns exhibited strong agreement with the experimental observations, confirming the validity of the cohesive element parameters adopted in this study. The calibrated parameters are listed in Table 2.
Table 2.
Parameters of the elements.
3.3. Linear Cutting Rock-Breaking Model
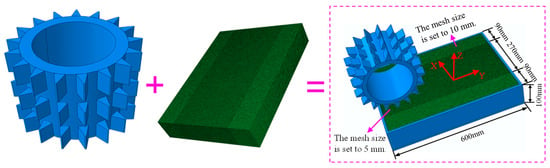
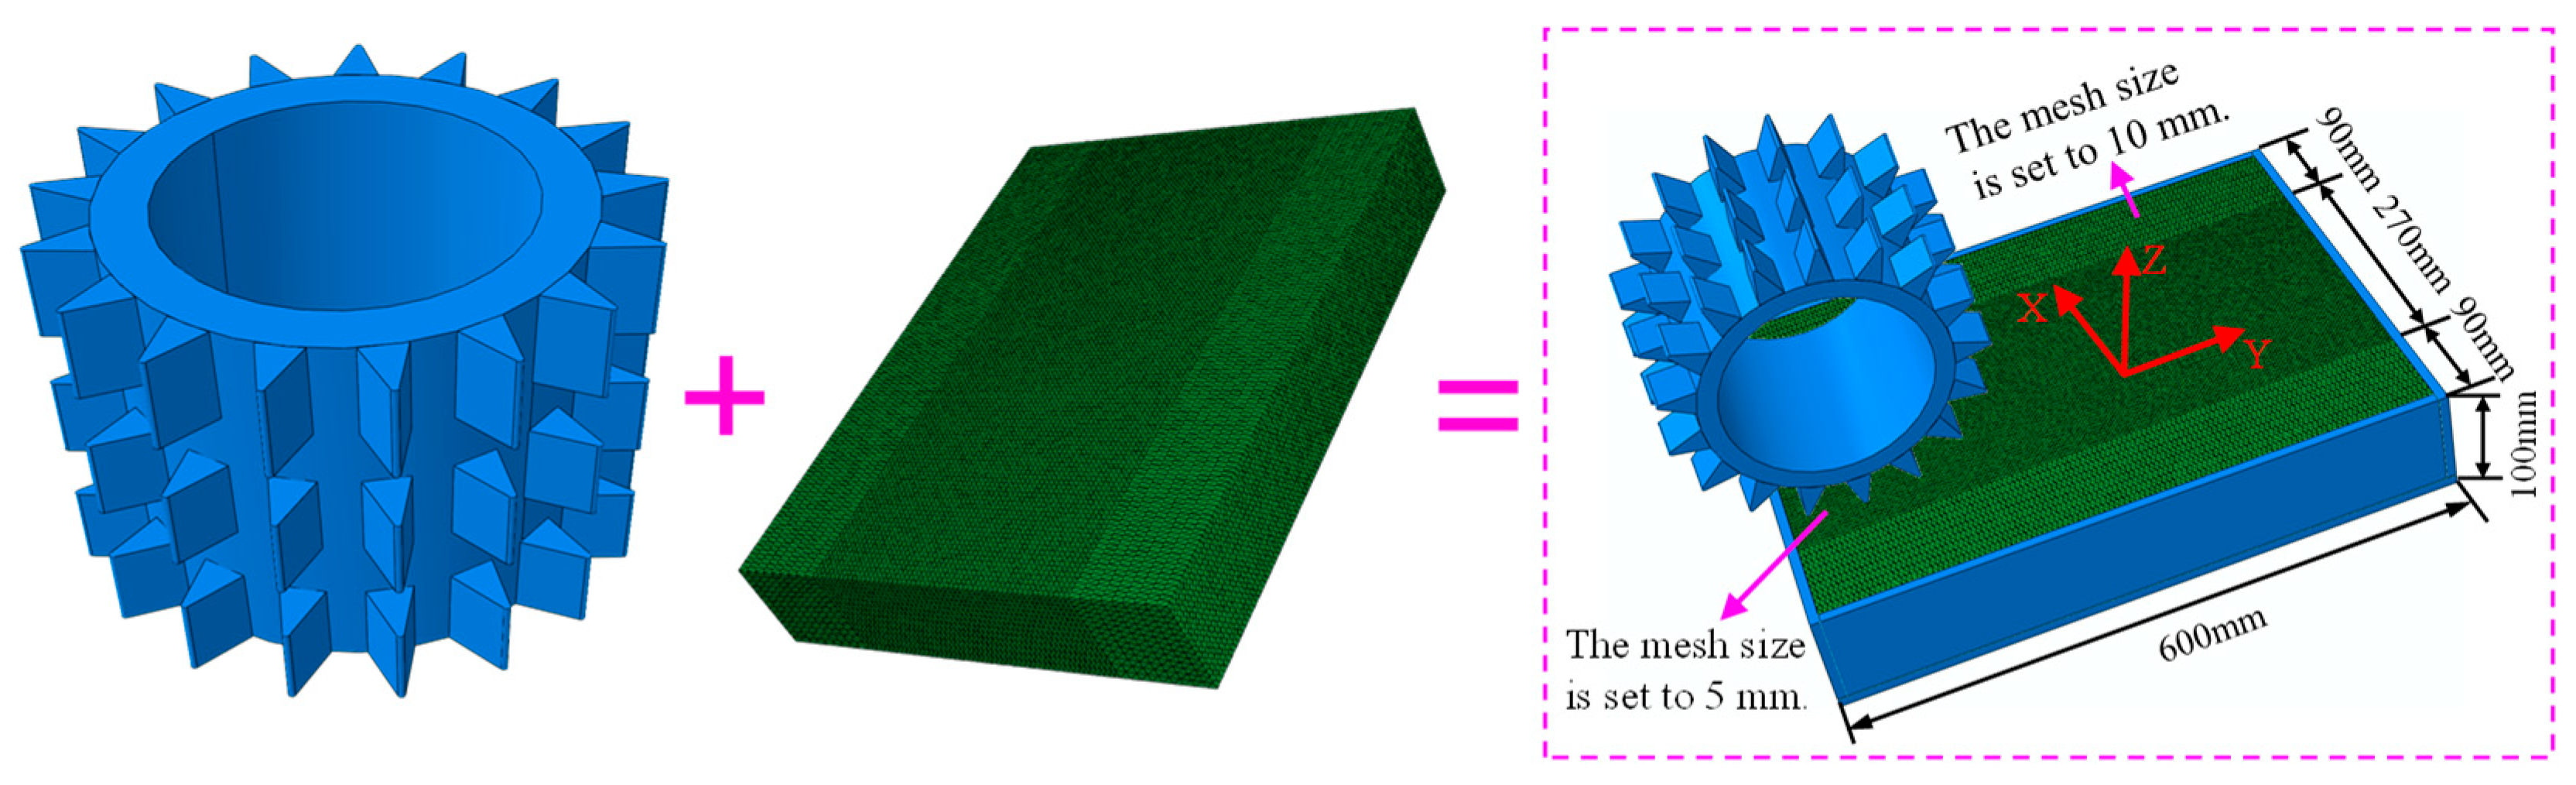
The linear cutting rock-breaking model of the roller cutter is shown in Figure 10. The rock specimen was defined with dimensions of 600 mm in length, 450 mm in width, and 100 mm in height It was discretized using C3D4 four-node tetrahedral elements. A refined mesh size of 5 mm was applied within the cutting zone, whereas a coarser mesh size of 10 mm was applied outside this region. The model comprised 782,226 solid elements and 1,541,796 cohesive elements. The cutter geometry was consistent with that of a field-deployed milled-tooth roller cutter and was considered as a rigid body. The bottom surface and surrounding sides of the rock specimen were constrained using steel plates, with fixed constraints applied in the X-, Y-, and Z-directions for each plate. The interaction between the cutter and the rock was simulated using a general contact algorithm. Friction at the cutter–rock interface was described by a penalty stiffness coefficient of 0.3, following the study by Wang et al. [49]. During the simulation, the roller cutter first moved along the negative Z-axis to reach the prescribed penetration depth. It then moved along the positive Y-axis at a cutting velocity of 100 mm/s. Furthermore, the model assumes that the roller cutter is unworn and operates under pure rolling conditions, and that the rock mass is homogeneous and isotropic.
Figure 10.
Numerical model.
3.4. Numerical Simulation Scheme
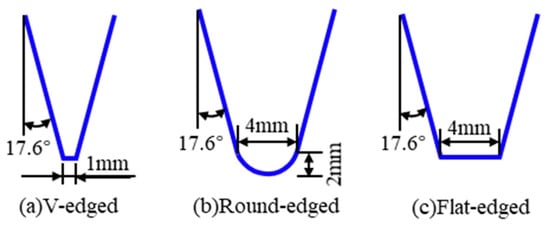
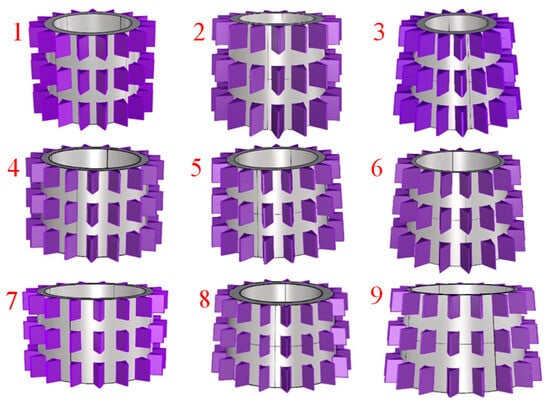
To explore the relationship between tool structure and both cutting efficiency and rock-breaking force, four experimental variables were selected: penetration depth (P), large cone-end diameter (D), cone angle (λ), and cutter tooth edge geometry (Figure 11). An orthogonal experimental design with four factors at three levels was implemented (Table 3). Based on this design, nine types of milled-tooth roller cutters with distinct tool body configurations were generated (Figure 12). Each cutter consisted of 17 rows of teeth, with three teeth per row and a uniform spacing of 31 mm. The first tooth at the large cone end had a length of 53 mm, whereas the remaining two teeth in each row were 45 mm in length. In addition, a numerical model was established for a milled-tooth roller cutter used in the field operations. The simulations were conducted under unconfined conditions at eight penetration depths of 0.5, 1, 1.5, 2, 2.5, 3, 3.5, and 4 mm for experimental validation.
Figure 11.
Schematic diagram of cutter tooth edge geometry.
Table 3.
Orthogonal experimental design.
Figure 12.
Numerical model of milled-tooth roller cutters.
4. Linear Cutting Test and Numerical Simulation Validation
4.1. Experimental Equipment and Test Scheme
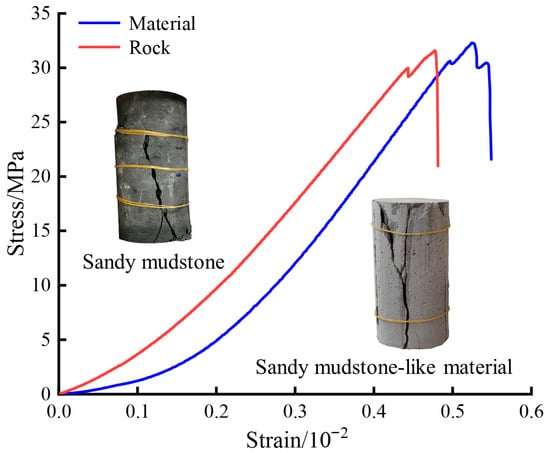
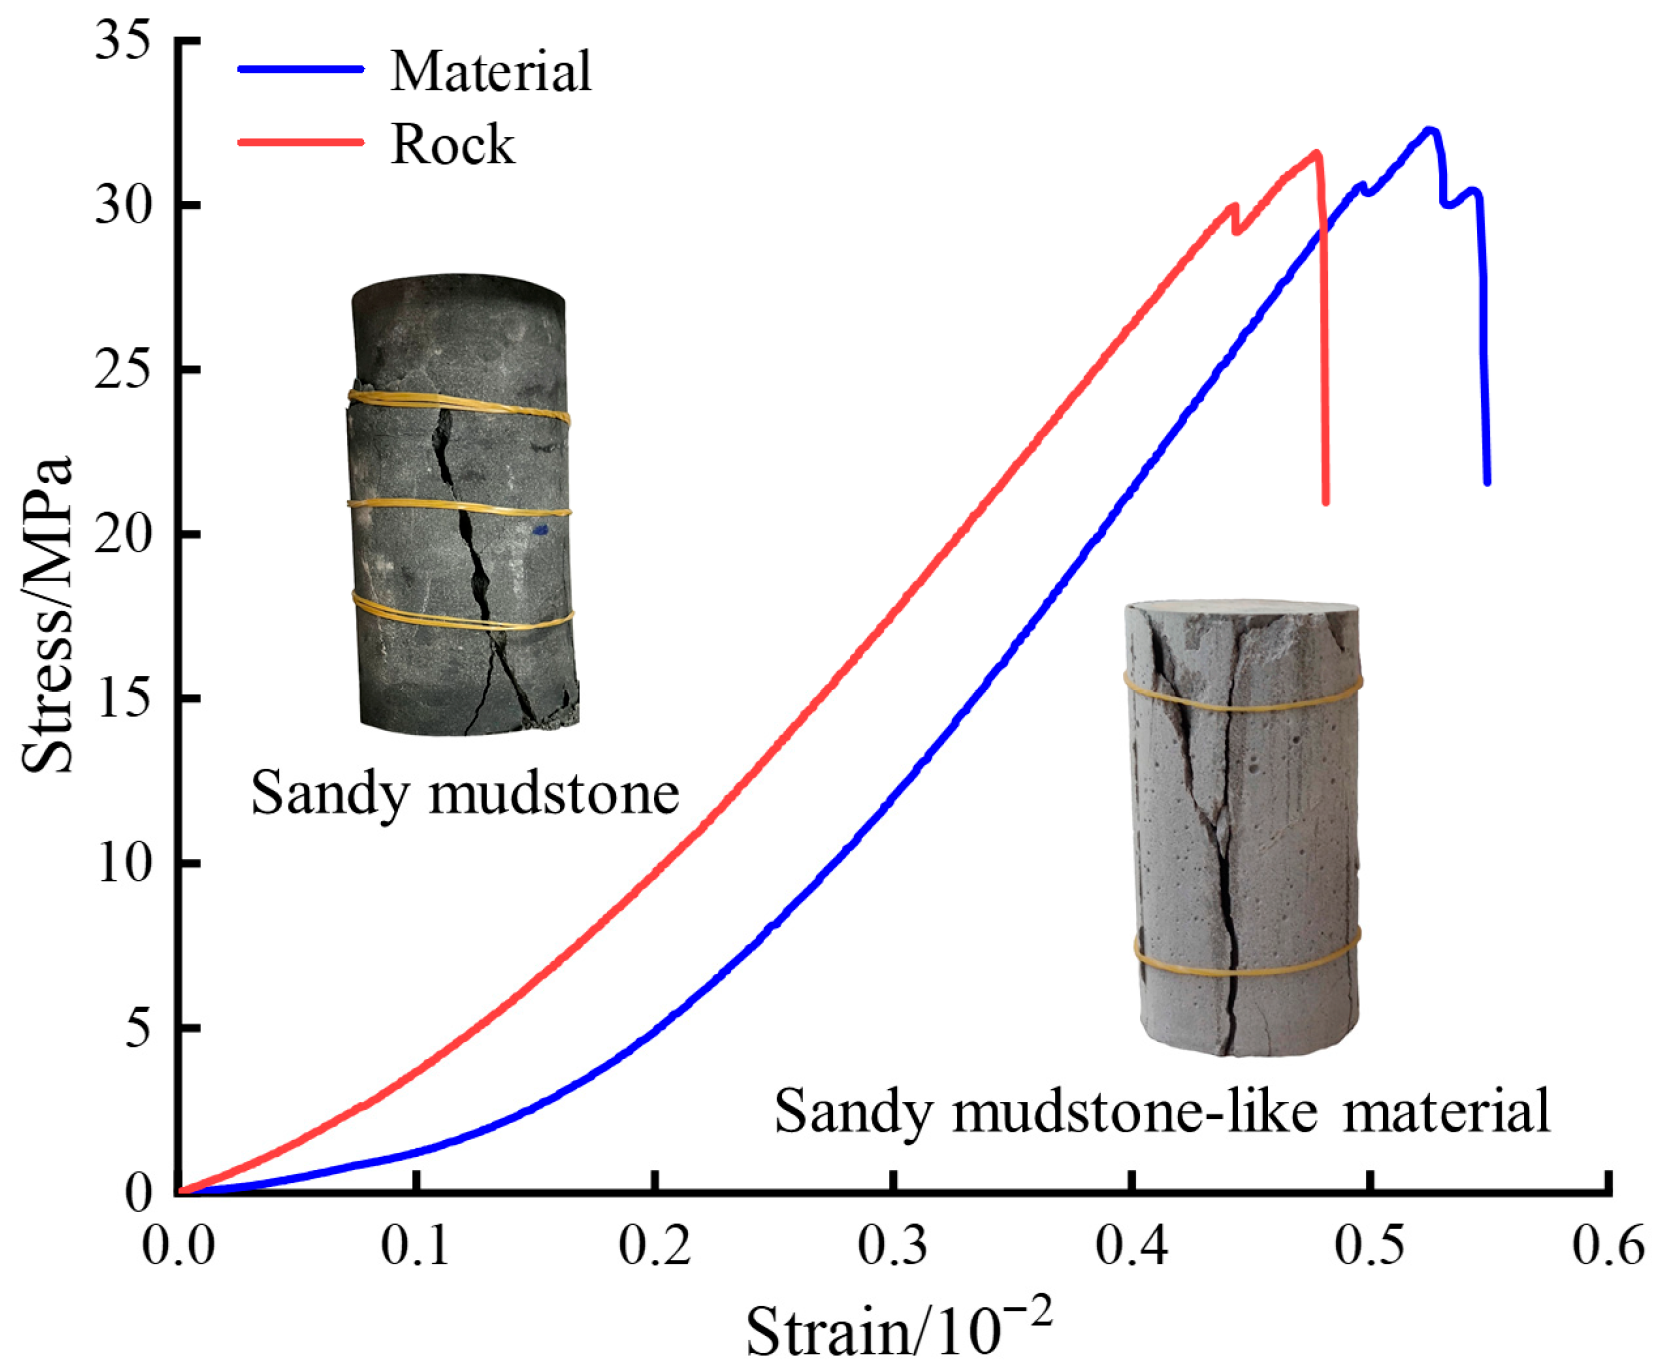
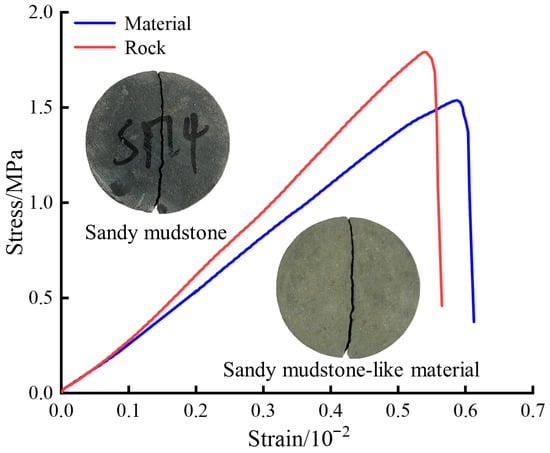
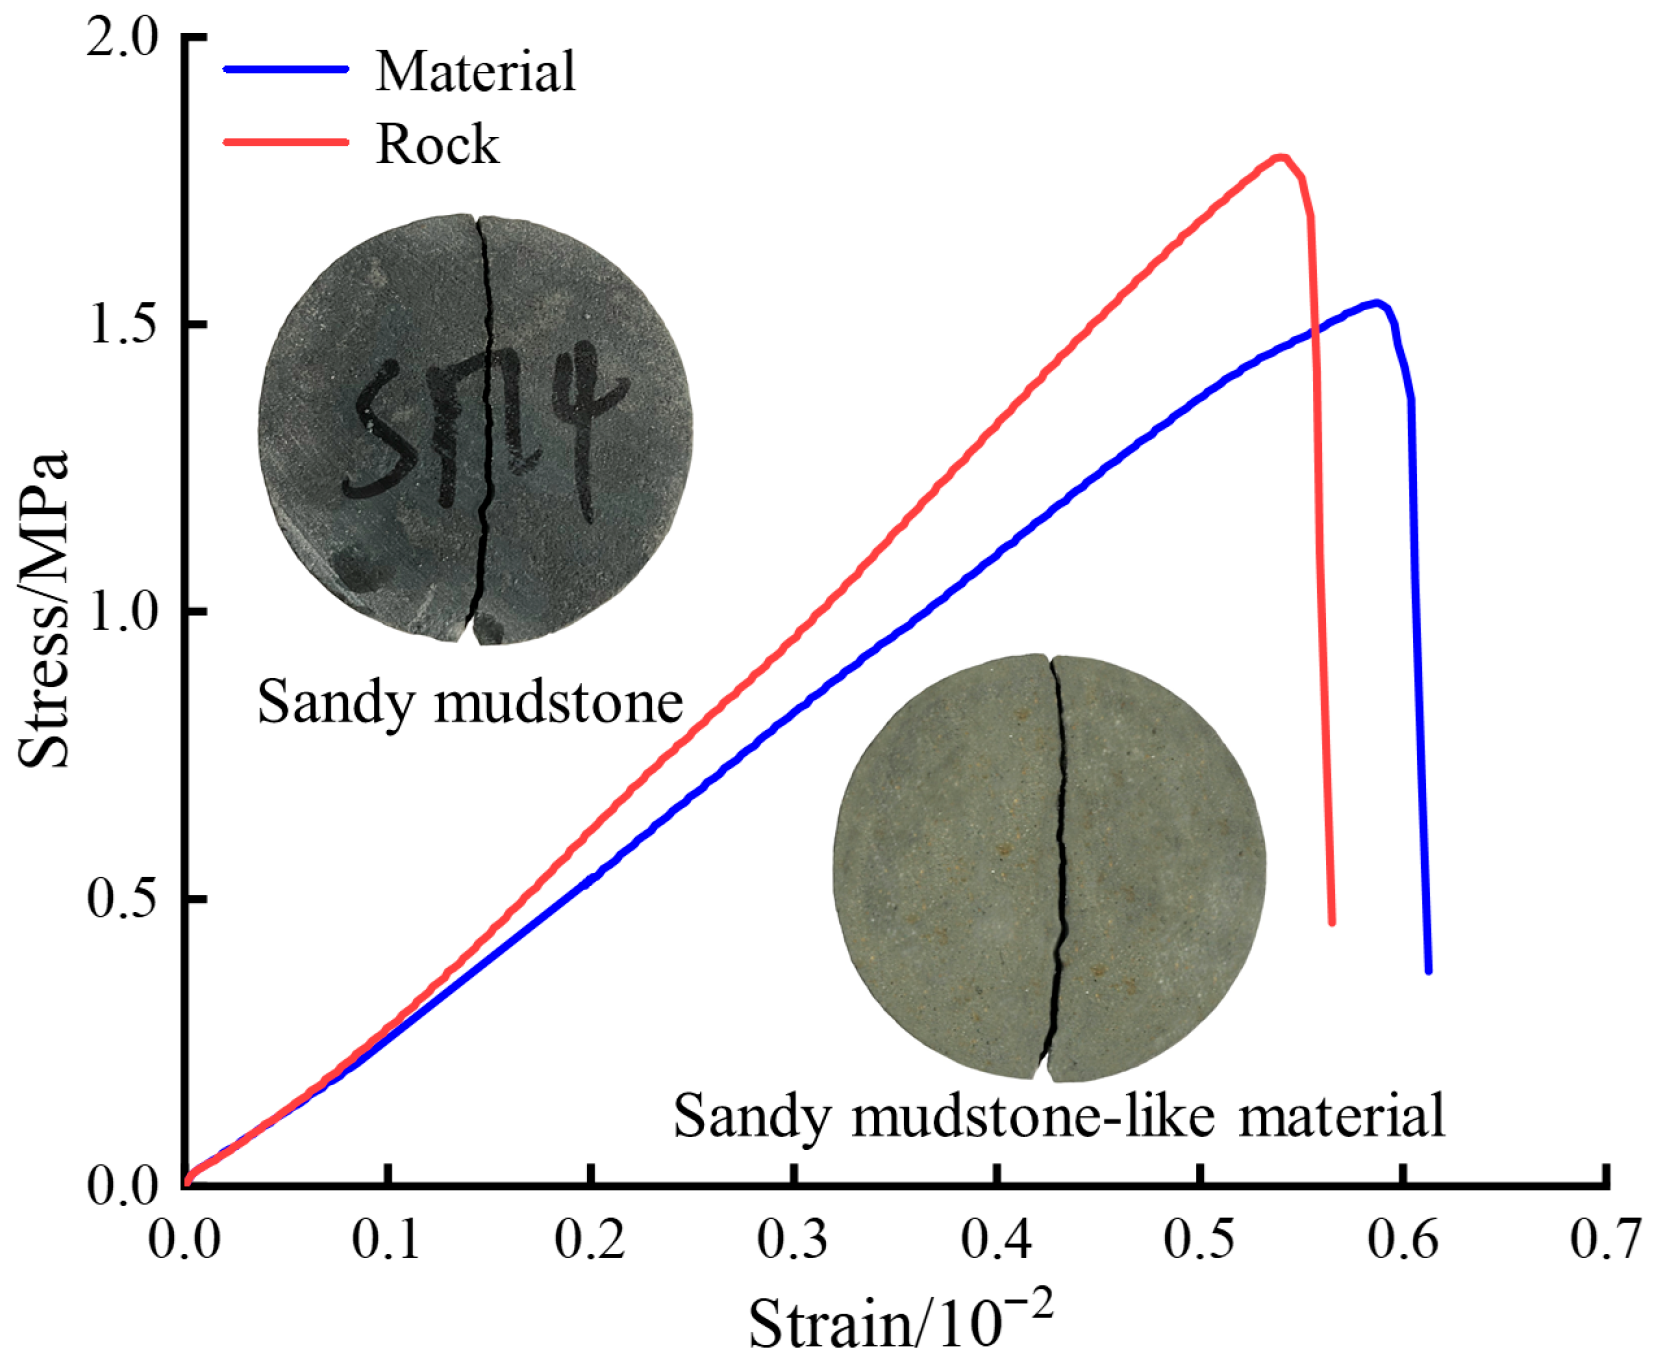
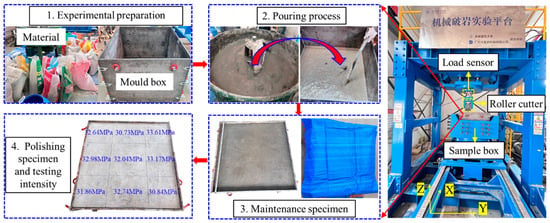
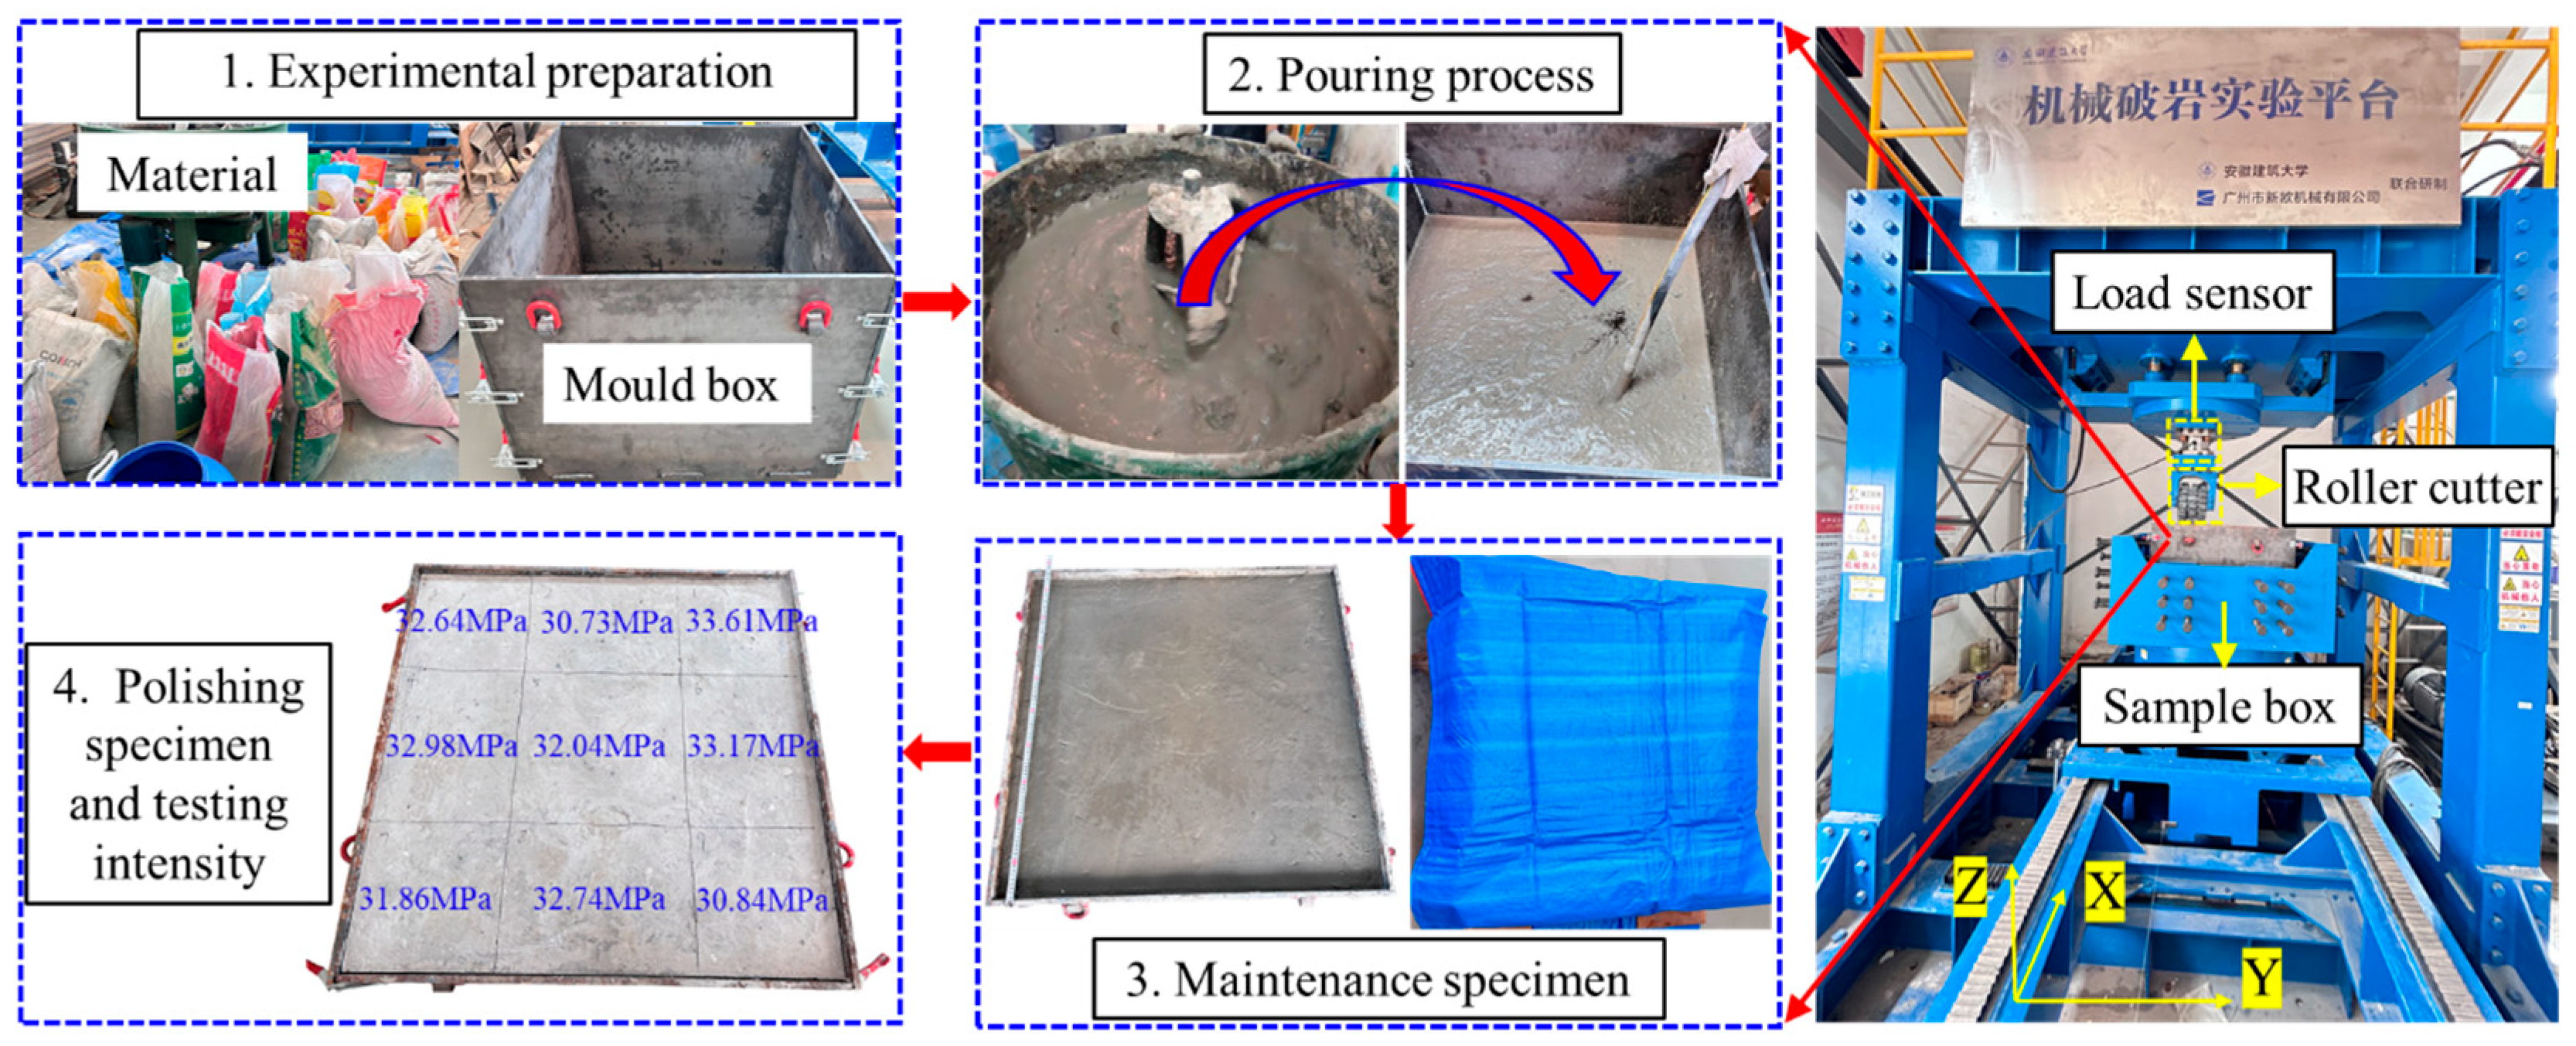
The rock-breaking equipment used for the linear cutting tests was a multifunctional mechanical testing platform. A milled-tooth roller cutter with a large cone-end diameter of 330 mm was employed to ensure effective rock fragmentation performance. The cutting speed was set at 100 mm/s. Tests were conducted at penetration depths ranging from 0.5 to 4.0 mm, with increments of 0.5 mm. The specimens had dimensions of 1000 mm × 1000 mm × 660 mm and were composed of sandy mudstone-like composite material. The artificial rock material consisted of cement, gypsum, river sand, clay, and other additives. The mass ratio of sand:cement:gypsum:kaolin:water:superplasticizer was 1:1.25:0.75:0.15:0.6:0.02. As shown in Table 4, the physical and mechanical properties of the fabricated material satisfied the similarity criteria for Jurassic sandy mudstone in western China [52,53]. After casting, the specimens were cured for 28 d and polished. The strength curves of the artificial material and corresponding natural rock are shown in Figure 13 and Figure 14, respectively. The rock-breaking apparatus and casting procedure are shown in Figure 15.
Table 4.
Physical properties of materials.
Figure 13.
Uniaxial compression stress–strain curves of rocks and rock-like materials [52,53].
Figure 14.
Brazilian splitting stress–strain curves of rocks and rock-like materials [52,53].
Figure 15.
Rock-breaking apparatus and experimental procedure.
4.2. Analysis of Experimental Results
4.2.1. Rock-Breaking Force
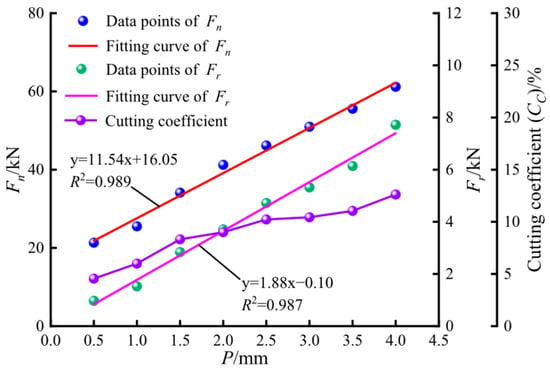
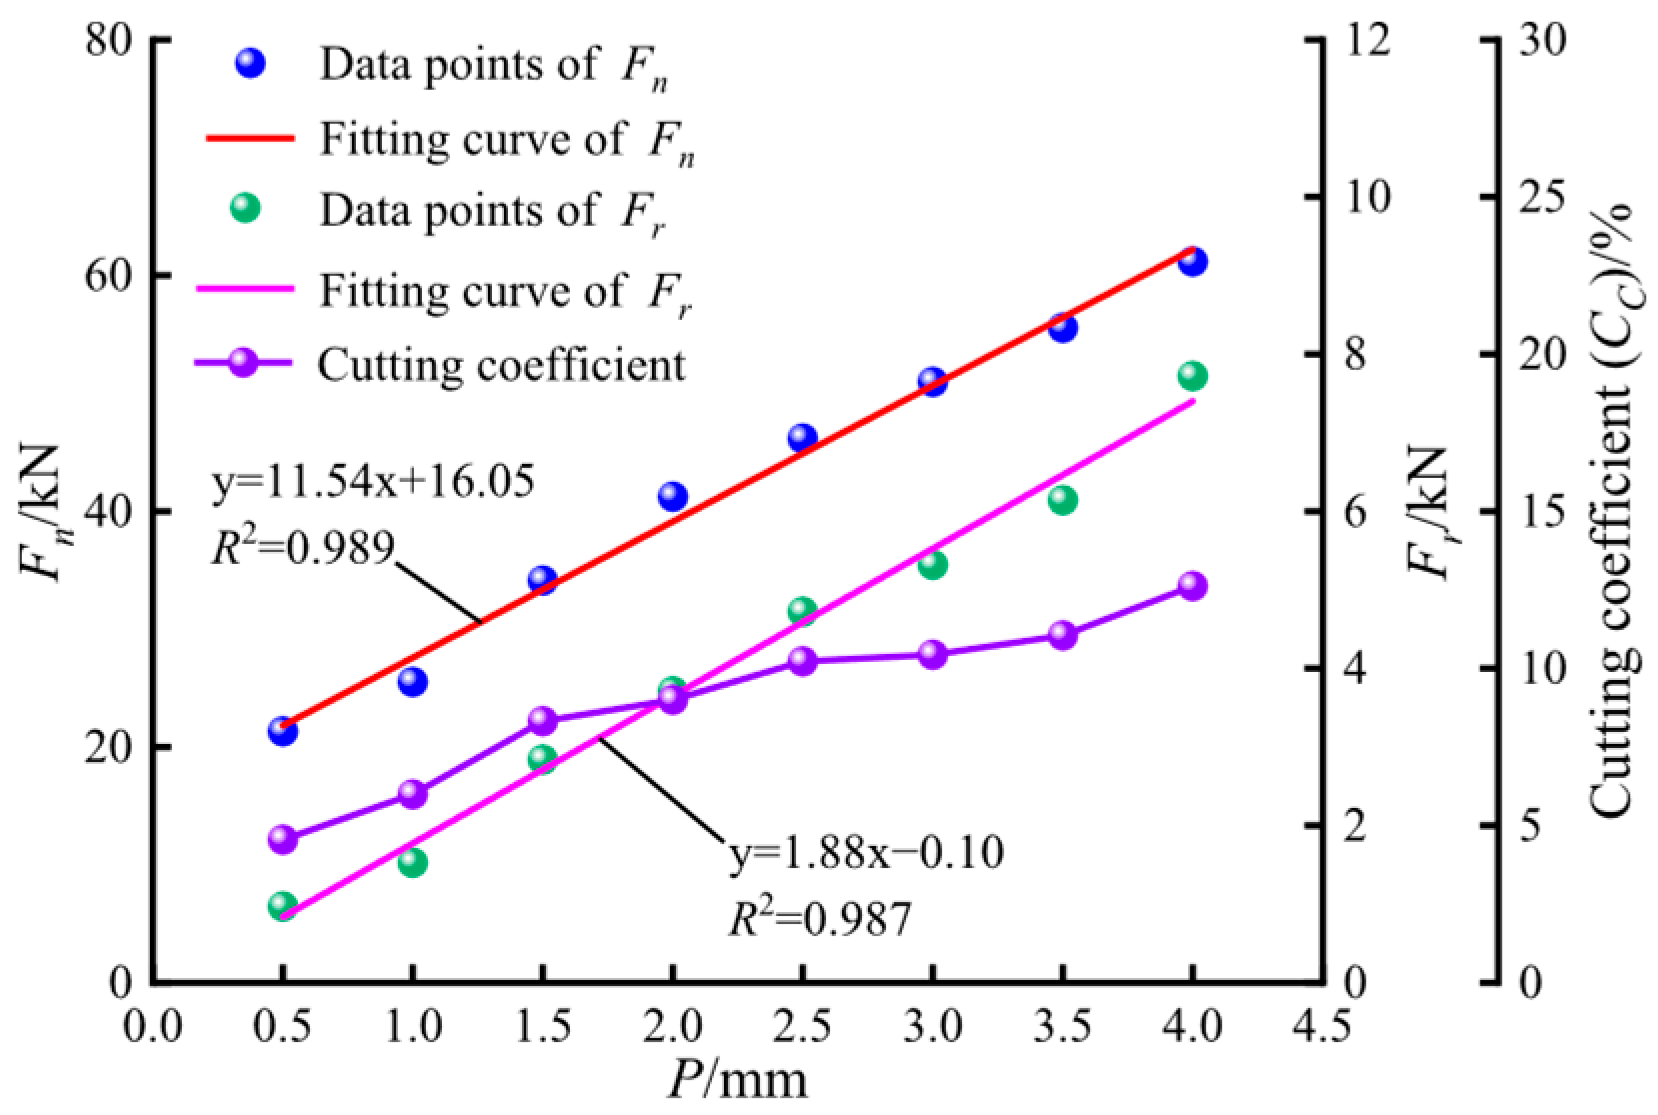
Figure 16 shows that both Fn and Fr exhibited a linear increasing trend with increasing penetration depths. As the penetration depth from 0.5 to 4.0 mm, Fn and Fr increased by 187% and 696%, respectively. During the rock-breaking process using the roller cutter, greater penetration depth resulted in increased resistance from the rock specimen. Consequently, a higher Fn was required to achieve rock breakage. The primary factors influencing Fr were the magnitude of Fn and the contact area at the cutter–rock interface. An increase in the penetration depth led to a higher Fn, which intensified the frictional resistance at the interface. Meanwhile, the increased volume of fragmented rock required a greater Fr to remove debris from the crushing zone. In addition, the cutting coefficient (CC) increased with penetration depth and reached a maximum value of 12.62%. These results indicate that Fn was significantly greater than Fr during the cutting process, highlighting the dominant role of Fn and the auxiliary role of Fr.
Figure 16.
Average cutting force curve obtained from linear cutting test. (Fn and Fr represent the mean values of the normal and rolling forces, respectively, and CC is defined as the ratio of Fn to Fr.).
4.2.2. Rock-Breaking Efficiency
Specific energy (SE), defined by Equation (3), was used to evaluate the cutting efficiency of the roller cutter.
where J denotes the cutter’s cutting distance (mm), and V denotes the volume of rock removed (m3).
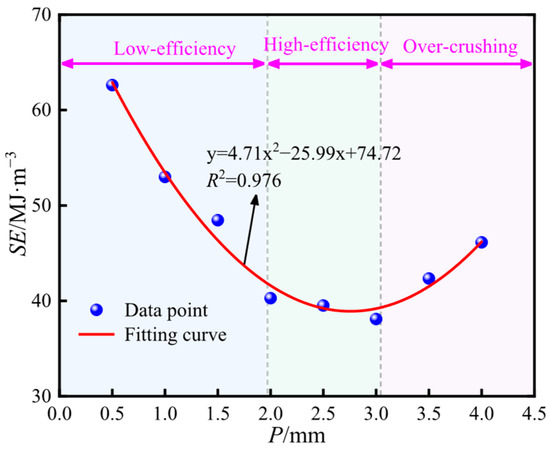
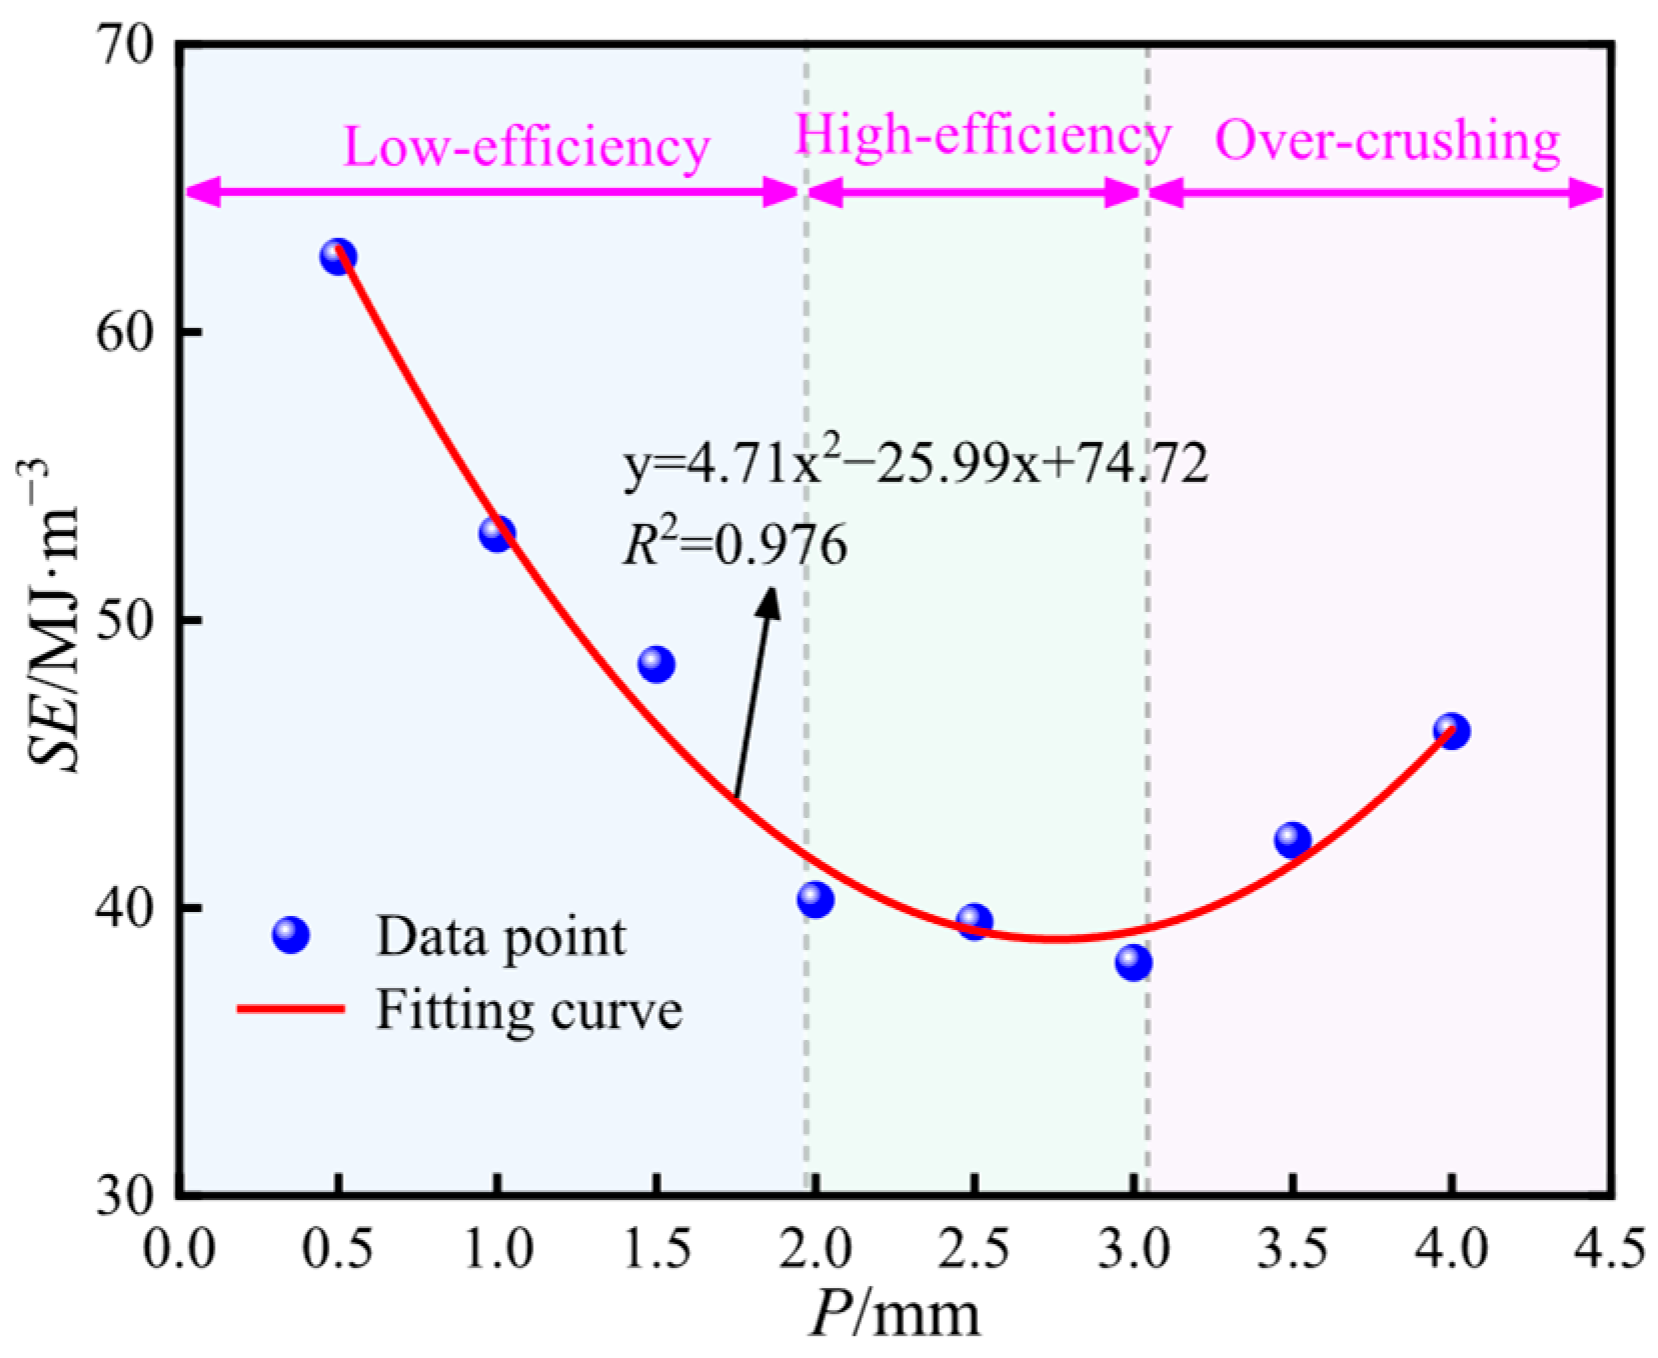
As shown in Figure 17, SE varied with penetration depth, exhibiting an initial decrease followed by an increase as penetration depth increased. The SE curve was divided into three distinct stages. The first stage was a low-efficiency region at penetration depths below 2.0 mm. The second stage was a high-efficiency interval between 2.0 and 3.0 mm. The third stage was an over-crushing region observed at penetration depths of 3.0 < P ≤ 4.0 mm. In the low-efficiency stage, SE decreased sharply by 36% as penetration depth increased. During this stage, rock-breaking efficiency was relatively low but gradually improved with increasing penetration. In the high-efficiency stage, SE exhibited only minor variations, and the minimum SE value corresponded to the maximum rock-breaking efficiency. When penetration depth exceeded 3.0 mm and entered the over-crushing stage, SE increased by 21%, indicating a reduction in rock fragmentation efficiency. These trends can be explained as follows. At shallow penetration depths, the cutter removed only a small volume of rock, whereas the applied load and energy consumption were relatively high, resulting in low efficiency. In the high-efficiency region, both the load and energy were effectively utilized, and the volume of fragmented rock was relatively large, thereby enhancing efficiency. In contrast, in the over-crushing stage, increased penetration led to higher loads and greater energy demand. However, the rock within the fracture pit was excessively fragmented, and the increase in the volume of broken rock was limited, which reduced rock-breaking efficiency at this stage. Overall, the roller cutter achieved the highest rock fragmentation efficiency at a penetration depth of 3.0 mm. A consistent improvement in performance was observed within the penetration depth range of 2.0–3.0 mm.
Figure 17.
SE curve.
4.3. Validation of Numerical Simulation Accuracy
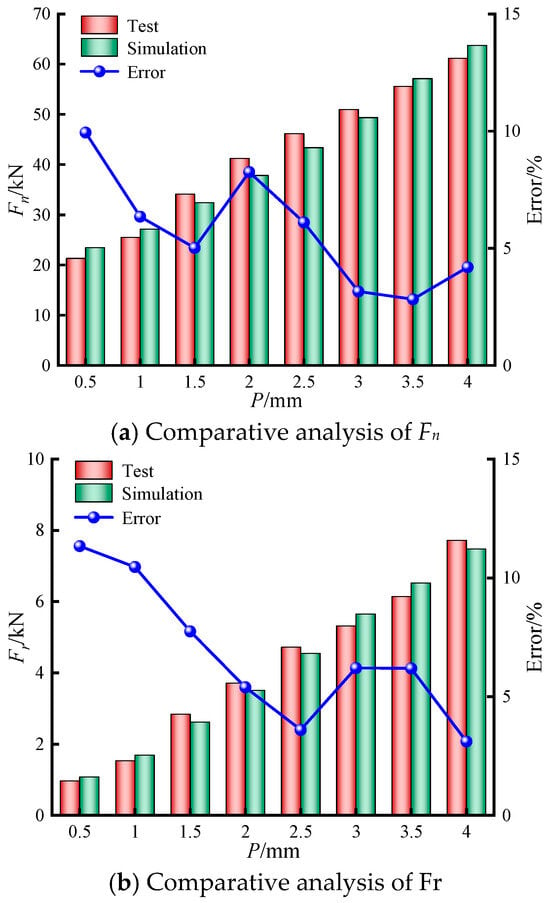
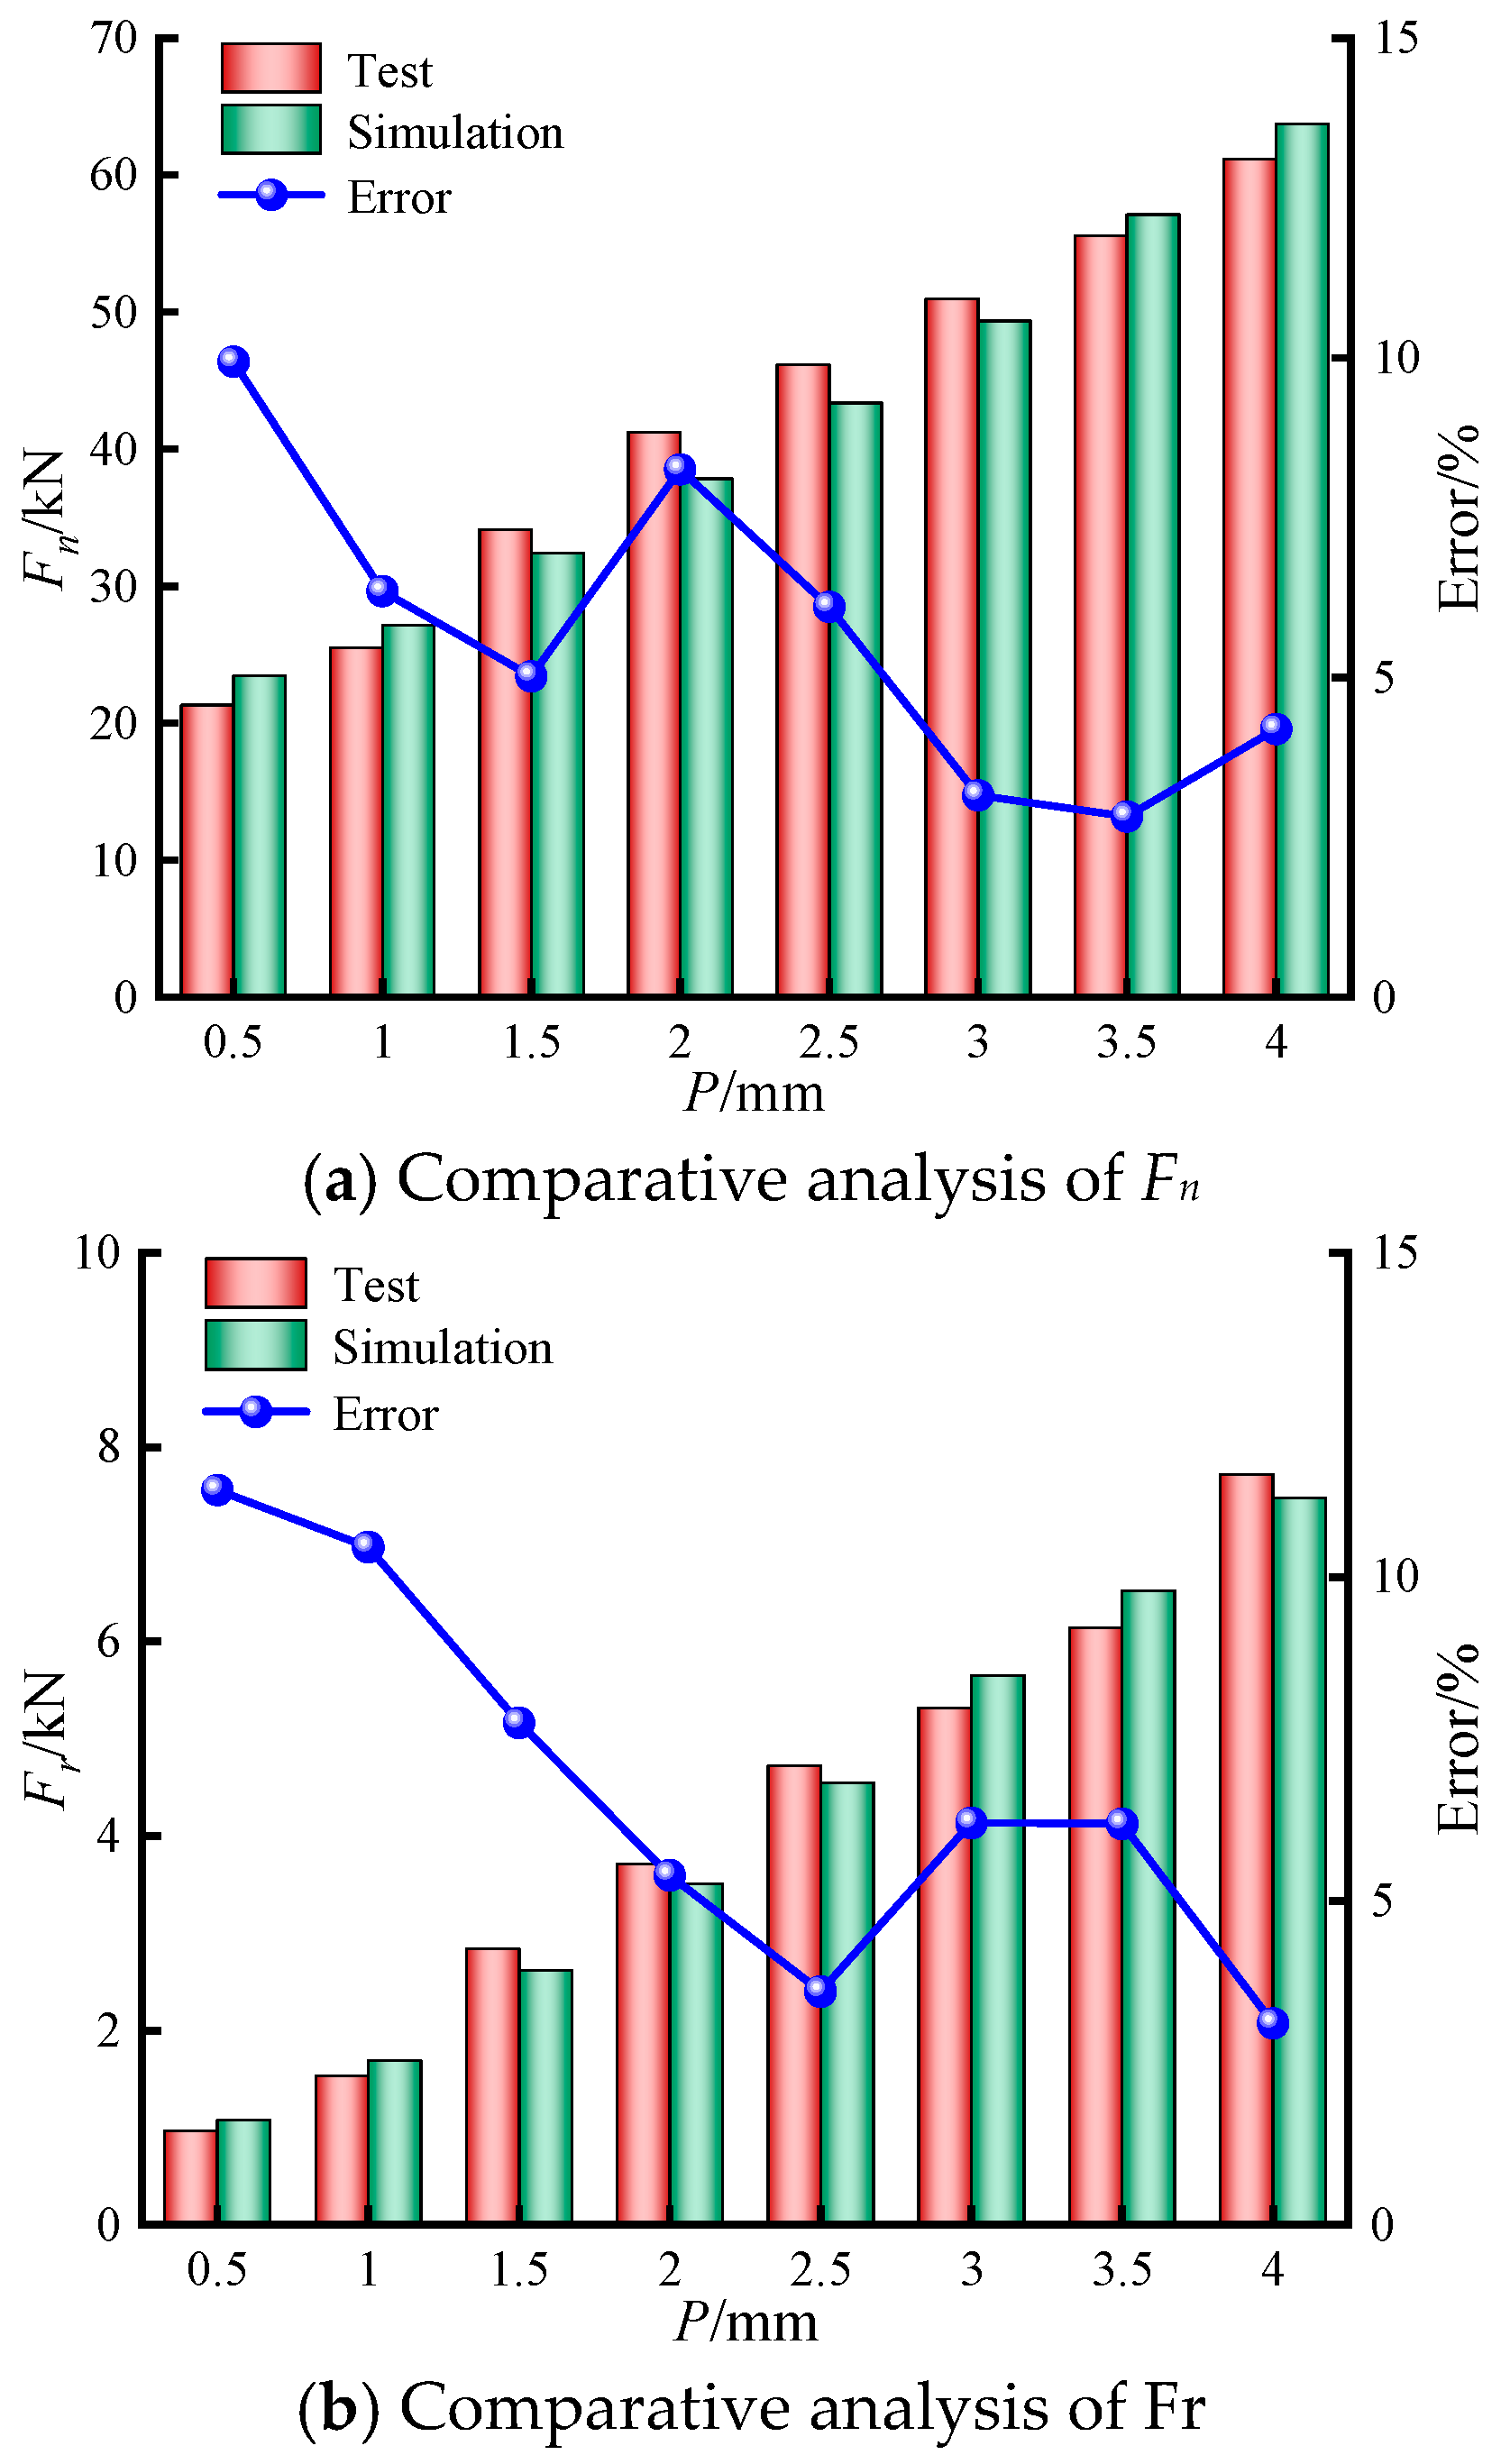
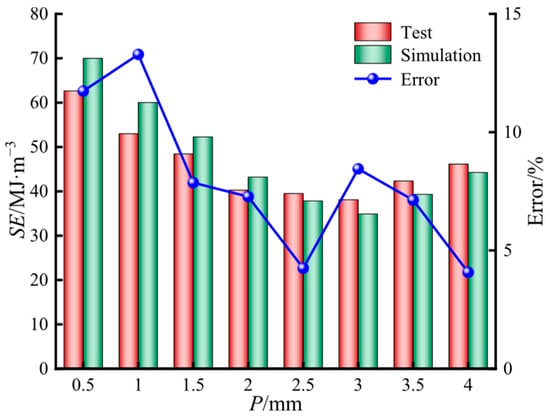
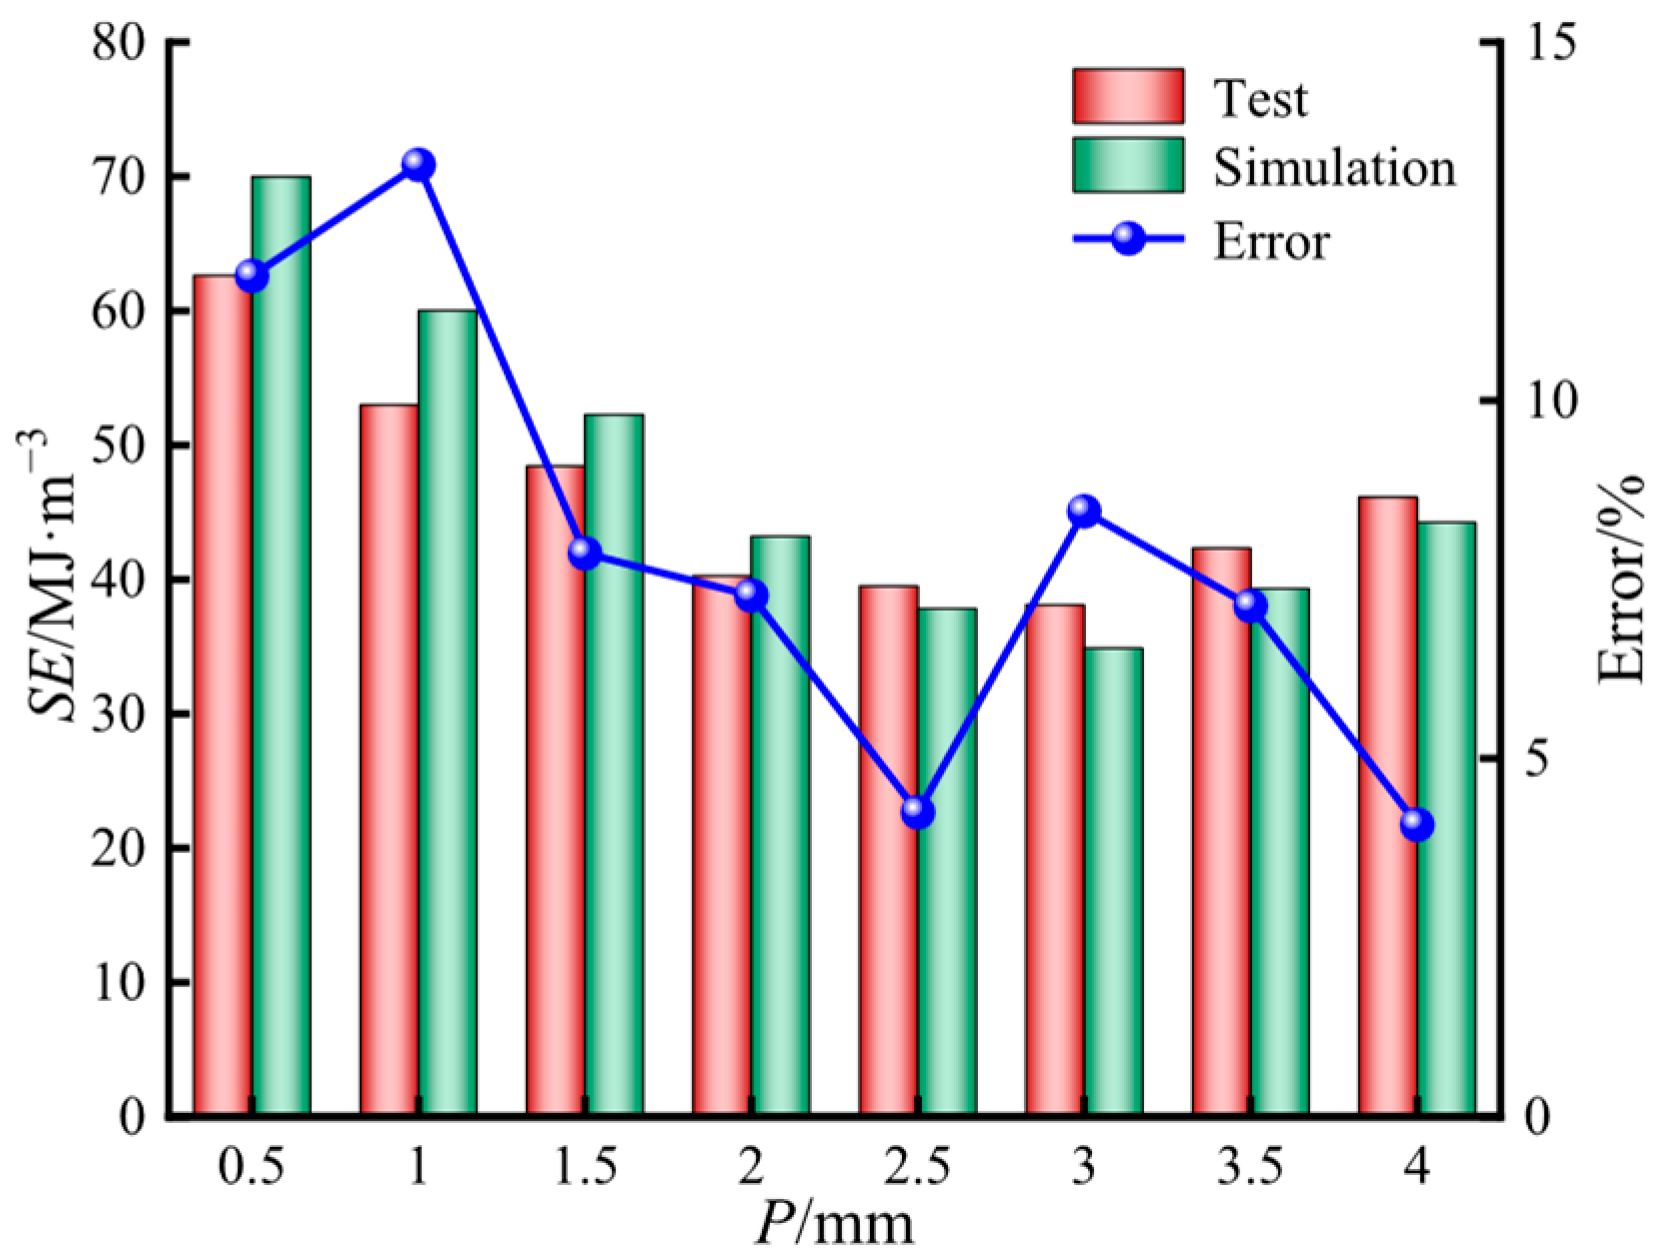
A comparative analysis of the numerical and experimental results for rock-breaking force and SE is presented in Figure 18 and Figure 19. As illustrated in Figure 18, both Fn and Fr obtained from the simulations and experiments exhibited consistent increasing trends with penetration depth. Overall, good agreement was observed between the numerical and experimental results, with only minor deviations. The maximum relative deviations of Fn and Fr were 9.94% and 11.34%, respectively. Figure 19 shows that the SE values derived from numerical simulations and experimental measurements followed similar trends. In both cases, SE initially decreased and then increased as penetration depth increased. The maximum error observed for SE was 13.29%. In addition, the peak rock-breaking efficiency obtained from both methods occurred at a penetration depth of 3.0 mm, further confirming the reliability of the numerical simulation results.
Figure 18.
Comparative analysis of rock-breaking force.
Figure 19.
Comparative analysis of SE.
5. Range Analysis and Roller Cutter Optimization
5.1. Numerical Simulation Results
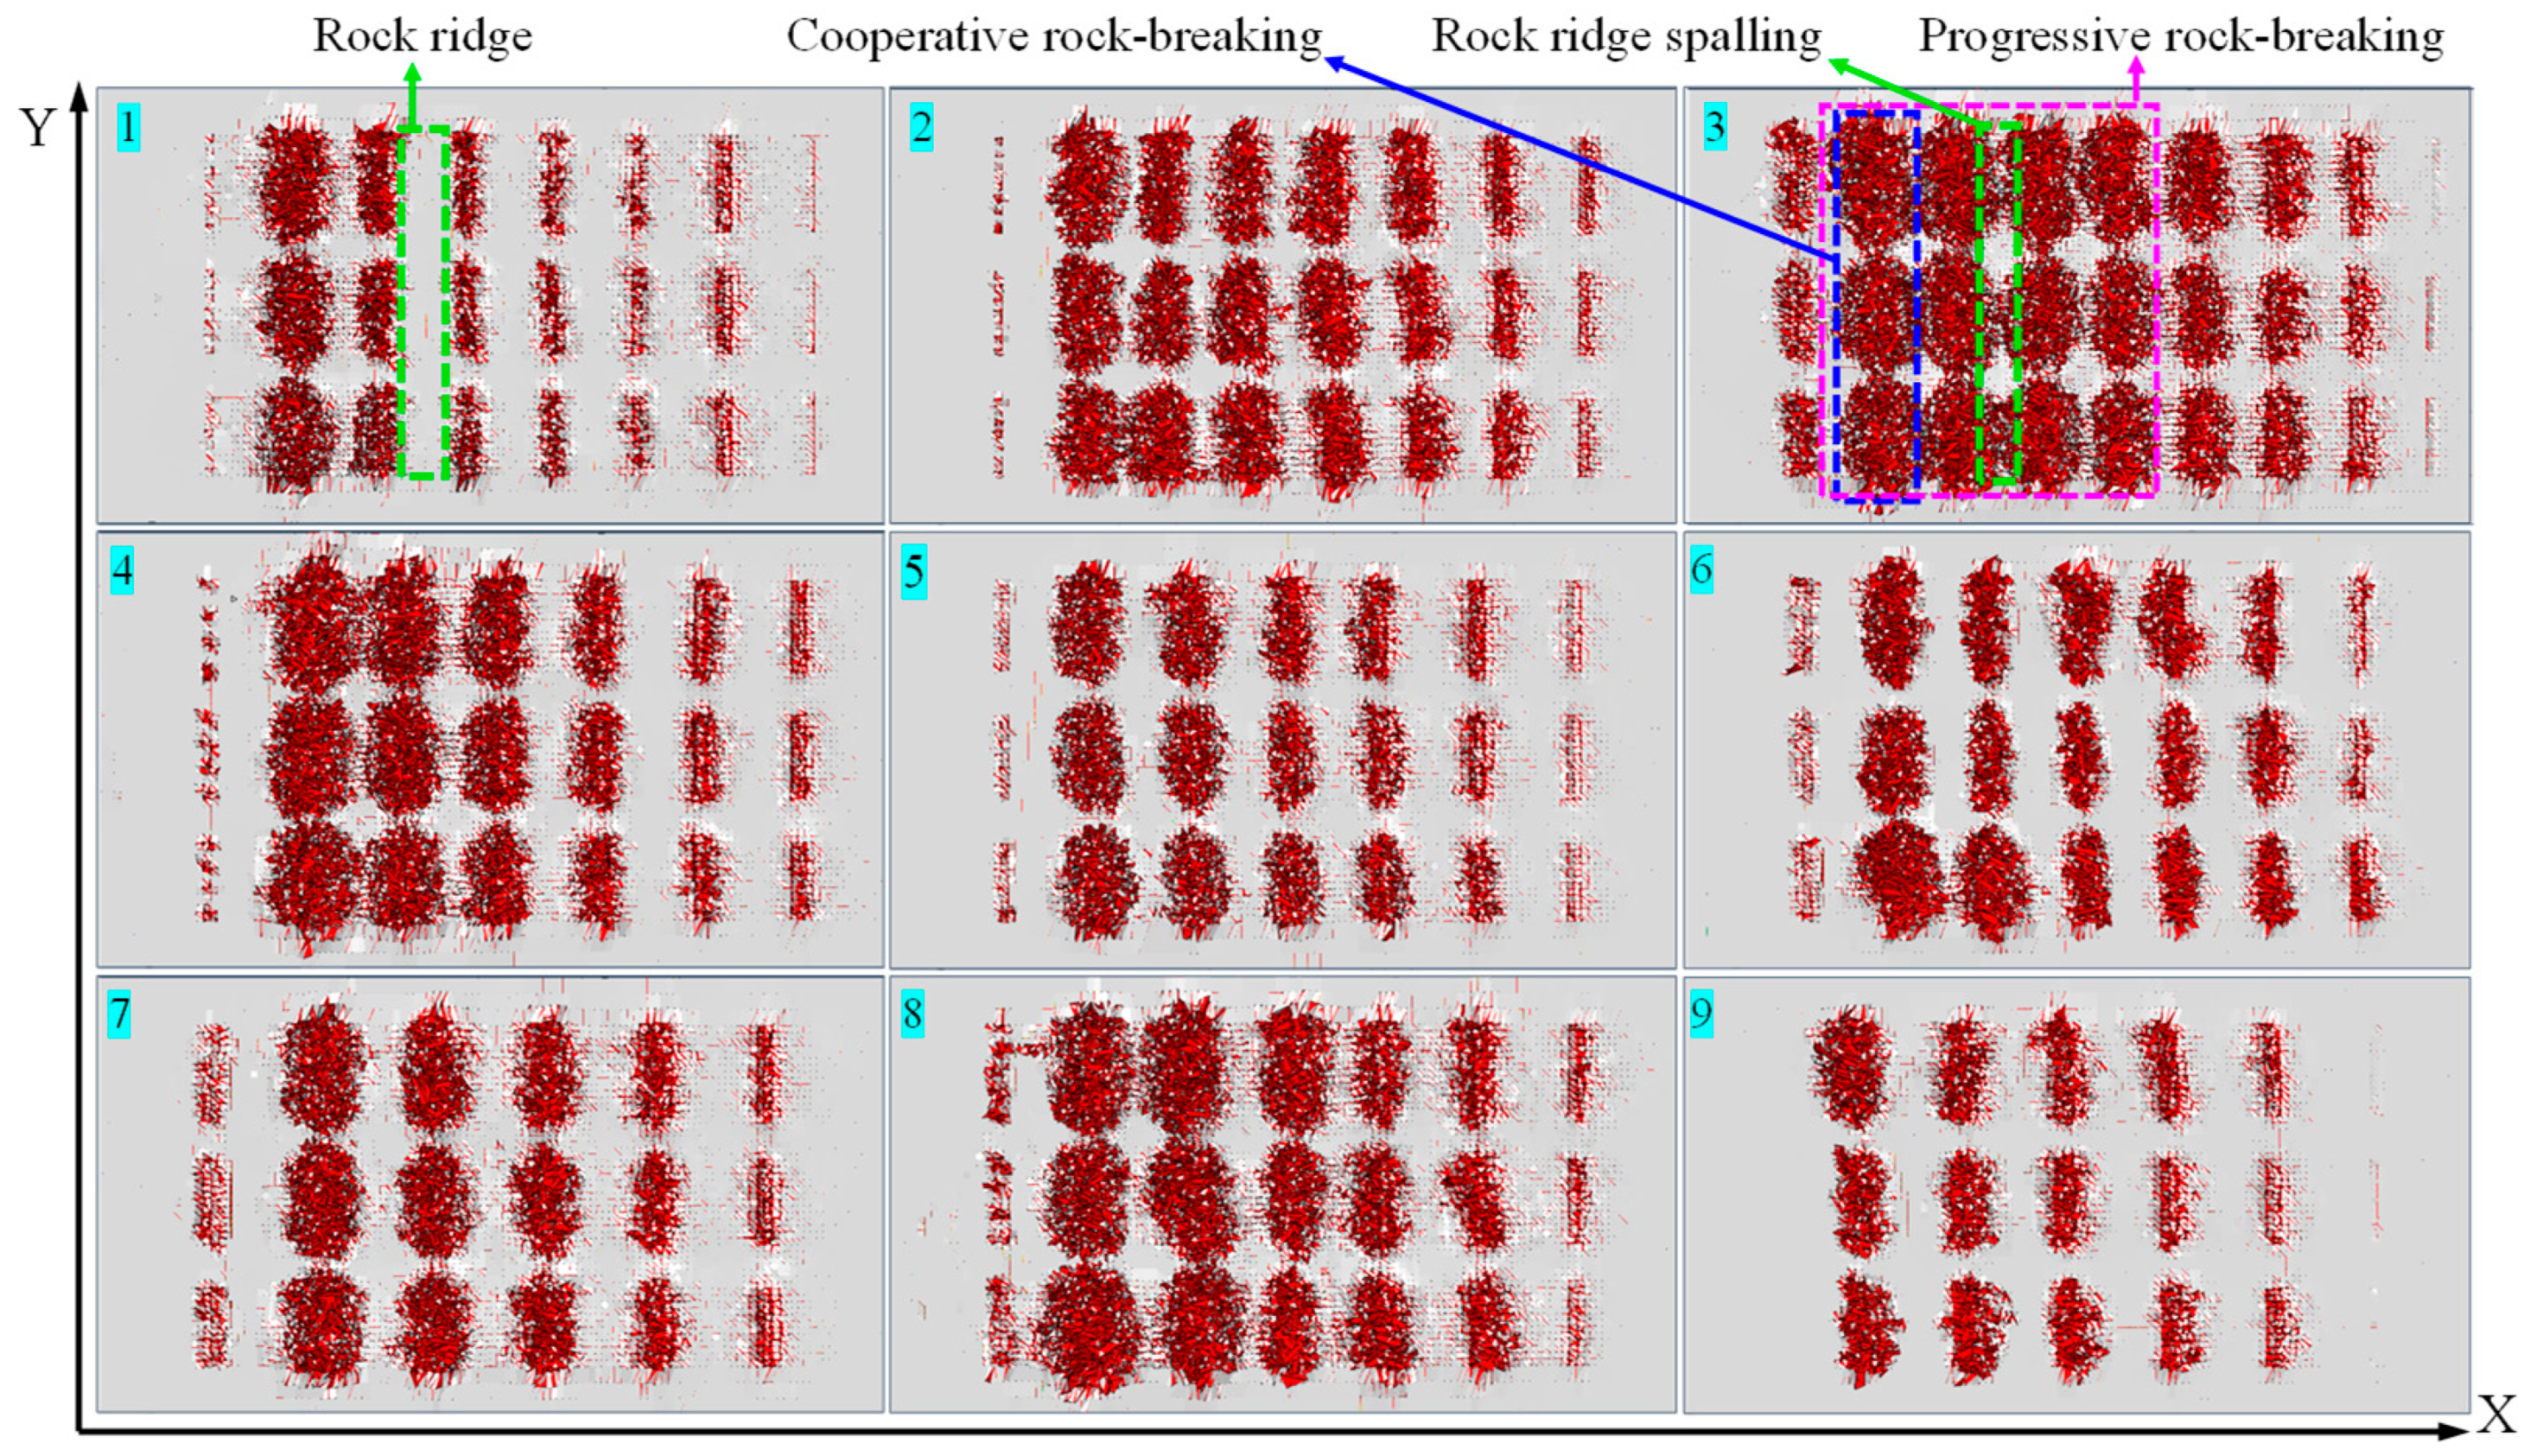
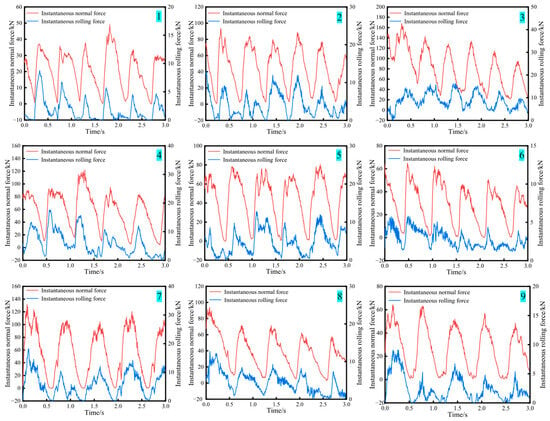
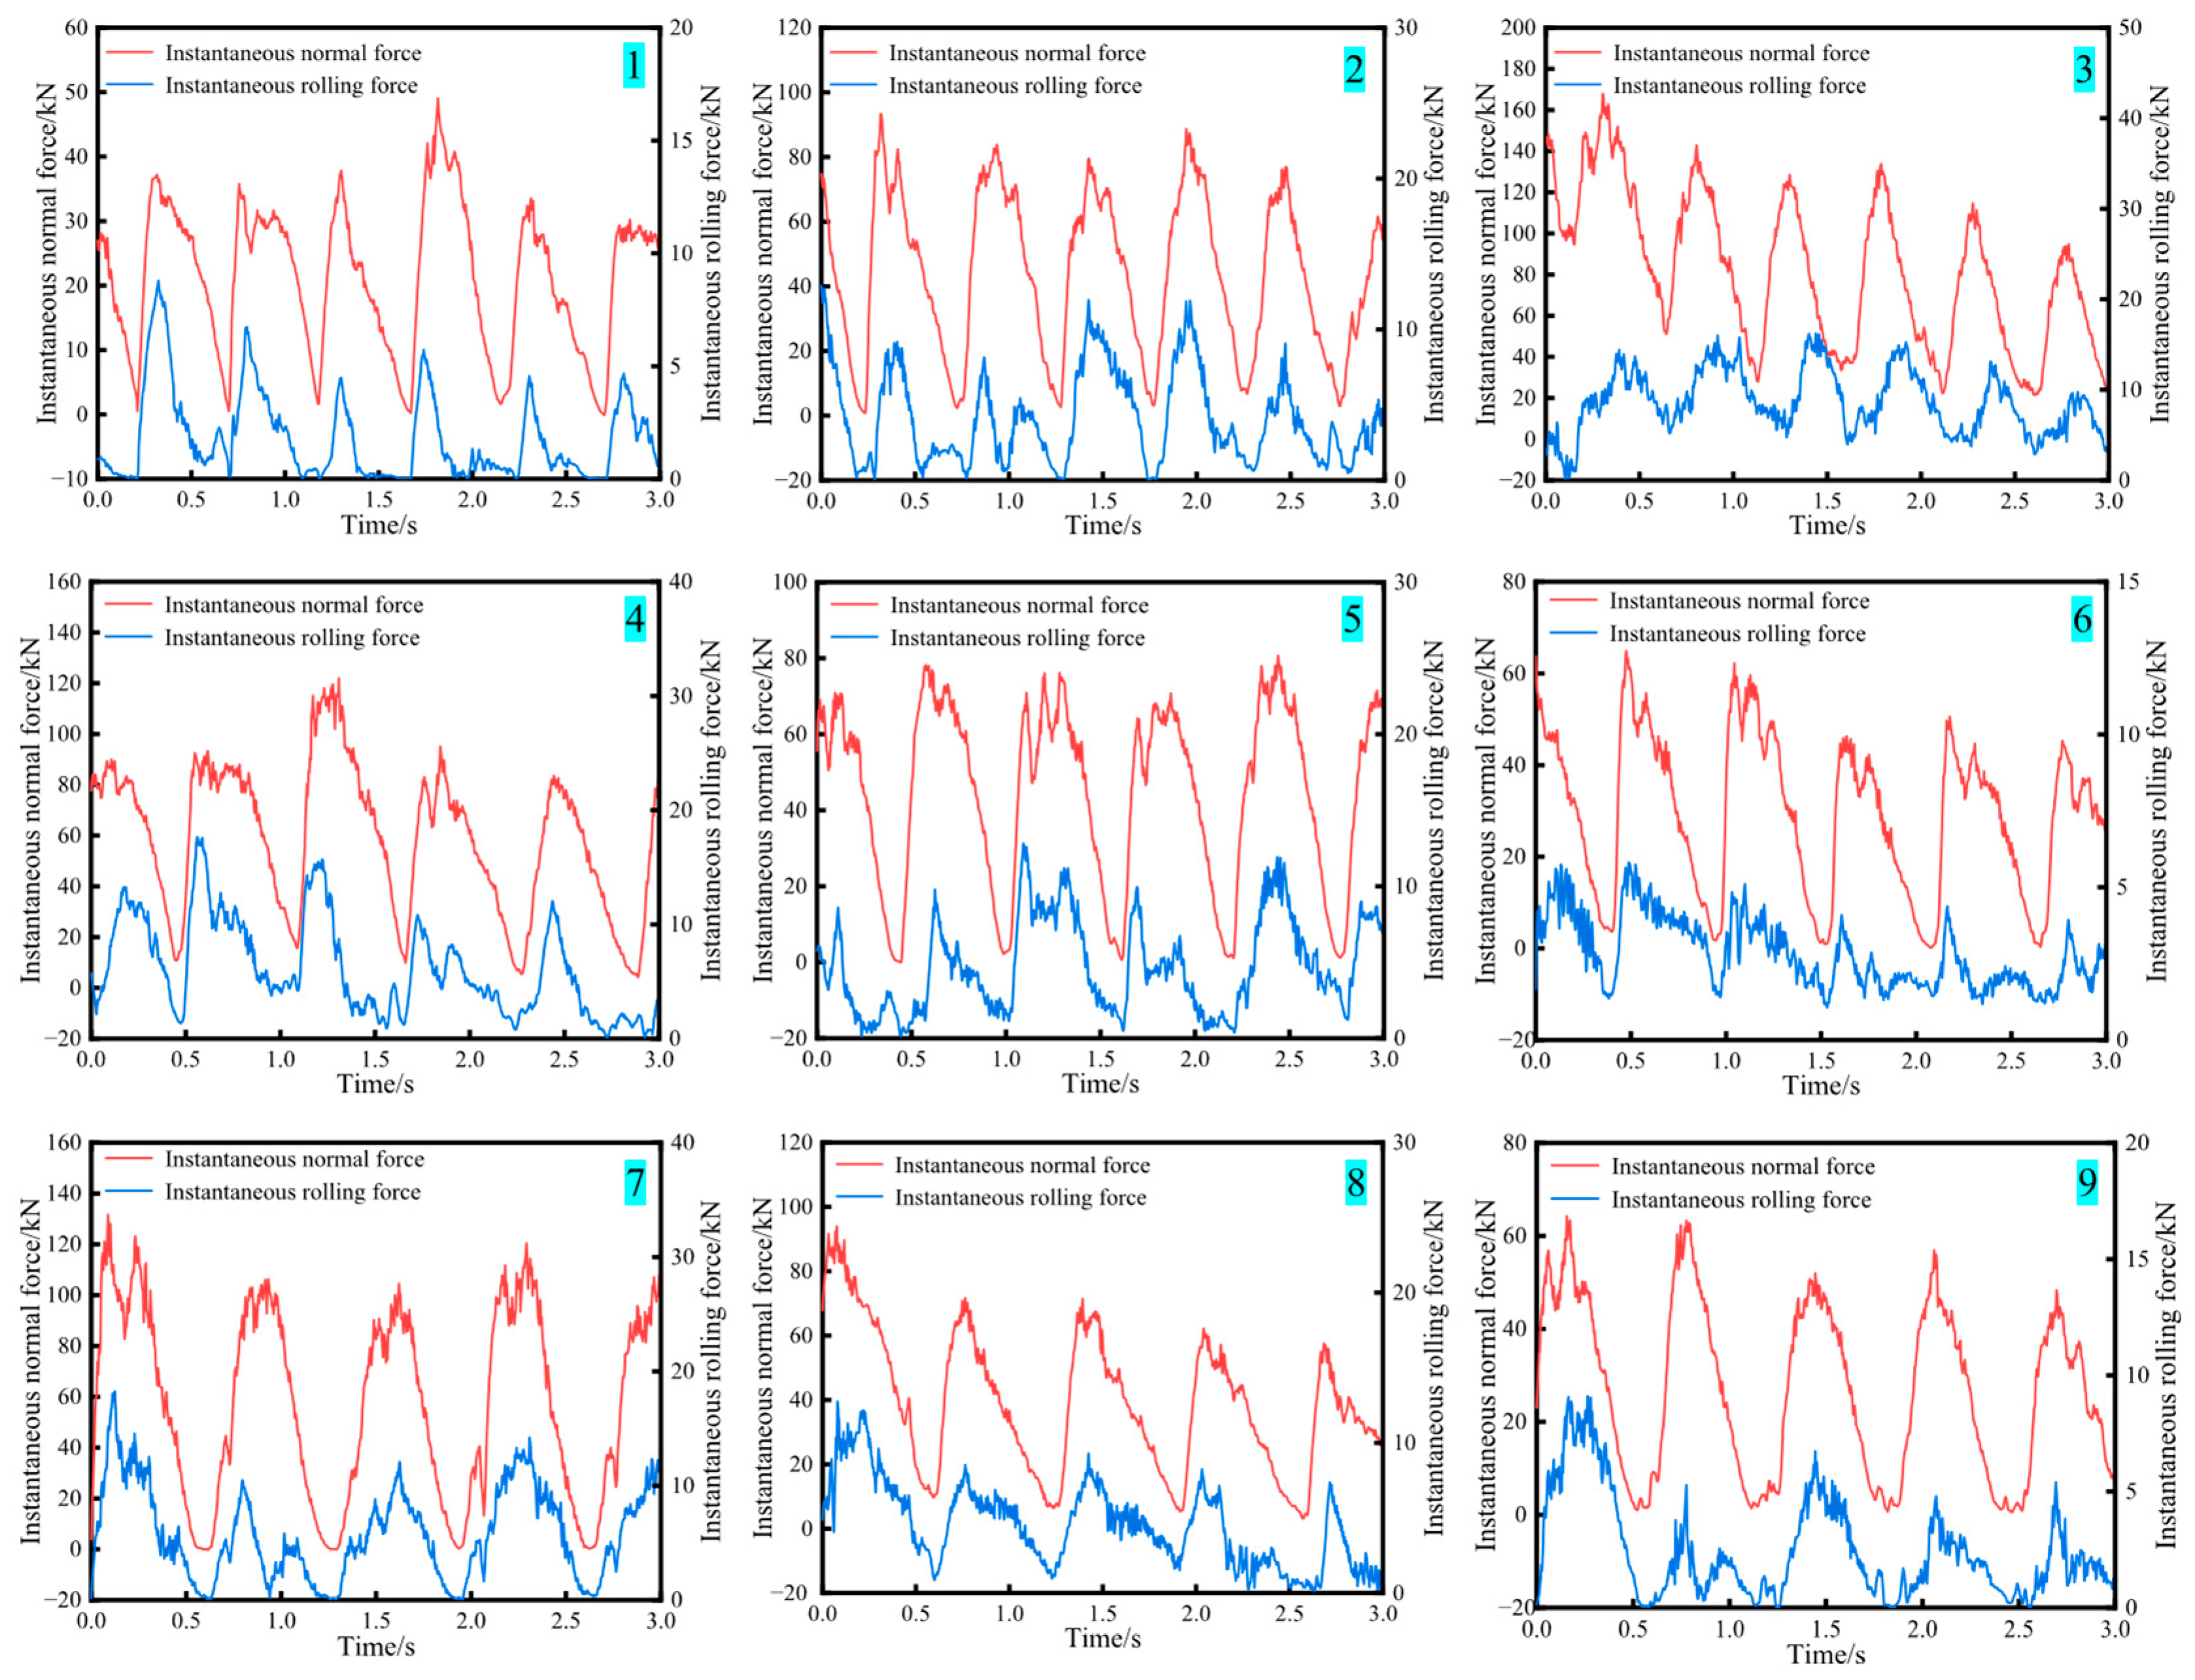
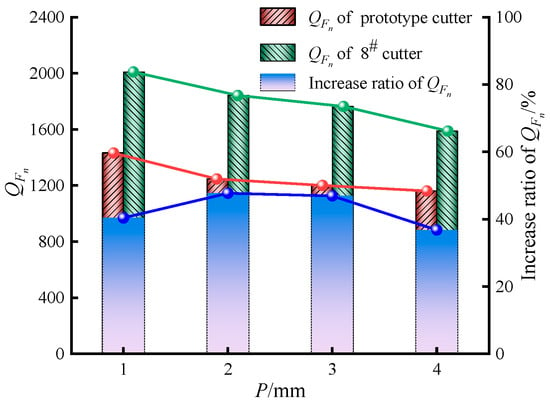
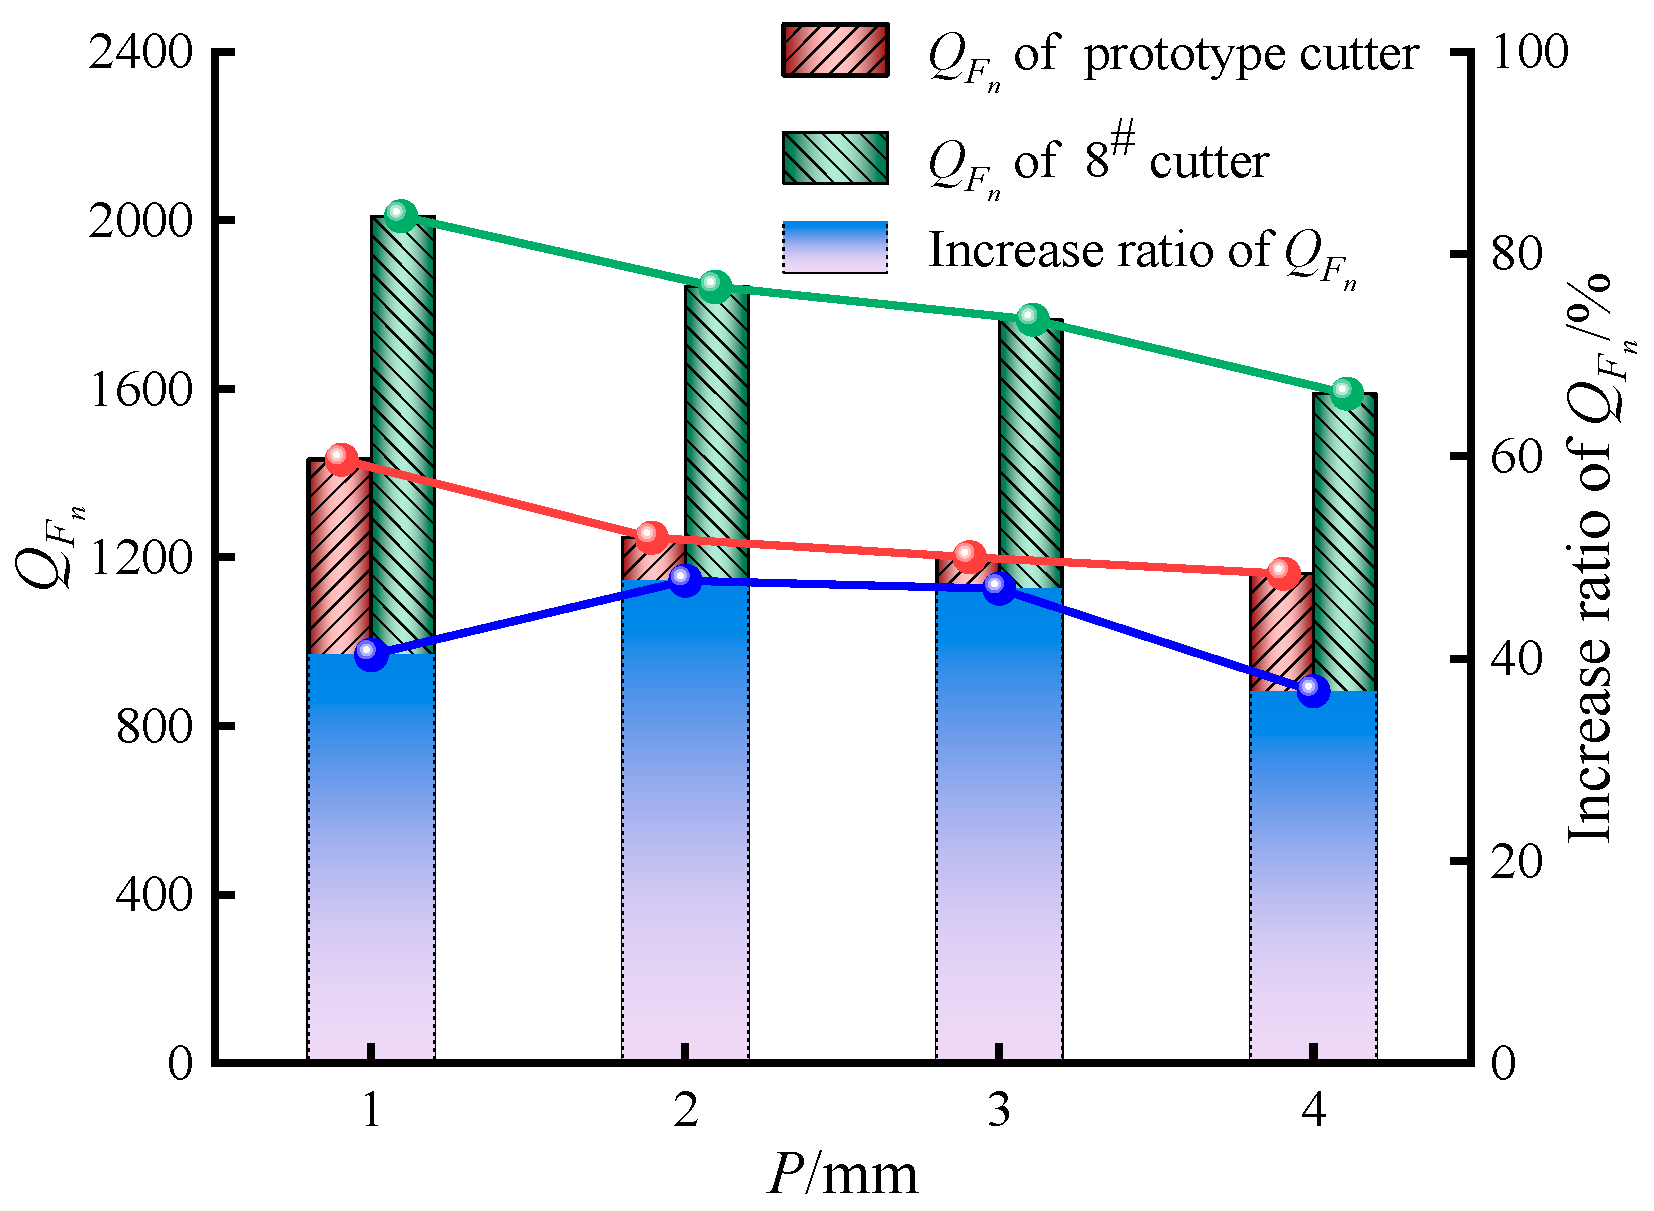
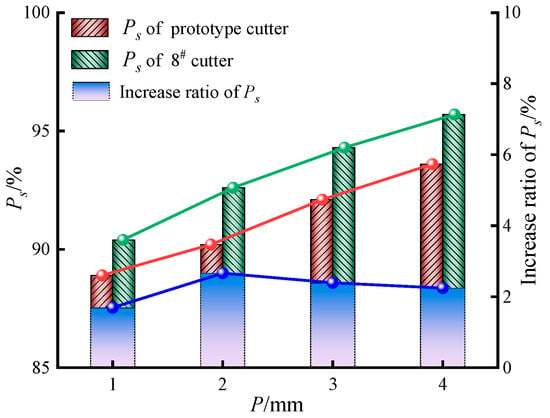
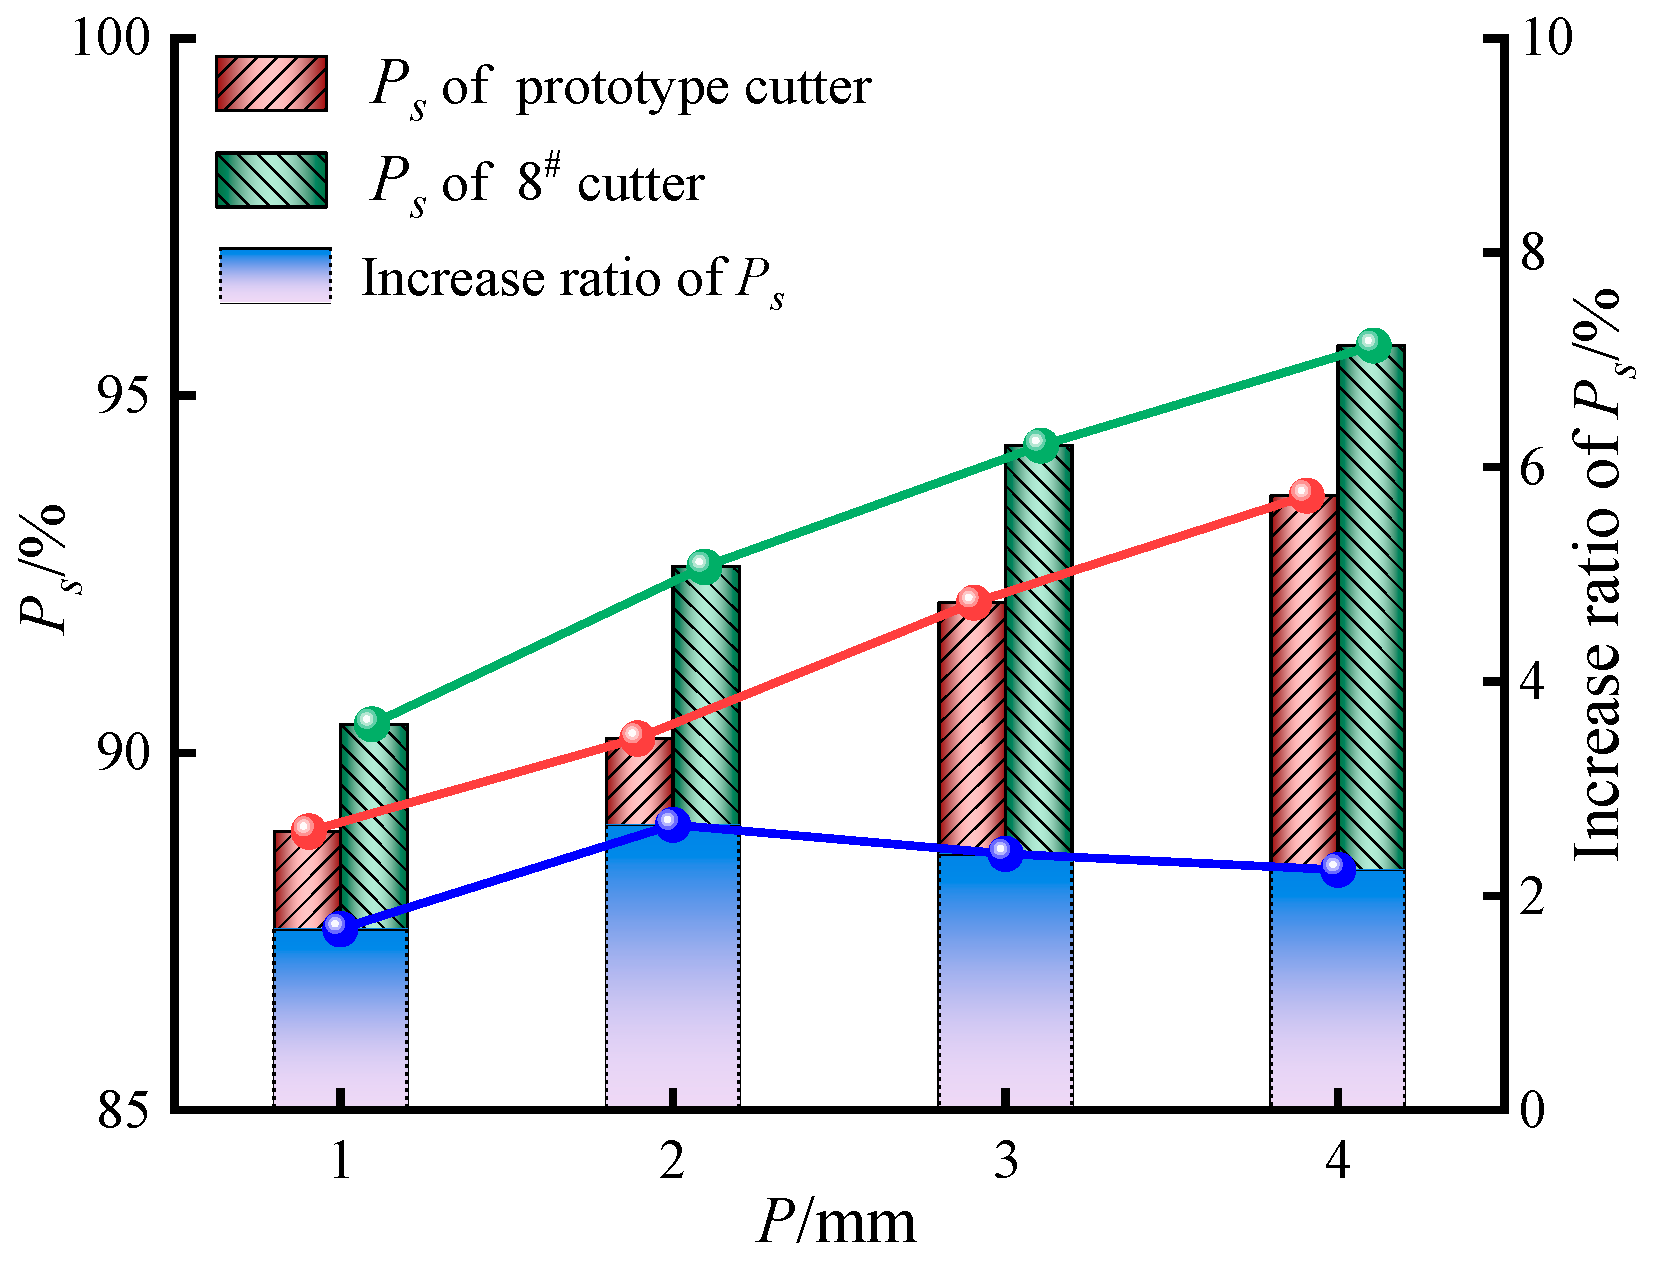
SE was adopted as the optimization indicator for the structural parameters of the roller cutter [54]. Furthermore, to evaluate the extent of rock damage and the ability of cracks to propagate, the damage factor QFn was introduced using Equation (4) [49]. This factor serves as a critical indicator of a rock’s susceptibility to cutter-induced failure. A higher value indicates a greater crack density per unit force and, consequently, easier rock breakage. In contrast, a lower value suggests increased difficulty in rock fracturing. As demonstrated by Cheng et al. [50], rock fragmentation induced by milled-tooth roller cutters is mainly governed by shear-dominated failures. Moreover, a higher proportion of shear cracks PS corresponded to higher energy utilization efficiency. Therefore, in this study, PS was used as an indicator to evaluate the energy utilization efficiency of the roller cutter. The statistical results of the numerical simulations are presented in Table 5. The corresponding failure surfaces of each specimen group are shown in Figure 20, and the instantaneous rock-breaking force curves are shown in Figure 21.
where Q represents the total number of cracks; and QFn represents the damage factor.
Table 5.
Results of the orthogonal experiment.
Figure 20.
Surface failure morphology of specimen groups.
Figure 21.
Instantaneous rock-breaking force curves for each scheme.
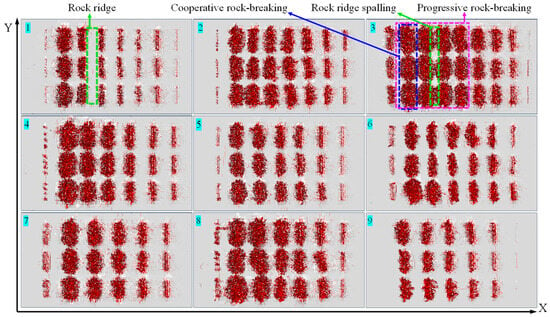
As shown in Figure 20, when the cutter teeth penetrated the rock, a crushed indentation formed on the rock surface. This process was accompanied by the initiation and propagation of numerous microcracks. As the cutter continued to rotate, these microcracks further propagated, forming both transverse fractures in the X direction and longitudinal fractures in the Y direction. With successive penetrations, the impact of the cutter teeth caused the initially formed crushing pit to expand progressively. At greater penetration depths, when the spacing between adjacent teeth within the same row was properly configured, cooperative rock breaking occurred between teeth in the same row. When the number of cutter tooth rows was suitably arranged, the rock ridges between adjacent rows fractured. This process led to progressive rock breakage between consecutive rows of teeth, as observed on the specimen surface in Scheme 3 in Figure 21. A comparative analysis of the crushing effects among different schemes showed that Scheme 3 exhibited the most extensive rock fragmentation, characterized by the largest crushing pit and fully interconnected transverse and longitudinal cracks. In contrast, Scheme 1 produced the smallest crushing pit, whereas Scheme 9 exhibited the least developed crack propagation, with no complete interconnection between transverse or longitudinal fractures.
As shown in Figure 21, the number of peaks in the instantaneous normal force and rolling force curves was the same. Each peak corresponded to a row of cutter teeth penetrating the rock and forming a row of crushing pits. The penetration process revealed more pronounced variations in the instantaneous normal force than in the rolling force, indicating the dominant influence of the normal force on rock-breaking behaviour.
5.2. Range Analysis
The sensitivity of factors affecting the rock-breaking force, SE, QFn, and PS, was evaluated using range analysis. The corresponding results are summarized in Table 6.
Table 6.
Range analysis.
The range analysis results in Table 6 indicated a consistent ranking of the factors influencing both Fn and Fr. The descending order of influence was as follows: cutter tooth edge geometry > penetration depth (P) > large cone-end diameter (D) > cone angle (λ). These results demonstrate that cutter tooth edge geometry is the dominant factor affecting both Fn and Fr, whereas the cone angle has a negligible influence. For SE during the rock-cutting process, the order of factor influence was cutter tooth edge geometry > penetration depth (P) > cone angle (λ) > large cone-end diameter (D). This ranking highlights cutter tooth edge geometry as the critical determinant of rock-breaking efficiency, whereas the influence of the large cone-end diameter is relatively limited. The influence rankings for QFn and PS were similarly consistent. The factors were ranked as: penetration depth (P) > cutter tooth edge geometry > cone angle (λ) > large cone-end diameter (D). These results indicate that cutter tooth edge geometry is a key structural parameter governing crack propagation and the relative ease of rock breakage.
5.3. Factor Analysis
5.3.1. Rock-Breaking Force
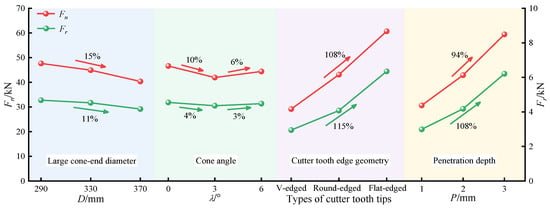
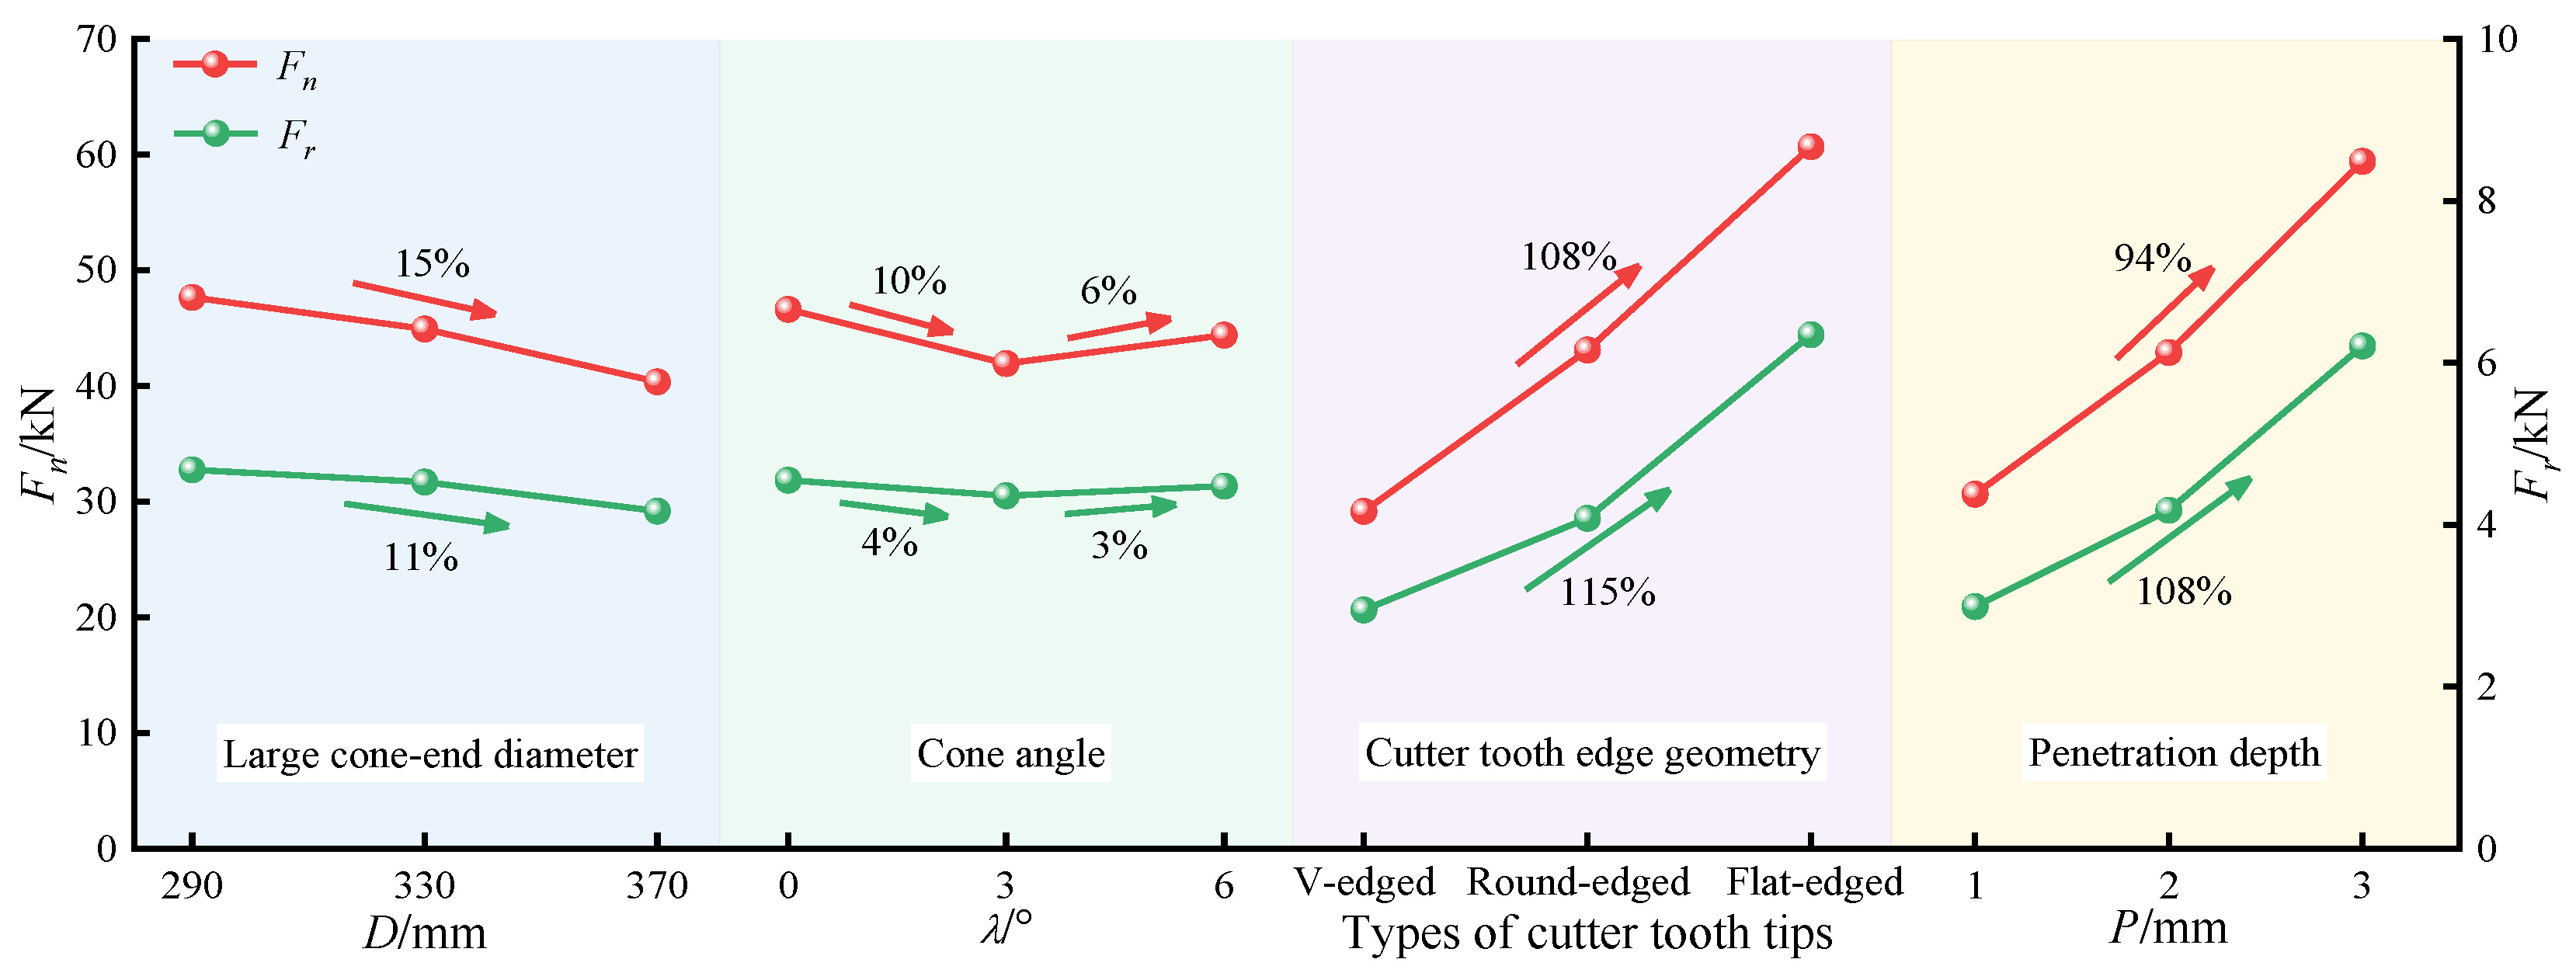
The effects of different factors on Fn and Fr are shown in Figure 22. Both forces exhibited a negative correlation with the large cone-end diameter of the roller cutter. When the large cone-end diameter increased from 290 mm to 370 mm, Fn and Fr decreased by 15% and 11%, respectively. In contrast, as the cone angle increased, both Fn and Fr initially decreased and then increased, reaching their minimum values at a cone angle of 3°. The highest values of Fn and Fr were observed for flat-edged cutter teeth, followed by round-edged teeth. The lowest values were associated with V-edged cutter teeth. This trend is mainly attributed to differences in the tooth–rock contact conditions. Flat-edged teeth exhibited the largest contact area, followed by round-edged and V-edged teeth. In addition, both Fn and Fr were positively correlated with penetration depth. When the penetration depth increased from 1 to 3 mm, Fn and Fr increased by 94% and 108%, respectively.
Figure 22.
Range analysis of average rock-breaking force.
5.3.2. Specific Energy (SE)
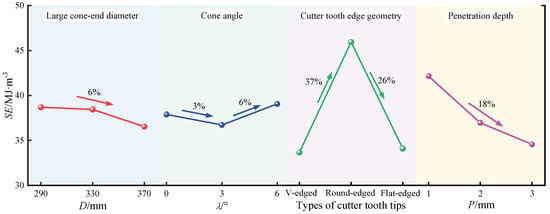
Figure 23 illustrates the effects of different parameters on SE. As shown, SE decreased with increasing large cone-end diameter and penetration depth. When the large cone-end diameter increased from 290 to 370 mm, SE decreased by only 6%, indicating a limited influence of cutter diameter on rock-breaking efficiency. In contrast, when the penetration depth increased from 1 to 3 mm, SE decreased by 18%. This reduction was mainly attributed to deeper penetration, which enabled the roller cutter to engage in both synergistic and progressive rock fragmentation mechanisms, thereby substantially increasing the volume of fractured rock. SE initially decreased and then increased with increasing cone angle, reaching a minimum value of 36.72 at a cone angle of 3°, where rock-breaking efficiency was maximized. Among the different cutter tooth edge geometries, round-edged cutter teeth yielded the highest SE value of 45.94 , indicating the lowest efficiency. In contrast, V-edged cutter teeth resulted in the lowest SE value of 33.65 , corresponding to the highest efficiency. This behaviour can be explained by the relatively small cutting force and energy required for V-edged teeth to penetrate and fracture the rock. In comparison, flat-edged cutter teeth, despite their large contact areas, caused extensive rock fragmentation. Round-edged cutter teeth provided a smaller contact area but required a higher cutting force, which reduced overall efficiency.
Figure 23.
Range analysis of SE.
5.3.3. Damage Factor (QFn)
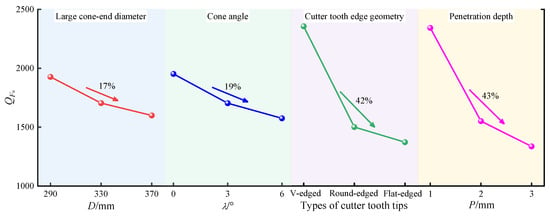
The influence of various factors on QFn is illustrated in Figure 24. The value of QFn decreased with increasing large cone-end diameter, cone angle, and penetration depth. Specifically, when the cone-end diameter increased from 290 to 370 mm, QFn decreased by 17%. When the cone angle increased from 0° to 6°, QFn decreased by 19%. In addition, as the penetration depth increased from 1 to 3 mm, QFn decreased by 43%. The effects of cone-end diameter and cone angle on microcrack formation during roller cutter rock breaking were relatively limited. In contrast, penetration depth exerted a notably stronger influence. Among the different cutter tooth edge geometries, V-edged cutter teeth yielded the highest QFn, indicating the greatest number of cracks generated per unit normal force. Round-edged cutter teeth ranked second, whereas flat-edged cutter teeth exhibited the lowest QFn, corresponding to the fewest cracks under equivalent loading conditions.
Figure 24.
Range analysis of QFn.
5.3.4. Proportion of Shear Cracks (PS)
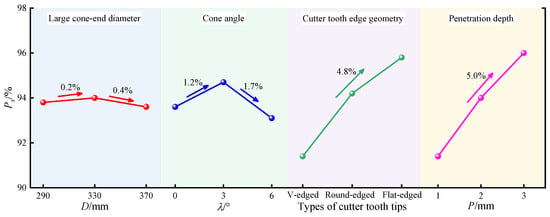
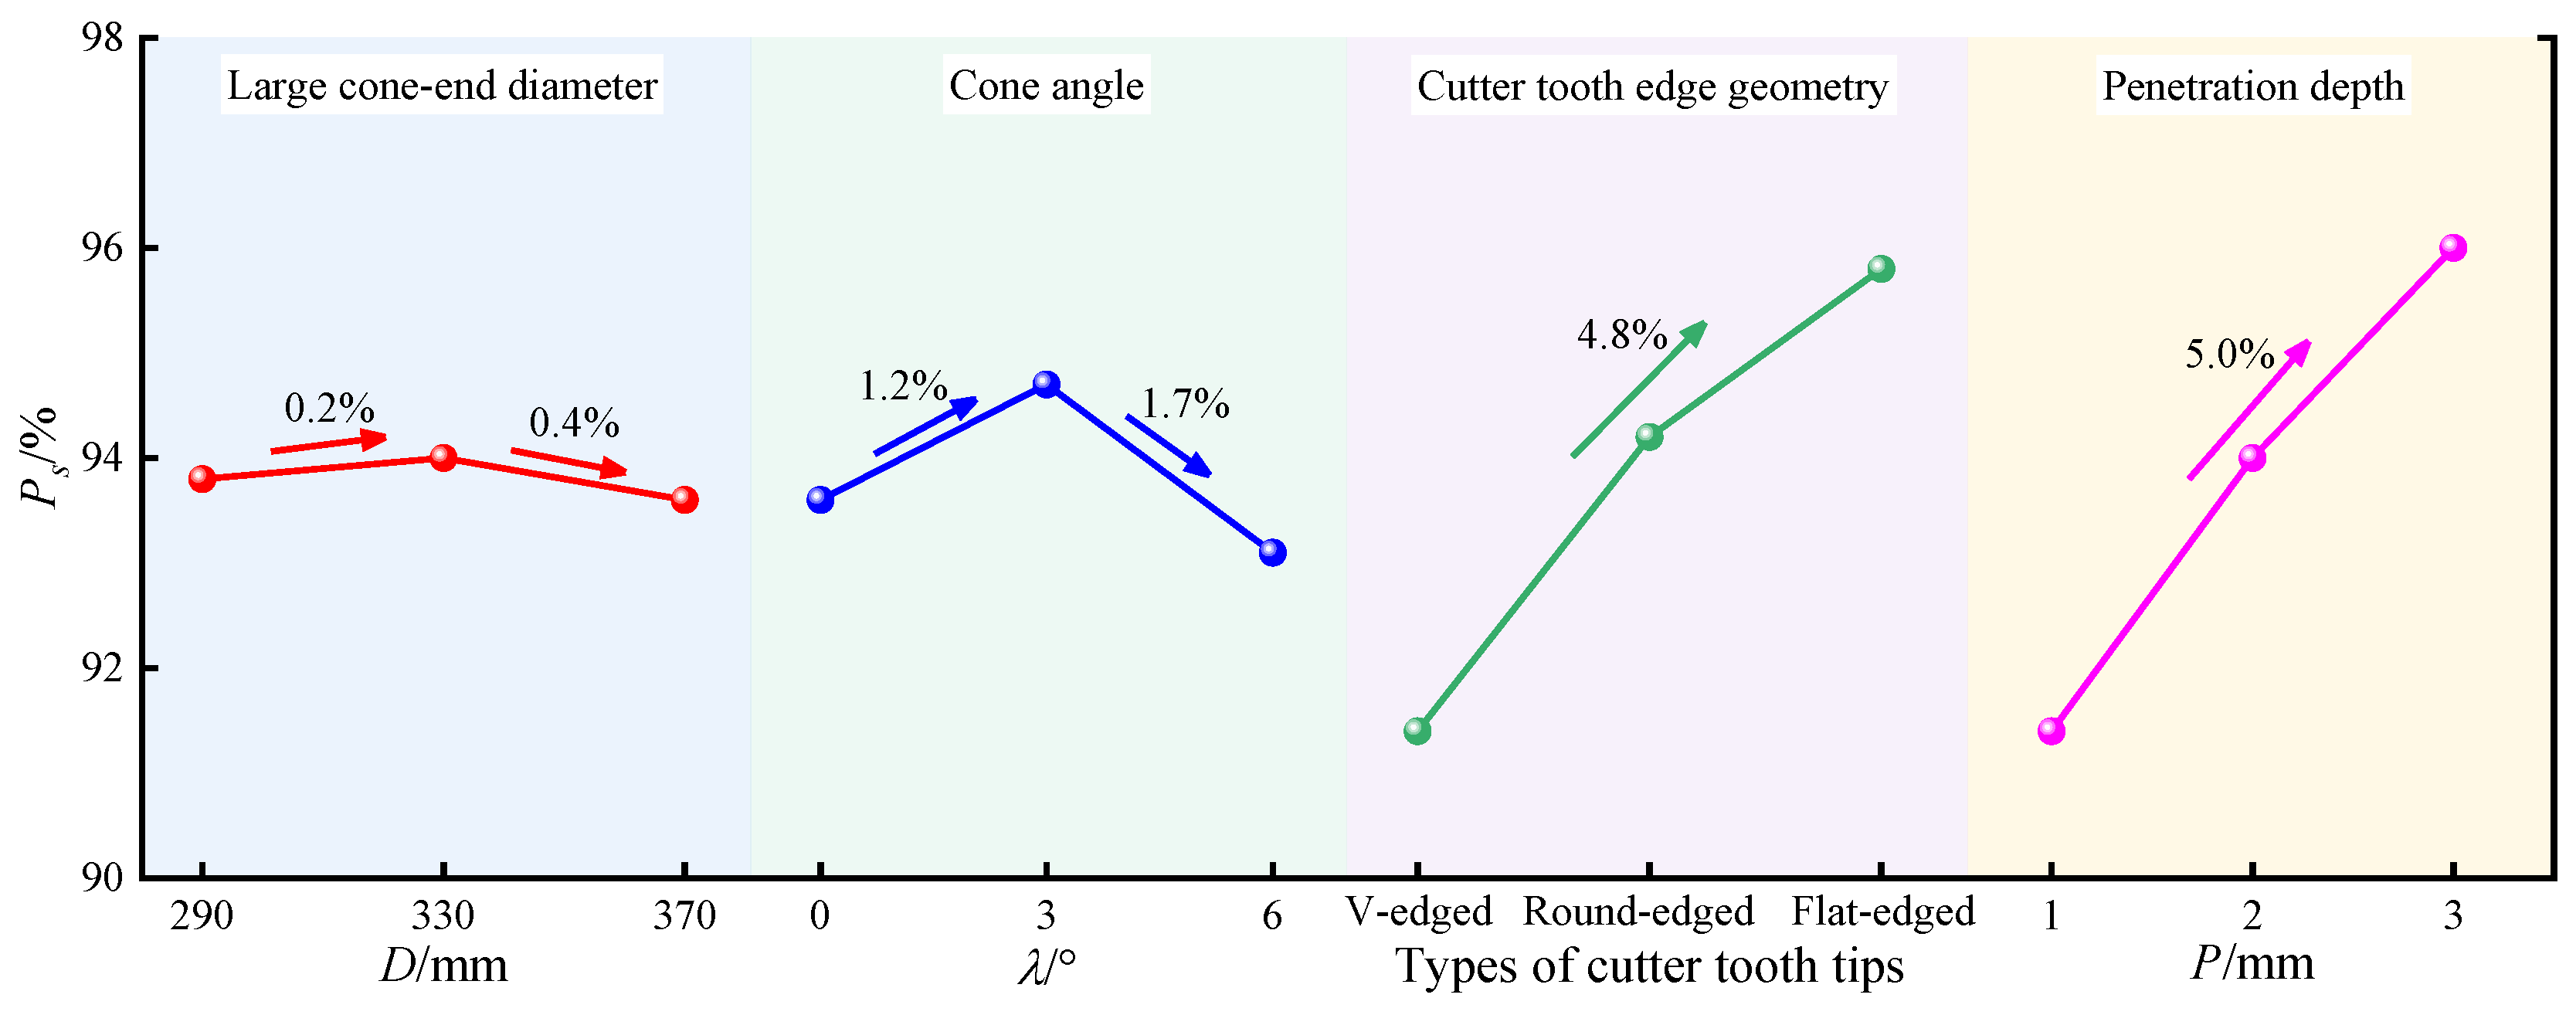
The effects of different factors on PS are shown in Figure 25. The PS value initially increased and then decreased with an increase in the cone-end diameter and cone angle. The maximum PS value of 94.0% was obtained at a cone-end diameter of 330 mm, whereas a maximum value of 94.7% was observed at a cone angle of 3°. Among the three cutter tooth edge geometries, flat-edged cutter teeth yielded the highest PS, followed by round-edged cutter teeth, whereas V-edged cutter teeth exhibited the lowest PS. When the tooth edge geometry was changed from V-edged to flat-edged, PS increased by 4.8%, suggesting enhanced energy utilization efficiency during rock cutting. Furthermore, PS increased with penetration depth. Specifically, an increase of 5.0% was observed as penetration depth increased from 1 to 3 mm. This trend indicates improved energy utilization efficiency of milled-tooth roller cutters at greater penetration depths.
Figure 25.
Range analysis of PS.
5.4. Analysis Using the Efficacy Coefficient Method
The aforementioned range analysis optimized the structural parameters of the roller cutter using a single evaluation criterion. To enable more comprehensive optimization, both macroscopic and microscopic indicators of rock-breaking performance were considered in this study. Specifically, SE was adopted as a macroscopic indicator, whereas QFn and PS were employed as microscopic ones. A comprehensive evaluation of the cutter structural parameters was conducted using the efficacy coefficient method [55]. This method quantifies the degree of satisfaction for each performance indicator and calculates the overall performance score. The acceptable and unacceptable values for each indicator are listed in Table 7, and the corresponding efficacy coefficients derived from Equation (5) are presented in Table 8.
where , , and represent the efficiency coefficient value, unacceptable value and acceptable value of the i-th indicator, respectively.
Table 7.
Acceptable and unacceptable values for each indicator.
Table 8.
Efficiency coefficient calculation results.
As shown in Table 8, Group 8# exhibited the highest total efficacy coefficient, with a value of 89.78. This result indicates that the roller cutter achieved optimal overall rock-breaking performance and the highest efficiency under these conditions. Accordingly, the optimal milled-tooth roller cutter configuration consisted of V-edged teeth, a large cone-end diameter of 370 mm, and a cone angle of 3°.
6. Comparison Between Prototype and Optimized Roller Cutters
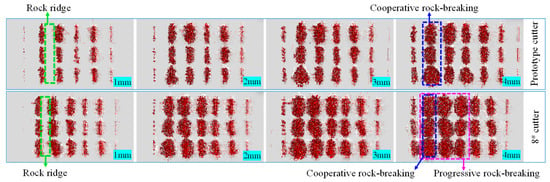
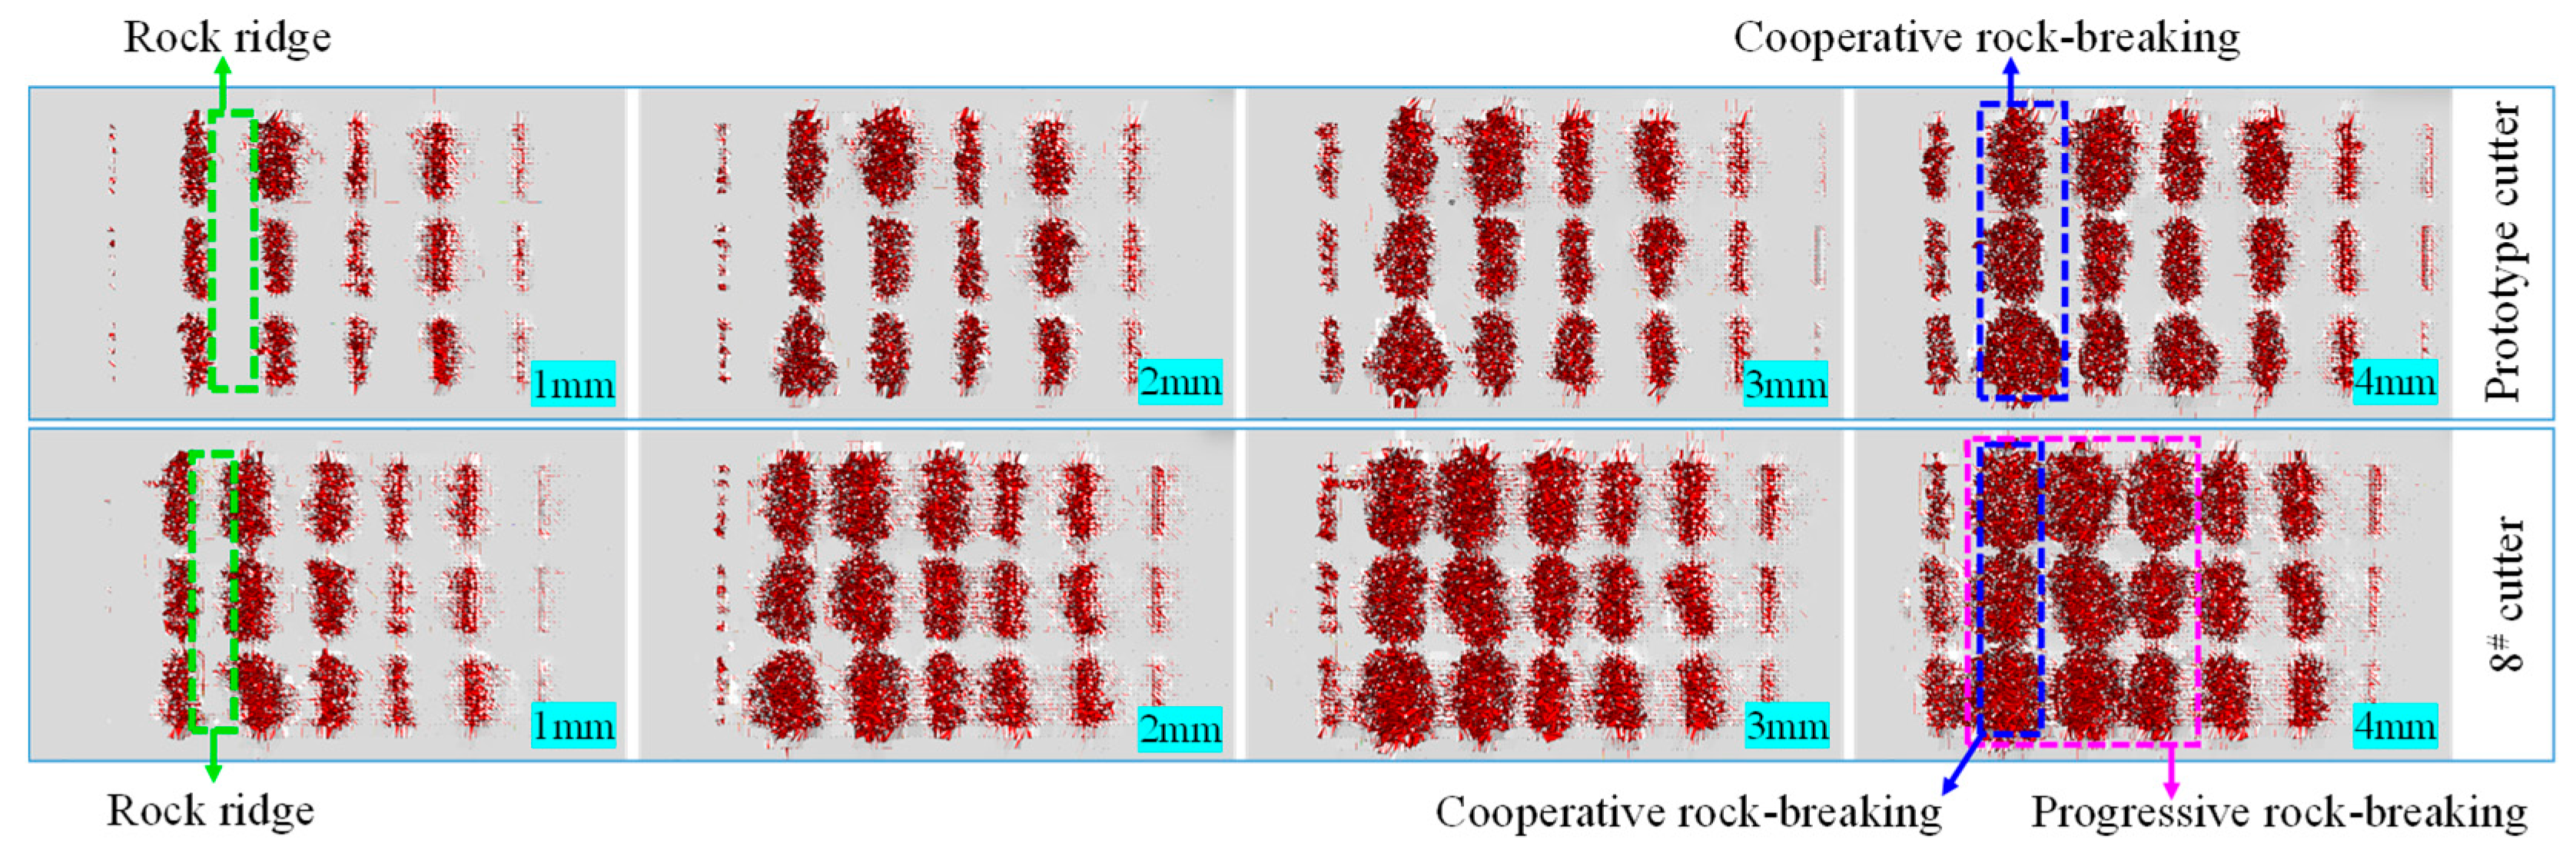
Linear cutting rock-breaking simulations were conducted for both the prototype cutter and the Group 8# cutter (designated as the 8# cutter). The simulations were performed for a duration of 4 s at penetration depths of 1.0, 2.0, 3.0, and 4.0 mm. The performance differences between the two cutters were evaluated in terms of rock-breaking force, SE, QFn, and PS. As shown in Figure 26, the rock damage cloud maps of the two cutters were compared. The 8# cutter produced a larger crushing pit, more extensive rock fragmentation, and a greater number of surrounding cracks than the prototype cutter. These results indicate that the optimized 8# cutter exhibited superior rock-breaking performance.
Figure 26.
Rock-breaking surfaces of the two types of cutters.
6.1. Rock-Breaking Force
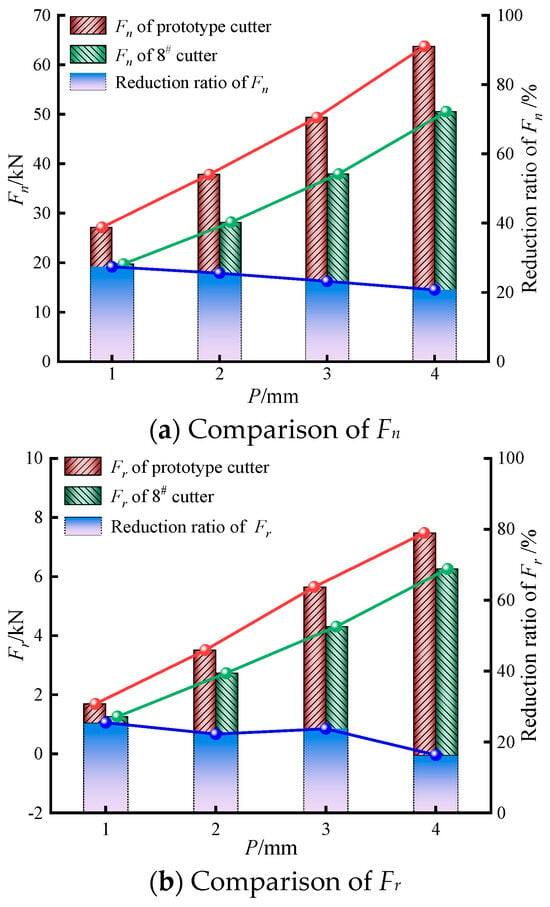
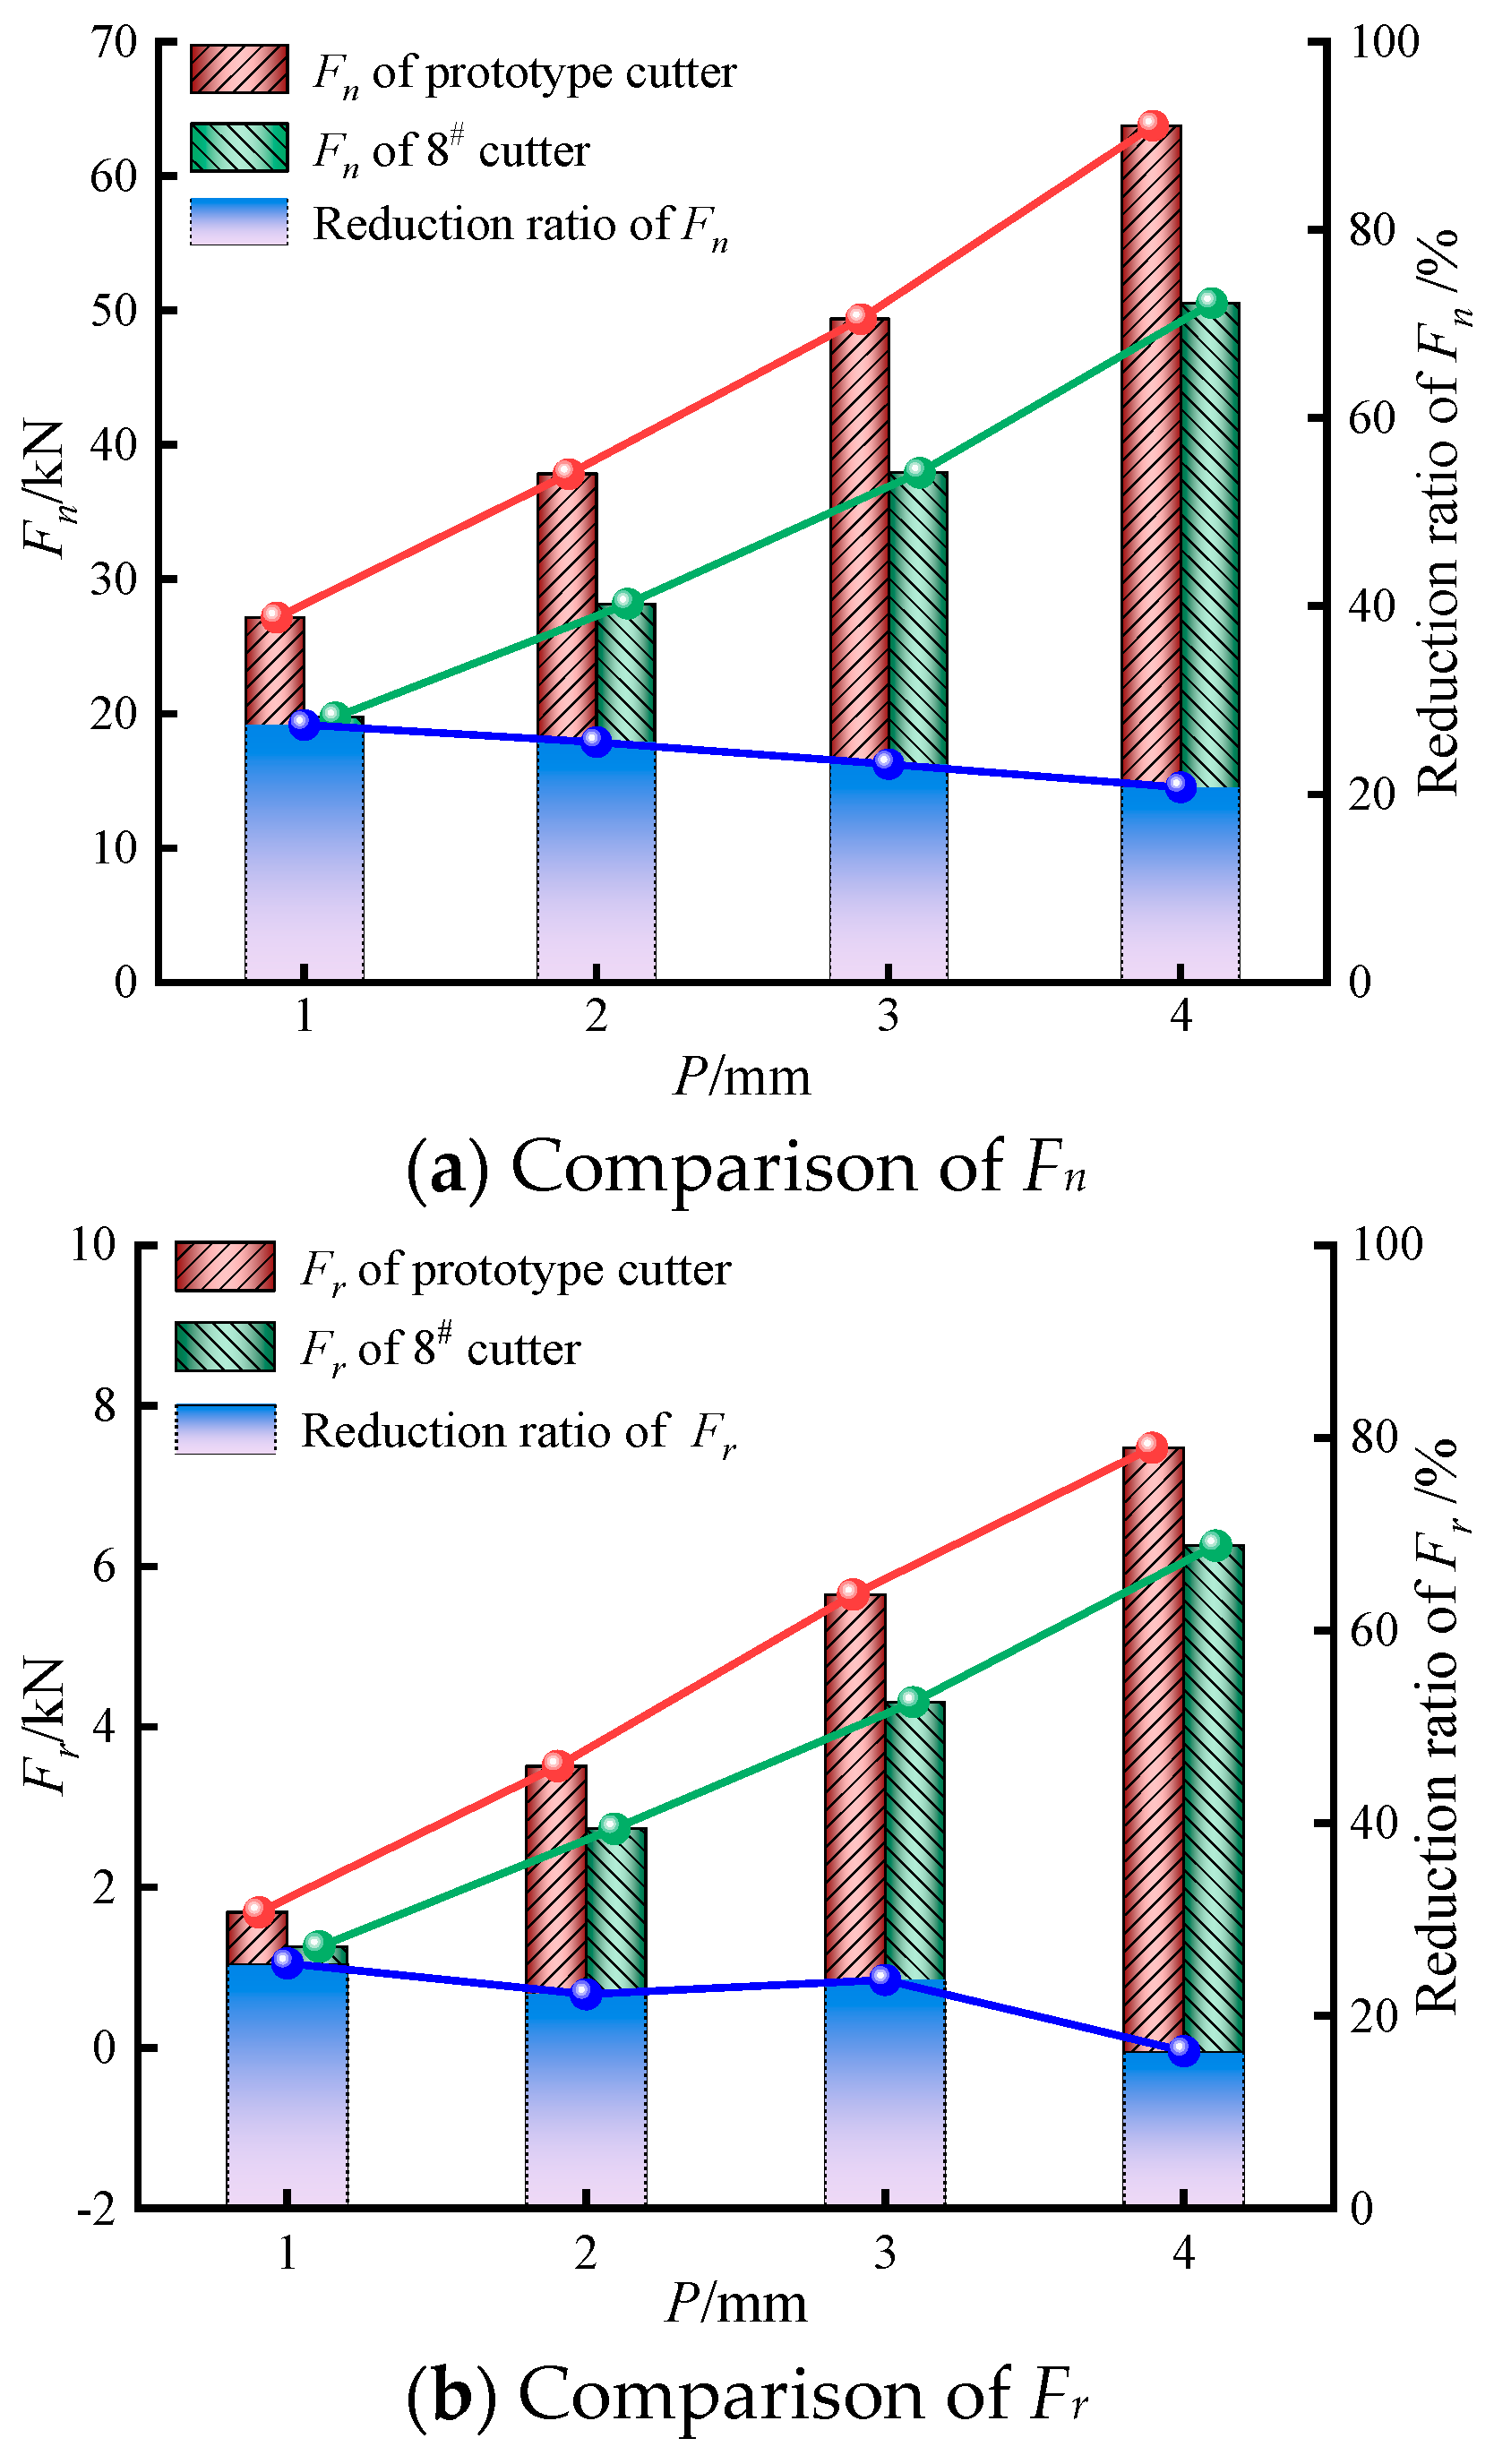
A comparison of Fn and Fr between the prototype cutter and the 8# cutter is shown in Figure 27. As illustrated, both Fn and Fr for the 8# cutter were lower than those for the prototype cutter. Specifically, the maximum reductions in Fn and Fr achieved by the 8# cutter were 27.38% and 25.44%, respectively. From the perspective of rock-breaking force, the 8# cutter required a lower applied force under identical operating conditions. When combined with the larger fracture zone observed for the 8# cutter, these results indicate enhanced rock-breaking performance and improved energy efficiency. In addition, during penetration, Fn exceeded Fr for both cutters, highlighting the dominant role of the normal force in rock fragmentation, with the rolling force acting as a secondary contributor.
Figure 27.
Comparison of rock-breaking forces between prototype cutter and 8# cutter.
6.2. Specific Energy (SE)
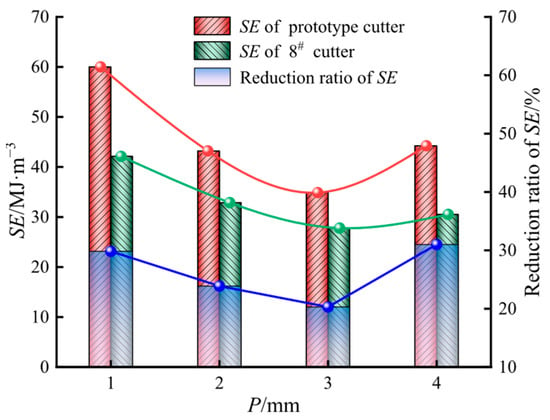
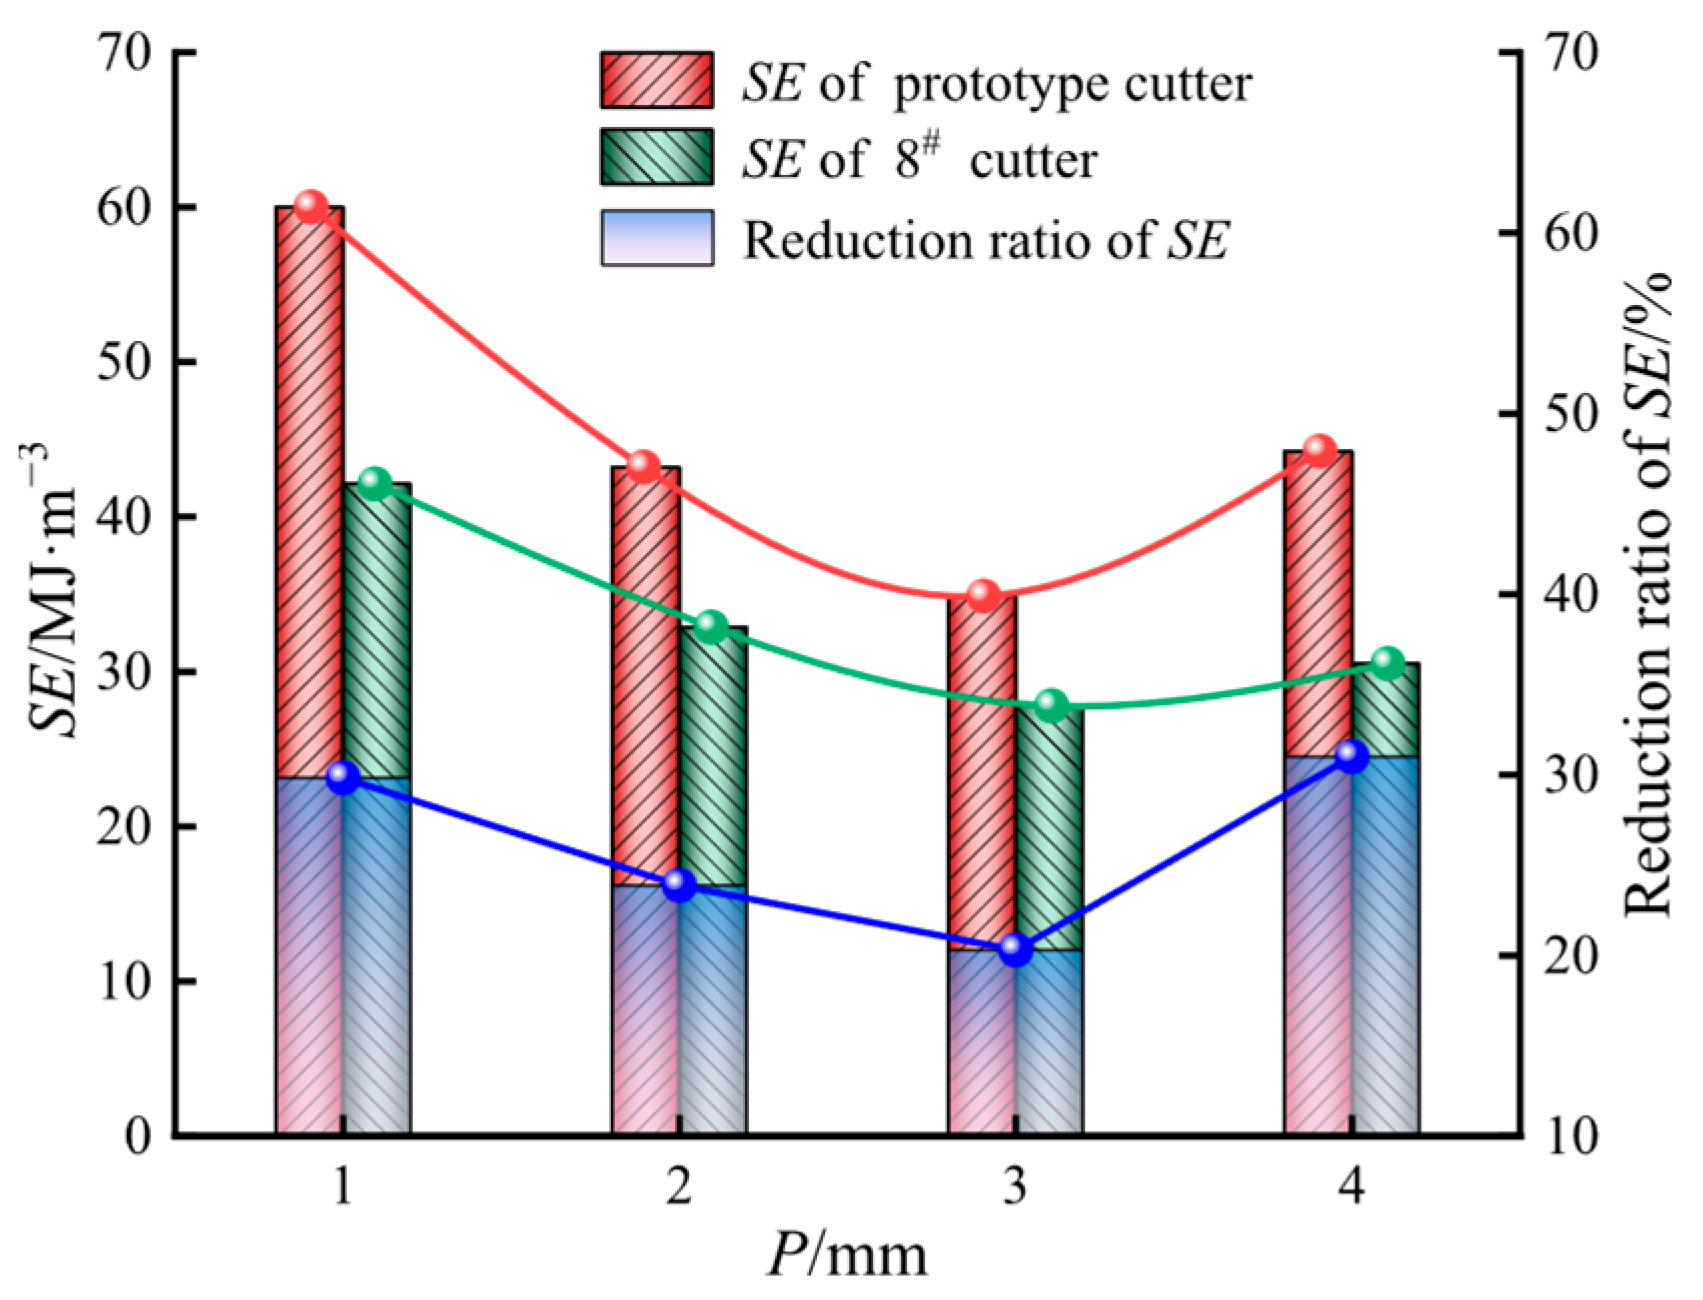
Figure 28 compares the SE curves for rock cutting obtained using the prototype cutter and the 8# cutter. As shown, SE for both cutters initially decreased and then increased with increasing penetration depth, reaching a minimum value at a penetration depth of 3 mm. This trend indicates that a penetration depth of 3 mm resulted in the highest rock fragmentation efficiency for both cutters. At a penetration depth of 4 mm, the 8# cutter exhibited both progressive rock fragmentation and cooperative breaking between cutter teeth. Under these conditions, the rock ridges between adjacent crushing pits were effectively fractured, leading to a substantial increase in the volume of fragmented rock and a marked improvement in rock-breaking performance. In contrast, the prototype cutter exhibited only cooperative breaking between cutter teeth and lacked progressive fragmentation. Consequently, despite the increased rock-breaking force, SE increased owing to the limited volume of fragmented rock. In addition, the 8# cutter consistently exhibited lower SE values than the prototype cutter at all penetration depths. The maximum reduction in SE reached 31% at a penetration depth of 4 mm. From an energy consumption perspective, these results indicate that the 8# cutter achieved substantially higher rock-breaking efficiency than the prototype cutter.
Figure 28.
Comparison of SE between prototype cutter and 8# cutter.
6.3. Damage Factor (QFn)
Figure 29 illustrates the QFn curves for both the prototype cutter and the 8# cutter. For both cutters, QFn decreased with increasing penetration depth. At a penetration depth of 1 mm, the maximum QFn values were reached. This result indicates that the highest crack number and density per unit normal force occurred under these conditions, with the minimal energy required per unit crack. A comparison between the two cutters showed that the 8# cutter exhibited higher QFn values than the prototype cutter. Notably, at a penetration depth of 2 mm, the 8# cutter achieved the most significant improvement, with a QFn value 48% higher than that of the prototype cutter. These results indicate that the 8# cutter generated a greater crack density per unit of normal force and required less energy per crack unit, thereby demonstrating superior rock-breaking performance. Under identical conditions, the 8# cutter enabled more efficient rock fragmentation.
Figure 29.
Comparison of QFn between prototype cutter and 8# cutter.
6.4. Proportion of Shear Cracks (PS)
Figure 30 shows the PS values for the prototype cutter and the 8# cutter. For both cutters, PS increased with increasing penetration depth. At a penetration depth of 4 mm, PS reached its maximum value for both cutters, indicating that energy utilization during rock breaking was the most efficient at this depth. A comparison of PS values between the two cutters showed that the 8# cutter consistently exhibited higher PS values than the prototype cutter. Specifically, at a penetration depth of 2 mm, the 8# cutter achieved the largest increase in PS compared to the prototype cutter, with a maximum increase of 2.66%. This result indicates that the 8# cutter more readily induced shear failure in the rock, thereby enhancing energy utilization efficiency during the rock-breaking process.
Figure 30.
Comparison of PS between prototype cutter and 8# cutter.
In conclusion, the comparative analysis of the prototype cutter and the 8# cutter in terms of average force, rock-breaking efficiency, damage characteristics, and energy utilization demonstrated that the 8# cutter outperformed the prototype cutter.
7. Discussion
- (1)
- In the numerical simulations conducted in this study, the computational model was simplified because of limitations in computing power. Consequently, certain mechanical parameters of the shaft drilling rig, such as rotational speed, as well as physical properties of the drilling fluid, such as viscosity, were not considered when evaluating the rock fragmentation efficiency of the roller cutter. Future studies should incorporate these mechanical and fluid-related parameters to perform numerical simulations or laboratory experiments under conditions that more closely represent field operations. This approach would facilitate further optimization of cutter design.
- (2)
- The process from roller cutter structural optimization to manufacturing, laboratory validation, and eventual field testing is time-consuming. Consequently, the 8# roller cutter developed in this study has not yet been applied in engineering practices. Future studies should first verify the rock fragmentation performance of the 8# cutter through laboratory experiments. Subsequently, its structural parameters and tooth layout should be further refined, followed by application of the optimized design in engineering projects. In addition, relevant enterprises have already been contacted, and preparations are underway to deploy the 8# cutter in the construction of the next coal mine shaft using the drilling method.
- (3)
- Gong et al. [27] demonstrated that when tool wear was comprehensively considered, round-edged disc-type roller cutters exhibited optimal rock fragmentation performance. In contrast, the present study, which did not account for tool wear, indicated that V-edged tooth roller cutters achieved the best performance. Therefore, future research should evaluate the rock fragmentation efficiency of roller cutters with different tooth edge geometries under conditions that explicitly consider tool wear. Such investigations would further contribute to optimizing the overall performance of milled-tooth roller cutters.
8. Conclusions
- (1)
- The results of the linear cutting tests using the milled-tooth roller cutter indicated that the average rock-breaking force increased with penetration depth. The maximum rock fragmentation efficiency was achieved at a penetration depth of 3.0 mm. The maximum deviations between numerical simulation results and experimental measurements for average normal force, rolling force, and specific energy were 9.94%, 11.34%, and 13.29%, respectively. These results confirm the accuracy and reliability of the numerical model developed in this study.
- (2)
- The influence ranking of the investigated factors on rock-breaking force was as follows: cutter tooth edge geometry > penetration depth > large cone-end diameter > cone angle. For specific energy, the order of influence was cutter tooth edge geometry > penetration depth > cone angle > large cone-end diameter. The factors affecting the damage factor and proportion of shear cracks were ranked as follows: penetration depth > cutter tooth edge geometry > cone angle > large cone-end diameter. Overall, cutter tooth edge geometry exerted the most significant influence on average force and specific energy, whereas penetration depth primarily affected the damage factor and proportion of shear cracks.
- (3)
- Rock-breaking force was negatively correlated with the large cone-end diameter and varied nonlinearly with cone angle, initially decreasing and then increasing. It exhibited a positive correlation with penetration depth, and the maximum force was observed for flat-edged cutter teeth. Specific energy decreased with increasing large cone-end diameter and penetration depth but followed a decreasing–increasing trend with increasing cone angle. The maximum specific energy was observed for round-edged teeth. The damage factor decreased with increasing cone-end diameter, cone angle, and penetration depth, with the highest value obtained for V-edged teeth. The proportion of shear cracks initially increased and then decreased with increasing cone-end diameter and cone angle, and it increased with penetration depth. The maximum proportion of shear cracks was observed in flat-edged teeth.
- (4)
- Using the efficacy coefficient method, the 8# roller cutter, characterized by a large cone-end diameter of 370 mm, a cone angle of 3°, and V-edged teeth, was identified as the most effective cutter configuration. Comparative simulation results demonstrate that the 8# cutter exhibits superior performance, achieving a maximum increase in rock fragmentation efficiency of 31% and a maximum reduction in rock fragmentation difficulty of 48%.
Author Contributions
Data curation, X.W.; formal analysis, X.W.; writing—original draft, X.W.; investigation, H.C.; writing–review and editing, H.C.; data acquisition, Y.W.; interpretation, Y.W.; supervision, Y.W.; validation, J.W.; software, Z.W. All authors have read and agreed to the published version of the manuscript.
Funding
This research received no external funding.
Data Availability Statement
The data used to support the findings of this study are available from the corresponding author upon request.
Conflicts of Interest
The authors declare that there are no conflicts of interest regarding the publication of this paper.
References
- Fan, J.D.; Yan, Z.G.; Li, C. Exploration of intelligent coal mining key technology based on 5G technology. Coal Sci. Technol. 2020, 48, 92–97. [Google Scholar]
- Liu, Z.Q.; Song, Z.Y.; Cheng, S.Y.; Ji, H.G.; Tan, J.; Jing, G.Y. Equipment and key technologies for full-section scientifically drilling of kilometer-level vertical shafts. J. China Coal Soc. 2020, 45, 3645–3656. [Google Scholar]
- Tan, J.; Liu, Z.Q.; Song, Z.Y.; Liu, Q.H.; Long, Z.Y.; Ning, F.B. Status and development trend of mine shaft sinking technique in China. Metal Mine 2021, 5, 13–24. [Google Scholar]
- Yao, Z.H.; Wang, F.H.; Song, H.Q.; Yan, Z.J.; Hu, C.H. Application of high performance fiber reinforced concrete in deep drilling wellbore bottom construction. Coal Eng. 2025, 57, 42–48. [Google Scholar]
- Fan, J.D.; Feng, H.; Song, Z.Y.; Ren, H.W.; Ma, Y.; Wang, Q.C.; Tan, J.; Liu, Q.H.; Li, C. Key technology and equipment of intelligent mine construction of whole mine mechanical rock breaking in Kekegai Coal Mine. J. China Coal Soc. 2022, 47, 499–514. [Google Scholar]
- Rostami, J. Study of pressure distribution within the crushed zone in the contact area between rock and disc cutters. Int. J. Rock Mech. Min. Sci. 2013, 57, 172–186. [Google Scholar] [CrossRef] [Scilit]
- Cho, J.W.; Jeon, S.; Jeong, H.Y.; Chang, S.H. Evaluation of cutting efficiency during TBM disc cutter excavation within a Korean granitic rock using linear-cutting-machine testing and photogrammetric measurement. Tunn. Undergr. Space Technol. 2013, 35, 37–54. [Google Scholar] [CrossRef] [Scilit]
- Abu Bakar, M.Z.; Gertsch, L.S.; Rostami, J. Evaluation of fragments from disc cutting of dry and saturated sandstone. Rock Mech. Rock Eng. 2014, 47, 1891–1903. [Google Scholar] [CrossRef] [Scilit]
- Gertsch, R.; Gertsch, L.; Rostami, J. Disc cutting tests in Colorado Red Granite: Implications for TBM performance prediction. Int. J. Rock Mech. Min. Sci. 2007, 44, 238–246. [Google Scholar] [CrossRef] [Scilit]
- Xue, Y.D.; Wang, J.C.; Zhou, M.L.; Liu, J.; Guo, Y.F.; Wang, J.X. Prediction of optimum TBM penetration strategy with minimum energy consumption in hard rocks. Comput. Geotech. 2022, 148, 104844. [Google Scholar] [CrossRef] [Scilit]
- Li, X.T.; Zhang, M.Q.; Mo, J.L. Wear and abnormal fracture failure mechanisms of alloy teeth in TBM insert tooth disc cutters. Eng. Fail. Anal. 2025, 167, 109051. [Google Scholar] [CrossRef] [Scilit]
- Huang, X.; Tang, M.; Wang, S.; Zhai, Y.; Zhuang, Q.; Zhang, C.; Lei, Q. Assessing cutter-rock interaction during TBM tunnelling in granite: Large-scale standing rotary cutting tests and 3D DEM simulations. J. Rock Mech. Geotech. Eng. 2024, 16, 3595–3615. [Google Scholar] [CrossRef] [Scilit]
- Deng, L.C.; Zhang, F.B.; Li, X.Z.; Zhang, C.; Ji, Y.K.; Wu, Y. Experimental and numerical investigations on rock breaking of TBM disc cutter based on a novel platform with rotational cutting. Rock Mech. Rock Eng. 2024, 56, 1415–1436. [Google Scholar] [CrossRef] [Scilit]
- Gong, Q.M.; Du, X.L.; Li, Z.; Wang, Q.X. Development of a mechanical rock breakage experimental platform. Tunn. Undergr. Space Technol. 2016, 57, 129–136. [Google Scholar] [CrossRef] [Scilit]
- Yin, L.J.; Gong, Q.M.; Ma, H.S.; Zhao, J.; Zhao, X.B. Use of indentation tests to study the influence of confining stress on rock fragmentation by a TBM cutter. Int. J. Rock Mech. Min. Sci. 2014, 72, 261–276. [Google Scholar] [CrossRef] [Scilit]
- Zhang, X.P.; Ji, P.Q.; Liu, Q.; Liu, Q.; Zhang, Q. Physical and numerical studies of rock fragmentation subject to wedge cutter indentation in the mixed ground. Tunn. Undergr. Space Technol. 2018, 71, 354–365. [Google Scholar] [CrossRef] [Scilit]
- Kang, Y.Q.; Yang, R.S.; Yang, L.Y.; Li, Y.L.; Yao, M.; Gu, S.R. Study on the influence of joint dip angle and spacing on rock fragmentation by TBM double disc cutters. Arch. Civ. Mech. Eng. 2023, 23, 222. [Google Scholar] [CrossRef] [Scilit]
- Song, K.; Yang, H.; Xie, J.; Karekal, S. An optimization methodology of cutter-spacing for efficient mechanical breaking of jointed rock mass. Rock Mech. Rock Eng. 2022, 55, 3301–3316. [Google Scholar] [CrossRef] [Scilit]
- Liu, J.; Hu, B.Y.; Li, J.L.; Chen, Y.X.; Chen, W.; Liu, T.J. Rock breakages caused by an asymmetric cutter and a constant cross-section cutter acting on precuts. Arch. Civ. Mech. Eng. 2025, 25, 100. [Google Scholar] [CrossRef] [Scilit]
- Xiong, C.; Huang, Z.W.; Yang, R.Y.; Sheng, M.; Shi, H.Z.; Dai, X.W.; Wu, X.G.; Zhang, S.K. Comparative analysis cutting characteristics of stinger PDC cutter and conventional PDC cutter. J. Pet. Sci. Eng. 2020, 189, 106792. [Google Scholar] [CrossRef] [Scilit]
- Xiong, C.; Huang, Z.W.; Shi, H.Z.; Yang, R.Y.; Wu, G.; Chen, H.; He, W.H. Performances of a stinger PDC cutter breaking granite: Cutting force and mechanical specific energy in single cutter tests. Pet. Sci. 2023, 20, 1087–1103. [Google Scholar] [CrossRef] [Scilit]
- Liu, W.J.; Yang, F.L.; Dong, H.D.; Cheng, R.; Zhu, X.H. Investigate on the mixed-cutting of specially-shaped PDC cutters in granite. Eng. Mech. 2023, 40, 245–256. [Google Scholar]
- Zou, D.Y.; Xu, C.K.; Yi, Y.; Chen, X.P.; Yu, J.P. An experimental study on PDC bits’ cutter parameters and formation adaptability. Nat. Gas Ind. 2017, 37, 85–90. [Google Scholar]
- Tumac, D.; Balci, C. Investigations into the cutting characteristics of CCS type disc cutters and the comparison between experimental, theoretical and empirical force estimations. Tunn. Undergr. Space Technol. 2015, 45, 84–98. [Google Scholar] [CrossRef] [Scilit]
- Balci, C.; Tumac, D. Investigation into the effects of different rocks on rock cuttability by a V-type disc cutter. Tunn. Undergr. Space Technol. 2012, 30, 183–193. [Google Scholar] [CrossRef] [Scilit]
- Yao, X.H.; Zhao, X.B.; Gong, Q.M.; Ma, H.S.; Li, X.Z.; Tang, W.; Lu, G.L.; He, G.W. Linear cutting experiments on crack modes of rock under indentation of a single disc cutter. Chin. J. Geotech. Eng. 2014, 36, 1705–1713. [Google Scholar]
- Gong, Q.M.; Wu, F.; Ma, S.; Zheng, Y.L.; Yin, L.J. Effect of cutter tip type parameters on rock-breaking by linear cutting experiments. J. Cent. South Univ. (Sci. Technol.) 2023, 54, 1098–1108. [Google Scholar]
- Mo, Z.Z.; Li, H.B.; Zhou, Q.C.; Zou, F.; Zhu, X.M.; Wang, C.; Hao, Y. Experimental study of rock microscopic deterioration under wedge cutter. Rock Soil Mech. 2012, 33, 1333–1340. [Google Scholar]
- Chen, L.H.; Labuz, J.F. Indentation of rock by wedge-shaped tools. Int. J. Rock Mech. Min. Sci. 2006, 43, 1023–1033. [Google Scholar] [CrossRef] [Scilit]
- Wu, F.; Yin, L.J.; Zhang, H.; Gong, Q.M. Rock Fragmentation mechanism and efficiency under inserted-tooth roller cutter by rotary cutting test. China J. Highw. Transp. 2018, 31, 150–159. [Google Scholar]
- Ma, H.S.; Yin, L.J.; Wang, C.P.; Chen, L.; Zhao, X.G. Study on rock fragmentation mechanism under single tooth and shape optimization by indentation test. Chin. J. Undergr. Space Eng. 2023, 19, 495–503. [Google Scholar]
- Wu, S.J.; Li, E.T. Research on rock breaking test with pick rolling cutter for mine shaft rising boring. Coal Eng. 2008, 1, 70–72. [Google Scholar]
- Chen, L.; Wei, X.H.; Cao, Q.; Zhou, Y.; Yang, Y.; Hu, C.; Zhou, Z.; Wu, B. Mechanism of rock breaking by convex non-planar PDC cutter and its application in Gravel-bearing formation. China Mech. Eng. 2024, 35, 371–379. [Google Scholar]
- Dong, Z.X.; Zhang, H.; Li, J.; Zhang, K.S.; Ou, Y.Y.; Lu, Z.Y.; Shi, J.G. A Method for Evaluating the Rock Breaking Efficiency of Cutters and Optimizing the PDC Cutter Profile—A Study of Igneous Rock Formations in Shunbei Oilfield. Energies 2022, 15, 6686. [Google Scholar] [CrossRef] [Scilit]
- Tan, Q.; Li, J.F.; Xia, Y.M.; Xu, Z.J.; Zhu, Y.; Zhang, J. Numerical research on rock fragmentation process by disc cutter. Rock Soil Mech. 2013, 34, 2707–2714. [Google Scholar]
- Su, L.J.; Sun, J.S.; Lu, W.B. Research on numerical simulation of rock fragmentation by TBM cutters using particle flow method. Rock Soil Mech. 2009, 30, 2823–2829. [Google Scholar]
- Li, X.F.; Li, H.B.; Liu, Y.Q.; Zhou, Q.C.; Xia, X. Numerical simulation of rock fragmentation mechanisms subject to wedge penetration for TBMs. Tunn. Undergr. Space Technol. 2016, 53, 96–108. [Google Scholar] [CrossRef] [Scilit]
- Hou, Y.H.; Wang, W.; Zhang, X.Y. Study on influence of the rock breaking specific energy based on parameters of spherical insert hob. J. Railw. Sci. Eng. 2020, 17, 1286–1294. [Google Scholar]
- Liu, Y.; Cao, D.B.; Cui, J.B.; Peng, Y. Study on the influence of tooth profile of insert hob on rock breaking performance in hard rock geology. China Meas. Test 2024, 50, 62–68+102. [Google Scholar]
- Munjiza, A.A. The Combined Finite-Discrete Element Method; John Wiley Sons: Hoboken, NJ, USA, 2004. [Google Scholar]
- Jiang, H.X.; Cai, Z.Y.; Zhao, Z.H. Numerical study of hard rock breakage under indenter impact by the hybrid FDEM. Eng. Fract. Mech. 2020, 233, 107068. [Google Scholar] [CrossRef] [Scilit]
- Deng, P.H.; Liu, Q.S.; Huang, X.; Pan, Y.C.; Wu, J. FDEM numerical modeling of failure mechanisms of anisotropic rock masses around deep tunnels. Comput. Geotech. 2022, 142, 104535. [Google Scholar] [CrossRef] [Scilit]
- Zhang, D.K.; Huang, A.L.; Ma, H.S.; Wang, C.L.; Han, Y.; Wang, F.; Li, E. Exploring damage evolution of rock under different penetration and cutter spacing conditions using finite-discrete element method. Comput. Geotech. 2024, 173, 106573. [Google Scholar] [CrossRef] [Scilit]
- Xu, C.; Liu, Q.S.; Tang, X.H.; Sun, L.; Deng, P.H.; Liu, H. Dynamic stability analysis of jointed rock slopes using the combined finite-discrete element method (FDEM). Comput. Geotech. 2023, 160, 105556. [Google Scholar] [CrossRef] [Scilit]
- Lisjak, A.; Garitte, B.; Grasselli, G.; Müller, H.R.; Vietor, T. The excavation of a circular tunnel in a bedded argillaceous rock (Opalinus Clay): Short-term rock mass response and FDEM numerical analysis. Tunn. Undergr. Space Technol. 2015, 45, 227–248. [Google Scholar] [CrossRef] [Scilit]
- Kang, Y.Q.; Yang, R.S.; Yang, L.Y.; Li, C.X.; Chen, J.; Zhu, H.N.; Liu, N. Theoretical and numerical studies of rock breaking mechanism by double disc cutters. Int. J. Min. Sci. Technol. 2023, 33, 815–828. [Google Scholar] [CrossRef] [Scilit]
- Wang, T.; Yan, C.Z.; Zheng, H.; Ke, W.H.; Ali, S. Optimum spacing and rock breaking efficiency of TBM double disc cutters penetrating in water-soaked mudstone with FDEM. Tunn. Undergr. Space Technol. 2023, 138, 105174. [Google Scholar] [CrossRef] [Scilit]
- Wang, T.; Yan, C.; Zheng, H. Investigation on rock breaking and optimum spacing of TBM cutters under confining stress using a continuum-discontinuum method. Eng. Anal. Bound. Elem. 2024, 165, 105775. [Google Scholar] [CrossRef] [Scilit]
- Wang, X.Y.; Cheng, H.; Yao, Z.S.; Lin, J.; Guo, L.H.; Zhang, L.L. Optimization of Cutter Body Parameters for Milled-Tooth Roller Cutters in Shaft Sinking by Drilling Methods: A Case Study in Jurassic Strata of Western China. Rock Mech. Rock Eng. 2025, 1–22. [Google Scholar] [CrossRef] [Scilit]
- Cheng, H.; Wang, X.Y.; Yao, Z.S.; Zhu, J.; Rong, C.X.; Fu, X.P. The calculation model of rock breaking force of milled-tooth roller cutters for shaft sinking by drilling methods in Jurassic Strata of the Western Region. Chin. J. Geotech. Eng. 2025, 1–11. Available online: https://link.cnki.net/urlid/32.1124.tu.20250514.1002.004 (accessed on 24 November 2025).
- Wang, X.Y.; Cheng, H.; Rong, C.X.; Wang, Z.J.; Yao, Z.S.; Zhang, L.L. Strength criterion for Jurassic sandy mudstone based on energy theory. Chin. J. Rock Mech. Eng. 2025, 44, 427–441. [Google Scholar] [CrossRef] [Scilit]
- Wang, X.Y.; Cheng, H.; Lin, J.; Yao, Z.S.; Guo, L.H.; Zhang, L.L. Rotary cutting test on rock-breaking mechanism and efficiency of milled-tooth rolling cutters for shaft sinking by drilling methods. Sci. Rep. 2025, 15, 18393. [Google Scholar] [CrossRef] [Scilit] [PubMed]
- Cheng, H.; Wu, Z.Z.; Wang, X.Y.; Guo, L.H.; Hu, F.Y. Optimization preparation and penetration characteristics of weakly cemented sandy mudstone rock breaking materials. J. Anhui Univ. Sci. Technol. (Nat. Sci.) 2025, 45, 74–82. [Google Scholar]
- Geng, Q.; Wei, Z.Y.; Meng, H. An experimental research on the rock cutting process of the gage cutters for rock tunnel boring machine. Tunn. Undergr. Space Technol. 2016, 52, 182–191. [Google Scholar] [CrossRef] [Scilit]
- Chen, Q.; Wang, C.H.; Wen, P.H.; Wang, M.H.; Zhao, J.X. Comprehensive performance evaluation of low-carbon modified asphalt based on efficacy coefficient method. J. Clean. Prod. 2018, 203, 633–644. [Google Scholar] [CrossRef] [Scilit]

Disclaimer/Publisher’s Note: The statements, opinions and data contained in all publications are solely those of the individual author(s) and contributor(s) and not of MDPI and/or the editor(s). MDPI and/or the editor(s) disclaim responsibility for any injury to people or property resulting from any ideas, methods, instructions or products referred to in the content. |
© 2025 by the authors. Licensee MDPI, Basel, Switzerland. This article is an open access article distributed under the terms and conditions of the Creative Commons Attribution (CC BY) license.