5.1. Algorithm Comparison Results
To assess the effectiveness of the proposed method under controlled conditions, we selected a range of representative object detection networks. It is important to note that while architectures such as EfficientDet and RetinaNet have been historically significant in medical imaging, they were excluded from this specific benchmark. This decision relies on our core design objective: deployment in resource-constrained primary healthcare settings (as detailed in
Section 6.3). These older architectures typically demand higher computational overhead (GFLOPs) and exhibit higher inference latency compared to modern “Nano-scale” detectors. Therefore, our comparison focuses strictly on the state-of-the-art in lightweight, real-time detection.
We compared against the full spectrum of the YOLO family, including YOLOv8n, YOLOv10n [
28], YOLOv11n [
29], and the latest YOLOv12n [
30]. Additionally, to ensure a comprehensive evaluation against diverse detection paradigms (CNN vs. Transformer), we also included the Transformer-based RT-DETR-r18 [
31], DETR [
32], and DEIM [
33]. All models were evaluated using the same dataset and training configuration.
As shown in
Table 2, the proposed algorithm achieves superior detection performance across all three evaluation metrics: Recall reaches 86.1%, while mAP@0.5 and mAP@0.5:0.95 are 84.3% and 52.6%, respectively, securing the top position among all the compared methods. Compared to the state-of-the-art lightweight baseline, YOLOv12n, our method improves Recall by 2.4 percentage points, while also achieving modest gains in both mAP@0.5 and mAP@0.5:0.95. When compared to earlier YOLO versions, including YOLOv8n, YOLOv10n, and YOLOv11n, our method enhances Recall by 1.1 to 6.0 percentage points and consistently outperforms their highest mAP@0.5:0.95 score of 52.2%, demonstrating greater robustness in detection across varying IoU thresholds. Furthermore, the Transformer-based DETR exhibits noticeably lower performance. This performance gap is attributed to the inherent lack of inductive bias in Transformer architectures [
32,
34]. Unlike CNN-based models which can leverage these structural priors to learn efficiently from limited data, DETR-based models typically require large-scale training corpora to learn spatial dependencies from scratch. Consequently, on our pediatric dataset of 2611 images, DETR struggles to generalize as effectively as the convolutional baselines. Similarly, DEIM, while more efficient, still falls short of YOLO-SMD with a Recall of 79.6% and mAP@0.5 of 80.2%. The RT-DETR-r18 also significantly lags behind the YOLO series, further emphasizing the advantages of our method within lightweight detection frameworks. Collectively, these results highlight that, while maintaining a lightweight model, our approach delivers a synergistic improvement in recall, classification accuracy, and localization precision, robustly validating the effectiveness and superiority of the proposed symmetrical modifications for pediatric pneumonia detection tasks.
To further validate that the observed performance improvements over the state-of-the-art YOLOv12n are statistically significant and not attributed to random variations, we conducted a Paired T-Test analysis. We performed five independent training runs for both YOLO-SMD and YOLOv12n under identical hyperparameters but with different random seeds. To ensure a comprehensive statistical evaluation across different dimensions of detection performance, we collected the scores for Recall, mAP@0.5, and mAP@0.5:0.95 from these runs for hypothesis testing. The Paired T-Test results indicate statistically significant improvements across all three metrics. Specifically, the calculated p-values are 0.004 for mAP@0.5, 0.002 for Recall, and 0.007 for mAP@0.5:0.95 (all p < 0.01). These values are well below the standard significance level of 0.05, consistently rejecting the null hypothesis. This statistical evidence confirms that the architectural innovations in YOLO-SMD—specifically the symmetrical integration of SAC2f, SDFM, and DySample—provide robust and consistent improvements not only in general detection accuracy (mAP@0.5) but also in reducing missed diagnoses (Recall) and enhancing boundary localization precision (mAP@0.5:0.95).
As shown in
Table 3, in terms of Average Precision (AP) by category, the proposed method exhibits the strongest performance in the Bacterial Pneumonia category, achieving an AP of 86.3%, significantly surpassing all comparison methods. Compared to the best baseline, YOLOv12n, our method improves AP in this category by 1.7 percentage points, outperforms the average YOLO series performance by approximately 2.5 percentage points, and shows a notable increase of nearly 15.5 percentage points over RT-DETR-r18. These results highlight the proposed method’s superior discriminative power and greater detection reliability in identifying and localizing Bacterial Pneumonia lesions. In the Viral Pneumonia category, the AP values of the YOLO base-line models range from 80.5% to 83.5%, with YOLOv12n achieving the highest AP of 83.5%. Our method achieves an AP of 82.4% in this category, slightly lower than YOLOv12n’s best result, but still significantly outperforming RT-DETR-r18 and exceeding the average performance of the other models. Overall, combining the results across both pneumonia categories, the proposed method demonstrates a significant accuracy improvement for Bacterial Pneumonia while maintaining comparable performance to the leading YOLO models for Viral Pneumonia. As a result, the overall category average precision is marginally superior to that of the strongest baseline. This demonstrates that, without significantly compromising detection performance in any category, the proposed method primarily enhances the detection capability for Bacterial Pneumonia, effectively addressing the practical need for high sensitivity and precision in the identification of such lesions in real-world applications.
As shown in
Table 4, there are significant differences in recall rates across different algorithms for the two types of pneumonia. For viral pneumonia, our method achieves a recall rate of 92.1%, ranking first among all models; for bacterial pneumonia, the recall rate is 80.1%, which, though not the highest, remains highly competitive. Overall, our method performs excellently in both categories, especially in the viral pneumonia category, where the recall rate is significantly improved and clearly outperforms YOLOv8n, YOLOv10n, YOLOv11n, YOLOv12n, and RT-DETR-r18. Compared to YOLOv12n, our method improves the recall rate by 2.3 percentage points for viral pneumonia detection, demonstrating superior detection capability. Although our method is not the absolute best in the bacterial pneumonia category, it consistently outperforms YOLOv12n in both categories, with particularly remarkable improvement in viral pneumonia. This improvement better addresses the critical need to reduce false negatives in medical image detection tasks, aligning with the practical demands of real-world applications.
Based on the performance data in
Table 5, YOLOv8 + SDFM emerges as the best overall performer among the algorithm configurations. It achieves the lowest latency and the highest real-time frame rate with only a slight increase in computational load, significantly enhancing the efficiency of the base model. In contrast, the standalone use of the C2f-Star-CAA module notably increases latency and reduces frame rate, while the addition of the DySample module fails to deliver performance gains in the tests. Combining SDFM with C2f-Star-CAA presents a compromise solution, potentially balancing other improved features at the cost of some performance degradation. Therefore, in scenarios where real-time performance is required, the pure SDFM enhancement should be prioritized.
Table 6 demonstrates the trade-offs among different models in terms of speed, resource consumption, and computational efficiency. YOLOv8n stands out as the most exceptional performer, achieving the highest real-time processing capability and the lowest latency with the minimal GPU memory consumption and computational load, making it the optimal choice for scenarios that prioritize extreme speed. In contrast, RT-DETR-r18 suffers from a heavy computational burden and the highest GPU memory consumption, resulting in the slowest speed and the highest latency. Although YOLOv12n has the lowest computational load, its speed does not surpass that of its predecessors. The proposed Ours model, however, demonstrates an excellent balance: its speed significantly outperforms RT-DETR-r18 and YOLOv12n, second only to YOLOv8n. At the same time, its computational load and GPU memory consumption (10.8 GB) are both maintained at a moderately low level, making it a well-rounded solution that balances real-time performance with hardware resource efficiency. It is worth noting that the final model selection should also consider detection accuracy metrics such as mAP, which are not included in the table.
To justify the architectural design of YOLO-SMD, we compared our proposed modules (C2f-Star-CAA and SDFM) against several mainstream attention mechanisms and advanced operators, including SE [
17], CBAM [
18], SimAM [
35], and CARAFE [
20]. All variants were trained under identical conditions based on the YOLOv8n baseline. As presented in
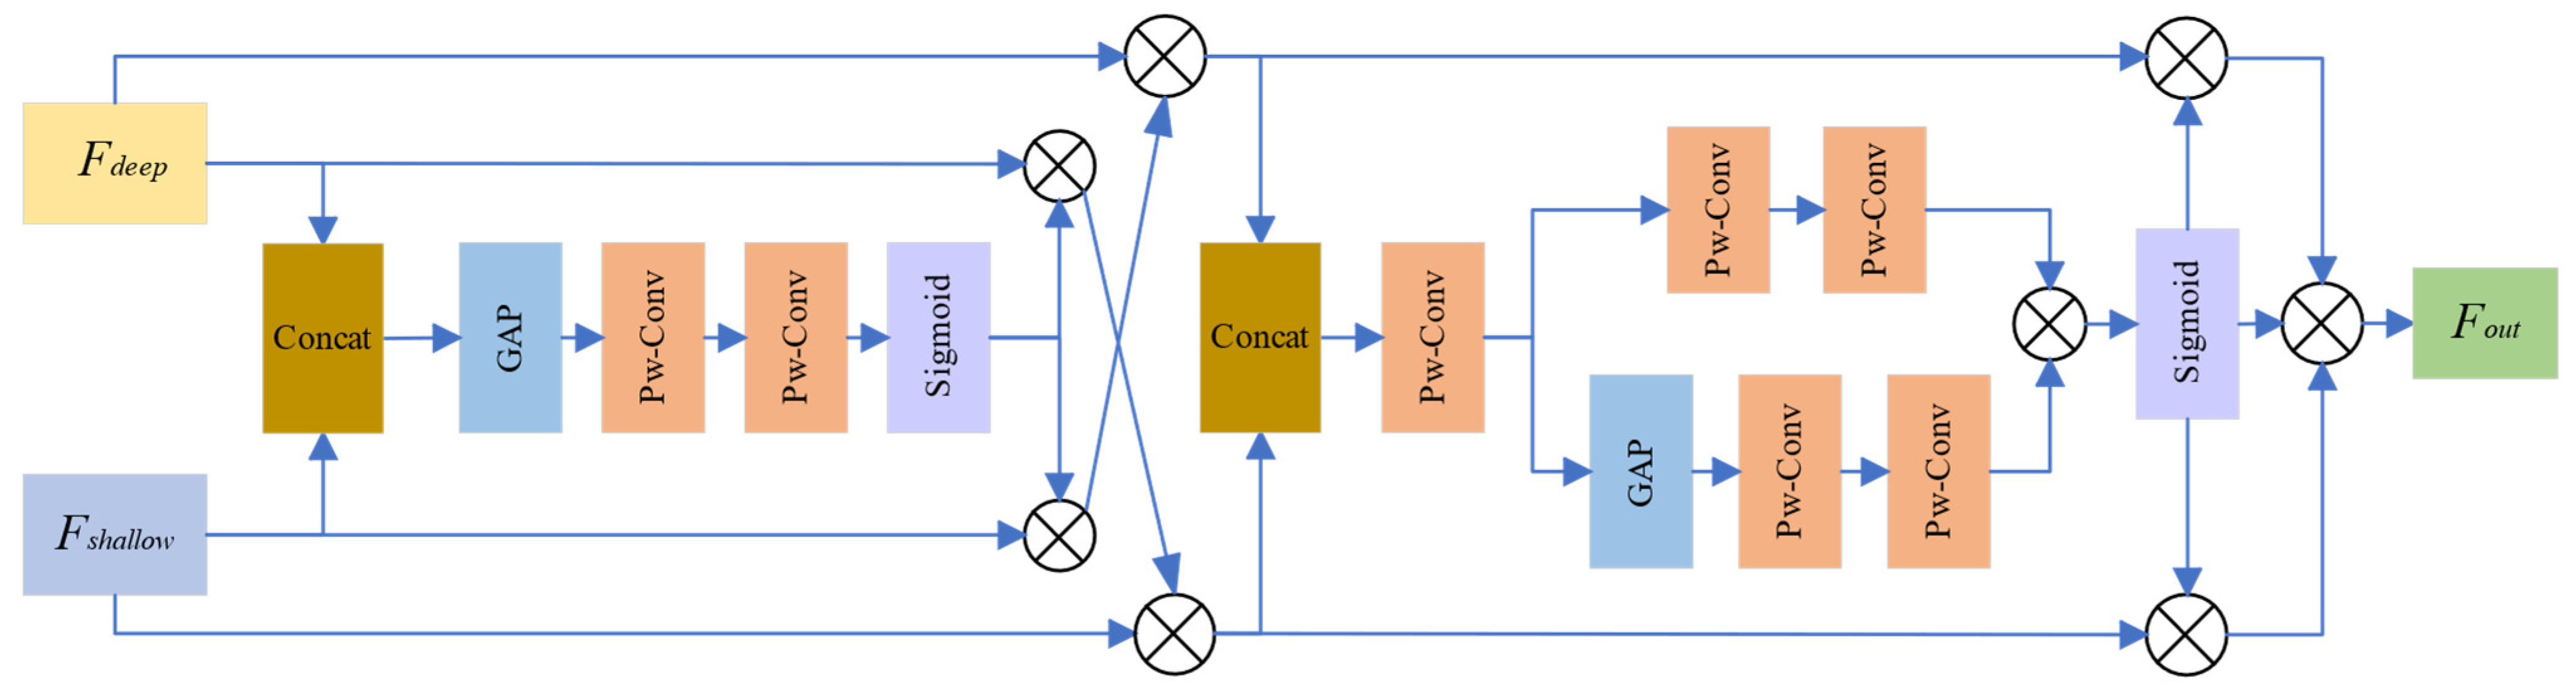
Table 7, standard channel attention (SE) and parameter-free attention (SimAM) yielded limited improvements, with mAP@0.5 scores of 81.3% and 81.9%, respectively. This suggests that decoupled or simplified attention mechanisms struggle to suppress the complex structural noise (e.g., ribs) inherent in pediatric X-rays. While CBAM improved performance to 83.4% by incorporating spatial attention, it still falls short of our proposed methods. Notably, our C2f-Star-CAA achieves an mAP@0.5 of 84.0% and a superior mAP@0.5:0.95 of 52.0%, outperforming CBAM and CARAFE in high-precision localization. Furthermore, the SDFM module achieves the best overall performance (84.1% mAP@0.5, 52.1% mAP@0.5:0.95). These results confirm that the symmetrical cross-dimensional interaction in Star-CAA and the gated semantic fusion in SDFM are more effective for pediatric pneumonia detection than generic, off-the-shelf attention modules.
As shown in
Table 8, the improved algorithm proposed in this paper demonstrates optimal performance on both the VisDrone and Pneumonia datasets, verifying its effectiveness and robustness. Specifically, on the challenging VisDrone aerial imagery dataset, our method achieved significant improvements compared to YOLOv10n, with Recall, mAP@0.5, and mAP@0.5–0.95 increasing by 3.5%, 2.8%, and 2.3%, respectively. Furthermore, it slightly outperforms the latest YOLO11n model across all metrics. To further assess the model’s generalization capability beyond pediatric subjects, we evaluated it on an Adult Pneumonia dataset (as shown in the ‘Pneumonia’ row of
Table 8). The superiority of the improved algorithm remains pronounced in this adult cohort; compared to YOLOv10n, the Recall and mAP@0.5 significantly improved by 4.5% and 5.4%, respectively, while mAP@0.5:0.95 increased by 2.8%. These experimental results fully demonstrate that our method is not overfitted to pediatric features. It effectively handles both the subtle, blurred boundaries of pediatric lesions and the larger, consolidated patterns typical of adult pneumonia, confirming its robust generalization capabilities across different age demographics and pathological presentations.
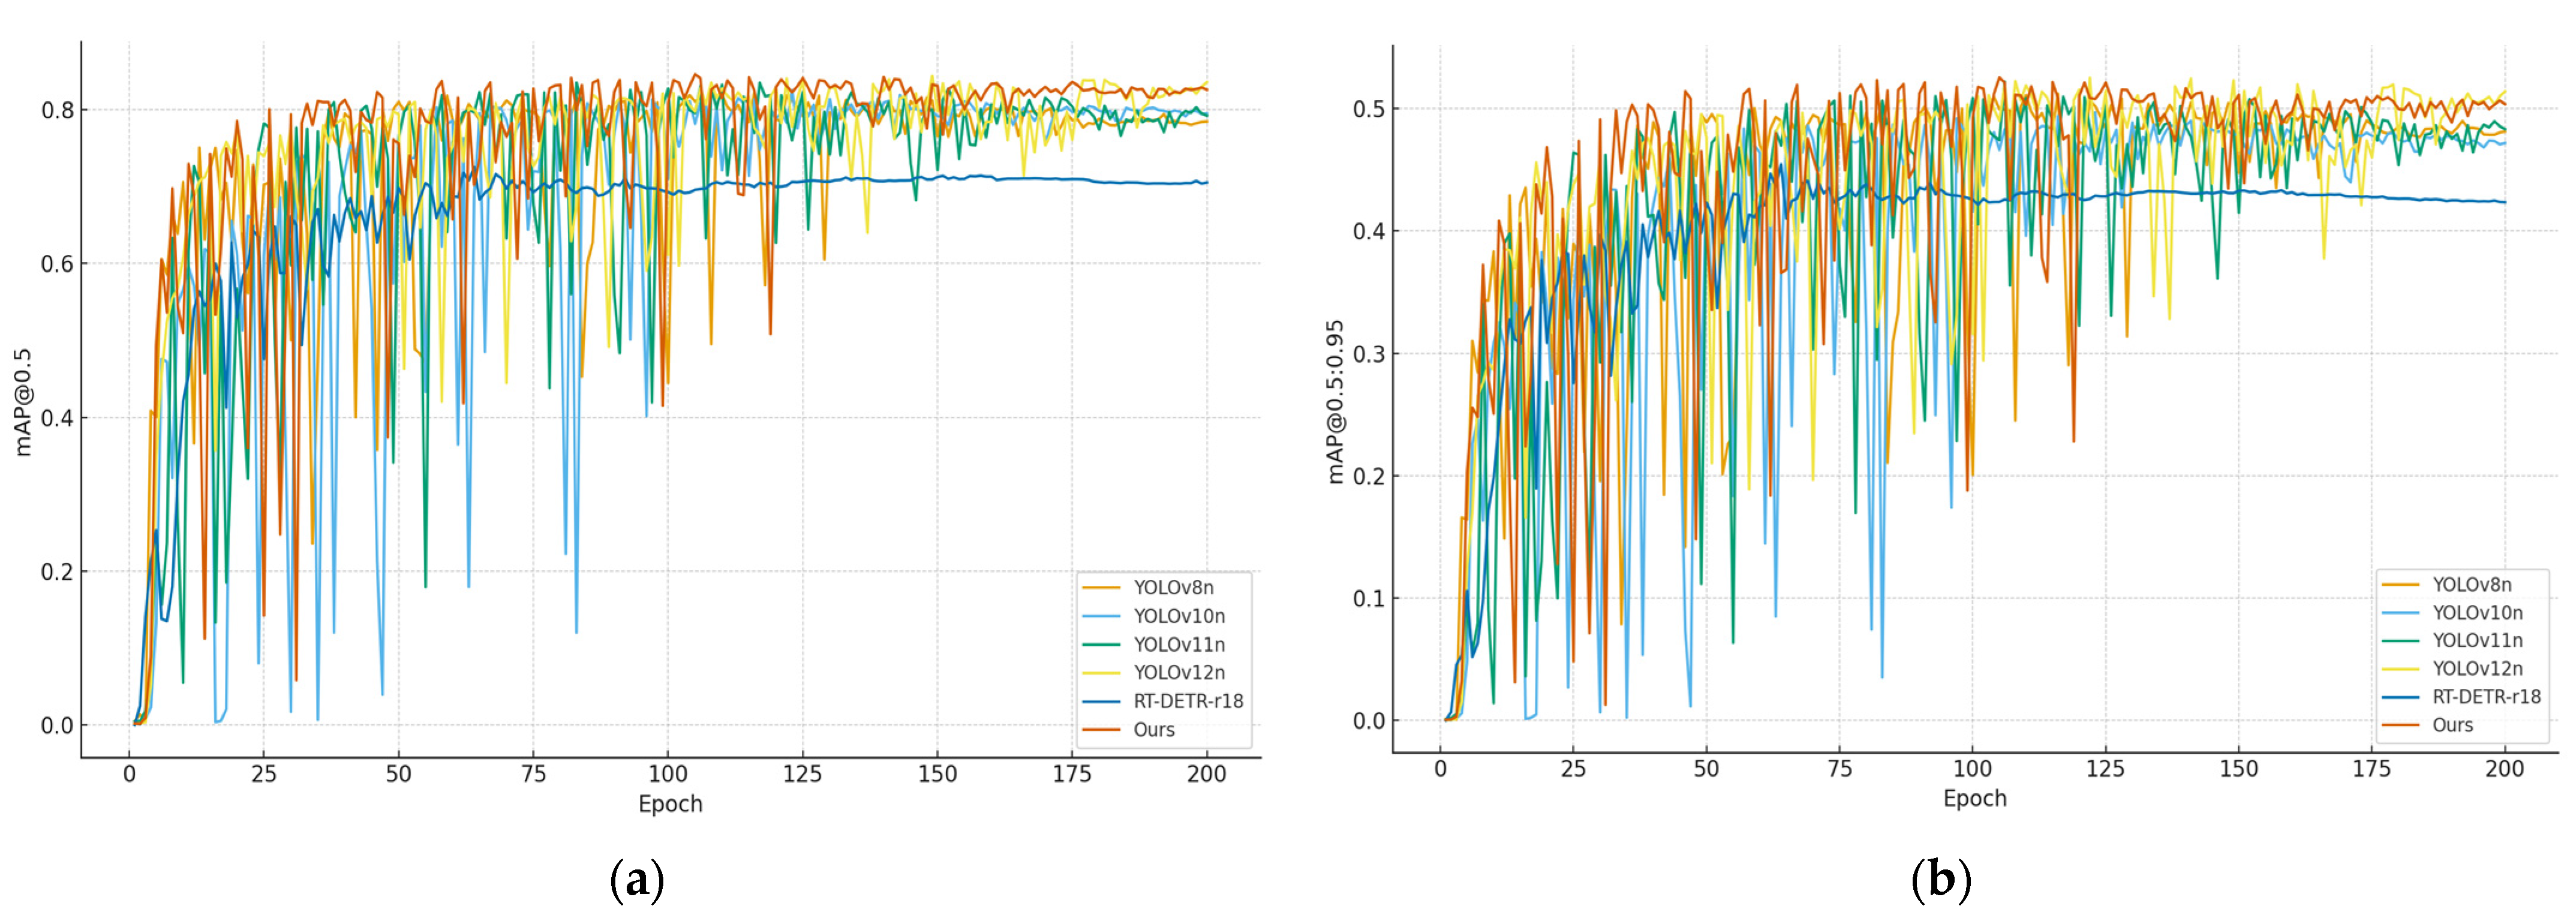
As shown in
Figure 7, during the initial stages of training (approximately the first 20 epochs), all models exhibit a rapid increase in the mAP metric, demonstrating their ability to quickly learn effective features. However, as training progresses, the performance gap between the models gradually widens. In the mAP@0.5 curve shown in
Figure 7a, RT-DETR-r18 consistently lags behind the YOLO series, while YOLOv10n fluctuates considerably and ultimately converges at a lower level. The curves for YOLOv8n, YOLOv11n, and YOLOv12n fall within a middle range and gradually stabilize as the number of epochs increases. In contrast, the proposed method achieves a high level of accuracy after approximately 40 epochs and consistently maintains superior performance throughout the remainder of the training, ultimately converging at the highest mAP@0.5 with minimal fluctuations. This demonstrates enhanced convergence and training stability. The trend for mAP@0.5:0.95 shown in
Figure 7b mirrors that of
Figure 7a, but with more pronounced differences between models. RT-DETR-r18 and YOLOv10n consistently perform at lower levels, while YOLOv8n, YOLOv11n, and YOLOv12n occupy the middle range. In contrast, our method consistently maintains the highest performance throughout the latter stages of training. This indicates that our method retains its advantage even under stricter IoU thresholds, exhibiting stronger target localization accuracy and improved detection robustness. Overall, these results further substantiate the superior performance of the proposed method, demonstrating faster convergence, more stable training, and enhanced final detection accuracy.
5.2. Visualization of Results
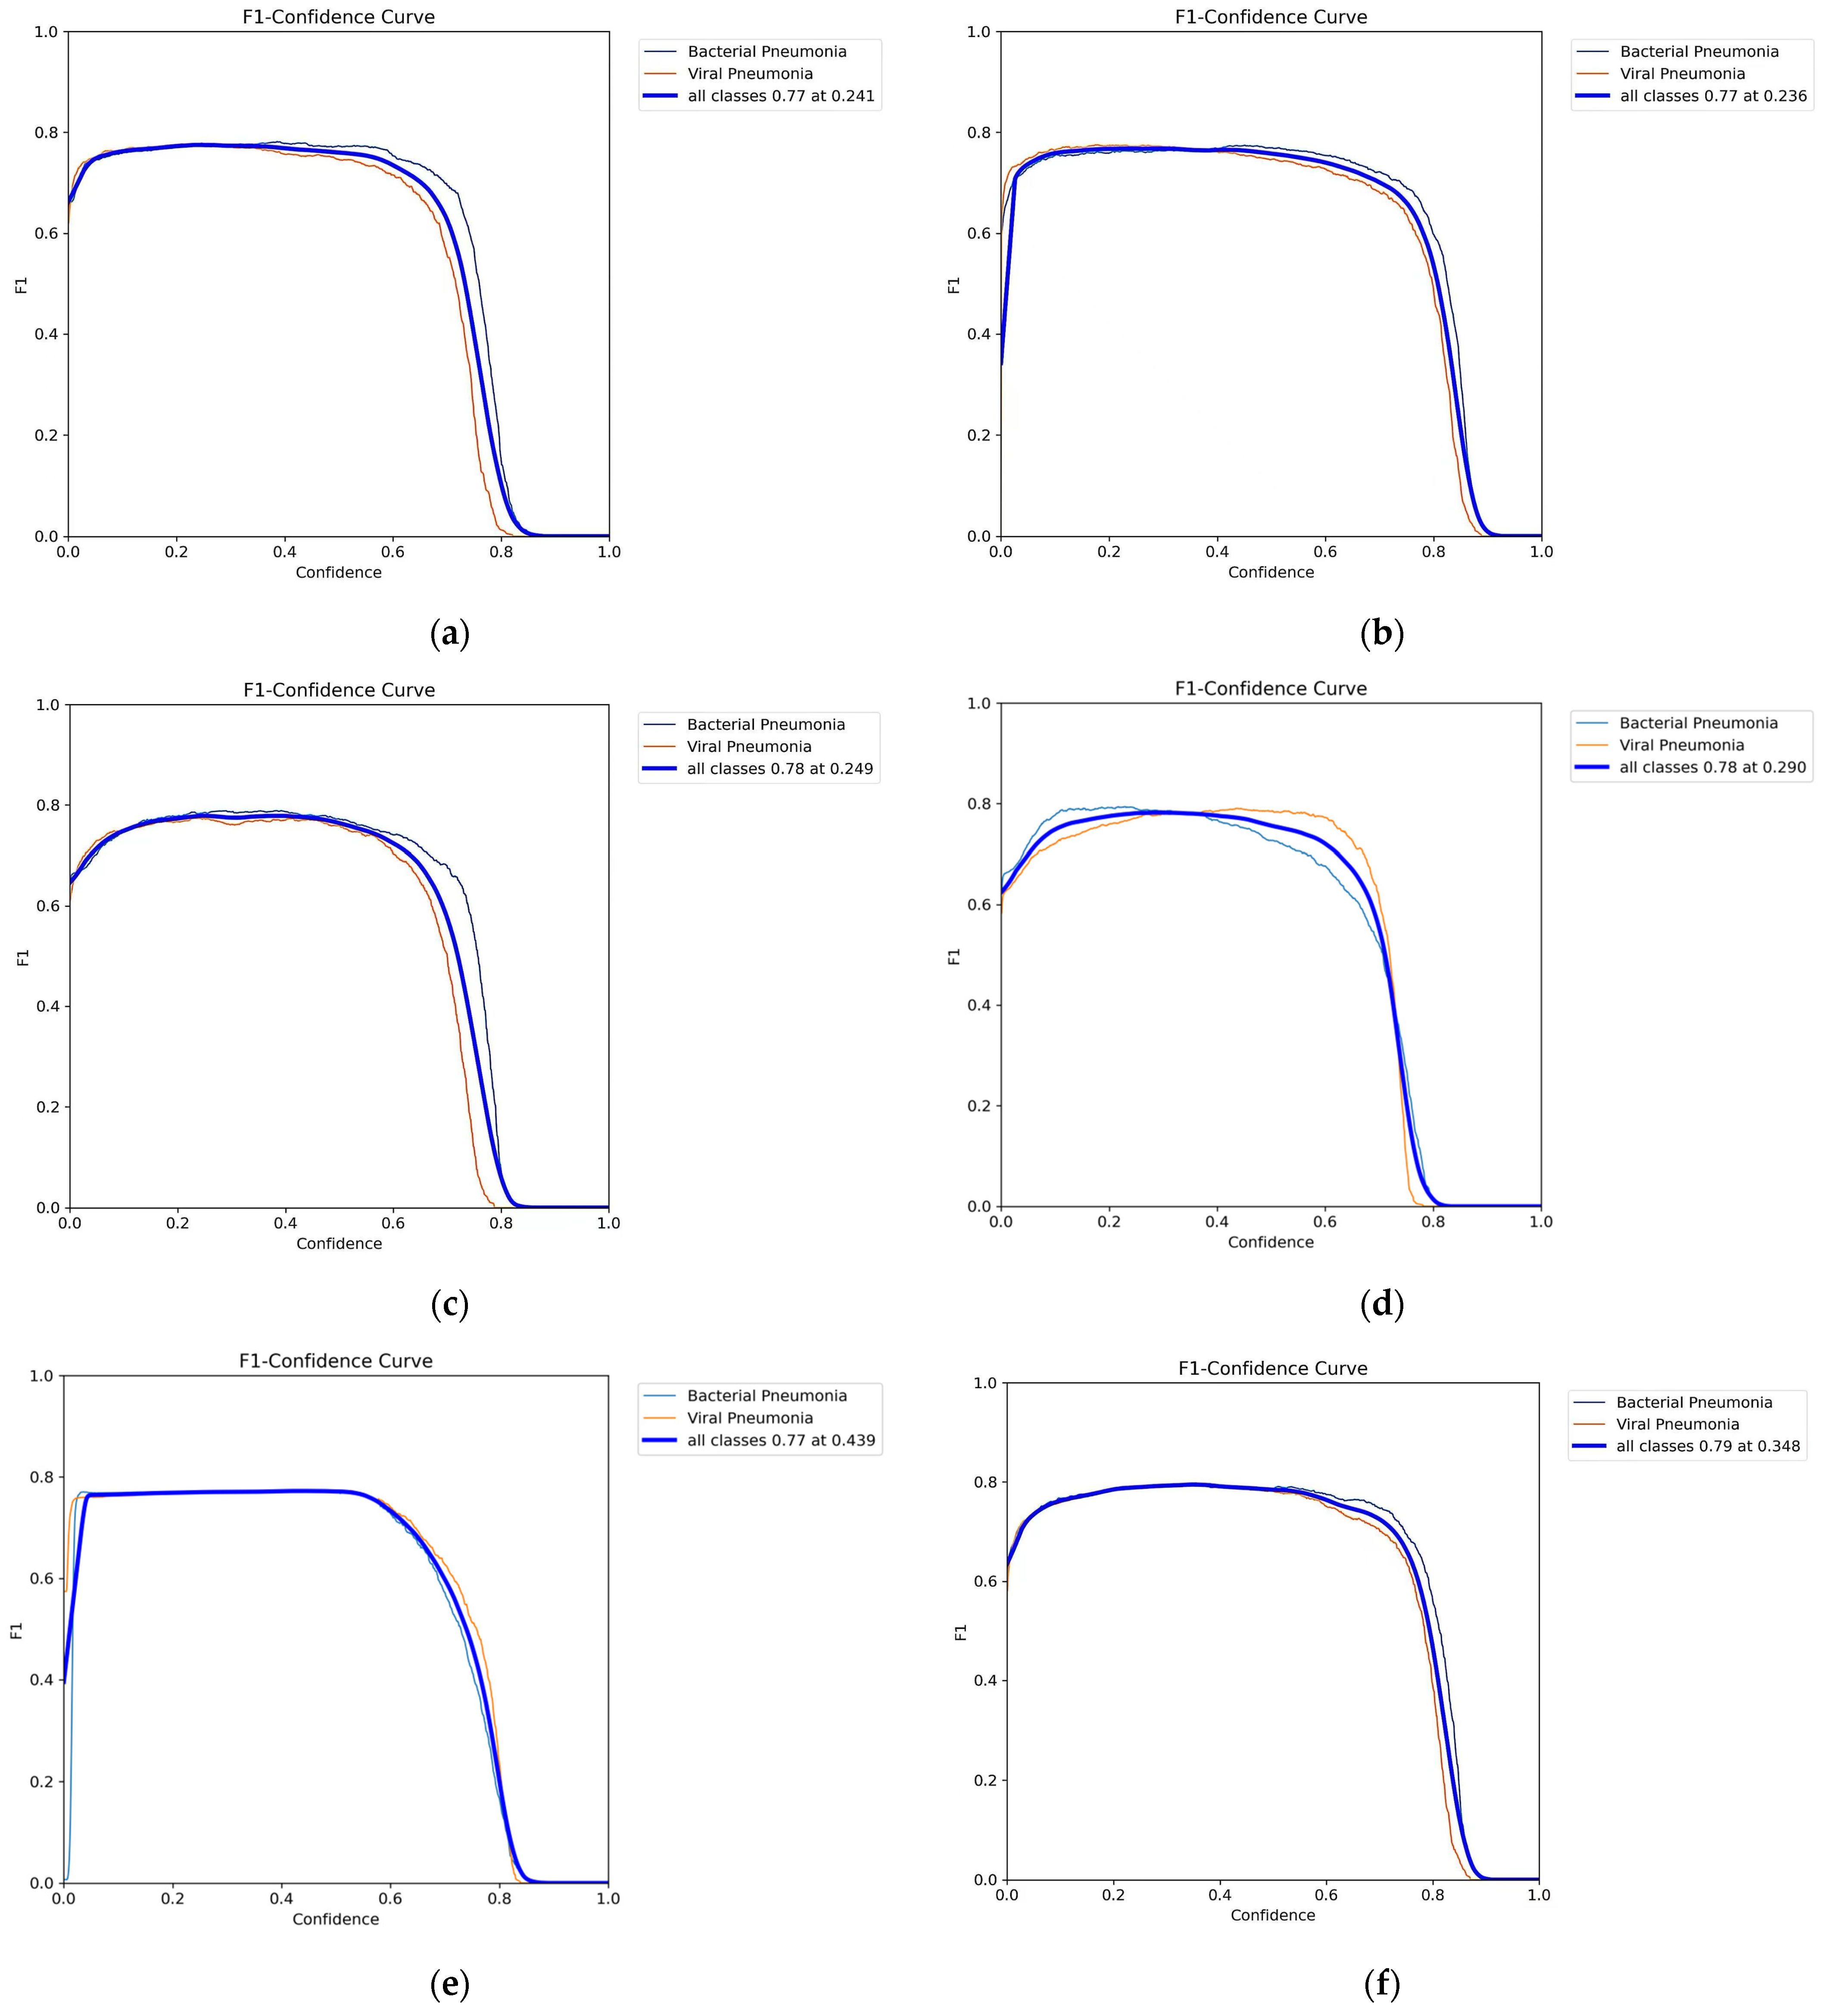
To further evaluate the detection performance of different models across varying confidence thresholds and their corresponding confidence calibration, this study presents the F1-Confidence curves for each model. The x-axis represents the predicted confidence, while the y-axis shows the F1 score, illustrating the trade-off between precision and recall at different thresholds. This provides a valuable basis for selecting optimal thresholds in practical applications. A comparison of the F1-Confidence curves for each model, applied to Bacterial Pneumonia, Viral Pneumonia, and the overall categories, is shown in
Figure 8.
As shown in
Figure 8, the optimal F1 performance for each model across varying confidence thresholds is presented. YOLOv8n, YOLOv10n, YOLOv11n, and YOLOv12n achieve peak F1 values ranging from 0.77 to 0.78, with corresponding thresholds generally between 0.24 and 0.29. RT-DETR-r18 also reaches a peak F1 of approximately 0.77, but requires a higher confidence threshold to achieve this, with a narrower plateau range, indicating less stable confidence calibration. In contrast, the proposed method achieves the highest peak F1 across all models, with an optimal threshold around 0.35. Furthermore, the curve remains consistently high and smooth across a relatively wide threshold range of 0.2 to 0.6, demonstrating superior robustness in threshold selection and a more appropriate alignment between confidence and prediction quality. Additionally, examining the curves for Bacterial Pneumonia and Viral Pneumonia, it is evident that the F1 scores for these two categories in the proposed method closely align with the “all classes” curve, with minimal variation between categories. This suggests that, while improving overall detection performance, the proposed method effectively maintains balance across different categories.
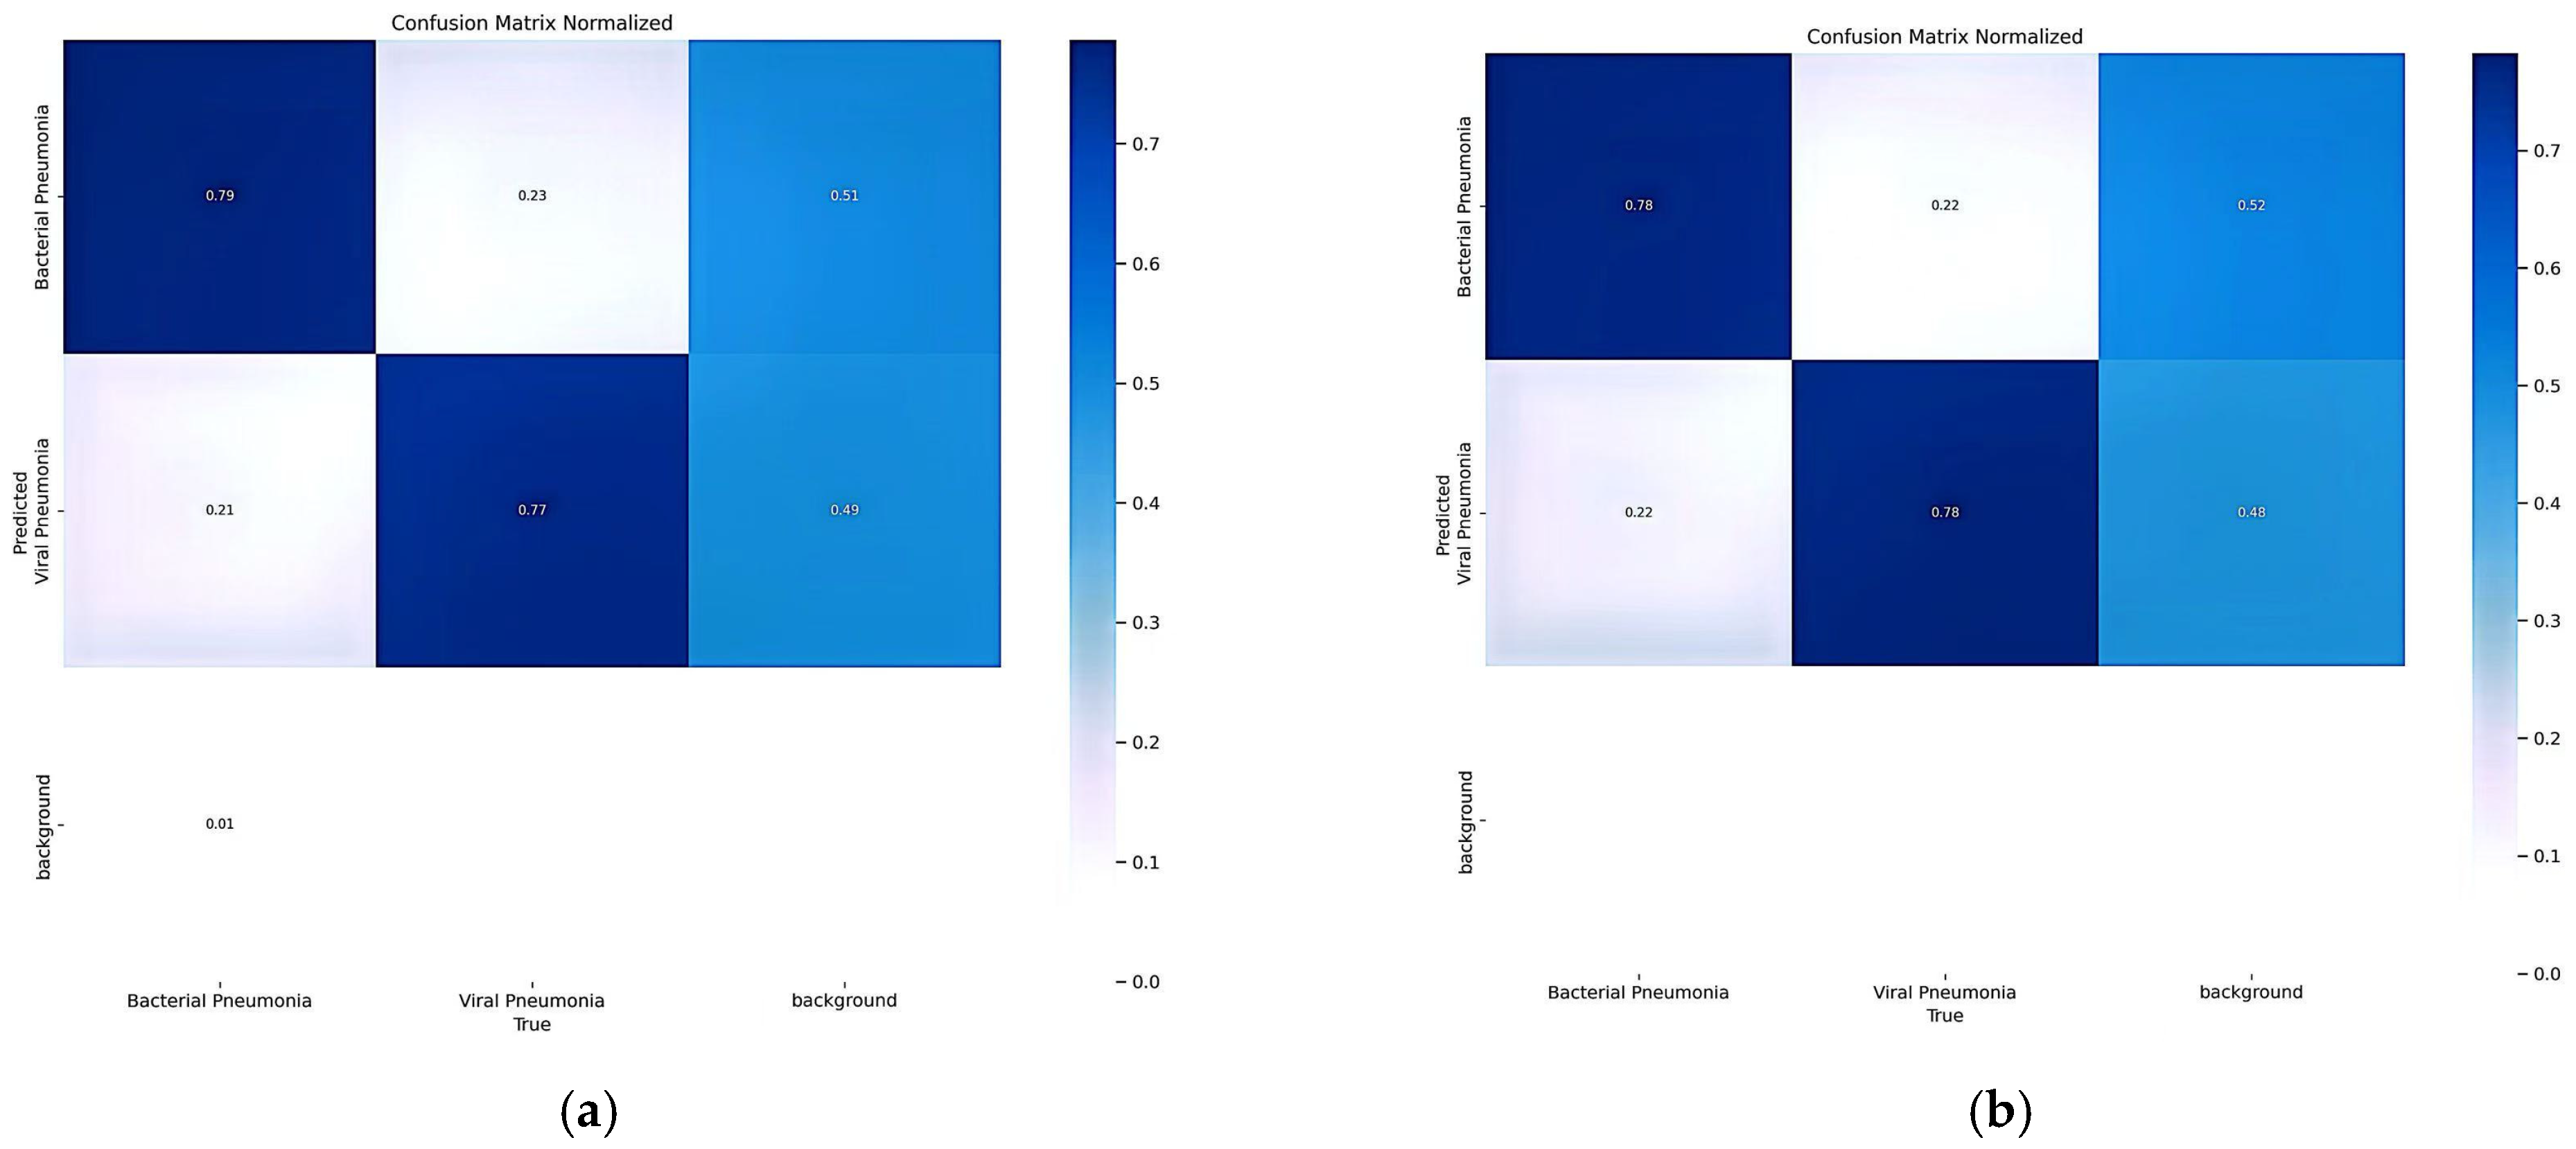
The normalized confusion matrices presented in
Figure 9 demonstrate that the proposed YOLO-SMD model achieves superior stability and balance compared to the baseline YOLOv8n. While the baseline exhibits performance fluctuations between classes, YOLO-SMD delivers a consistent accuracy of 0.78 for both Bacterial and Viral Pneumonia, effectively mitigating the bias towards bacterial cases observed in YOLOv8n. Notably, our model improves the identification of Viral Pneumonia without compromising the overall detection capability. Furthermore, YOLO-SMD maintains a negligible false negative rate, ensuring the high sensitivity required for clinical screening. These results validate that our approach successfully enhances model robustness and class equilibrium.
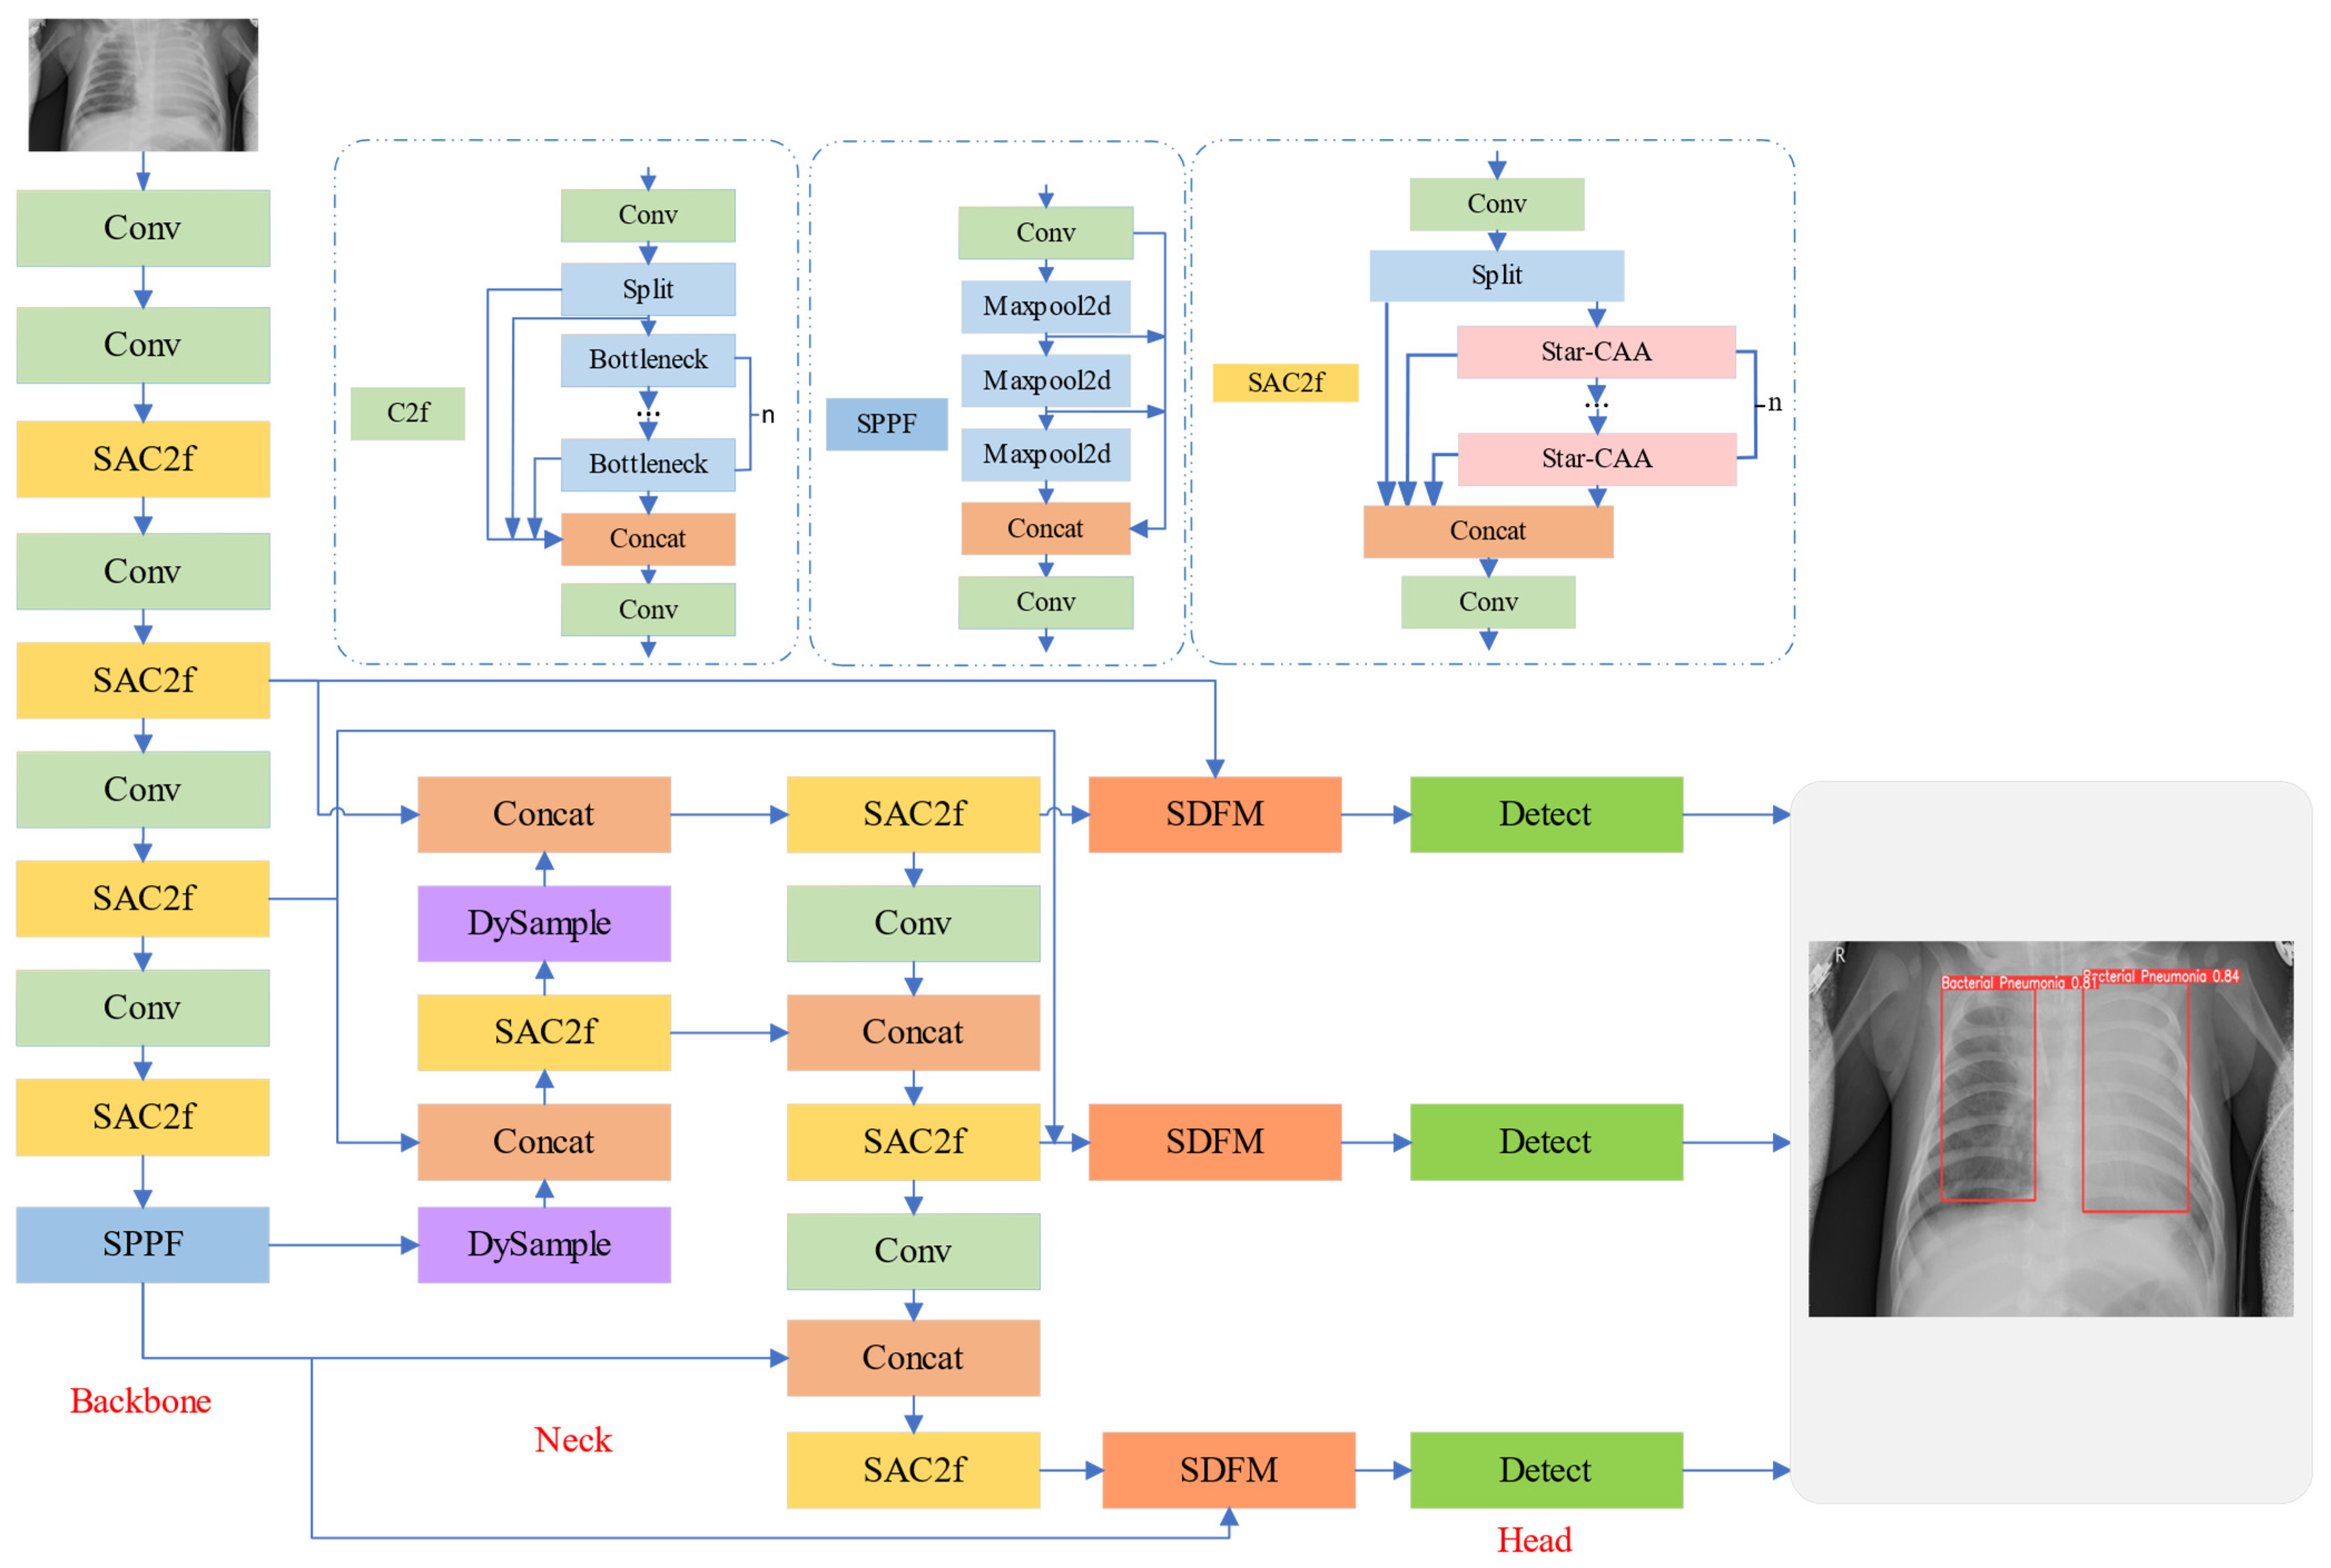
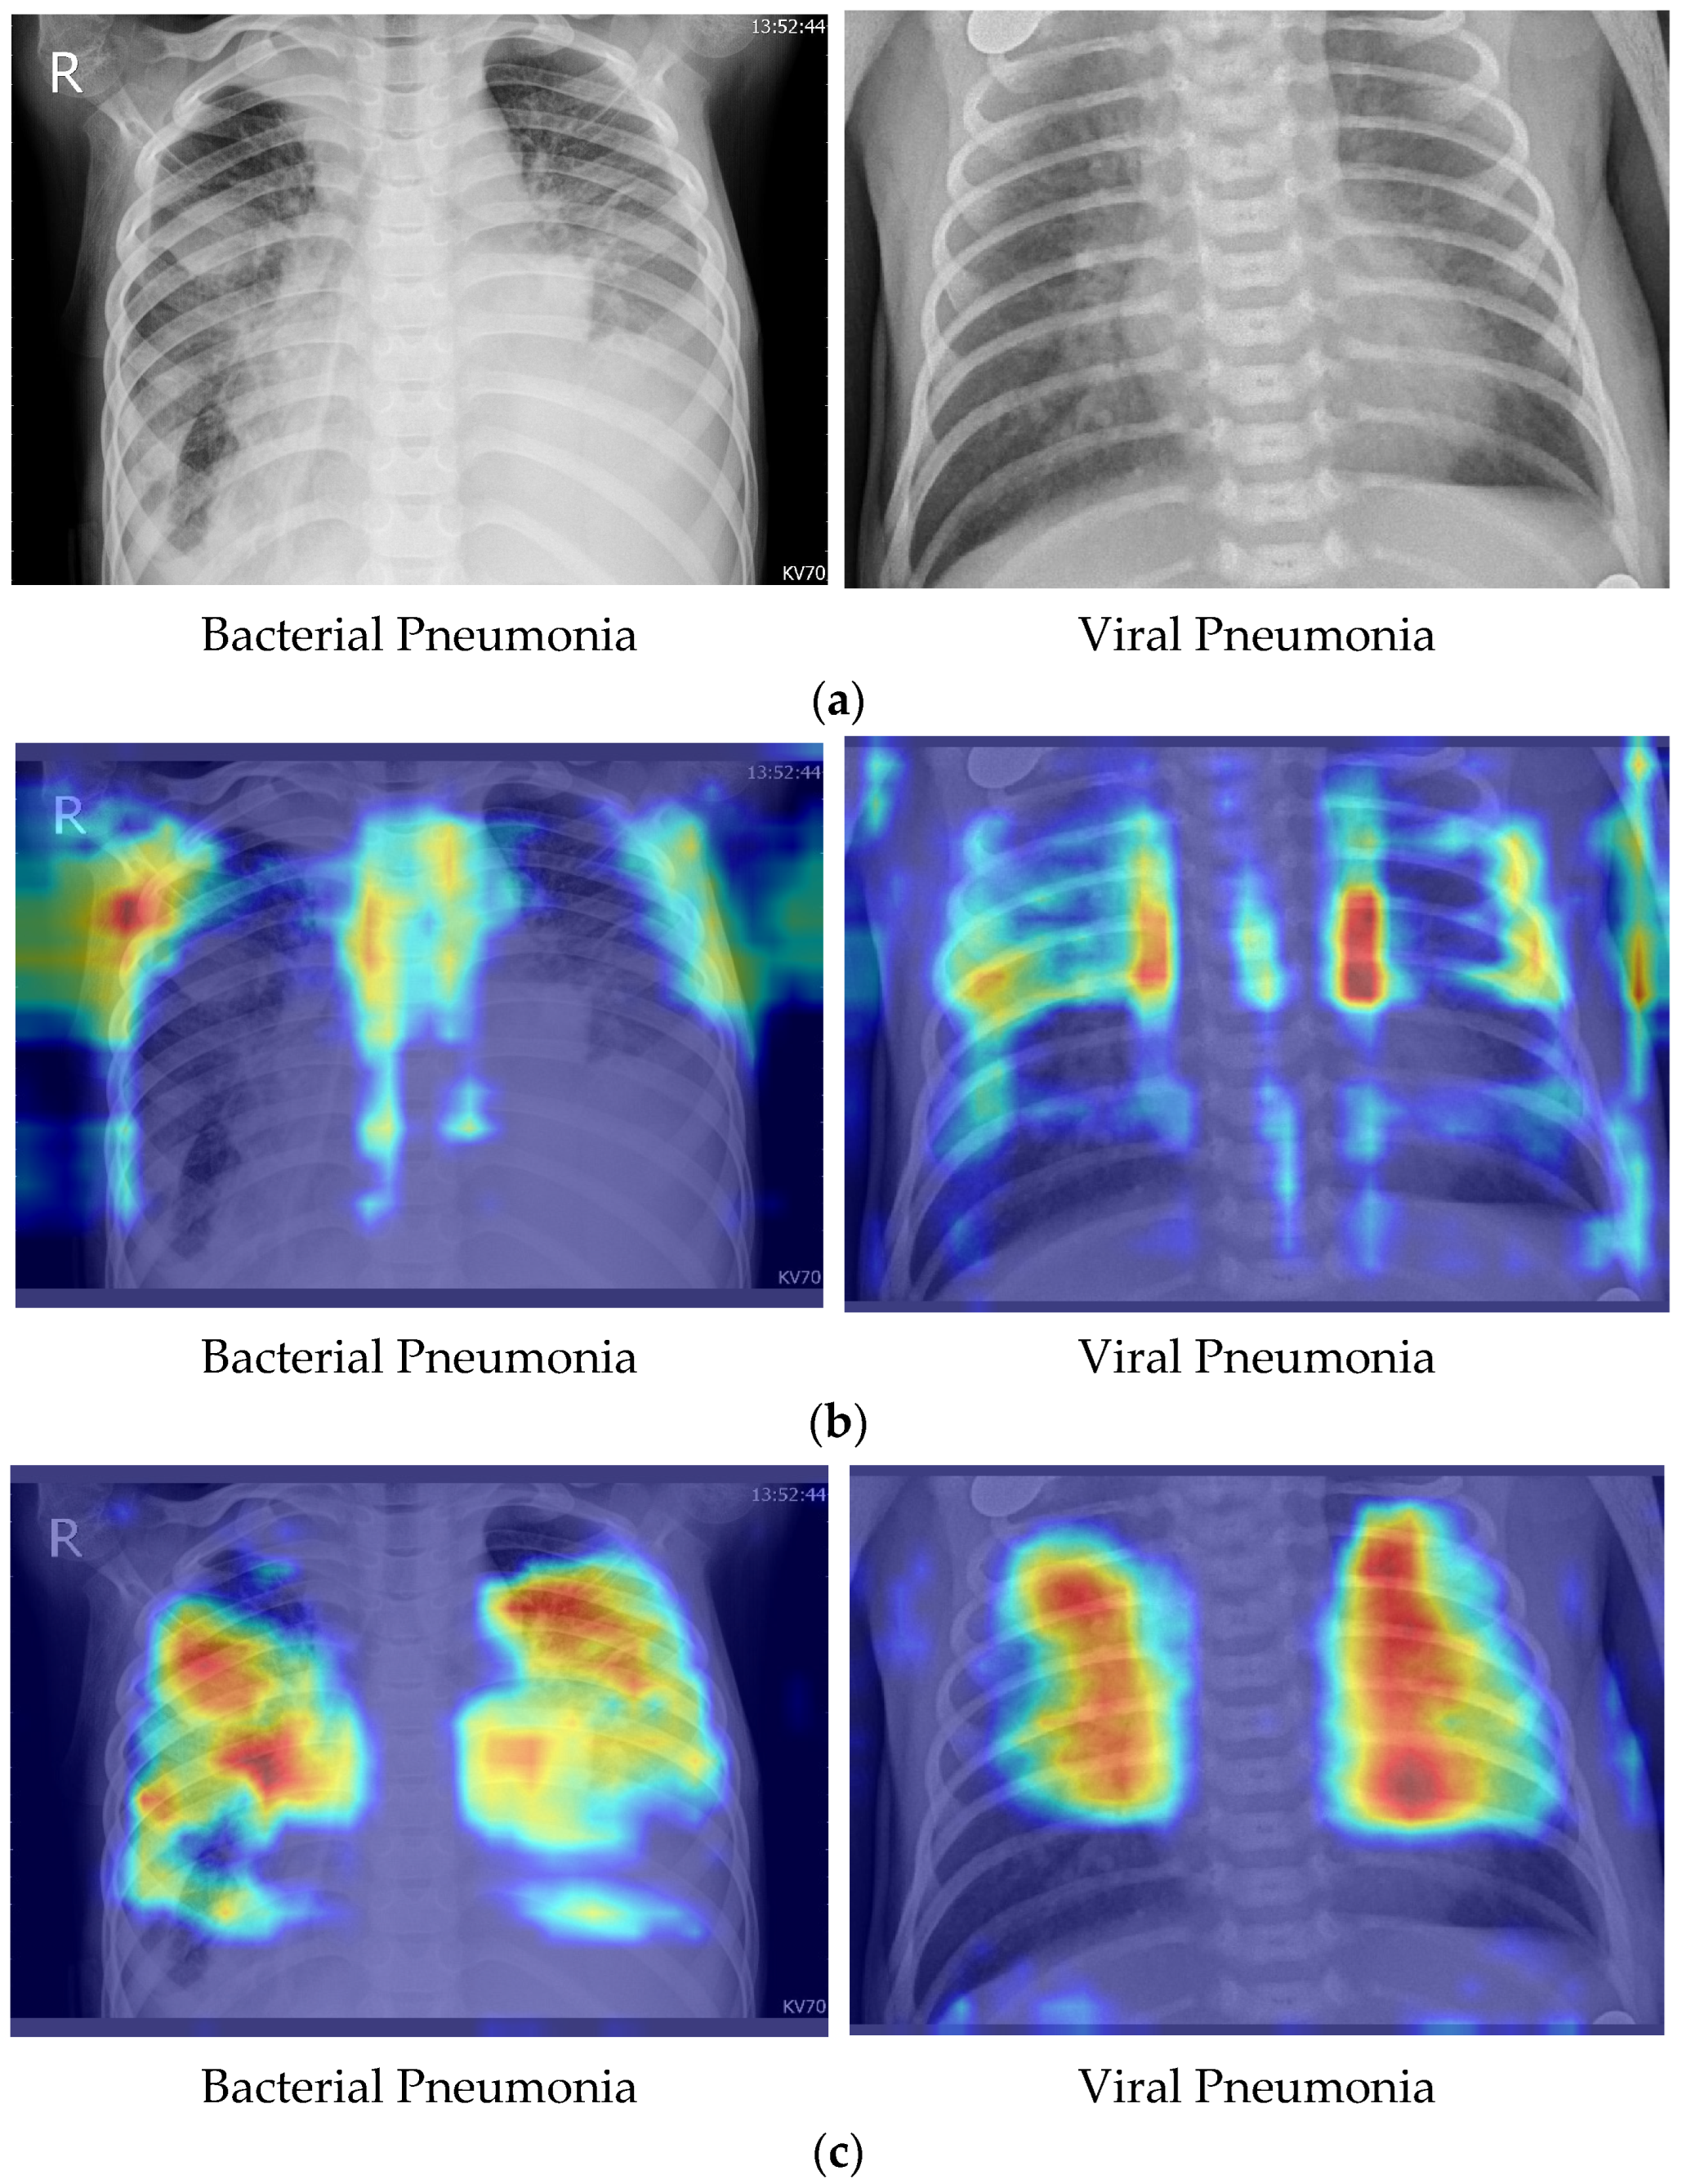
To qualitatively validate the effectiveness of the proposed symmetrical modules, we visualized the decision-making process using Grad-CAM, as shown in
Figure 10. In the baseline YOLOv8n (Row b), the model exhibits significant ‘attention drift.’ Specifically, in Viral Pneumonia cases, the activation maps heavily align with the rib cage structures rather than the lung parenchyma, confirming our hypothesis that standard convolutions struggle to decouple overlapping anatomical noise. Similarly, in Bacterial cases, the baseline is distracted by high-contrast regions like the clavicles and mediastinum. In contrast, the proposed YOLO-SMD (Row c) demonstrates superior ‘attention concentration. Thanks to the SAC2f module, the model successfully suppresses the structural noise of the ribs, directing focus solely to the pathological interstitial patterns in viral cases. Furthermore, the SDFM unit ensures that the focal consolidations in bacterial pneumonia are accurately targeted without background leakage. This visual evidence confirms that our architectural improvements fundamentally alter how the model perceives lesions, shifting from edge-based coincidences to true pathological feature extraction.
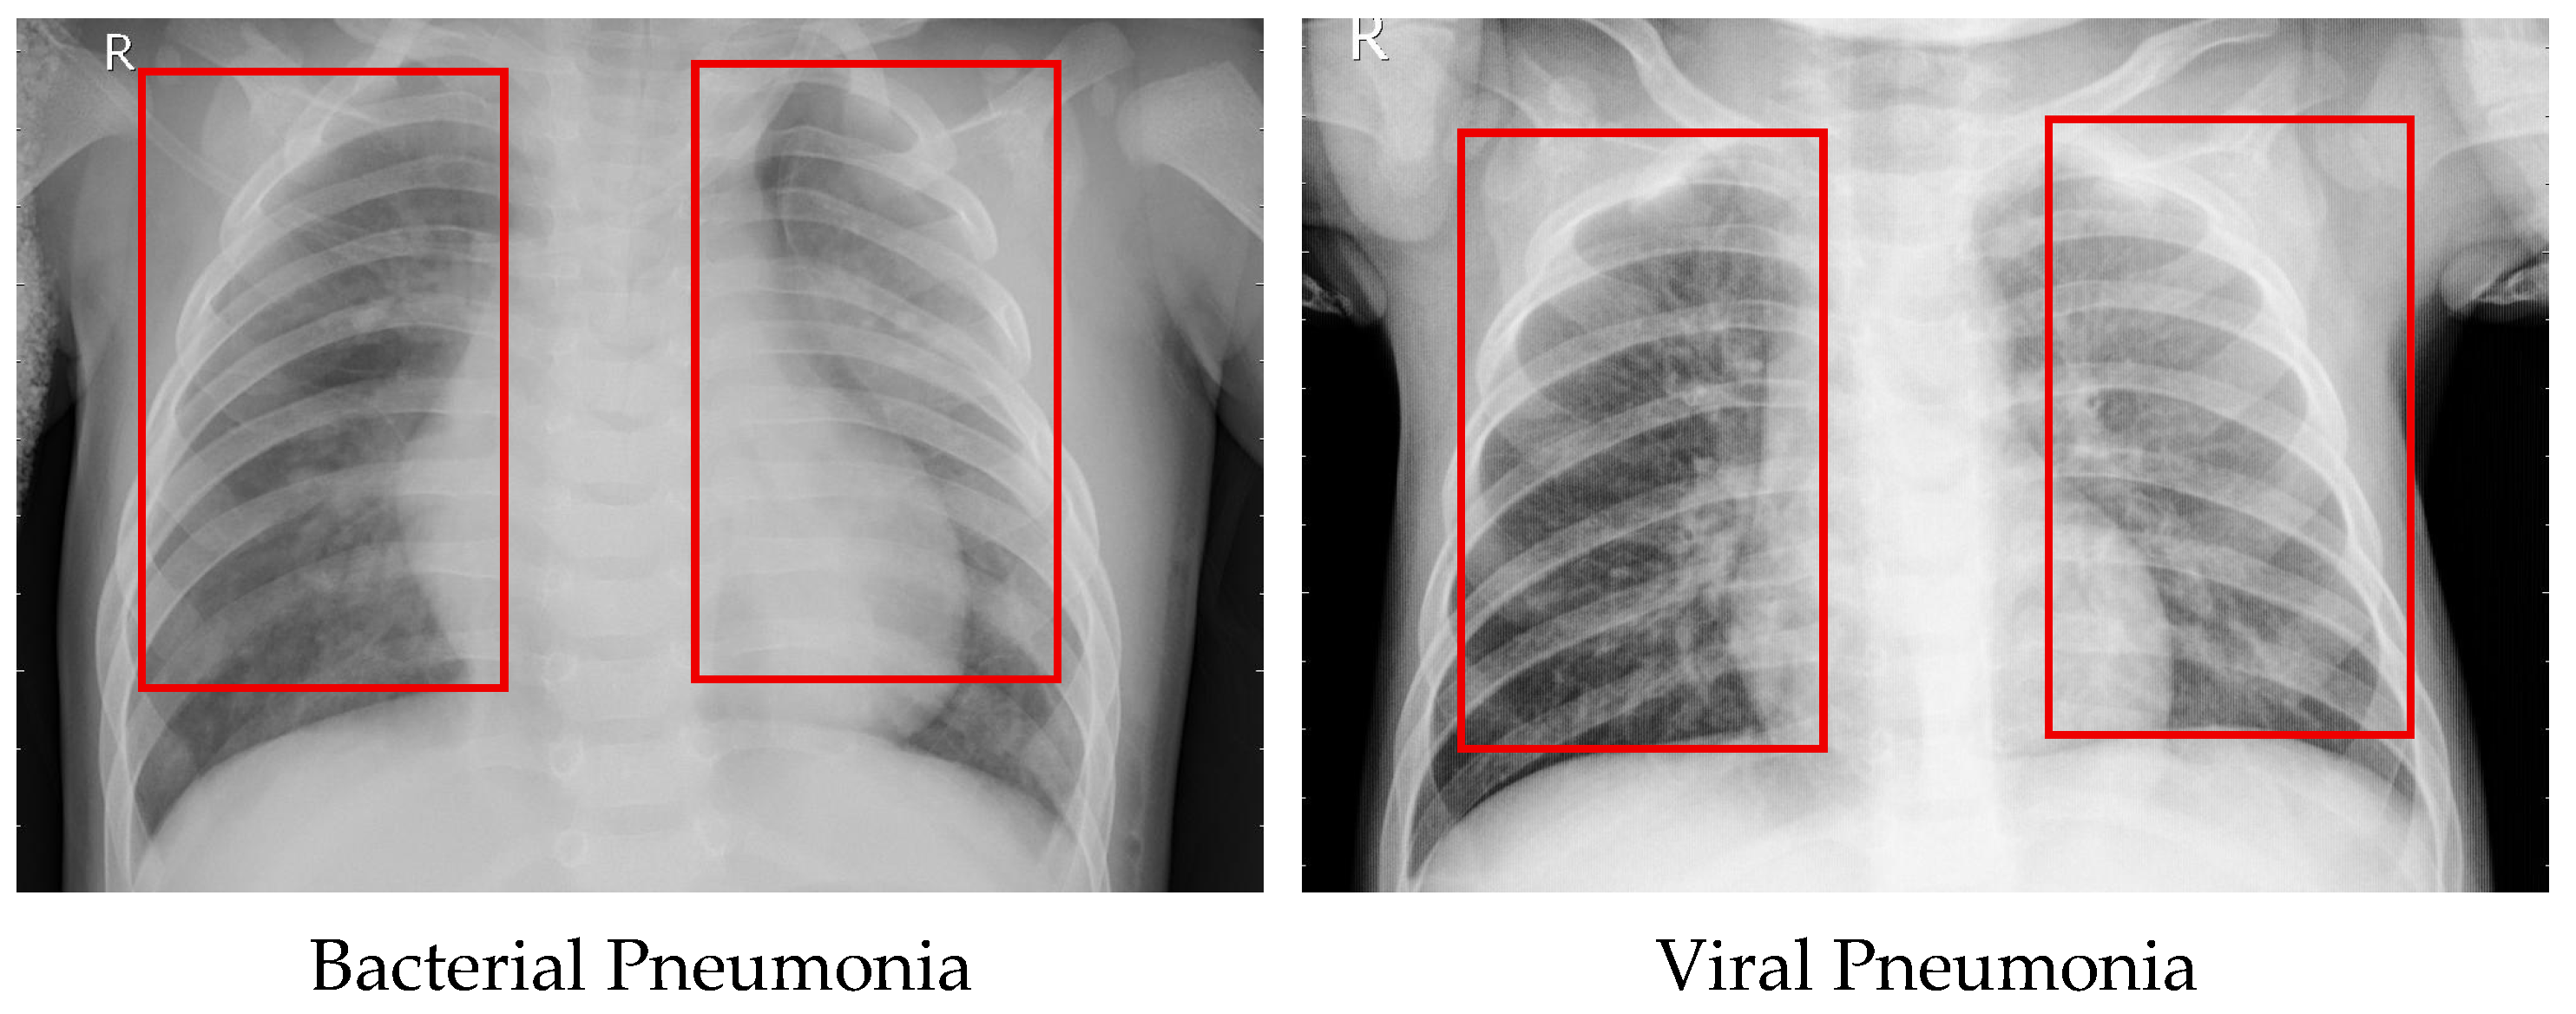
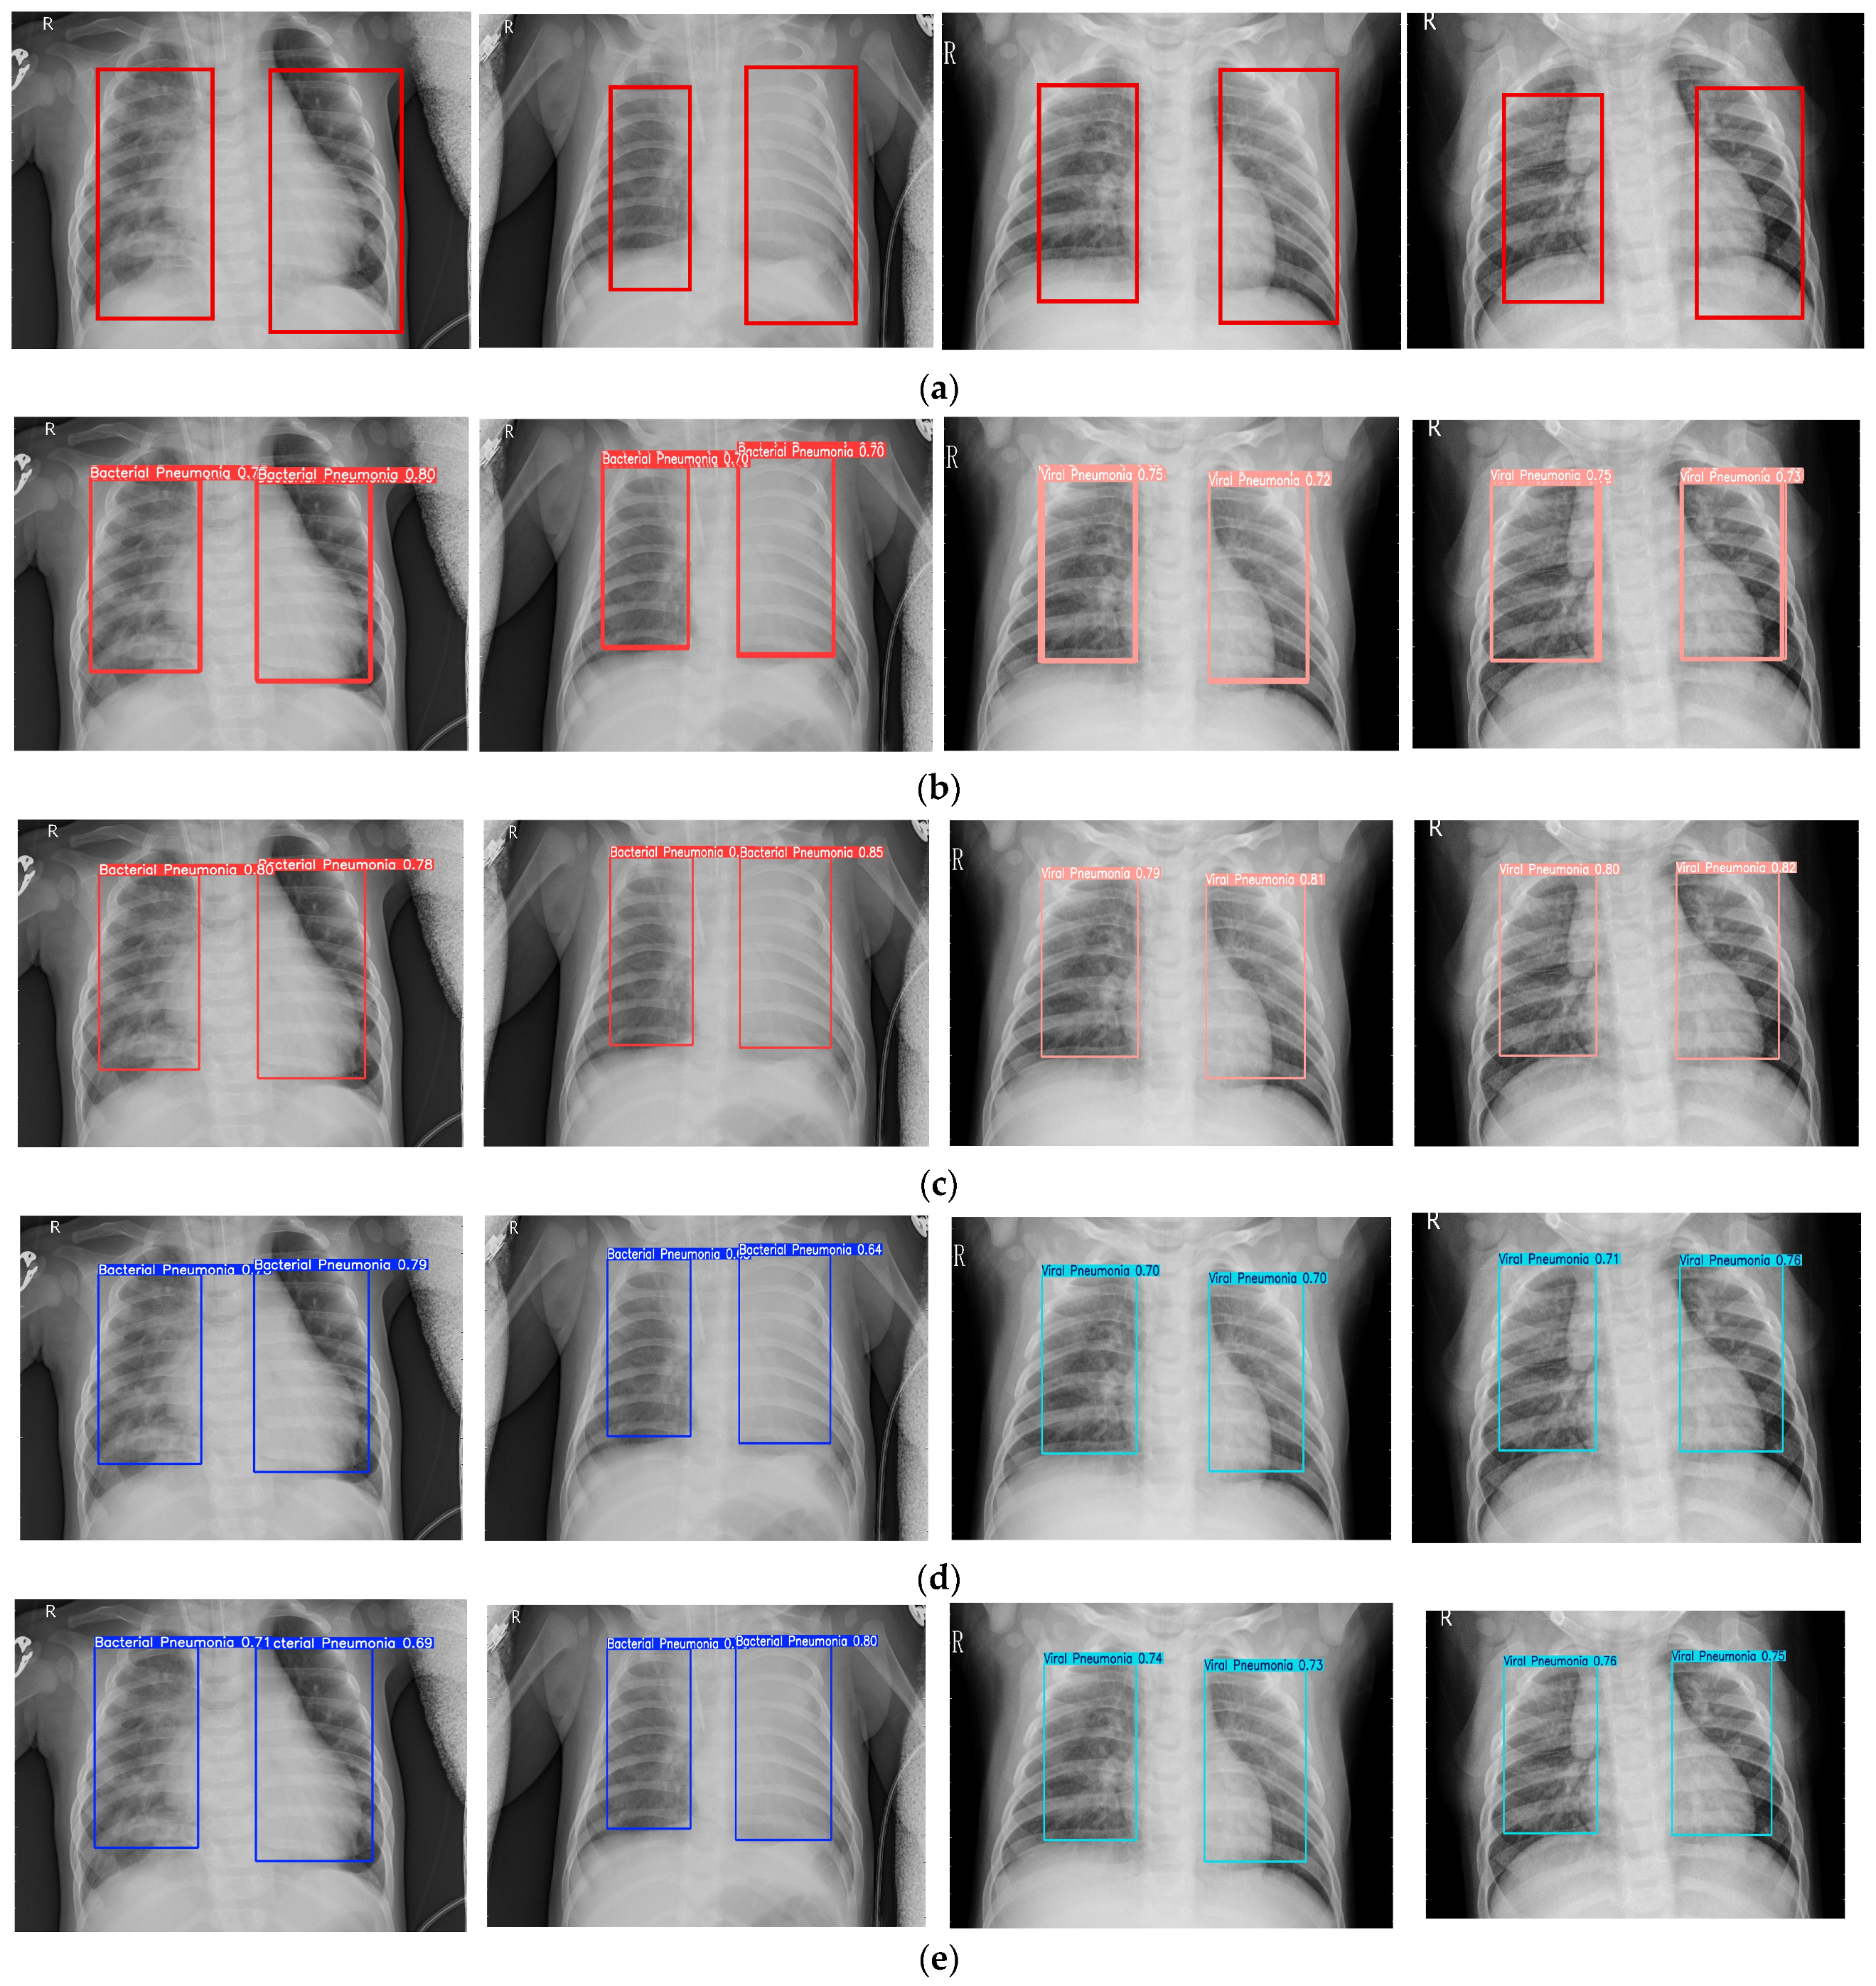
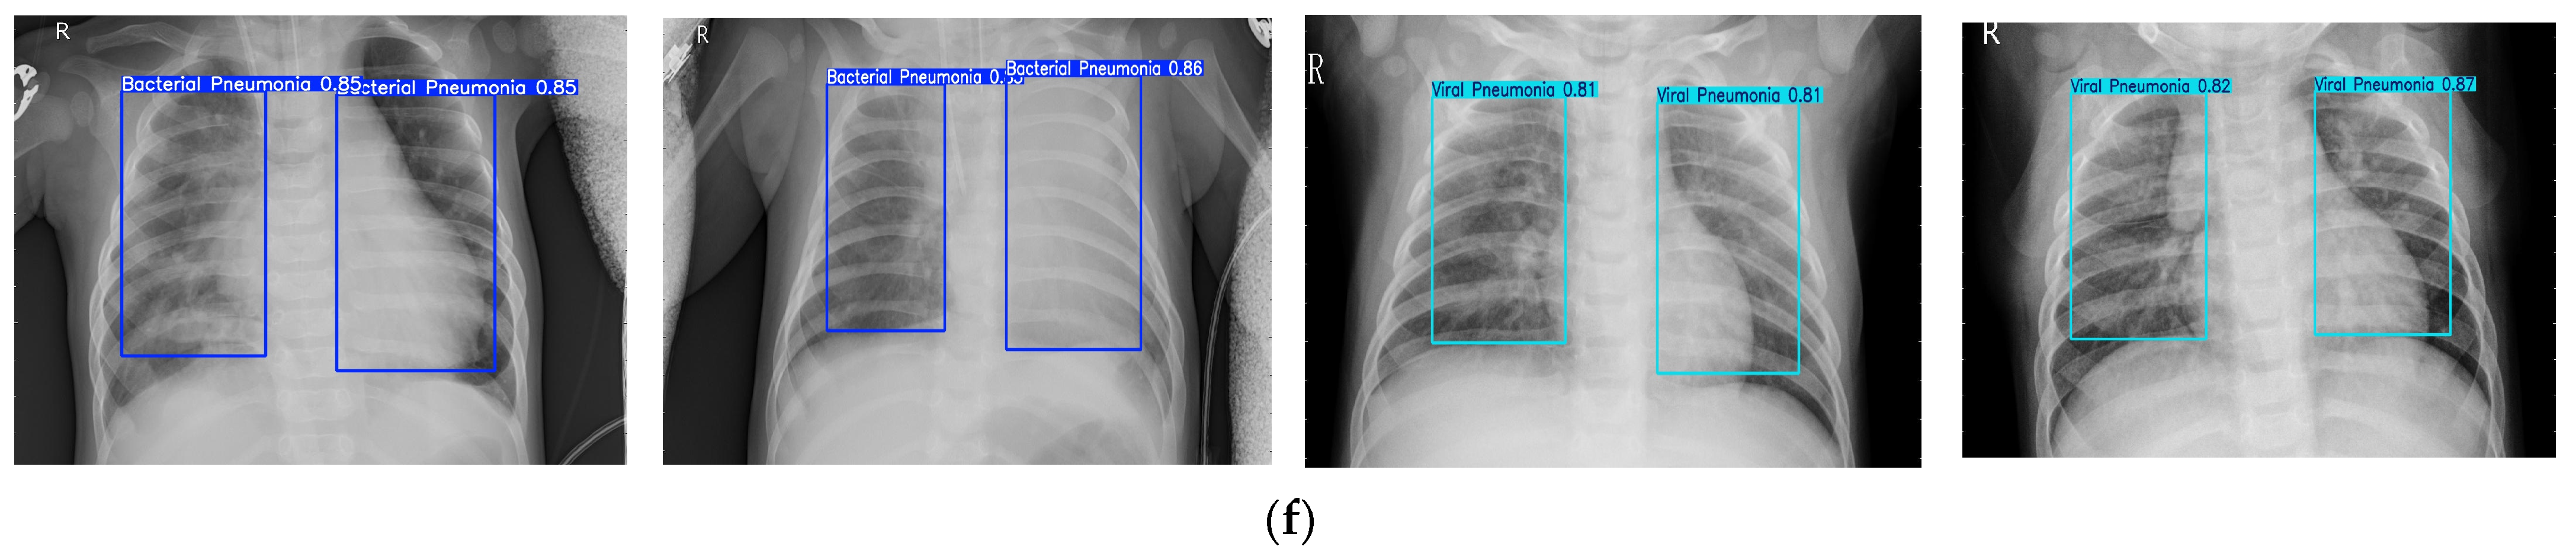
Figure 11 presents the detection results of various models on typical chest X-ray images of bacterial and viral pneumonia. Overall, all models successfully identify paired lesion boxes in the bilateral lung regions, demonstrating a certain degree of object recognition capability. However, significant differences are observed in terms of confidence and box localization accuracy. YOLOv8n and YOLOv10n typically predict bacterial and viral pneumonia with confidence scores ranging from 0.7 to 0.80, with some boxes being slightly oversized and covering a substantial portion of the normal lung fields. YOLOv11n and RT-DETR-r18 show cases where the confidence for boxes on one side is notably lower, highlighting issues with localization stability in certain samples. In contrast, the proposed method achieves higher confidence, typically around 0.85 for bacterial pneumonia samples, and maintains a confidence range of approximately 0.81–0.87 for viral pneumonia samples. Furthermore, the predicted boxes are more accurately aligned with the actual lesion areas, exhibiting clearer boundaries and reduced background redundancy. These visual detection improvements align with the quantitative gains in mAP and Recall, demonstrating that the proposed method provides more precise lesion annotations with greater confidence for both types of pneumonia.
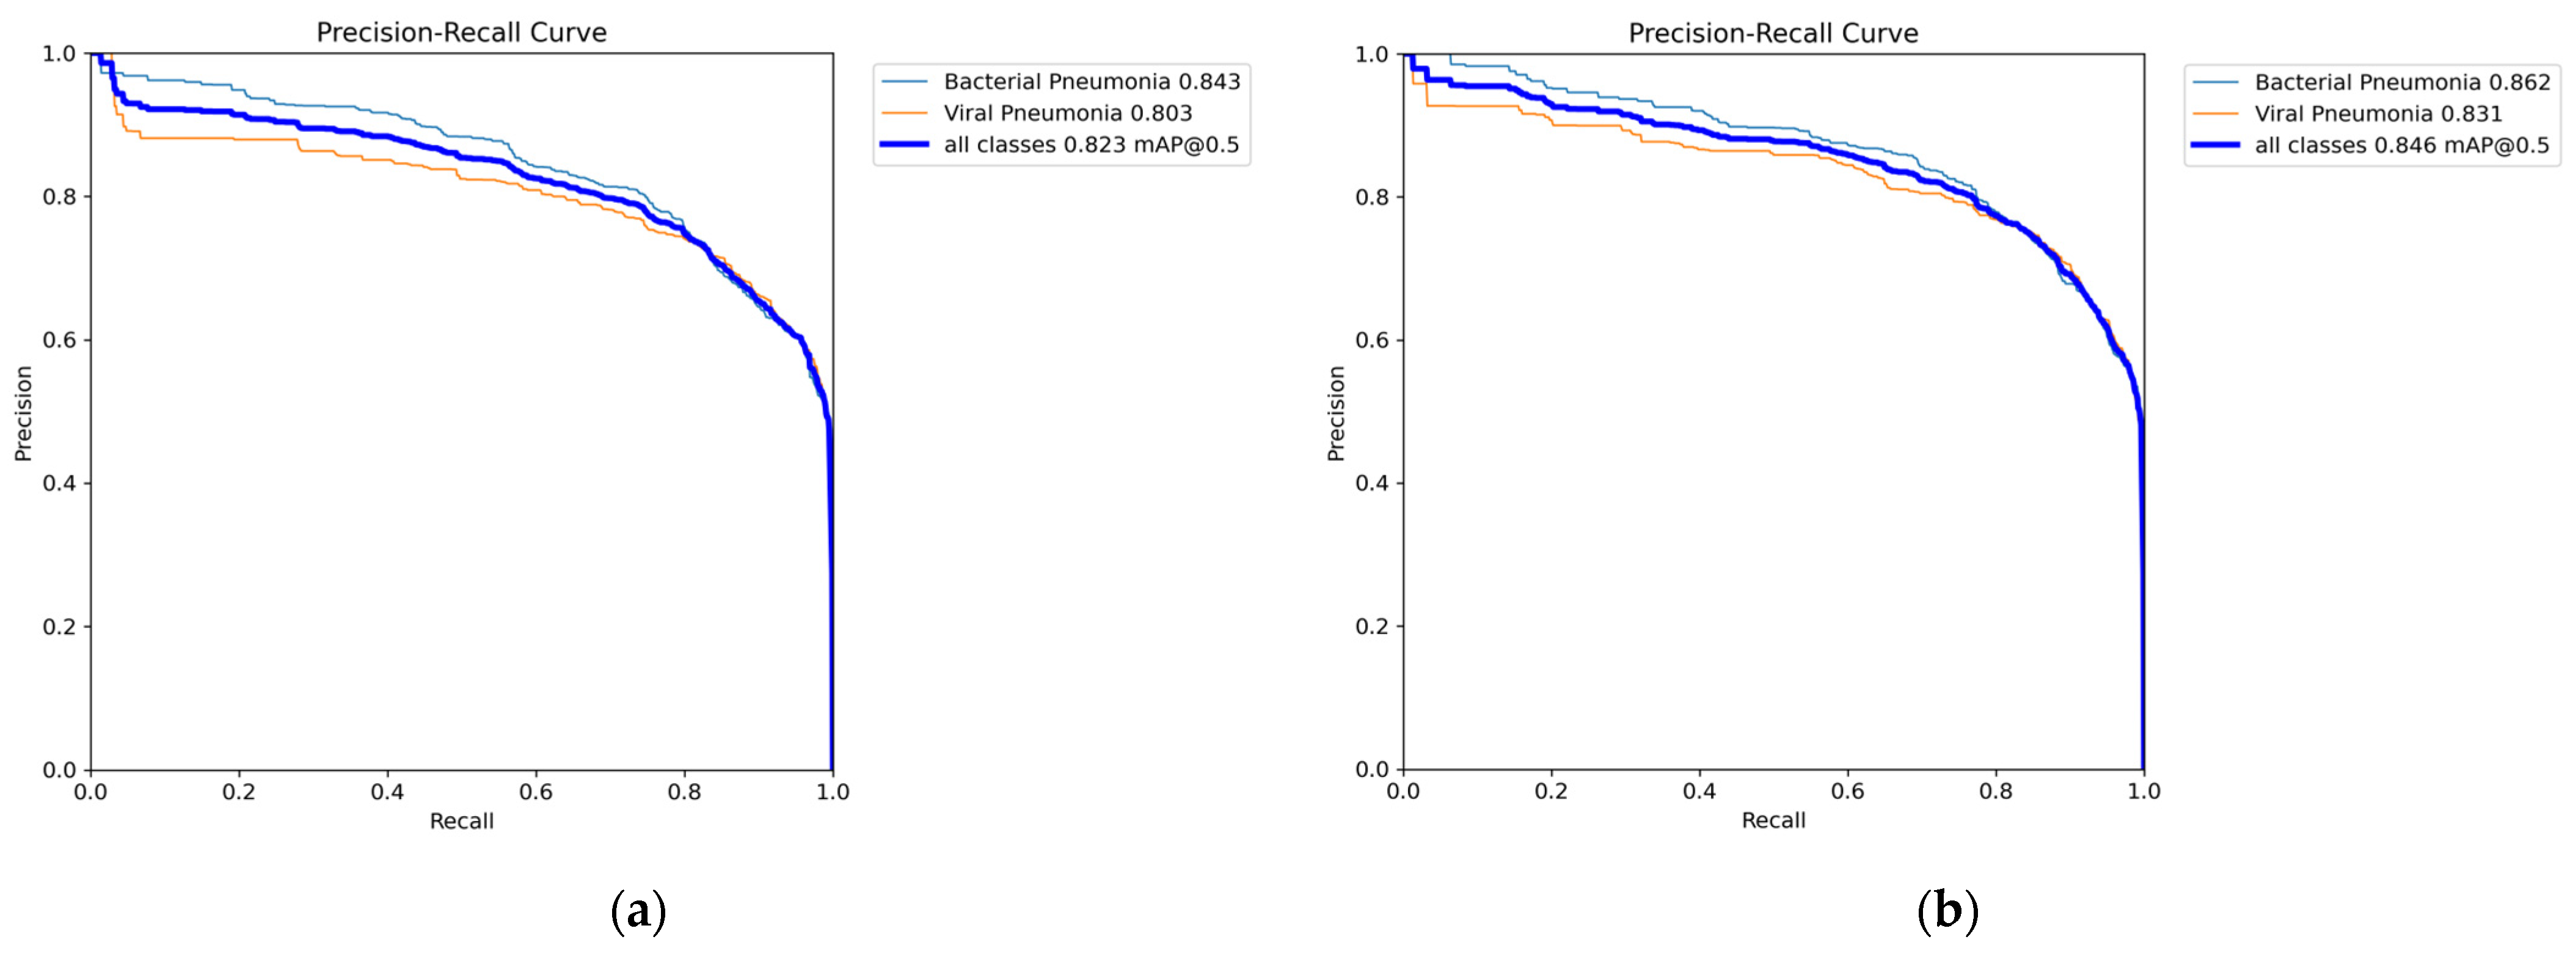
Figure 12 presents the PR curves for YOLOv8n and our method on Bacterial Pneumonia, Viral Pneumonia, and the overall categories. Overall, both methods maintain high precision in the low recall region, with precision gradually decreasing as recall increases. However, the three curves of our method remain slightly higher than the baseline across most recall intervals, indicating that our approach achieves higher precision at the same recall levels. Numerically, the baseline model achieves AP values of 0.843 and 0.803 for Bacterial Pneumonia and Viral Pneumonia, respectively, with an overall mAP@0.5 of 0.823. In contrast, our method improves these values to 0.862 and 0.831, with an overall mAP@0.5 of 0.846, showing improvements across all metrics. This demonstrates that, while maintaining recall, our method further reduces the false positive rate for both types of pneumonia, achieving a superior precision-recall trade-off.