Abstract
The aim of this study is to analyze the signal generated in the brain for a specific motor task and to identify the region where it occurs. For this purpose, electroencephalography (EEG) signals were divided into delta, theta, alpha, and beta frequency sub-bands, and feature extraction was performed by looking at the time-frequency characteristics of the signals belonging to the obtained sub-bands. The epoch corresponding to motor imagery or action and the signal source in the brain were determined by power spectral density features. This study focused on a hand open–close motor task as an example. A machine learning structure was used for signal recognition and classification. The highest accuracy of 92.9% was obtained with the neural network in relation to signal recognition and action realization. In addition to the classification framework, this study also incorporated advanced preprocessing and energy analysis techniques. Eye blink artifacts were automatically detected and removed using independent component analysis (ICA), enabling more reliable spectral estimation. Furthermore, a detailed channel-based and sub-band energy analysis was performed using fast Fourier transform (FFT) and power spectral density (PSD) estimation. The results revealed that frontal electrodes, particularly Fp1 and AF7, exhibited dominant energy patterns during both real and imagined motor tasks. Delta band activity was found to be most pronounced during rest with T1 and T2, while higher-frequency bands, especially beta, showed increased activity during motor imagery, indicating cognitive and motor planning processes. Although 30 s epochs were initially used, event-based selection was applied within each epoch to mark short task-related intervals, ensuring methodological consistency with the 2–4 s windows commonly emphasized in the literature. After artifact removal, motor activity typically associated with the C3 region was also observed with greater intensity over the frontal electrode sites Fp1, Fp2, AF7, and AF8, demonstrating hemispheric symmetry. The delta band power was found to be higher than that of other frequency bands across T0, T1, and T2 conditions. However, a marked decrease in delta power was observed from T0 to T1 and T2. In contrast, beta band power increased by approximately 20% from T0 to T2, with a similar pattern also evident in gamma band activity. These changes indicate cognitive and motor planning processes. The novelty of this study lies in identifying the electrode that exhibits the strongest signal characteristics for a specific motor activity among 64-channel EEG recordings and subsequently achieving high-performance classification of the corresponding motor activity.
1. Introduction
EEG signal identification and classification were used in brain–computer interface (BCI) studies. Nasir et al. [1] used brain signals to measure the user’s attention level and blink rate. They utilized the amplitude of the EEG signal to calculate the number of blinks and used an auxiliary device and its algorithm to measure the attention level. Their discrimination accuracy is reported as 71%. Ko et al. [2] created a brain–computer interface using artificial neural networks for EEG signal interpretation and learning. Schirrmeister et al. [3] used convolutional neural networks for analysis and visualization of EEG signals. Lawhern et al. [4] designed a convolutional neural network (NN) called EEGNet and performed signal analysis by extracting features from EEG signals. They trained the network with limited training data and tested it with four different data sets. Cheng et al. [5] developed a human–computer interface with EEG data fusion for eye movements. Huang et al. [6] designed a human–computer interface for robot arm control with EEG and EOG data. Ieracitano et al. [7] designed a brain–computer interface system based on machine learning using EEG signals. Zhang et al. [8] have performed a study on the separation and recognition of signals generated in different regions of the brain using deep learning with EEG channel selection. Blankertz et al. [9] used machine learning methods to detect some brain functions. Medhi et al. [10] performed a classification with features extracted from EEG signals using convolutional neural network (CNN) filters and deep learning. In their application, they used EEG-derived eye movement signals to turn on and off three different LEDs via a microprocessor. They reported a classification success of over 90% with the deep learning model they developed. Ak et al. [11] classified EEG signals for robot arm control and used GoogleNet deep learning architecture. They reported the classification and control success as 90%. Altuwaijri et al. [12] extracted signal features for classification of EEG signals and used deep learning architecture to determine the variation of attention blocks by channel. Classification success was achieved with 82% accuracy. Roy [13] performed motion thought classification from EEG measurements with deep learning architecture and was able to separate the signal with 93.74% accuracy. Hwaidi and Chen [14] classified motion thought with convolutional neural network using EEG signal and separated the related signal with 96.59% accuracy. Wu et al. [15] performed eye movement classification from features obtained by transfer learning from EEG signal based on eye movements and reported the classification accuracies of different methods with three different data sets. The highest classification accuracy was reported as 83.47%. Lazcano-Herrera et al. [16] proposed a study for EEG motor imagery classification. They used both long short-term memory (BiLSTM) and CNN methods, so they achieved 91.25% and 92.33% classification accuracy, respectively. Mathiyazhagan et al. [17] proposed a hybrid approach that combines empirical mode decomposition (EMD) for extracting intrinsic signal modes, continuous wavelet transform (CWT) for multi-resolution analysis, and source power coherence (SPoC) for spatial feature enhancement. In addition, common spatial patterns (CSPs) were examined for robust feature extraction in their study. For final feature classification, an adaptive deep belief network (ADBN) is used. Chen et al. [18] performed the Dual Branch Blocked Integration Self Attention Network (DB-BISAN), a novel deep learning framework for EEG motor imagery classification. They obtained an effective solution for motor imagery decoding, with significant potential for the development of efficient and accurate brain–computer interfaces. Liao et al. [19] introduced CIACNet, a composite attention convolutional network that achieved accuracies of 85.15% and 90.05% on BCI Competition IV-2a/b datasets by leveraging attention modules and temporal convolutions. Similarly, Li et al. [20] proposed a multi-scale spatio-temporal domain-invariant representation learning method (MSDI), which demonstrated superior generalization and noise robustness across the BNCI2014 datasets. Morales et al. [21] addressed electrode reduction by using Elastic Net regression to predict global channel signals from only eight electrodes, improving the practicality of motor imagery BCI systems. Other contributions include Hadi-Saleh et al. [22], who combined backpropagation neural networks with Honey-Badger Algorithm optimization and Hilbert–Huang preprocessing to improve convergence and classification performance. These studies underscore the growing efficacy of advanced feature extraction, optimization strategies, and attention mechanisms in EEG motor imagery analysis and further contextualize the novelty of our event-based neural network approach.
Recent studies have highlighted the importance of selecting physiologically appropriate epoch lengths for motor imagery (MI) EEG analysis. Most works in the literature adopt short event-related windows of approximately 2–6 s following the stimulus cue, which are considered to capture the strongest motor imagery responses. For example, Ma et al. [23] extracted 4 s MI segments from the BCI Competition IV datasets, while Reddy et al. [24] focused on the 2–6 s interval. Similarly, Li et al. [25] partitioned 10 s trials into 3 s sub-epochs, and Batistić et al. [26] employed sliding windows as short as 0.5–1 s for fine-grained temporal analysis. These studies confirm the trend toward analyzing shorter epochs in order to isolate task-related activity with higher specificity.
Studies in the literature have generally focused on eye movement and brain motor activity detection by the help of brain symmetry. In this study, the signals generated in the brain in the case of the imagery and action of opening and closing the fist were analyzed on different EEG electrodes. The electrodes and brain signal characteristics that best detected the motion of interest were identified and detected. After determining the signal characteristics, motor activity and imagery detection was performed with machine learning algorithms.
The innovative aspect of this study is to identify the electrode with the strongest signal characteristics of a particular motor activity among 64-channel EEG electrodes and to classify the related motor activity with high performance. In addition, the study introduces a robust pre-processing pipeline, including eye blink artifact removal and detailed sub-band energy analysis, which enhances the reliability of feature extraction and provides deeper insights into the spectral and spatial dynamics of motor execution and imagery.
2. Materials and Methods
2.1. Proposed Framework
In this study, we used an EEG dataset obtained from the EEG recordings of the subjects performing motor movement imagery, provided by the PhysioNet database [27,28], which is openly available. This dataset contains signals from a 64-channel EEG recordings from a total of 109 subjects. Figure 1 shows a standard International EEG 10–20 electrode placement system used in obtaining EEG signals. For fist opening and closing action or imagery, the signals obtained from all EEG electrodes of 109 subjects were analyzed, and the electrodes having strong signals for specific actions or thinking were identified. The electrode positions AF7, Fp1, AF3, F5, F7, Fpz, AF8, Fp2, AF4, F6, and F8 were identified among all electrodes as focal sites with high signal energy. These electrodes are located symmetrically in the right and left frontal parts of the brain, as shown inside a circle in Figure 1, and they produce high signal energies for the specific actions or thoughts defined here. Figure 1 has been redrawn based on the 64-channel EEG montage reported in [29], with the electrodes specifically used in our analysis highlighted.
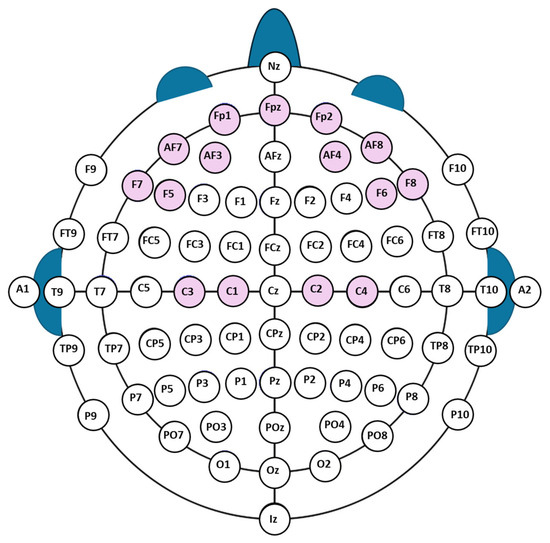
Figure 1.
International 10–20 electrode placement system (redrawn from [29]); red circles show the electrodes analyzed in this study, blue circles the remaining standard electrodes.
The strongest signals through all channels of all subjects were measured by the symmetrical electrodes Fp1 and Fp2. In the following sections, only the signals with the electrodes of interest as focal signal source are analyzed. Figure 2 illustrated raw EEG data and signal energies obtained from the selected two symmetrical electrodes. This study was conducted using MATLAB 2021a, and the computational experiments were carried out on a system equipped with an Intel Core i7 processor (2.60 GHz, 16.0 GB RAM), manufactured by Intel Corporation, Santa Clara, CA, USA.
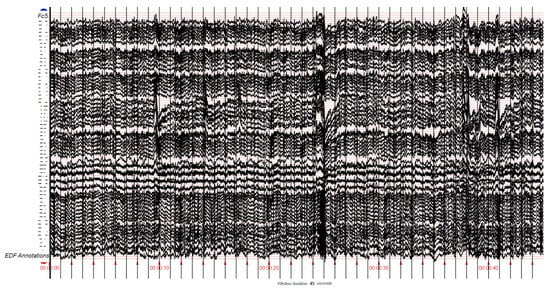
Figure 2.
The 64-channel EEG raw data recorded through 10–20 electrode placement system.
In this study, the signals obtained through EEG system were divided into sub-bands. Table 1 [30] shows the sub-band frequency ranges of brain EEG signals. The aim here is to decompose signals produced in different frequency ranges in different parts of the brain for a specific thought or action request.

Table 1.
EEG sub-bands and frequency ranges.
A 60 Hz notch filter is used to remove 60 Hz noise in the EEG signal caused by mains electricity. A 2nd-order IIR notch (line) filter (MATLAB iirnotch) was applied, centered at 60 Hz, with a sampling rate of 160 Hz. The filter was implemented in normalized frequency form as
Normalized bandwidth was
For the baseline/high-pass filter, a 2nd-order Butterworth high-pass at 0.5 Hz was used to suppress slow drift. To avoid phase distortion, both filters were applied in zero-phase form using MATLAB’s filtfilt function.
Short time Fourier transform and discrete wavelet transform are used for time-frequency resolution of the EEG signal. The time domain amplitude information and frequency resolution of the signal are determined in the same plane, and frequency-time features are extracted. In order to obtain the frequency ranges within the EEG signal, Chebyshev low-pass and band-pass filters were designed in accordance with the cut-off frequency characteristics specified in Table 1.
Figure 3 shows a block diagram for the proposed study. In the preprocessing block, a notch filter is used to remove signal noise. For band decomposition of the EEG signal, frequency bands are defined, and the frequency band suitable for thought or movement is determined from the defined signal. In the feature extraction block, descriptive features of the selected signal are obtained with methods such as Welch, wavelet, and power spectral density. The compatibility of the obtained frequency band power features with the related signal is checked. In the classification block, a two-level classification process is performed for the related baseline or action (Task 1).
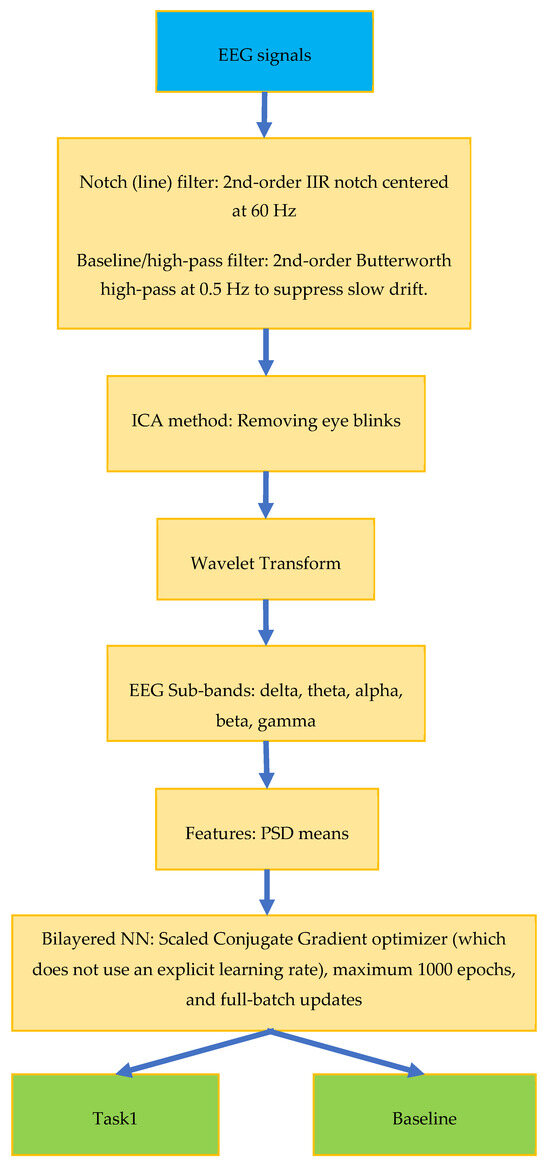
Figure 3.
EEG signal classification block diagram.
In this study, the sub-bands of EEG signals were extracted using wavelet transform, and the energy of each sub-band was separately calculated through power spectral density and Welch methods. Subsequently, average values were employed as the feature vector.
2.2. Power Spectral Density
It provides a measure of the strength of the different frequency components of the signal and measures the frequency content of the signal as given in Equation (3), where x defines the EEG signal:
2.3. Welch’s Method
The Fourier transform-based method for estimating the spectral characteristics of a signal calculates the power spectrum density (PSD) of the signal [31] as given in Equation (4), where x and w are the signal and window functions, respectively:
Power spectral density (PSD) was estimated with Welch’s method (MATLAB pwelch) using a Hamming window of 256 samples, 50% overlap (128 samples), NFFT = 256, and fs = 160 Hz (frequency resolution 0.625 Hz). For each epoch we computed band power features as the mean PSD within δ (0.5–4 Hz), θ (4–8 Hz), α (8–12 Hz), β (12–30 Hz), and γ (30–80 Hz) bands. In this study, the feature vectors were constructed to cover five distinct frequency bands. For each band, the mean power spectral density (PSD) was computed in accordance with Equation (4). Prior to PSD feature extraction, each epoch was normalized to control for amplitude variability across sessions. Specifically, the raw signal form EEG was linearly rescaled to the [0, 1] interval.
2.4. Wavelet Transform
It is used to identify different frequency components in EEG signals by using Daubechies 4 (db4) waveform. So, delta, theta, alpha, beta, and gamma band powers were obtained. After obtaining these sub-bands, PSD features of each sub-band were calculated. Figure 4 and Figure 5 show EEG signal sub-bands obtained by discrete wavelet transform (DWT) for one epoch of Task 1 and baseline signals, respectively.
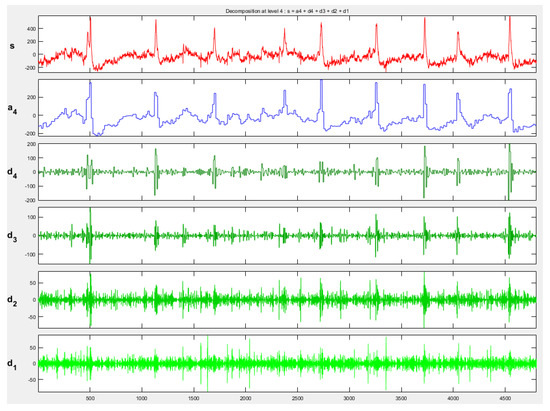
Figure 4.
Task 1 EEG signal sub-bands obtained by DWT (db4). s represents the original EEG signal, a4 denotes the approximation component at level 4, and d4, d3, d2, and d1 correspond to the detail components at levels 4, 3, 2, and 1, respectively.
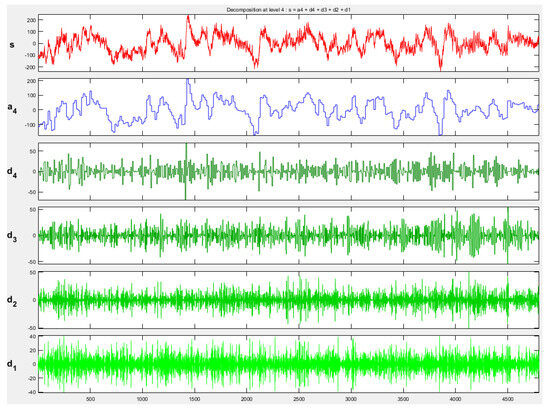
Figure 5.
Baseline EEG signal sub-bands obtained by DWT (db4). s represents the baseline EEG signal, a4 denotes the approximation component at level 4, and d4, d3, d2, and d1 correspond to the detail components at levels 4, 3, 2, and 1, respectively.
2.5. Classification
In this study, the results were examined with various machine learning methods, which were decision tree, support vector machine (SVM), k-nearest neighbors (KNN), neural network, discriminant analysis, logistic regression, and naïve Bayes, and then compared for the classification of EEG signals in relation with thought or brain activity. Algorithms given in the MATLAB environment were used for these classification methods.
After the experimental studies, bilayered NN and trilayered NN provided high success ratios. The terms bilayered NN and trilayered NN refer to feed-forward multilayer perceptrons with two and three hidden layers, respectively. Hidden layer sizes were selected empirically based on validation performance and are reported with the results. Hidden layers used the tansig activation, and the output layer used SoftMax.
Training is realized by MATLAB Deep Learning Toolbox defaults: the Scaled Conjugate Gradient (SCG) optimizer (which does not use an explicit learning rate), maximum 1000 epochs, and full-batch updates. Early stopping was enabled with the default validation-based criterion. No dropout or additional weight decay was applied, and networks were initialized with MATLAB’s default small-random values. To ensure reproducibility, a fixed random seed was set.
All trials from all subjects were combined and then randomly divided into 70% training, 15% validation, and 15% test sets (MATLAB default holdout). Partitioning was performed at the trial level, not subject-wise.
2.6. Extended Spectral and Channel-Based Analysis
In this study, raw EEG signals in .edf format were analyzed, and eye blink artifacts were identified and removed using EEGToolbox [32,33]. The analysis was conducted on data collected from 109 subjects, including the Task 1 and Task 2 protocols. Each subject had three separate .edf recordings, resulting in a total of 327 EEG recordings that were preprocessed by removing eye blink artifacts and prepared for subsequent analysis
The energy analysis of the EEG signals was performed using power spectral density (PSD) estimation based on the fast Fourier transform (FFT). EEG recordings from predefined time intervals—T0 (resting state), T1 (left-hand movement), and T2 (right-hand movement)—were processed separately for each channel and each epoch (trial). Before performing spectral analysis, the mean value (DC component) of each signal was subtracted to ensure zero centering. FFT was then applied to each epoch to extract the signal’s frequency components, and the squared magnitudes of these components were computed to obtain the PSD.
The resulting power spectra were divided into five conventional EEG sub-bands: delta (1–4 Hz), theta (4–8 Hz), alpha (8–13 Hz), beta (13–30 Hz), and gamma (30–45 Hz). For each sub-band, the power values within the corresponding frequency range were summed to calculate the band power. This approach allowed for the identification of the dominant frequency band power for each channel.
Furthermore, the total power across all channels was evaluated to determine the channel with the highest energy for each time interval (T0, T1, and T2). This analysis enabled both spectral and topographical visualization of brain activity, revealing which brain regions exhibited the most significant activation during pre-movement and movement phases. Consequently, this methodology provides a detailed spectral and spatial evaluation of neural dynamics, particularly in relation to motor tasks.
3. Results
3.1. Classification Results
In this research, electroencephalographic (EEG) signals related to motor activities were obtained from the EEG Motor Movement/Imagery Dataset available on the PhysioNet database. The dataset includes more than 1500 recordings, each lasting either 60 or 125 s, collected from 109 participants. EEG signals were acquired using a 64-channel BCI2000 system while the subjects performed different motor tasks. Each participant completed 14 sessions in total: two baseline runs of one minute each (one with eyes open and the other with eyes closed), followed by three runs of two minutes for each of four specific tasks:
Task 1: A cue appeared on the left or right side of the screen, prompting the participant to repeatedly open and close the corresponding fist until the cue disappeared.
Task 2: This task was similar to Task 1, except that the participants only imagined the first movement without performing it physically.
Task 3: When the cue appeared above the screen, participants opened and closed both fists; when the cue appeared below, they instead moved both feet, continuing until the cue disappeared.
Task 4: This task was the same as Task 3 but performed as imagined rather than executed movements.
The dataset provides EEG signals sampled at 160 Hz from 64 channels, along with event markers. Here, T0 denotes the resting state, while T1 and T2 indicate the onset of actual or imagined motor activity under varying conditions.
Experimental studies were carried out with signals from electrodes C3 and Fp1. First of all, the features of all EEG sub-bands were obtained by averaging the PSDs using the Welch method. Then, all sub-band power features were used together, and their classification success was compared with the signals from the C3 channel and the Fp1 channel. The highest classification success with the signals from the Fp1 channel was obtained with the bilayered neural network. Signal epochs of 30 s were used in the experiments. Within each epoch, an event-based selection was applied by marking the task-related intervals (e.g., 0–1 s and 0–2 s events), and only these annotated segments were included in the dataset. EEG signals of Task 1 and baseline signals from 109 subjects were analyzed.
Table 2 shows a comparison of the classification performance of C3 and Fp1 channels using the features of all EEG sub-bands. As can be seen here, the highest success is 90.8% in the Fp1 channel with the PSD average feature and bilayered NN. For this reason, Fp1 channel signals, which provided the highest performance in the experiments, were used in the sub-band selection. In Table 2, the EEG sub-bands delta, theta, alpha, beta, and gamma signals are tested separately, and the classification performance for each sub-band is given. As can be seen from Table 2 and Table 3, the highest classification performance is obtained when all sub-bands are used together.

Table 2.
Comparison of the classification performance of C3 and Fp1 channels.

Table 3.
Classification results for sub-band identification (epoch length = 30 s; feature, PSD mean; classes, Task 1 and baseline).
Table 4 shows the methods and results of similar studies on motor activities in the literature. It is seen that the 92.9% classification performance we obtained in studies related to motor activity detection provides a higher success rate compared with similar analyses given in the literature. Among the results given in Table 4, studies presented by Roy et al. [13] and Hwaidi et al. [14] are related to the classification of motor imagery signals in the right and left regions of the brain, and 93.74% and 96.59% successes were achieved, respectively. In this study, motor activity and baseline classification were performed differently.

Table 4.
Comparison with related studies in the literature.
3.2. Spectral and Channel-Based Analysis Results
In Figure 6, the regions marked with red circles (22–31, Fp1–F5) indicate large deflections in the EEG signal, which correspond to eye blink artifacts. When the entire recording was examined, clear neural activities were observed in the regions between 1 and 10 on the EEG signals. In addition, 2D component maps were generated, and the regions containing eye blink artifacts were analyzed based on these visualizations.
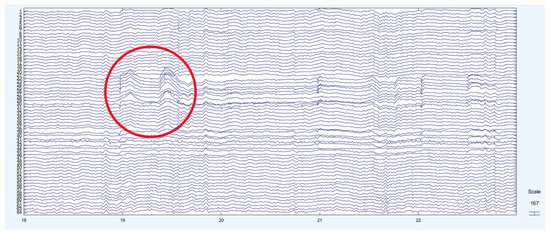
Figure 6.
EEG signal with eye blink artifacts. The circle indicates the region where the eye blink artifact occurs.
EEGLAB’s default settings were applied for the ICA algorithm, specifically the ‘runica (Infomax)’ implementation with learning rate 0.001, maximum 512 iterations, and tolerance 1 × 10⁻⁷.
EEGLAB’s default settings were applied for the ICA algorithm, specifically “runica (Infomax)” algorithm with learning rate 0.001, maximum 512 iterations, and tolerance 1 × 10⁻⁷. The learning rate was calculated without applying automatic and PCA reduction. In preprocessing phase, data were high-pass filtered at 0.5 Hz. For component selection, blink-related components were identified by their frontal scalp topographies (strong loadings at Fp1/Fp2), time-domain morphology (large, stereotyped transients), and spectral signature (dominant low-frequency power). This procedure follows EEGLAB defaults and recommended practice. For thresholding, components exceeding the typical blink pattern were marked for removal. No manual threshold was imposed beyond these default criteria. For validation, removal was confirmed by visual inspection of representative trials across subjects, verifying that eye blink transients disappeared while EEG rhythms were preserved.
As a result of the ICA analysis, eye blink activity was detected in the IC1, IC11, IC18, IC25, and IC39 components (Figure 7).
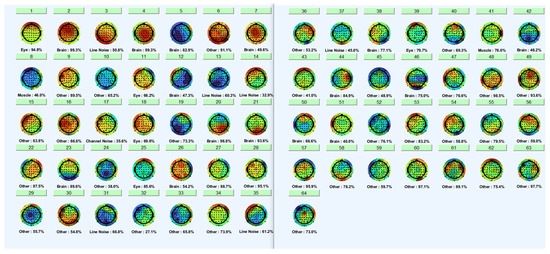
Figure 7.
Eye blink activity was detection from ICA components.
The identified ICA components were removed from the dataset. In the graphs in Figure 8, the red line represents the EEG signal after eye blink removal.
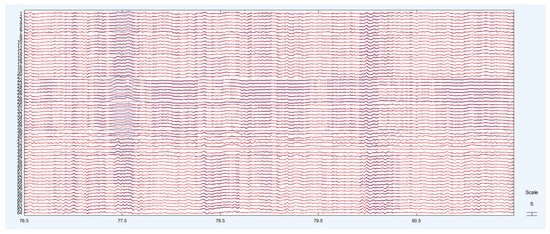
Figure 8.
Cleaned signals and original signals.
After the ocular artifact removal process, a notable reduction in power within the delta band (0–4 Hz) was observed, confirming that low-frequency signals originating from eye movements were effectively eliminated (Figure 9). The spectral analysis further supports this observation, showing that while the power in the delta band significantly decreased after cleaning, the power profiles of the theta, alpha, and beta bands remained largely preserved (Figure 10). This outcome demonstrates that the artifact removal procedure was both effective and selective, thereby providing a reliable basis for subsequent neural activity analysis.
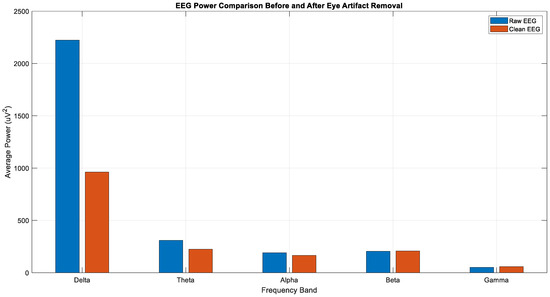
Figure 9.
Average power of each sub-band of raw and clean EEG.
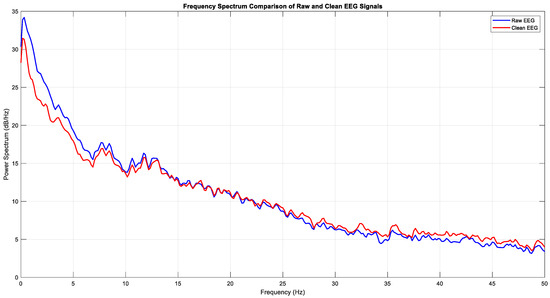
Figure 10.
Frequency spectrum of raw and clean EEG (Task 1).
In the graph given in Figure 11, the total energy of the EEG data across 64 channels (within the 1–40 Hz frequency band) is compared. The analysis reveals that the channel with the highest energy is Fp1.
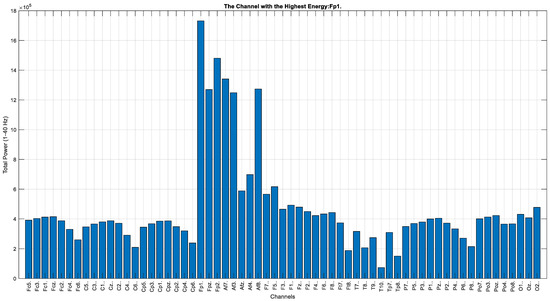
Figure 11.
Total energy comparison for each EEG channel (Task 1).
According to the Task 1 data (Figure 12, Figure 13 and Figure 14), a pronounced increase in energy is observed in the Fp1 channel during both rest (Figure 12) and right-hand movement (Figure 14), while the AF7 channel exhibits dominant activity during left-hand movement (Figure 13). These observations indicate that different frontal regions of the brain are actively engaged during motor tasks and resting states. Moreover, when evaluated in terms of lateralization, clear hemispheric asymmetries are evident across the conditions.
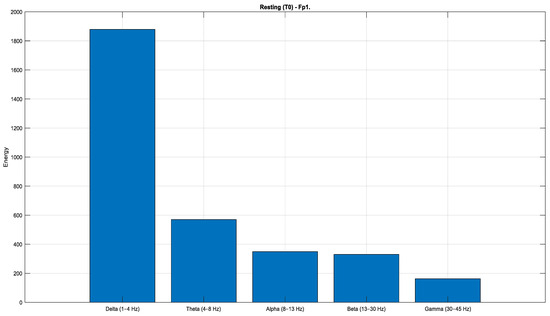
Figure 12.
Comparison of sub-band energies of the Fp1 channel in T0 condition (Task 1).
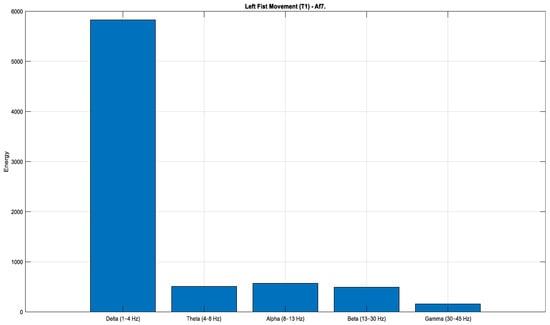
Figure 13.
Comparison of sub-band energies of the Fp1 channel in T1 condition (Task 1).
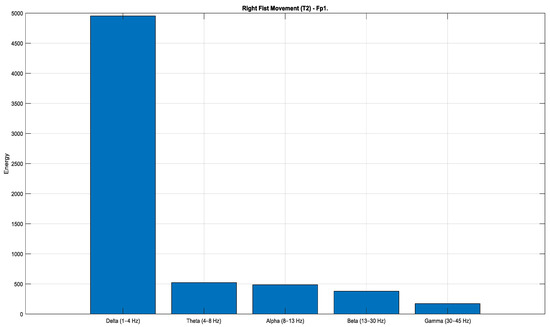
Figure 14.
Comparison of sub-band energies of the Fp1 channel in T2 condition (Task 1).
For the real movement tasks in the EEG data (Task 1), a channel-based energy and frequency band analysis was conducted with a specific focus on the Fp1 and AF7 channels. According to the analysis of the Task 1, these two channels exhibited the highest energy levels among all channels. To gain deeper insight into their spectral characteristics, the Fp1 and AF7 channels were further decomposed into their respective sub-bands (delta, theta, alpha, beta, and gamma) and reanalyzed. This detailed examination provides a clearer understanding of the neural dynamics associated with motor tasks and highlights the dominant frequency components contributing to the observed energy patterns.
The graphs given in Figure 15, Figure 16 and Figure 17 illustrate the distribution of frequency power in the EEG signals during imaginary motor tasks (Task 2, mental simulation of left or right fist opening and closing). The analysis, which calculated the total frequency power within the 1–40 Hz range for each EEG channel, revealed the regions with the highest activity. The results indicate that the Fp1 electrode exhibited the highest energy across all conditions, including resting state (T0) and imagined left-hand (T1) and right-hand (T2) movements. This finding suggests that the left prefrontal region of the brain remains highly active not only during motor imagery but also at rest. The prefrontal cortex, represented by the Fp1 channel, is associated with higher-order cognitive functions such as attention, cognitive planning, and mental imagery. In this context, it can be inferred that neural activity related to motor imagery is particularly concentrated in this area.
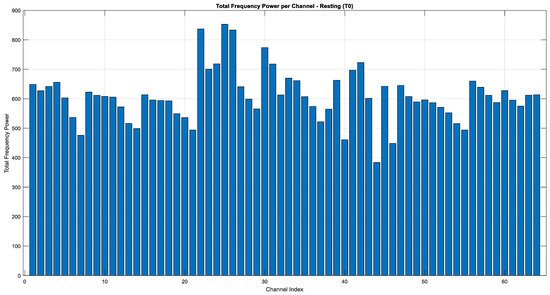
Figure 15.
Total energy comparison of T0 for each EEG channel (Task 2).
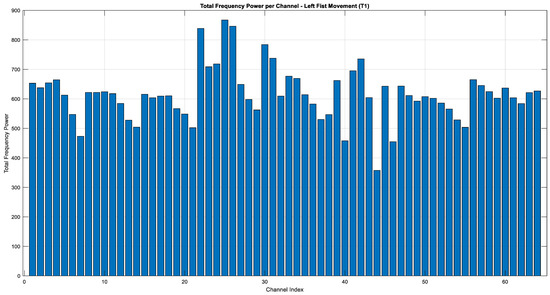
Figure 16.
Total energy comparison of T1 for each EEG channel (Task 2).
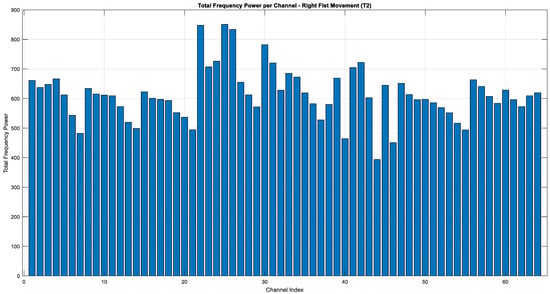
Figure 17.
Total energy comparison of T2 for each EEG channel (Task 2).
According to the analysis of Task 2, the Fp1 channel was identified as having the highest energy. This channel was subsequently decomposed into its sub-bands and reexamined for a more detailed analysis (Figure 18).
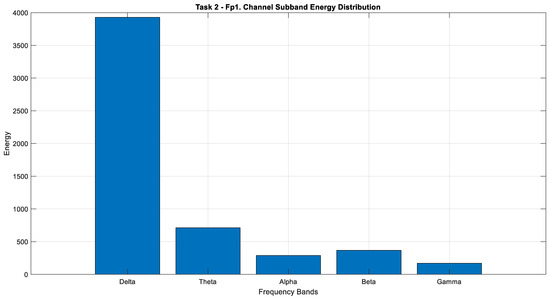
Figure 18.
Comparison of sub-band energies of the Fp1 channel in Task 2.
According to Figure 19, although an increase is observed in the theta band power, it does not indicate the presence of a dramatic change. While alpha activity remains at approximately the same level in T0 and T1, a more pronounced increase is evident at T2. In the beta band power, a gradual increase is observed from T0 through T1 and T2. Considering its proportion within the total energy, there is an approximate 20% increase between T0 and T2. In the gamma band power, T2 exhibits higher activity compared with both T1 and T0. Although delta activity demonstrates the highest power among the T0, T1, and T2 transition states, it shows a dramatic reduction over time. The decrease in delta power and the relative increase in beta power particularly support the enhancement of motor activity in the frontal regions AF7 and Fp1.
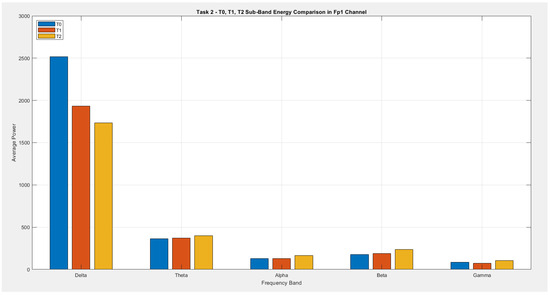
Figure 19.
Comparison of sub-band energies of the Fp1 channel in T0, T1, and T2 conditions (Task 2).
The graph given in Figure 19 presents a comparative analysis of the average power (energy) across five frequency band powers in the Fp1 channel during Task 2 (motor imagery task) for the conditions T0 (rest), T1 (imagined left-fist movement), and T2 (imagined right-fist movement).
As clearly seen in the graph, the highest energy in all three conditions is concentrated within the delta band power (1–4 Hz). Delta energy is most pronounced during T0 (rest) and decreases during T1 and T2, suggesting a reduction in delta activity during motor imagery. Conversely, the energy levels in the theta (4–8 Hz), alpha (8–13 Hz), beta (13–30 Hz), and gamma (30–45 Hz) band powers remain relatively low, but there is a noticeable increase in the beta and gamma band powers during T1 and T2. This increase can be associated with the engagement of cognitive and motor planning processes during mental imagery.
In summary, while the delta band power is dominant during rest, a shift toward higher-frequency band powers is observed during motor imagery tasks. These results support the notion that prefrontal cortex activity in the Fp1 region increases during motor imagery and is closely linked to cognitive processes.
Although the present study employed 30 s epochs, our approach differs fundamentally from a simple long-window segmentation. Within each 30 s segment, ocular artifacts were first removed, and task-related events such as hand opening or eye closure were precisely annotated. The subsequent energy analysis was restricted to these annotated intervals, which correspond to short task-specific segments embedded within the longer window. In practice, this means that the effective analysis was carried out on temporal ranges that overlap with the 2–4 s windows commonly used in the literature. Thus, while our segmentation strategy appears different on the surface, the event-based annotation ensures methodological equivalence with conventional short epoch approaches, while offering additional flexibility for artifact removal and the inclusion of contextual trial information.
4. Conclusions
The brain generates signals in different regions for different activities. These signals are complex signals and are recorded by means of EEG. Motor movements are known to be monitored by electrodes, which are usually located in the frontal and central regions of the brain [16]. Analyzing the signals requires expert knowledge in order to extract meaningful information about the brain regions generating the activity.
In this study, we used motor/imagery EEG signals related to palm opening and closing from the Physionet database to detect the activity and locate the activity focus. In this study, signals from different electrodes were analyzed with different techniques, and classification performance was compared. Machine learning techniques such as decision tree, SVM, KNN, neural network, discriminant analysis, logistic regression, and naïve Bayes were used. The highest classification success was achieved with bilayered NN. The average power spectral density of the EEG signal sub-bands was used as a feature. In order to determine the classification discrimination of the sub-bands, all sub-band power features were used individually in the classifier, and their success was compared. As a result, the discrimination of all sub-band power features together was found to be the highest with a 92.9% success rate obtained with NN.
In future studies, features extracted from high-energy electrodes (e.g., Fp1 and AF7) will be combined for multi-channel fusion, and the approach will be extended toward subject-independent classification and real-time BCI applications. In addition, the integration of short event-based epochs with advanced deep learning architectures will be explored to further improve generalization and online performance.
In addition to classification, an extended spectral and channel-based energy analysis was conducted on 60 EEG recordings after eye blink artifact removal. Across all conditions, the delta band power exhibited substantially higher energy compared with the other frequency bands. This dominance of delta activity was evident during both rest (T0) and movement phases (T1 and T2), with delta power showing a noticeable decrease across conditions, while beta power increased. These changes suggest the engagement of deeper neural structures associated with motor planning and execution. In particular, frontal regions, including AF7 and Fp1, exhibited increased beta activity, providing further evidence for the involvement of the frontal lobe in motor-related tasks. Moreover, after the removal of eye blink artifacts, motor activity—typically reported in the literature as most pronounced over the C3 region—was observed with even higher intensity at the frontal electrode sites Fp1, Fp2, AF7, and AF8 (Figure 11). The presence of hemispheric symmetry in brain activity is well established in previous studies, and our findings indicate that motor-related activation can also be reliably detected over frontal areas such as Fp1 and AF7, with the symmetrical increase at Fp2 and AF8 serving as a confirmation of this observation.
Funding
This research received no external funding.
Data Availability Statement
The original contributions presented in the study are included in the article, further inquiries can be directed to the corresponding author.
Conflicts of Interest
The author declares no conflict of interest.
References
- Nasir, T.B.; Lalin, M.A.M.; Niaz, K.; Karim, M.R.; Rahman, M.A. EEG based human assistance rover for domestic application. In Proceedings of the IEEE 2nd International Conference on Ro-botics, Electrical and Signal Processing Techniques (ICREST). Dhaka, Bangladesh, 5–7 January 2021; pp. 461–466. [Google Scholar]
- Ko, W.; Jeon, E.; Jeong, S.; Suk, H.I. Multi-scale neural network for EEG representation learning in BCI. IEEE Comput. Intell. Mag. 2021, 16, 31–45. [Google Scholar] [CrossRef]
- Schirrmeister, R.T.; Springenberg, J.T.; Fiederer, L.D.J.; Glasstetter, M.; Eggensperger, K.; Tangermann, M.; Hutter, F.; Burgard, W.; Ball, T. Deep learning with convolutional neural networks for EEG decoding and visualization. Hum. Brain Mapp. 2017, 38, 5391–5420. [Google Scholar] [CrossRef]
- Lawhern, V.J.; Solon, A.J.; Waytowich, N.R.; Gordon, S.M.; Hung, C.P.; Lance, B.J. EEGNet: A compact convolutional neural network for EEG-based brain–computer interfaces. J. Neural Eng. 2018, 15, 056013. [Google Scholar] [CrossRef] [PubMed]
- Cheng, S.; Wang, J.; Zhang, L.; Wei, Q. Motion imagery-BCI based on EEG and eye movement data fusion. IEEE Trans. Neural Syst. Rehabil. Eng. 2020, 28, 2783–2793. [Google Scholar] [CrossRef]
- Huang, Q.; Zhang, Z.; Yu, T.; He, S.; Li, Y. An EEG-/EOG-based hybrid brain-computer interface: Application on controlling an integrated wheelchair robotic arm system. Front. Neurosci. 2019, 13, 1243. [Google Scholar] [CrossRef]
- Ieracitano, C.; Mammone, N.; Hussain, A.; Morabito, F.C. A novel explainable machine learning approach for EEG-based brain-computer interface systems. Neural Comput. Appl. 2021, 34, 11347–11360. [Google Scholar] [CrossRef]
- Zhang, H.; Zhao, X.; Wu, Z.; Sun, B.; Li, T. Motor imagery recognition with automatic EEG channel selection and deep learning. J. Neural Eng. 2021, 18, 016004. [Google Scholar] [CrossRef]
- Blankertz, B.; Dornhege, G.; Krauledat, M.; Müller, K.R.; Curio, G. The Berlin Brain-Computer Interface: Machine learning based detection of user specific brain states. Neuroimage 2007, 37, 539–550. [Google Scholar] [CrossRef]
- Medhi, K.; Hoque, N.; Dutta, S.K.; Hussain, M.I. An efficient EEG signal classification technique for Brain–Computer Interface using hybrid Deep Learning. Biomed. Signal Process. Control 2022, 78, 104005. [Google Scholar] [CrossRef]
- Ak, A.; Topuz, V.; Midi, I. Motor imagery EEG signal classification using image processing technique over GoogLeNet deep learning algorithm for controlling the robot manipulator. Biomed. Signal Process. Control 2022, 72, 103295. [Google Scholar] [CrossRef]
- Altuwaijri, G.A.; Muhammad, G.; Altaheri, H.; Alsulaiman, M. A multi-branch convolutional neural network with squeeze and excitation attention blocks for EEG-based motor imagery signals classification. Diagnostics 2022, 12, 995. [Google Scholar] [CrossRef]
- Roy, A.M. An efficient multi-scale CNN model with intrinsic feature integration for motor imagery EEG subject classification in brain-machine interfaces. Biomed. Signal Process. Control 2022, 74, 103496. [Google Scholar] [CrossRef]
- Hwaidi, J.F.; Chen, T.M. Classification of motor imagery EEG signals based on deep autoencoder and convolutional neural network approach. IEEE Access 2022, 10, 48071–48081. [Google Scholar] [CrossRef]
- Wu, D.; Jiang, X.; Peng, R. Transfer learning for motor imagery based brain–computer interfaces: A tutorial. Neural Netw. 2022, 153, 235–253. [Google Scholar] [CrossRef]
- Lazcano-Herrera, A.G.; Fuentes-Aguilar, R.Q.; Ramirez-Morales, A.; Alfaro-Ponce, M. BiLSTM and SqueezeNet with Transfer Learning for EEG Motor Imagery classification: Validation with own dataset. IEEE Access 2023, 11, 136422–136436. [Google Scholar] [CrossRef]
- Mathiyazhagan, S.; Devasena, M.S.G. Motor imagery EEG signal classification using novel deep learning algorithm. Sci. Rep. 2025, 15, 24539. [Google Scholar] [CrossRef]
- Chen, W.; Xu, S.; Hu, Q.; Peng, Y.; Zhang, H.; Zhang, J.; Chen, Z. A Novel Deep Learning Model for Motor Imagery Classification in Brain–Computer Interfaces. Information 2025, 16, 582. [Google Scholar] [CrossRef]
- Liao, W.; Miao, Z.; Liang, S.; Zhang, L.; Li, C. A composite improved attention convolutional network for motor imagery EEG classification. Front. Neurosci. 2025, 19, 1543508. [Google Scholar] [CrossRef]
- Li, J.; Shi, J.; Yu, P. Feature-aware domain invariant representation learning for EEG motor imagery decoding. Sci. Rep. 2025, 15, 10664. [Google Scholar] [CrossRef]
- Morales, O.W.G.; Huertas, D.F.C.; Meza, A.M.A.; Dominguez, C.G.C. EEG Signal Prediction for Motor Imagery Classification in Brain–Computer Interfaces. Sensors 2025, 25, 2259. [Google Scholar] [CrossRef]
- Hadi-Saleh, Z.; Mosleh, M.; Al-Shahe, M.A.; Mosleh, M. Towards decoding motor imagery from EEG signal using optimized back propagation neural network with honey badger algorithm. Sci. Rep. 2025, 15, 21202. [Google Scholar] [CrossRef] [PubMed]
- Ma, S.; Zhang, D. A Cross-Attention-Based Class Alignment Network for Cross-Subject EEG Classification in a Heterogeneous Space. Sensors 2024, 24, 7080. [Google Scholar] [CrossRef] [PubMed]
- Reddy, A.K.G.; Sharma, R. Enhancing motor imagery classification: A novel CNN with self-attention using local and global features of filtered EEG data. Connect. Sci. 2024, 36, 2426812. [Google Scholar] [CrossRef]
- Li, Y.; Zhang, X.; Ming, D. Early-stage fusion of EEG and fNIRS improves classification of motor imagery. Front. Neurosci. 2023, 9, 1062889. [Google Scholar] [CrossRef]
- Batistić, L.; Lerga, J.; Stanković, I. Detection of motor imagery based on short-term entropy of time–frequency representations. Biomed. Eng. Online 2023, 22, 41. [Google Scholar] [CrossRef]
- Schalk, G.; McFarland, D.J.; Hinterberger, T.; Birbaumer, N.; Wolpaw, J.R. BCI2000: A General Purpose Brain-Computer Interface (BCI) System. IEEE Trans. Biomed. Eng. 2004, 51, 1034–1043. [Google Scholar] [CrossRef]
- Goldberger, A.; Amaral, L.; Glass, L.; Hausdorff, J.; Ivanov, P.C.; Mark, R.; Stanley, H.E. PhysioBank, PhysioToolkit, and PhysioNet: Components of a new research resource for complex physiologic signals. Circulation 2000, 101, e215–e220. [Google Scholar] [CrossRef]
- Bitbrain Technologies. Versatile EEG: Portable and Wireless Water-Based EEG Cap with 8, 16, 32 and 64 Channels. Available online: https://www.bitbrain.com/neurotechnology-products/water-based-eeg/versatile-eeg (accessed on 29 August 2025).
- Fıçıcı, C.; Telatar, Z.; Eroğul, O. Automated temporal lobe epilepsy and psychogenic nonepileptic seizure patient discrimination from multi-channel EEG recordings using DWT based analysis. Biomed. Signal Process. Control 2022, 77, 103755. [Google Scholar] [CrossRef]
- Kay, S. Modern Spectral Estimation: Theory and Application; Prentice-Hall, Inc.: Englewood Cliffs, NJ, USA, 1988. [Google Scholar]
- Arnaud Delorme. EEGLAB. 2025. Available online: https://github.com/sccn/eeglab (accessed on 25 July 2025).
- Delorme, A.; Makeig, S. EEGLAB: An open source toolbox for analysis of single trial EEG dynamics including independent component analysis. J. Neurosci. Methods 2004, 15, 9–21. [Google Scholar] [CrossRef] [PubMed]
Disclaimer/Publisher’s Note: The statements, opinions and data contained in all publications are solely those of the individual author(s) and contributor(s) and not of MDPI and/or the editor(s). MDPI and/or the editor(s) disclaim responsibility for any injury to people or property resulting from any ideas, methods, instructions or products referred to in the content. |
© 2025 by the author. Licensee MDPI, Basel, Switzerland. This article is an open access article distributed under the terms and conditions of the Creative Commons Attribution (CC BY) license (https://creativecommons.org/licenses/by/4.0/).