Abstract
The implementation of lean drilling and completion design techniques is a pivotal strategy for the petroleum and natural gas industry to achieve green, low-carbon, and intelligent transformation and innovation. These techniques significantly enhance oil and gas recovery rates. In shale gas development, the shale brittleness index plays a crucial role in evaluating fracturing ability during hydraulic fracturing. Indoor experiments on Gulong shale oil were conducted under a confining pressure of 30 MPa. Based on Rickman’s brittleness evaluation method, this study performed numerical simulations of triaxial compression tests on shale using the finite discrete element method. The fractal dimensions of the fractures formed during shale fragmentation were calculated using the box-counting method. Utilizing the obtained data, a multiple linear regression equation was established with elastic modulus and Poisson’s ratio as the primary variables, and the coefficients were normalized to propose a new brittleness evaluation method. The research findings indicate that the finite discrete element method can effectively simulate the rock fragmentation process, and the established multiple linear regression equation demonstrates high reliability. The weights reassigned for brittleness evaluation based on Rickman’s method are as follows: the coefficient for elastic modulus is 0.43, and the coefficient for Poisson’s ratio is 0.57. Furthermore, the new brittleness evaluation method exhibits a stronger correlation with the brittleness mineral index. The fractal characteristics of crack networks and the relationship between symmetry response and mechanical parameters offer a new theoretical foundation for brittle weight distribution. Additionally, the scale symmetry characteristics inherent in fractal dimensions can serve as a significant indicator for assessing complex crack morphology.
1. Introduction
The green, low-carbon, and intelligent transformation and innovation within the petroleum and natural gas industry have catalyzed the establishment of medium- to long-term carbon reduction strategies and targets by oil and gas companies, thereby accelerating the shift towards low-carbon and efficient transformation. This transformation addresses both energy supply and carbon neutrality goals. One approach involves diversifying the energy business structure by transitioning to various forms of new energy. Concurrently, it includes reducing the carbon footprint of traditional oil and gas operations through the adoption of innovative technologies and methods. These efforts collectively aim to achieve the dual objectives of carbon reduction and the sustainable development of the energy sector [1]. The utilization of lean drilling and completion design techniques significantly enhances oil and gas recovery rates, achieving a dual effect of low-cost and low-carbon development with fewer wells, shorter operational cycles, and reduced investments per unit of oil and gas production. According to calculations by Baker Hughes, a 10% improvement in oil and gas operational efficiency could annually reduce CO2 emissions by approximately 0.5 Gt, equivalent to contributing 5% of the annual reduction target outlined in the Paris Agreement [2,3].
Shale oil, as one of the globally significant alternative energy sources, garners considerable attention in exploration and development. Due to the inherent characteristics of shale reservoirs, such as low porosity, low permeability, and pronounced heterogeneity, the formation of fracture networks is essential for industrial gas flow [4]. Therefore, extensive hydraulic fracturing is required during development to enhance gas release. The presence of natural fractures and the distribution pattern of in situ stress to some extent influence the formation of fracture networks, but shale brittleness is also a significant factor affecting fracture network patterns. The higher the brittleness of shale, the easier it is to form more effective fractures during hydraulic fracturing, making accurate prediction of shale brittleness crucial for fracturing target formations [5].
The methods for rock brittleness evaluation can be broadly divided into six categories: mineral composition, hardness testing, strength parameters, elastic parameters, stress–strain curves, and energy balance analysis (Table 1). Mineral Composition Method (B1–B6): Based on the ratio of brittle mineral content to total mineral content, it is widely used. However, it neglects the influence of mineral morphology, cementation, and pore microstructure and is easily affected by the definition standards of brittle minerals. Hardness Testing Method (B7–B10): Characterizes brittleness through the brittleness index of fracture toughness and hardness, reflecting the differences in rock hardness and solidity. It is influenced by the complexity of the rock diagenesis process, stress state, and environment, resulting in some variability. Strength Parameter Method (B11–B17): Represents brittleness based on the difference between compressive strength and tensile strength, but it neglects the correlation between rock strength and strain and cannot accurately describe brittleness characteristics under complex stress conditions. Elastic Parameter Method (B18–B23): Utilizes elastic modulus and Poisson’s ratio to characterize brittleness, clearly indicating the mutual influence of stress and strain. However, it relies too much on experience and is limited by geographic regions. Stress–Strain Curve Method (B24–B29): Characterizes brittleness through the complete stress–strain features during rock failure but ignores post-peak characteristics, presenting limitations. Energy Balance Analysis Method (B30–B36): Based on energy dissipation and release during the rock deformation and failure process, it better reflects the brittleness characteristics of the entire rock fracture process but fails to show the correlation between mechanical properties and energy evolution.

Table 1.
Summary of existing brittleness evaluation methods.
For the Rickman brittleness evaluation method (B19) in the Elastic Parameter Method, many scholars believe that the claim of equal weight of elastic modulus and Poisson’s ratio is merely empirical and lacks theoretical basis. Therefore, this paper uses the finite discrete element numerical simulation method to simulate the effects of elastic modulus and Poisson’s ratio on fracture complexity in the G area of the Songliao Basin shale reservoir. It quantifies fracture complexity using fractal dimensions and reallocates the weights of elastic modulus and Poisson’s ratio in the brittleness evaluation of the shale reservoir in the G area of the Songliao Basin.
2. FDEM Method
2.1. Basic Equations
The governing equations of motion are given by FDEM method based on Newton’s second law
where m is the node mass, μ is the viscous damping coefficient, u is the node displacement vector, and ftotal is the node force vector. Node force vectors include node forces caused by triangular element deformation (elastic deformation force), node forces caused by node element deformation (elastoplastic deformation force), node forces caused by contact, and other external loads (such as pore pressure and rupture pressure).
2.2. Mechanical Calculation of FDEM
In two-dimensional FDEM, the continuum is discretized into a triangular finite element mesh, and a 4-node joint element with an initial thickness of zero is inserted into the adjacent triangular element. FDEM uses FEM to calculate the stress and strain of triangular elements and DEM method to deal with the contact between triangular elements. The fracture and fragmentation of the entity are simulated by destroying the joint element, while the deformation of the entity is represented by the deformable triangular element and the non-fracture joint element of the coupling effect [32,33].
2.3. Damage Mechanism of FDEM Joint Unit
FDEM simulates the failure process of materials by simulating the fracture of quadrilateral joint elements. The failure modes can be divided into three categories: Figure 1a for tensile failure, Figure 1b for shear failure, and Figure 1c for tension–shear composite failure. Figure 1 shows the destruction mode of the material and the energy required.

Figure 1.
Fracture diagram of joint unit. (a) Relationship between normal stress and opening amount in mode I. (b) Relationship between tangential stress and slip amount in mode II. (c) Relationship between yield and failure of joint element and opening amount and slip amount in I+II composite mode.
The quadrilateral joint element is the key part of FDEM. Under the action of external force, the joint element connecting the adjacent triangular element can be closed, opened, and slid tangentially. The dimensionless damage variable D of the joint unit is defined as
The value of the damage variable D is between 0 and 1, with 0 representing no damage and 1 representing complete damage. If the damage variable D calculated according to Equation (2) is greater than 1, then it is assumed that D = 1; at this time, the joint element breaks and will no longer participate in the stress calculation of the subsequent joint element, where O is the normal displacement of the joint element, Op is the normal displacement when the normal stress of the joint element reaches the tensile strength, Or is the normal displacement of critical failure, S is the tangential displacement of the joint element, Sp is the tangential displacement when the tangential stress of the joint element reaches the shear strength, and Sr is the critical failure tangential displacement. Op, Sp, Or, and Sr can be calculated by Equation (3):
where h is the length of joint unit, pf is the penalty parameter of joint element, ft is the tensile strength of joint element, fs is the shear strength of joint element, GfI is the release rate of type I fracture energy, and GfII is type II fracture energy release rate. fs can be obtained by Mohr Coulomb’s formula:
where c is the cohesion, and φ is the internal friction angle. According to the damage variable of joint element D, the reduction factor of tangential stress and normal stress of joint element f(D) can be obtained as follows:
where a, b, and c are the parameters obtained by fitting the tensile test curve of the material, where a = 0.63, b = 1.8, and c = 6.0. After the reduction factor f(D) is obtained, the normal stress and tangential stress of the joint element can be expressed as follows:
- (1)
- Stage before the yield point:
- (2)
- Stage after the yield point:
GfI and GfII can be obtained from the elastic parameters and fracture toughness of rocks:
where E is the elastic modulus of the rock, v is the Poisson’s ratio of the rock, and KIC and KIIC are the type I fracture toughness and type II fracture toughness of the rock, respectively.
3. Experimental and Numerical Simulations
3.1. Triaxial Compression Experiment
To study the mechanical properties of shale in the G area of the Songliao Basin, shale samples from this region were selected and prepared into standard cylindrical specimens of 25 mm × 50 mm in the laboratory. Five specimens were prepared for repeat experiments. Conventional triaxial compression tests were conducted on the shale specimens using the GCTS RTR-2000 mechanical testing system, which is manufactured in Tempe, AZ, USA. The experiments employed a displacement-controlled loading method with a loading rate of 0.5 mm/min. After applying a confining pressure up to 30 MPa, the confining pressure was kept constant while the axial pressure was gradually increased until the specimen became unstable and failed. This approach enabled the acquisition of deformation and fracture characteristics of deep shale and the true load–displacement curves. Figure 2 shows a schematic diagram of the experimental apparatus and images of rock fractures, indicating that the rock fractures mainly exhibited oblique splitting. Table 2 lists the basic mechanical parameters of the five rock samples.
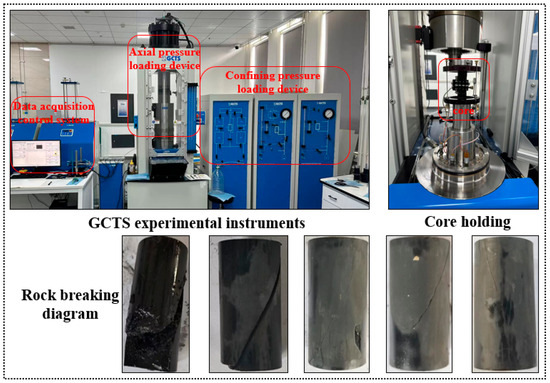
Figure 2.
Schematic diagram of the instrument and image of rock breakage.

Table 2.
Basic parameters of shale rock mechanics.
3.2. Parameter Selection and Model Verification
Before conducting triaxial compression simulations using FDEM, it is necessary to calibrate the computational parameters. Previous studies have indicated that numerical simulation results can be compared with laboratory triaxial compression results for parameter calibration. When the failure modes, strength values, elastic moduli, Poisson’s ratios, and stress–strain curves obtained from simulations closely align with laboratory test results, or when the deviations are within an acceptable range, the input parameters used in the simulation are deemed reasonable. This alignment ensures that the simulation accurately represents the physical behavior of the material under study, validating the robustness and reliability of the chosen parameters. This implies that the final parameter calibration results are not unique and that the relevant parameters can be adjusted within a range where the simulation results can still closely match the laboratory results.
The triaxial compression test simulations utilized a rectangular model with dimensions of 25 mm × 50 mm, consistent with the laboratory samples. Rigid plates were placed at the top and bottom of the experimental model to apply triaxial compression, with a uniform compression rate set at 0.05 m/s. To ensure the stability of the mechanical calculations, a time step of 5 × 10⁻¹⁰ s was chosen for the numerical simulations. In this study, the triaxial compression experimental model followed the plane strain assumption. The selection of micro-mechanical parameters was based on previous research findings and was continuously corrected until the failure mode, strength values, elastic modulus, and Poisson’s ratio obtained from the simulations closely matched the laboratory data, verifying the reasonableness of the parameter settings. Table 3 presents the micro-mechanical parameter settings used in the numerical simulations.

Table 3.
Parameter calibration of micro-mechanics in numerical simulations.
Triaxial compression test simulations on shale were conducted using the meso-mechanical parameters presented in Table 3. In actual shale samples, natural fractures and pore closures occur during compression, leading to an extended pre-peak compaction phase in the stress–strain curve. However, the numerical simulation model did not incorporate the formation of natural fractures and pores, thereby excluding the pre-peak compaction phase. As a result, the strain observed in the simulation is slightly lower than that in actual compression. Figure 3 illustrates the stress–strain curves and failure modes of the triaxial compression model, demonstrating a close alignment between the simulated results and actual failure patterns. Table 4 compares the macroscopic mechanical parameters obtained from the numerical simulations with those measured in laboratory tests. The comparison indicates that the errors in the simulation results are within 5%, reflecting strong simulation performance. This suggests that the meso-mechanical parameters listed in Table 3 effectively represent the mechanical properties of shale.
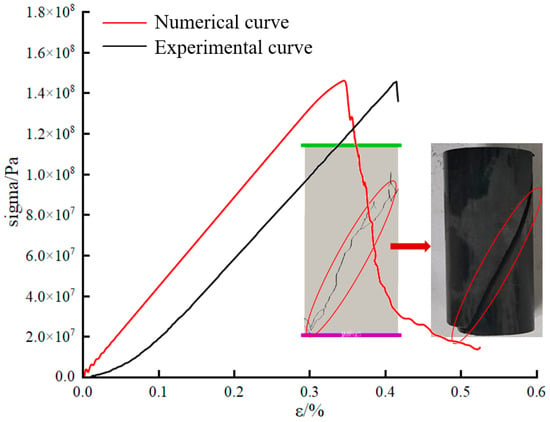
Figure 3.
Stress–strain diagram and failure diagram of triaxial compression model.

Table 4.
Laboratory test and simulation test of shale mechanical parameters.
3.3. Simulation Scheme and Simulation Results
In order to reveal the influence of elastic modulus and Poisson’s ratio on shale fracture propagation, the elastic modulus and Poisson’s ratio are, respectively, valued and numerically simulated. Elasticity modulus parameters were selected as 15 GPa, 20 GPa, 25 GPa, 30 GPa, and 35 Gpa; Poisson’s ratio parameters were 0.1, 0.15, 0.2, 0.25, and 0.3; and the parameters were combined in pairs for numerical simulation. The schematic diagram in Figure 4 illustrates the triaxial compression failure of shale under different elastic moduli and Poisson’s ratios. The simulation results indicate that with a constant Poisson’s ratio when the elastic modulus is lower, more branching cracks form, leading to a more complex crack morphology. For instance, when the Poisson’s ratio is 0.2 and the elastic modulus is 15 GPa, numerous crack branches are observed, resulting in a complex crack morphology. As the elastic modulus increases to 20 GPa, some crack branches disappear. Further increasing the elastic modulus to 25 GPa results in only the main cracks and their minor branches remaining. Additionally, as the elastic modulus is further increased to 30 GPa and 35 GPa, two main cracks appear, with a reduction in minor branch cracks.
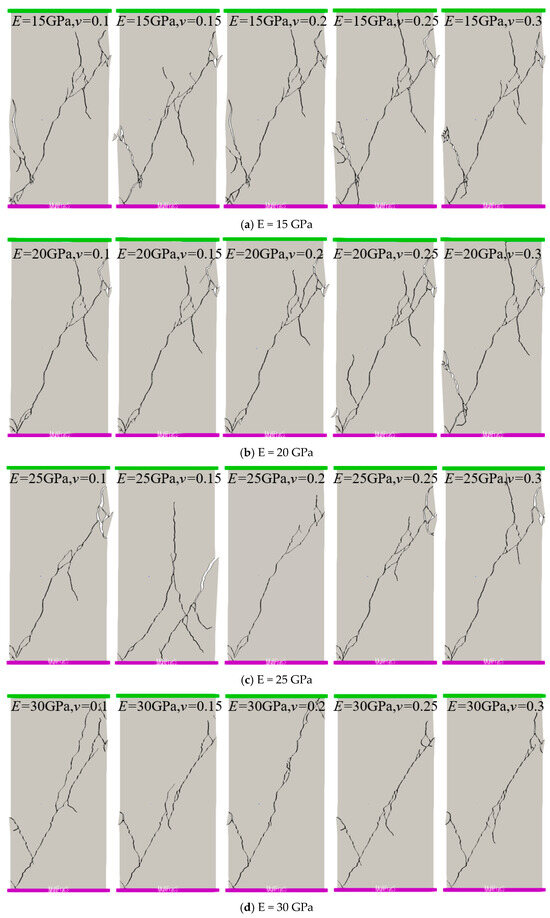
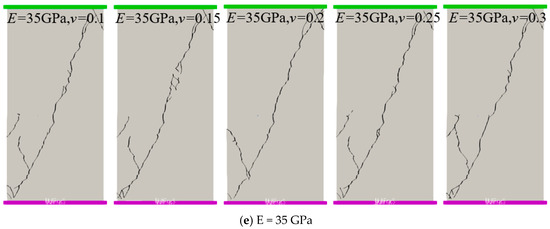
Figure 4.
Simulation diagram of shale triaxial compression failure under different elastic moduli and Poisson’s ratios.
When the elastic modulus is low, such as E = 15 GPa and 20 GPa, there is no significant change in crack behavior with varying Poisson’s ratios. However, when the Poisson’s ratio increases to 0.3, the number of crack branches decreases at E = 15 GPa, while new crack branches appear at E = 20 GPa. Furthermore, when the elastic modulus reaches a certain level, such as E = 25 GPa and 30 GPa, the influence of Poisson’s ratio on crack morphology becomes evident. Cracks formed under low Poisson’s ratios exhibit greater complexity compared to those formed under high Poisson’s ratios. As the elastic modulus continues to increase to 35 GPa, the influence of Poisson’s ratio on crack morphology diminishes.
These results suggest that, with a constant Poisson’s ratio, an increase in elastic modulus enhances the resistance to external forces and reduces the extent of elastic deformation, leading to a gradual decrease in crack branching and complexity. At both low and high elastic moduli, the influence of Poisson’s ratio on crack complexity is relatively small. However, at moderate elastic moduli, such as E = 25 GPa and 30 GPa, Poisson’s ratio begins to significantly affect crack morphology, with cracks formed under low Poisson’s ratios exhibiting greater complexity compared to those formed under high Poisson’s ratios.
There is a close relationship between brittleness and fracture complexity. Specifically, the degree of brittleness significantly influences the formation and development patterns of fractures. Highly brittle materials are more prone to sudden failure under stress, leading to rapid fracture propagation. These fractures tend to be straighter and longer, with minimal influence from surrounding structures. Consequently, highly brittle materials typically form relatively simple fracture networks with regular and straight paths. In contrast, materials with low brittleness tend to undergo significant plastic deformation before fracturing. During fracture propagation, the plastic deformation affects the fracture paths, making them more tortuous and complex, with potential formation of multiple branches. Therefore, low brittleness materials often form intricate fracture networks with irregular paths and numerous branches and intersections.
4. Fractal Dimension and Weight Analysis
4.1. Evaluation of Fracture Complexity by Fractal Dimension
The complexity of segmental cracking serves as a spatial representation of the brittle behavior of materials. According to fracture mechanics theory, the failure process of brittle materials is primarily governed by the rate of energy release, and their crack propagation typically exhibits low energy dissipation characteristics. There is an inherent correlation between geometric complexity, quantified by fractal dimension, and the energy dissipation mechanisms during the fracture process. Systems with a high fractal dimension correspond to larger fracture surface areas and more tortuous paths, which require greater fracture energy. The fractal dimension characterizes the self-similarity of a system across various scales, and this scale symmetry is closely linked to the complexity of the fracture network. Crack morphology associated with a high fractal dimension often displays pronounced multi-level branching symmetry; specifically, the primary and secondary cracks demonstrate a recursive symmetric expansion pattern in their spatial distribution. The extent of symmetry breaking can be quantified by changes in the fractal dimension, offering a novel perspective for understanding the geometric principles governing brittle material fracture. There are many methods to obtain fractal dimension. In this study, the box number method, which is widely used in engineering practice, is used to calculate fractal dimension. The principle of the box number method is to cover the image surface with boxes of different side lengths, and the complexity of the image is characterized by the number of boxes and the side length of the covered image. Therefore, the box dimension algorithm can also conduct fractal analysis of cracks after rock failure, thus revealing the complexity of cracks after rock failure [34].
The basic steps of the box dimension algorithm are as follows: First, the whole rock surface is covered with small squares of length d, and then the number of squares containing cracks is calculated. We gradually adjust the size of the square to obtain a series of values of N(d). Finally, the linear slope is obtained by using the least square method in the double logarithm coordinate system. The size of fractal box dimension can determine the roughness of image surface texture and reflect the network morphology of rock surface fractures. Generally, a larger fractal dimension indicates a higher degree of self-similarity in hydraulic fractures, signifying more complex fracture morphology. This complexity is crucial as it suggests a more intricate and extensive network of fractures, which can enhance the permeability and overall effectiveness of hydraulic fracturing operations.
According to the definition of box dimension, object-based self-similarity can be expressed as
Taking the logarithm of both sides of Equation (1), we get
where N is the number of objects with the specified characteristics; D is the fractal dimension; A is the proportionality constant; and D is the fractal dimension. This equation shows that the relationship between lgN and lg is linear. The negative value of the slope is the fractal dimension D.
The crack image is simulated by the finite discrete element method, and then the image is processed and binarized. In the coding process of Matlab version 2022, the color threshold of the image is adjusted to 0.1, so that all the cracked parts are black and all the other parts are white. The crack growth binarization image and the corresponding fractal dimension are fitted straight lines, as shown in Figure 5.
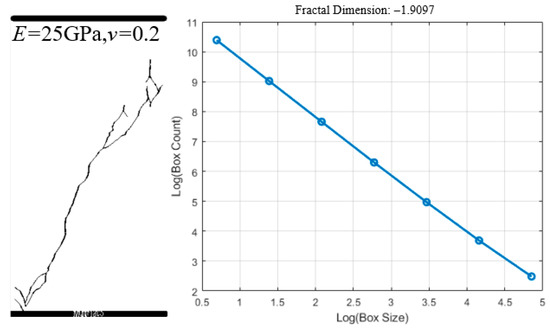
Figure 5.
Binarized image and fractal dimension are fitted straight lines.
After calculation, the fractal dimension of cracks formed by shale triaxial compression under different elastic moduli and Poisson’s ratios is shown in Table 5 and Figure 6. The calculation results show that when Poisson’s ratio is unchanged and the elastic modulus changes, the fractal dimension decreases with the increase in the elastic modulus, and the fracture complexity becomes smaller. When the elastic modulus is constant and Poisson’s ratio is changed, the fractal dimension is very discrete and has no law.

Table 5.
Fractal dimensions of cracks formed by shale triaxial compression under different elastic moduli and Poisson’s ratios.
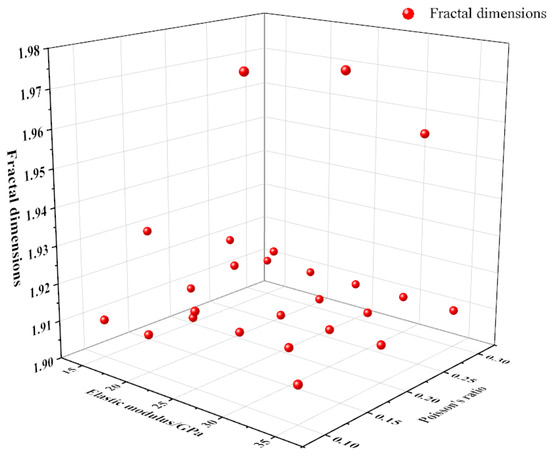
Figure 6.
Scatter distribution of fractal dimensions under different elastic moduli and Poisson’s ratios.
4.2. Multiple Linear Regression Weight Analysis
Using fractal dimension as the dependent variable, and elastic modulus and Poisson’s ratio as independent variables 1 and 2, respectively, a multiple linear regression equation was constructed to analyze the data obtained from Table 5. The results are shown in Table 6. The R2 value indicates that these two independent variables can explain 17.9% of the variance in the dependent variable. However, the fractal dimension describing the fractures formed after rock failure is influenced by factors beyond elastic modulus and Poisson’s ratio, which were not discussed in this study. Hence, the R2 value is relatively low. In cutting-edge research, an R2 value above 0.1 is considered acceptable. Therefore, an R2 value of 0.179 in this study is deemed acceptable.

Table 6.
Model summary.
Table 7 presents the standardized coefficients of the variables in the model. The elastic modulus shows a negative correlation with a coefficient of 0.335, while the Poisson’s ratio shows a positive correlation with a coefficient of 0.259. In the Rickman brittleness evaluation method, the coefficients for elastic modulus and Poisson’s ratio are each 0.5. After performing multiple linear regression in this study and normalizing the obtained model coefficients, the coefficient for elastic modulus is 0.57 and for Poisson’s ratio is 0.43. However, since brittleness and fracture complexity are negatively correlated, the coefficients in the brittleness evaluation weight analysis are adjusted to 0.43 for elastic modulus and 0.57 for Poisson’s ratio.

Table 7.
Model coefficients.
5. Field Verification of New Weight for Brittleness Evaluation
The brittle minerals of shale in area G include quartz minerals and carbonate minerals, and the non-brittle minerals are dominated by illite. Using the content of brittle minerals to calculate the brittleness index of shale, (quartz + carbonate)/(quartz + carbonate + clay) × 100% is defined as the mineral brittleness index, which can be obtained as follows:
where Bmin is the mineral brittleness index; VQuartz is the quartz mineral volume; VCalcite is the volume of carbonate rock; and VClay is the volume of clay.
Rickman et al. [20] adopted shale samples from the FORT-WORTH Basin in North America and proposed a method to express the brittleness of rocks with elastic modulus and Poisson’s ratio on the basis of statistics, as follows:
where Brickman is the brittleness index obtained by the Rickman method; YBri is Young’s modulus after homogenization; PBri is the Poisson’s ratio after homogenization; Y is Young’s modulus measured comprehensively; Ymin is the minimum value of Young’s modulus measured comprehensively; Ymax is the maximum value of Young’s modulus measured comprehensively; P is Poisson’s ratio of comprehensive measurement; Pmin is the minimum value of Poisson’s ratio; and Pmax is the maximum Poisson’s ratio measured comprehensively.
Based on Rickman’s theory, this study redistributes the weights of elastic moduli and Poisson’s ratios as follows:
Using the mineral content distribution curves in Zone M, the brittleness index of minerals was calculated using Equation (11), and the brittleness index of Rickman was computed using the measured Young’s modulus and Poisson’s ratio data with Equations (12)–(14). Additionally, the brittleness index of the new method was obtained using Equations (12), (13), and (15). Figure 7 depicts the intersection results of the brittleness index of minerals and the two brittleness evaluation methods. Generally, there is a certain positive correlation between the brittleness mineral curve and the brittleness index. The trend of the new brittleness evaluation index is roughly consistent with Rickman’s brittleness evaluation method.
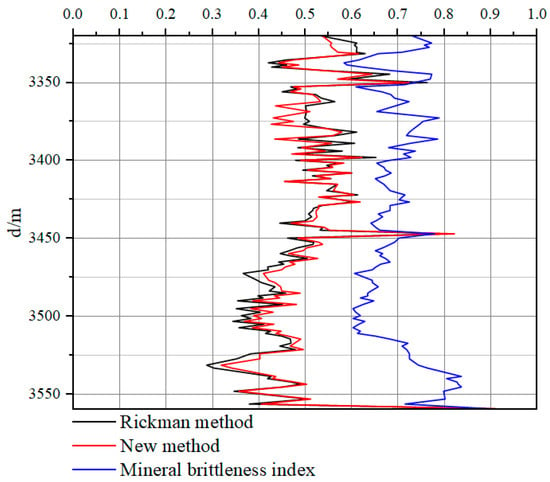
Figure 7.
Calculation results of well brittleness index.
To further validate the predictive performance of the new brittleness evaluation index, the Mean Squared Error (MSE) was calculated. MSE is a widely used statistical metric for assessing the performance of predictive models. MSE quantifies the discrepancy between predicted values and actual values, serving as a measure of the model’s accuracy. The calculation of MSE involves the following steps: Compute the difference between each predicted value and its corresponding actual value; square these differences; sum all the squared differences; and divide the sum by the number of samples. A smaller MSE value indicates superior model performance, as the predicted results are closer to the actual values. By calculating and comparing MSE, we can objectively evaluate the predictive effectiveness of the new brittleness evaluation index in practical applications. This approach ensures a rigorous assessment of the model’s accuracy and reliability in predicting shale brittleness, thereby facilitating its application in hydraulic fracturing and other relevant fields.
The results show that MSE for the Rickman brittleness evaluation index is 0.026233, while MSE for the new brittleness evaluation index is 0.023199, indicating that the new index has a higher predictive performance. This suggests that the reallocation of brittleness evaluation index coefficients in this study is reasonable.
This research aims to propose a method for redistributing the brittleness evaluation index to adapt to different blocks, emphasizing a case-by-case analysis.
6. Conclusions
Building upon Rickman’s brittleness evaluation method, this study employs the finite discrete element method to conduct numerical simulations of shale triaxial compression tests. The fractal dimension of fractures resulting from shale fragmentation is calculated using the box-counting method. Utilizing the acquired data, a multiple linear regression equation is established, which leads to the proposal of a novel brittleness evaluation method. The following conclusions are drawn:
- (1)
- The average value of shale triaxial compression is 147.4 MPa under a confining pressure of 30 MPa. The finite discrete element method effectively simulates the laboratory triaxial compression test.
- (2)
- Both elastic modulus and Poisson’s ratio significantly influence the fracture morphology of shale. As the elastic modulus increases, the complexity of fractures tends to decrease. Variations in Poisson’s ratio also affect the fracture morphology of shale; however, this effect is characterized by considerable variability.
- (3)
- The fractal dimension serves as an effective metric for evaluating the complexity of fractures formed during shale fracturing. By establishing multiple linear regression equations that incorporate elastic modulus and Poisson’s ratio in relation to the fractal dimension, a new brittleness evaluation index can be derived. The resulting coefficients for elastic modulus and Poisson’s ratio are 0.43 and 0.57, respectively. This approach provides a robust and quantifiable method for assessing shale brittleness, thereby enhancing the accuracy of predictions regarding fracture network formation during hydraulic fracturing.
- (4)
- The weight analysis of the Rickman brittleness evaluation method was reassessed, leading to the development of a new brittleness evaluation method. This novel approach demonstrated strong predictive capabilities, providing a fresh perspective for advancing brittleness evaluation methodologies in shale reservoir studies.
Author Contributions
Y.S. and F.L. wrote the main manuscript text; Q.L. and L.H. prepared figures; and L.Y. and X.D. processed data. All authors have read and agreed to the published version of the manuscript.
Funding
The work presented in this paper was financially supported by the First-Class Discipline Collaborative Innovation Program of Heilongjiang Province (Grant No. LJGXCG2024-F02), National Natural Science Foundation of China (42204131), and the Key Research and Development Program of Heilongjiang Province (Grant No. 2024ZX09C01). The Postdoctoral Special Funding of Heilongjiang Province (LBH-TZ2301) is also gratefully acknowledged.
Data Availability Statement
The data used to support the findings of this study are all shown in uploaded manuscript.
Conflicts of Interest
Author Yu Suo was employed by Daqing Oilfield Company Limited, and author Qiang Liang was employed by Petro China Changqing Oilfield Company. The remaining authors declare that the research was conducted in the absence of any commercial or financial relationships that could be construed as potential conflicts of interest.
References
- Li, Y.; Wang, M.; Xue, Z.; Guang, X. Thoughts on green and low-carbon oil and gas development engineering technologies. Pet. Drill. Tech. 2023, 51, 11–19. [Google Scholar]
- Baker, H. We Are Taking Energy Forward: The Path to Net-Zero and a Sustainable Energy Future. 2022. Available online: https://www.bakerhughes.com/company/energy-forward (accessed on 11 May 2025).
- Li, P.; Wang, Y.; Liu, J.; Li, P. Evaluation of Carbon Emission Efficiency and Analysis of Influencing Factors of Chinese Oil and Gas Enterprises. Energy Sci. Eng. 2025, 13, 1156–1170. [Google Scholar] [CrossRef]
- Suo, Y.; Li, F.; He, W.; Fu, X.; Pan, Z.; Feng, F.; Zhao, W. Invasion of drilling fluid into laminated shale model. Chin. J. Eng. 2024, 46, 547–555. [Google Scholar]
- Suo, Y.; Guan, W.; Dong, M.; Zhang, R.; He, W.; Fu, X.; Pan, Z.; Guo, B. Study on the heat extraction patterns of fractured hot dry rock reservoirs. Appl. Therm. Eng. 2025, 262, 125286. [Google Scholar] [CrossRef]
- Jarvie, D.M.; Hill, R.J.; Ruble, T.E.; Pollastro, R.M. Unconventional shale-gas systems: The Mississippian Barnett Shale of north-central Texas as one model for thermogenic shale-gas assessment. AAPG Bull. 2007, 91, 475–499. [Google Scholar] [CrossRef]
- Gale, F. Screening criteria for shale-gas systems. Gulf Coast Assoc. Geol. Soc. Am. Bull. 2009, 59, 779–793. [Google Scholar]
- Glorioso, J.C.; Rattia, A.J. Unconventional Reservoirs: Basic Petrophysical Concepts for Shale Gas. In Proceedings of the SPE/EAGE European Unconventional Resources Conference and Exhibition, Vienna, Austria, 20–22 March 2012. [Google Scholar]
- Buller, D.; Hughes, S.; Market, J.; Petre, E.; Spain, D.; Odumosu, T. Petrophysical evaluation for enhancing hydraulic stimulation in horizontal shale gas wells. In Proceedings of the SPE Annual Technical Conference and Exhibition, Florence, Italy, 20–22 September 2010. [Google Scholar]
- Jin, X.; Shah, S.N.; Roegiers, J.C.; Zhang, B. Fracability Evaluation in Shale Reservoirs—An Integrated Petrophysics and Geomechanics Approach. In Proceedings of the SPE Hydraulic Fracturing Technology Conference and Exhibition, The Woodlands, TX, USA, 4–6 February 2014. [Google Scholar]
- Alzahabi, A.; AlQahtani, G.; Soliman, M.Y.; Bateman, R.M.; Asquith, G.; Vadapalli, R. Fracturability index is a mineralogical index: A new approach for fracturing decision. In Proceedings of the SPE Saudi Arabia Section Annual Technical Symposium and Exhibition, Al-Khobar, Saudi Arabia, 21–23 April 2015. [Google Scholar]
- Honda, H.; Sanada, Y. Mechanical and thermal properties of heat-treated coals. Carbon 1966, 3, 451–461. [Google Scholar] [CrossRef]
- Lawn, B.R.; Marshall, D.B. Hardness, toughness, and brittleness: An indentation analysis. J. Am. Ceram. Soc. 1979, 62, 347–350. [Google Scholar] [CrossRef]
- Quinn, J.B.; Quinn, G.D. Indentation brittleness of ceramics: A fresh approach. J. Mater. Sci. 1997, 32, 4331–4346. [Google Scholar] [CrossRef]
- Copur, H.; Bilgin, N.; Tuncdemir, H.; Balci, C. A set of indices based on indentation tests forassessment of rock cutting performance and rock properties. J. S. Afr. Inst. Min. Metall. 2003, 103, 589–599. [Google Scholar]
- Hucka, V.; Das, B. Brittleness determination of rocks by different methods. Int. J. Rock Mech. Min. Sci. Geomech. Abstr. 1974, 11, 389–392. [Google Scholar] [CrossRef]
- Altindag, R. Correlation of specific energy with rock brittleness concepts on rock cutting. J. S. Afr. Inst. Min. Metall. 2003, 103, 163–171. [Google Scholar]
- Feng, T.; Xie, X.B.; Wang, W.X. Brittleness of Rocks and Brittleness Indexes for Describing Rockburst Proneness. Min. Metall. Eng. 2000, 20, 18–19. [Google Scholar]
- Wang, Y.; Li, X.; Wu, Y.; Ben, Y.X.; Li, S.D.; He, J.M.; Zhang, B. Research on relationship between crack initiation stress level and brittleness indices for brittle rocks. Chin. J. Rock Mech. Eng. 2014, 33, 264–275. [Google Scholar]
- Rickman, R.; Mullen, M.J.; Petre, J.E.; Grieser, W.V.; Kundert, D. A Practical Use of Shale Petrophysics for Stimulation Design Optimization: All Shale Plays Are Not Clones of the Barnett Shale. In Proceedings of the SPE Annual Technical Conference and Exhibition, Denver, CO, USA, 21–24 September 2008. [Google Scholar]
- Luan, X.; Di, B.; Wei, J.; Li, X.; Qian, K.; Xie, J.; Ding, P. Laboratory Measurements of brittleness anisotropy in synthetic shale with different cementation. In Proceedings of the 2014 SEG Annual Meeting, Denver, CO, USA, 26–31 October 2014. [Google Scholar]
- Sharma, R.K.; Chopra, S. New attribute for determination of lithology and brittleness. In Proceedings of the SEG International Exposition and Annual Meeting, Las Vegas, NV, USA, 4–9 November 2012. [Google Scholar]
- Chen, G.; Jiang, W.; Sun, X.; Zhao, C.; Qin, C.A. Quantitative evaluation of rock brittleness based on crack initiation stress and complete stress–strain curves. Bull. Eng. Geol. Environ. 2019, 78, 5919–5936. [Google Scholar] [CrossRef]
- Derek, M.C. Brittle failure of rock materials: Test results and constitutive models. Can. Geotech. J. 1996, 33, 378. [Google Scholar]
- Bishop, A.W. Progressive failure-with special reference to the mechanism causing it. Proc. Geotech. Conf. 1967, 2, 142–150. [Google Scholar]
- Hajiabdolmajid, V.; Kaiser, P. Brittleness of rock and stability assessment in hard rock tunneling. Tunn. Undergr. Space Technol. Inc. Trenchless Technol. Res. 2003, 18, 35–48. [Google Scholar] [CrossRef]
- Xie, J.; Cao, J.; Schmitt, D.R.; Di, B.; Xiao, L.; Wang, X.; Wang, K.; Chen, Y. Effects of kerogen content on elastic properties-based on artificial organic-rich shale (AORS). J. Geophys. Res. Solid Earth JGR 2019, 124, 12660–12678. [Google Scholar] [CrossRef]
- Ai, C.; Zhang, J.; Li, Y.; Zeng, J.; Yang, X.L.; Wang, J.G. Estimation Criteria for Rock Brittleness Based on Energy Analysis During the Rupturing Process. Rock Mech. Rock Eng. 2016, 49, 4681–4698. [Google Scholar] [CrossRef]
- Hou, Z.K.; Yang, C.H.; Wei, X.; Wang, L.; Wei, Y.L.; Xu, F.; Wang, H. Experimental study on the brittle characteristics of Longmaxi formation shale. J. China Coal Soc. 2016, 41, 1188–1196. [Google Scholar]
- Zhang, J.; Ai, C.; Li, Y.; Che, M.G.; Gao, R.; Zeng, J. Energy-Based Brittleness Index and Acoustic Emission Characteristics of Anisotropic Coal Under Triaxial Stress Condition. Rock Mech. Rock Eng. 2018, 51, 3343–3360. [Google Scholar] [CrossRef]
- Li, L.; Zhai, M.; Zhang, L.; Zhang, Z.; Huang, B.; Li, A.; Zuo, J.; Zhang, Q. Brittleness Evaluation of Glutenite Based on Energy Balance and Damage Evolution. Energies 2019, 12, 3421. [Google Scholar] [CrossRef]
- Yan, C.; Zhao, Z.; Yang, Y.; Zheng, H. A three-dimensional thermal-hydromechanical coupling model for simulation of fracturing driven by Multiphysics. Comput. Geotech. 2023, 155, 105162. [Google Scholar] [CrossRef]
- Yan, C.; Xie, X.; Ren, Y.; Ke, W.; Wang, G. A FDEM-based 2D coupled thermalhydro-mechanical model for multiphysical simulation of rock fracturing. Int. J. Rock Mech. Min. Sci. 2022, 149, 104964. [Google Scholar] [CrossRef]
- Wang, X.; Zhao, Y.; Feng, Y.; Wang, Z.; Li, Y.; Chen, B.; Dong, Z.; Wu, S. Simulation of cracks propagation and fractal characteristics of composite rock strata with holes and fractures. Saf. Coal Mines 2024, 55, 42–49. [Google Scholar]
Disclaimer/Publisher’s Note: The statements, opinions and data contained in all publications are solely those of the individual author(s) and contributor(s) and not of MDPI and/or the editor(s). MDPI and/or the editor(s) disclaim responsibility for any injury to people or property resulting from any ideas, methods, instructions or products referred to in the content. |
© 2025 by the authors. Licensee MDPI, Basel, Switzerland. This article is an open access article distributed under the terms and conditions of the Creative Commons Attribution (CC BY) license (https://creativecommons.org/licenses/by/4.0/).