1. Introduction
New energy electric vehicles represent a cleaner and more efficient mode of transportation, with sales growing steadily in recent years [
1]. Consequently, the number of used battery packs is increasing annually. These batteries contain valuable metals like lithium and cobalt, making them crucial for recycling due to their high recovery value. However, if not promptly recycled or disposed of properly, they pose significant risks to environmental sustainability and public health [
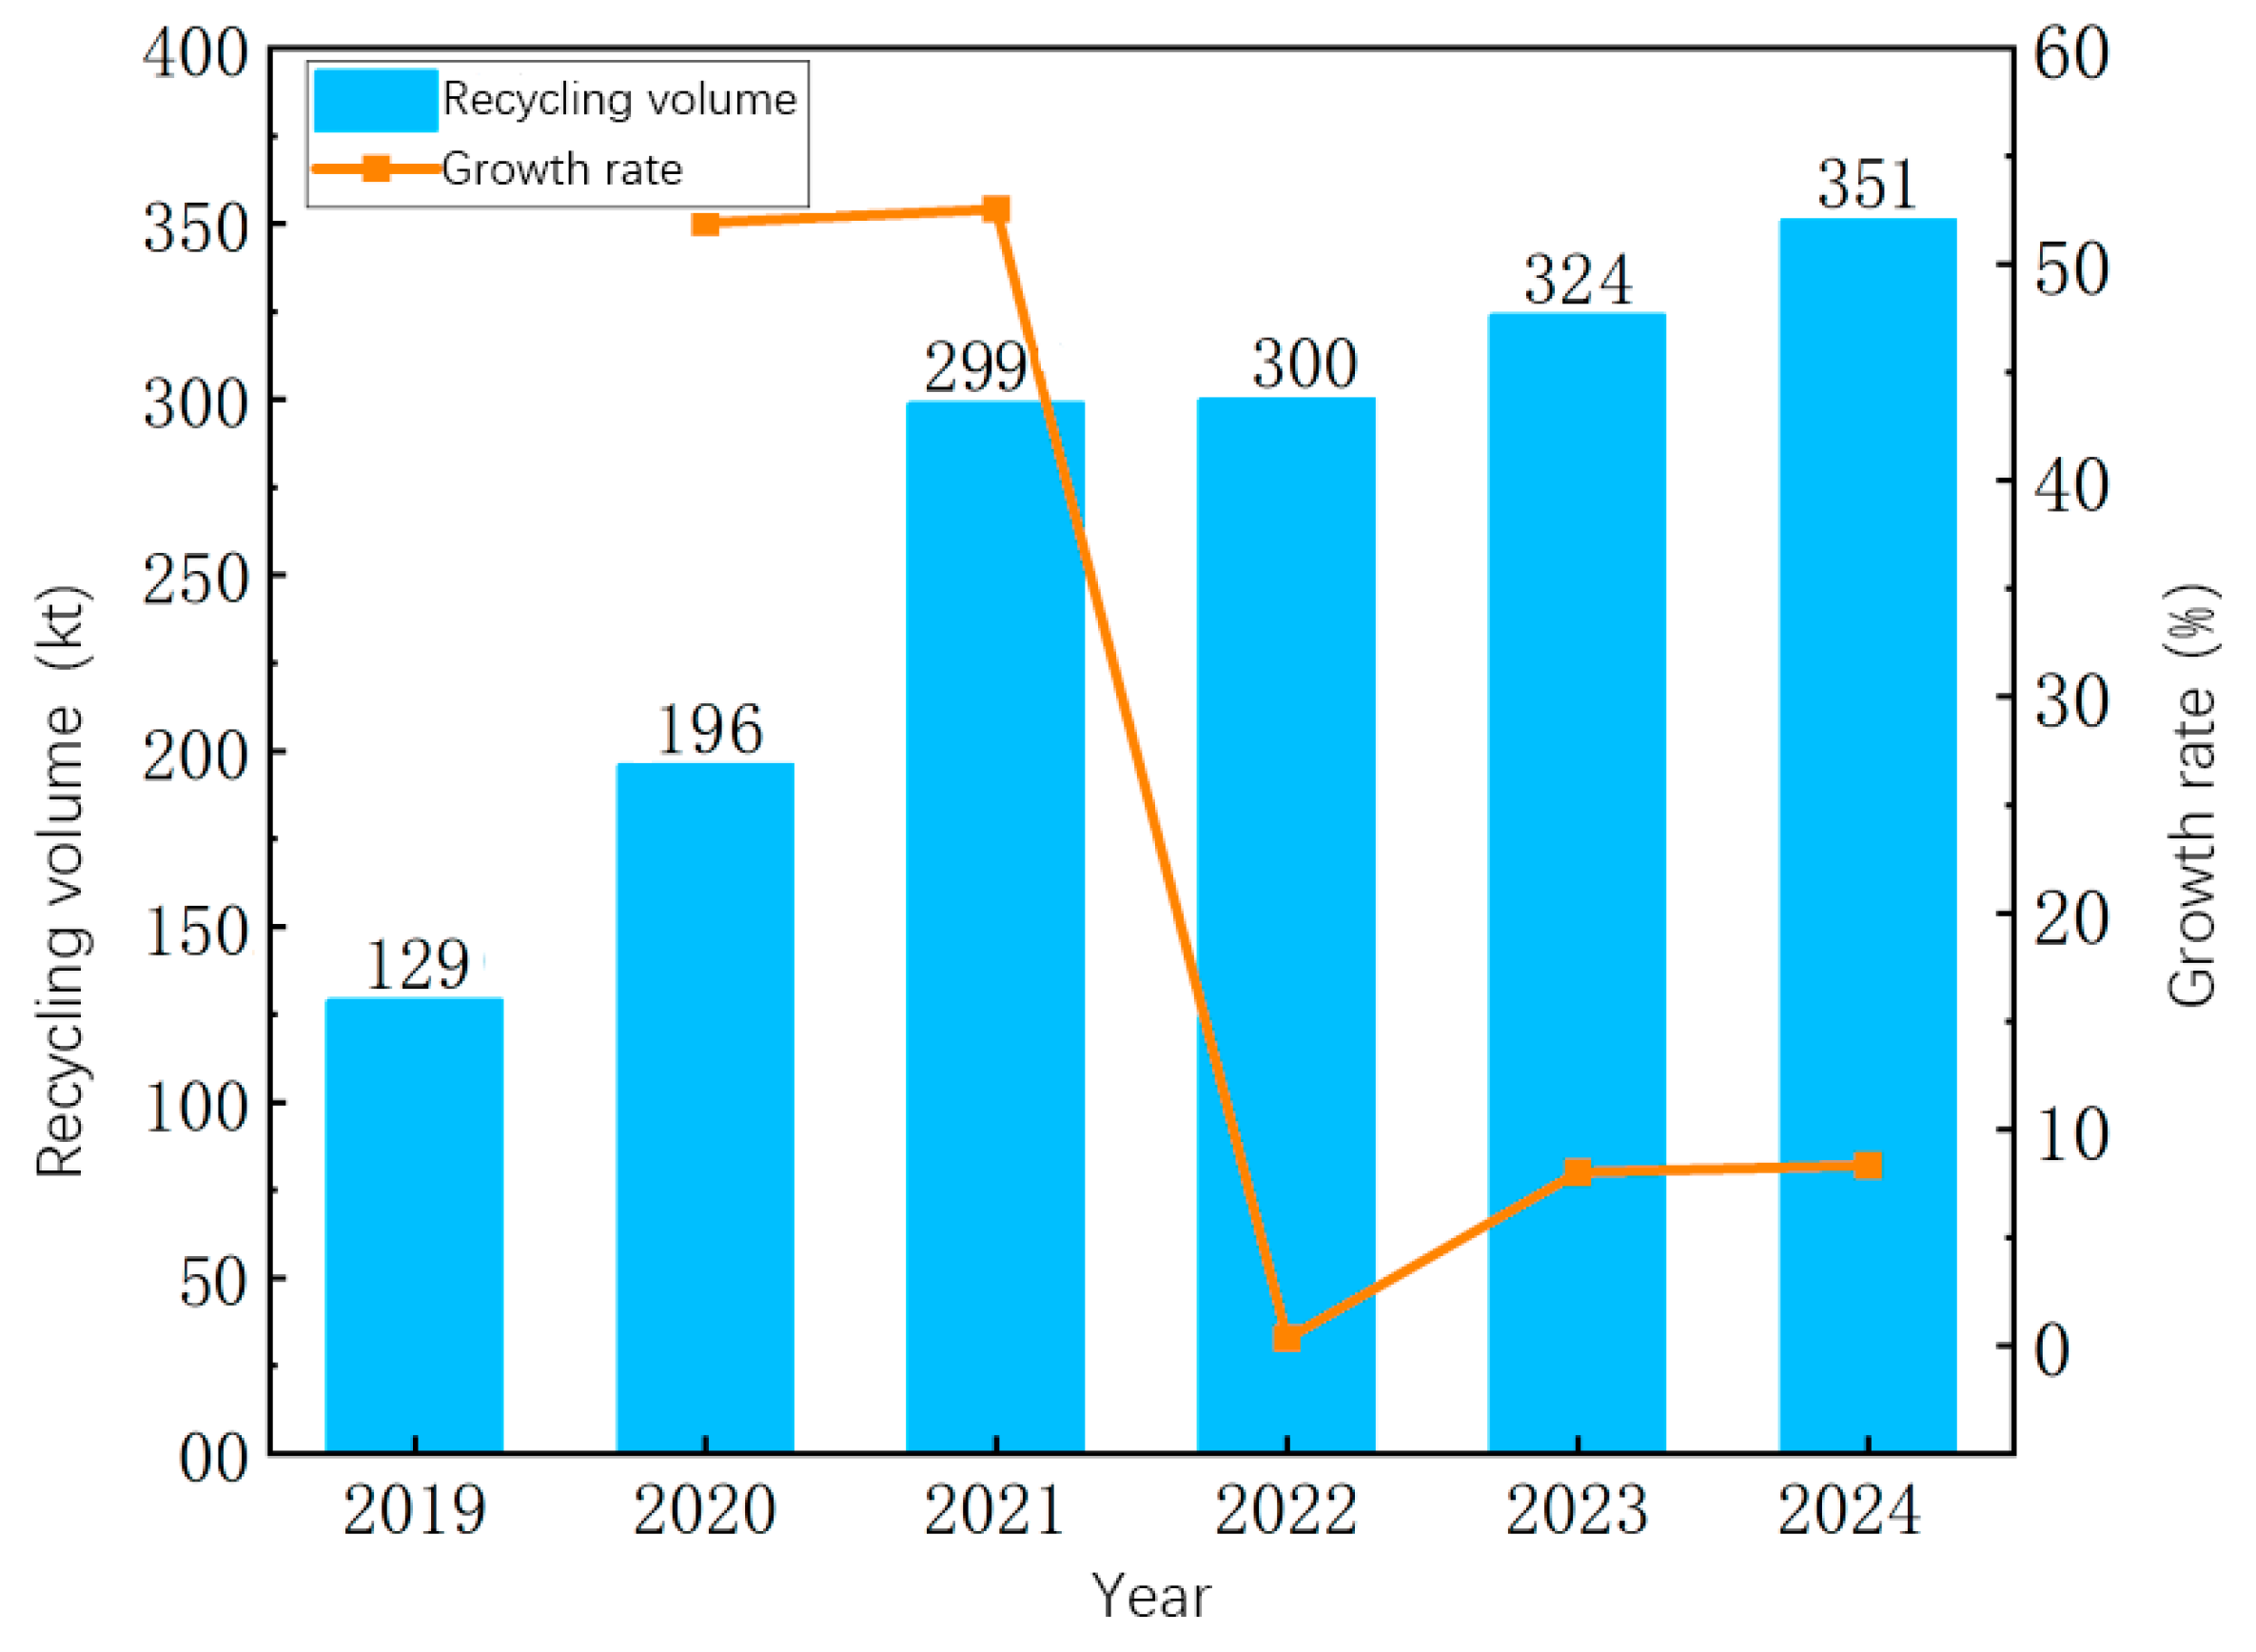
2]. According to a study by the China Business Industry Research Institute, the recycling volume of battery packs in China will increase year by year from 2019 to 2024 [
3]. The specific data are shown in
Figure 1.
Dismantling and recycling used battery packs can recover raw materials more efficiently, bringing considerable ecological and economic benefits [
4]. The efficiency of dismantling lines for used battery packs is low at this stage. Battery packs are also exposed to the risks of fire and explosion in the dismantling process [
5,
6]. These seriously restrict the industrialization of battery pack dismantling and recycling. The efficiency of dismantling and recycling used battery packs is improved in order to control the risks in the battery pack dismantling process [
7]. The efficiency of the battery recycling industry is also closely related to the ecological environment [
8]. Therefore, in this paper, an optimization study of the dismantling line for used electric vehicle battery packs is carried out.
Disassembly line balancing plays a key role in improving efficiency and safety in battery recycling [
9,
10]. Previous research on disassembly line balancing has predominantly focused on optimizing task allocation through multi-objective modeling approaches [
11,
12], with typical objectives including cost minimization and throughput maximization [
13]. Heuristic algorithms have been widely employed to solve these complex optimization problems, particularly when dealing with precedence constraints among disassembly tasks [
14,
15,
16]. The field has examined various production line configurations, including unilateral and bilateral layouts, with particular attention paid to their impacts on operational efficiency and workstation balancing [
17,
18]. Reducing the number of dismantling workstations, controlling the idle rate of dismantling lines, and balancing the workload of operators were also included in our program [
19,
20].
Disassembly risk is a critical yet underexplored factor in disassembly line optimization. The Hazard Index serves as a quantitative measure of risk levels for each disassembly process [
21,
22]. These risks introduce operational uncertainties, where hazardous tasks may potentially cause line stoppages. Consequently, it becomes essential to evaluate and rank the processes according to their risk levels. By allocating tasks to workstations based on their risk indices, the potential impacts of hazardous incidents can be effectively minimized [
23].
Clarifying the battery structure and dismantling process is an essential part of the dismantling process of waste batteries. Automated equipment disassembly saves labor and improves efficiency [
24]. However, improper operation of used batteries in the dismantling process may have safety problems such as deformation and liquid leakage. Automatic dismantling will increase the risk in the dismantling process [
22]. At the same time, the high cost of an automatic dismantling production line makes it difficult to promote it on a large scale. From a disassembly point of view, the battery pack has a more symmetrical structure. The disassembly process is fixed [
18]. Therefore, from the point of view of disassembly efficiency and space utilization, unilateral and symmetrical bilateral layout modes are selected for program optimization analysis in this study.
The optimization balance of the existing traditional dismantling line for waste electrical and mechanical products still takes the dismantling costs, station smoothing index, and other single economic indicators as the optimization objectives [
25,
26]. The evaluation system is relatively simple. At the same time, existing research lacks the exploration of dismantling risks. In fact, dismantling risk is an indispensable consideration in the enterprise battery recycling process [
27]. In addition, the existing research only focuses on the exploration of individual dismantling layout schemes and lacks intensive exploration and scheme comparisons of unilateral dismantling lines and bilateral dismantling lines for used electric vehicle batteries.
In this study, a risk evaluation method based on the Likelihood–Exposure–Consequence (LEC) risk evaluation method is applied to assess the risks associated with the dismantling process of used battery packs for electric vehicles. The risk assessment results are incorporated into the dismantling line optimization objectives to minimize the overall workstation risks. Optimization adjusts the process schemes and workstation numbers, targeting the following four key objectives: workstation count, idle time, dismantling cost, and risk value. A comprehensive optimization model is developed for both unilateral and bilateral dismantling lines. The heuristic algorithms solve the model’s optimization to balance efficiency and safety. The optimal solution is obtained through linear weighting and plant simulation analysis.
2. Battery Pack Disassembly Process and Risk Evaluation
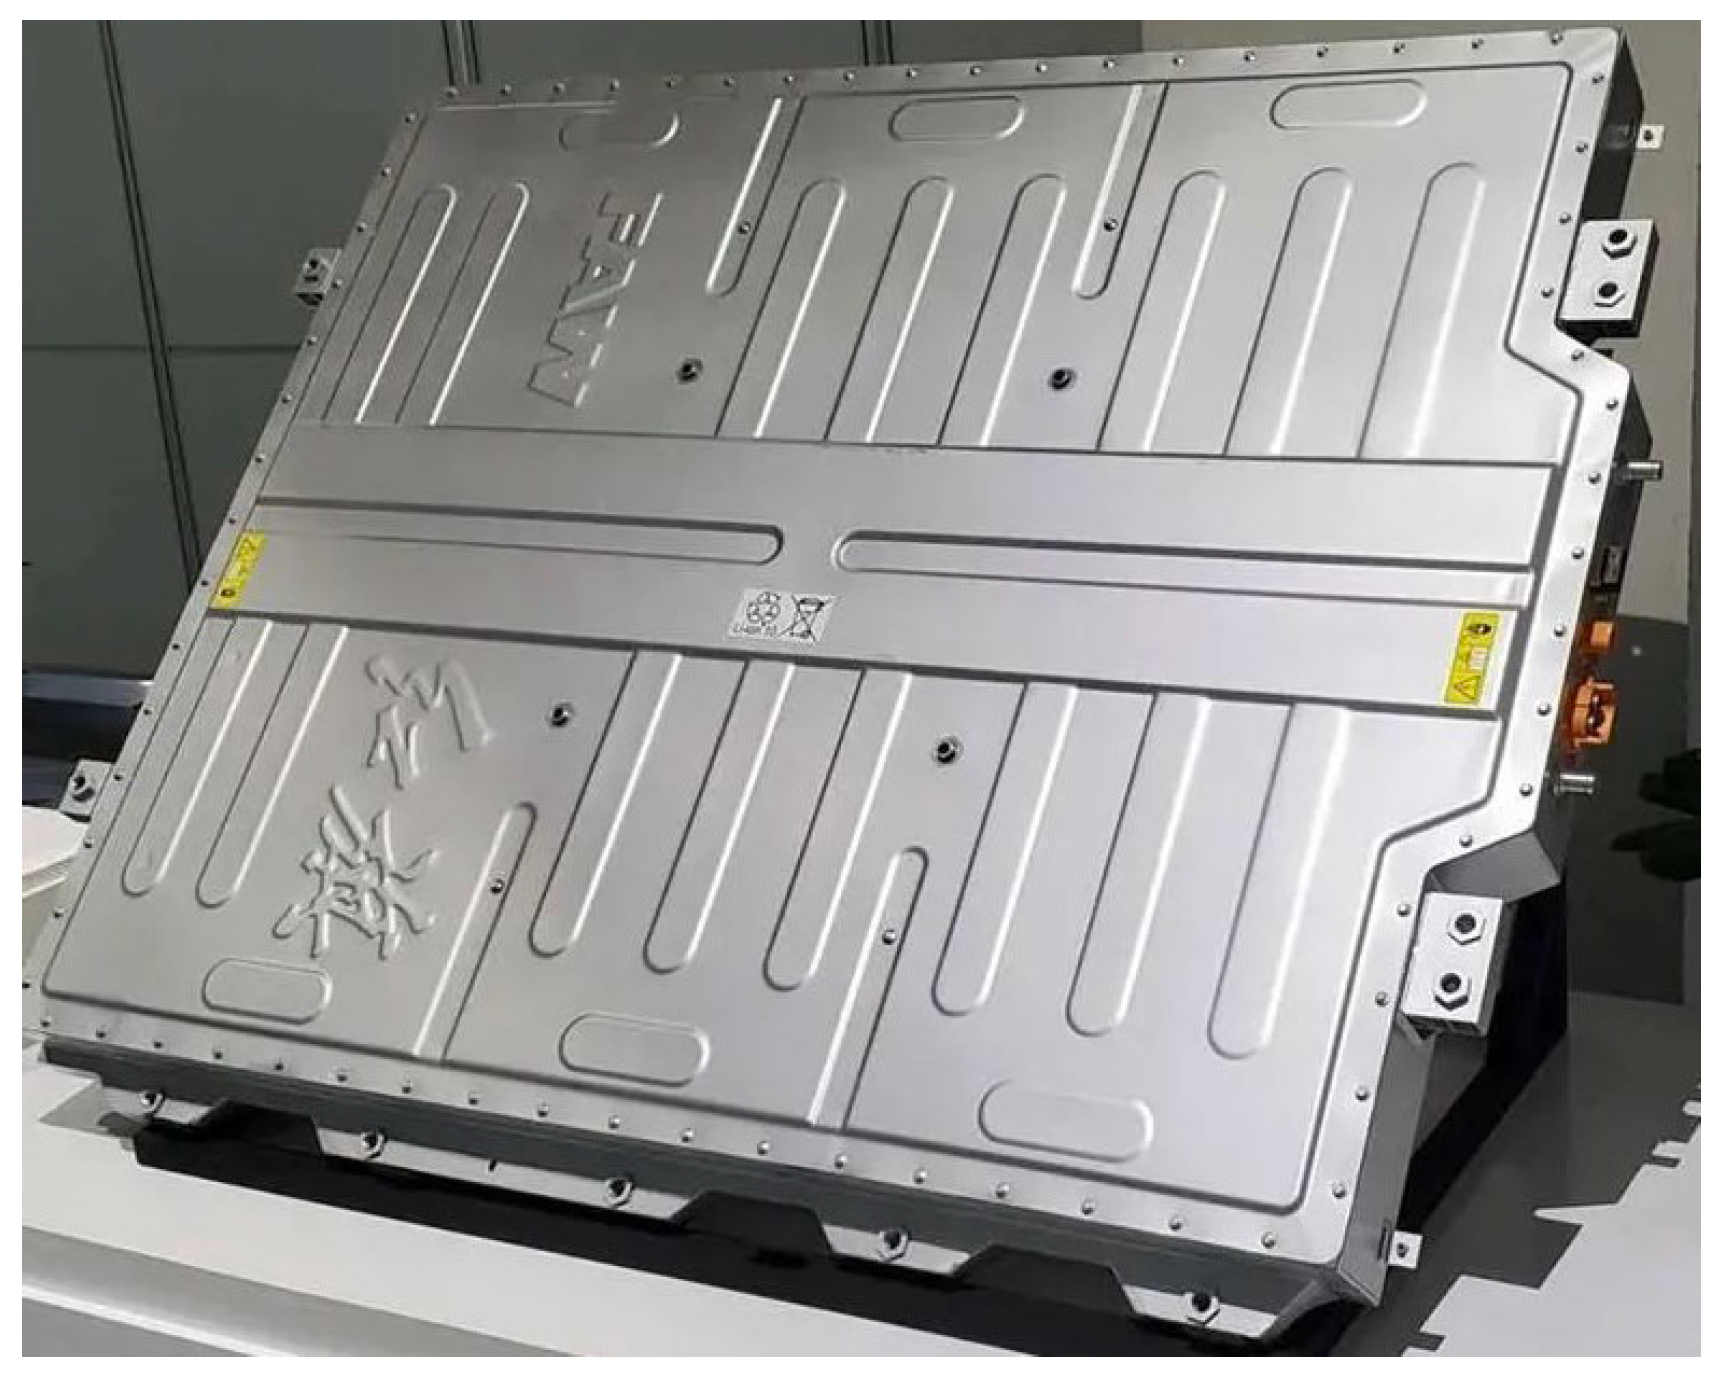
This study selects a Red Flag electric vehicle battery pack as the research subject. The battery pack comprises multiple components: battery modules, a battery management system, a thermal management system, high- and low-voltage electrical components, and mechanical structural parts. With a nominal voltage of 410 V, the pack delivers over 91 kWh of usable energy. Its physical dimensions measure 2120 × 1486 × 148 mm, with a total weight of 550 kg. The system integrates 14 individual battery modules.
Figure 2 presents the complete battery pack assembly.
The LEC (Likelihood–Exposure–Consequence) risk evaluation method is a semi-quantitative risk evaluation. The method addresses risk sources in potentially risky operating environments [
28]. The evaluation method is mainly used to assess the riskiness of operational tasks, especially in scenarios involving occupational health and safety, by scoring the three dimensions: L (Risk Likelihood), E (Exposure Frequency), and C (Consequences Severity).
Risk Likelihood (L) is used to indicate the likelihood of a risk event occurring, typically quantified in the form of probability. In practical assessments, a risk that will certainly occur is assigned a score of 10, while a risk that is considered almost impossible to occur is given a score of 0.1. Scores for other probabilities of event occurrence fall between these two values. Based on the aforementioned principles, different probabilities of event occurrence are assigned specific scores. The specific risk likelihood scores are shown in
Table 1.
Exposure Frequency (E) refers to how often personnel are exposed to risks, which varies depending on factors such as the disassembly tasks performed, working hours, and frequency. The specific scoring criteria are shown in
Table 2.
Consequences Severity (C) refers to the potential impact severity of an accident, typically quantified in terms of economic losses, environmental damage, or personnel safety impacts. The specific severity levels and corresponding scores are shown in
Table 3.
The Danger Value (D) is calculated using the product of three factor scores: riskiness, frequency of exposure, and severity of consequences [
29]. The risk value is calculated as shown in Equation (1):
The Danger Value (D) is evaluated and classified based on calculated risk values, which reflect both the likelihood and potential severity of accidents. The risk rating scale and corresponding accident impact levels are shown in
Table 4.
By analyzing the actual work of the workers at the FAWER Automotive Parts Limited Company (FA), including disassembly, parts consolidation, and other operations, it was determined that the battery pack contains 26 disassembled parts. The LEC risk assessment method was used to analyze the impact of each risk factor during the actual disassembly process. For the specific calculation of D, the enterprise experts analyzed the degree of influence of the actual dismantling process on each risk factor and scored the risk of each process using the LEC quantification method mentioned above. The specific risk value D for this battery pack dismantling task was finally calculated by Equation (1). In addition, the dismantling time and dismantling cost were also derived from the field study. The details are shown in
Table 5:
Since each workstation includes multiple tasks, disassembly risk control should be performed on the task schedule of each workstation. The arrows represent the relationship between the dismantling tasks before and after. Through the risk level in
Table 4, the risk level of each workstation should be controlled to be a low risk and below in actual disassembly [
30]. That is, the total risk value of dismantling tasks should be less than 70.
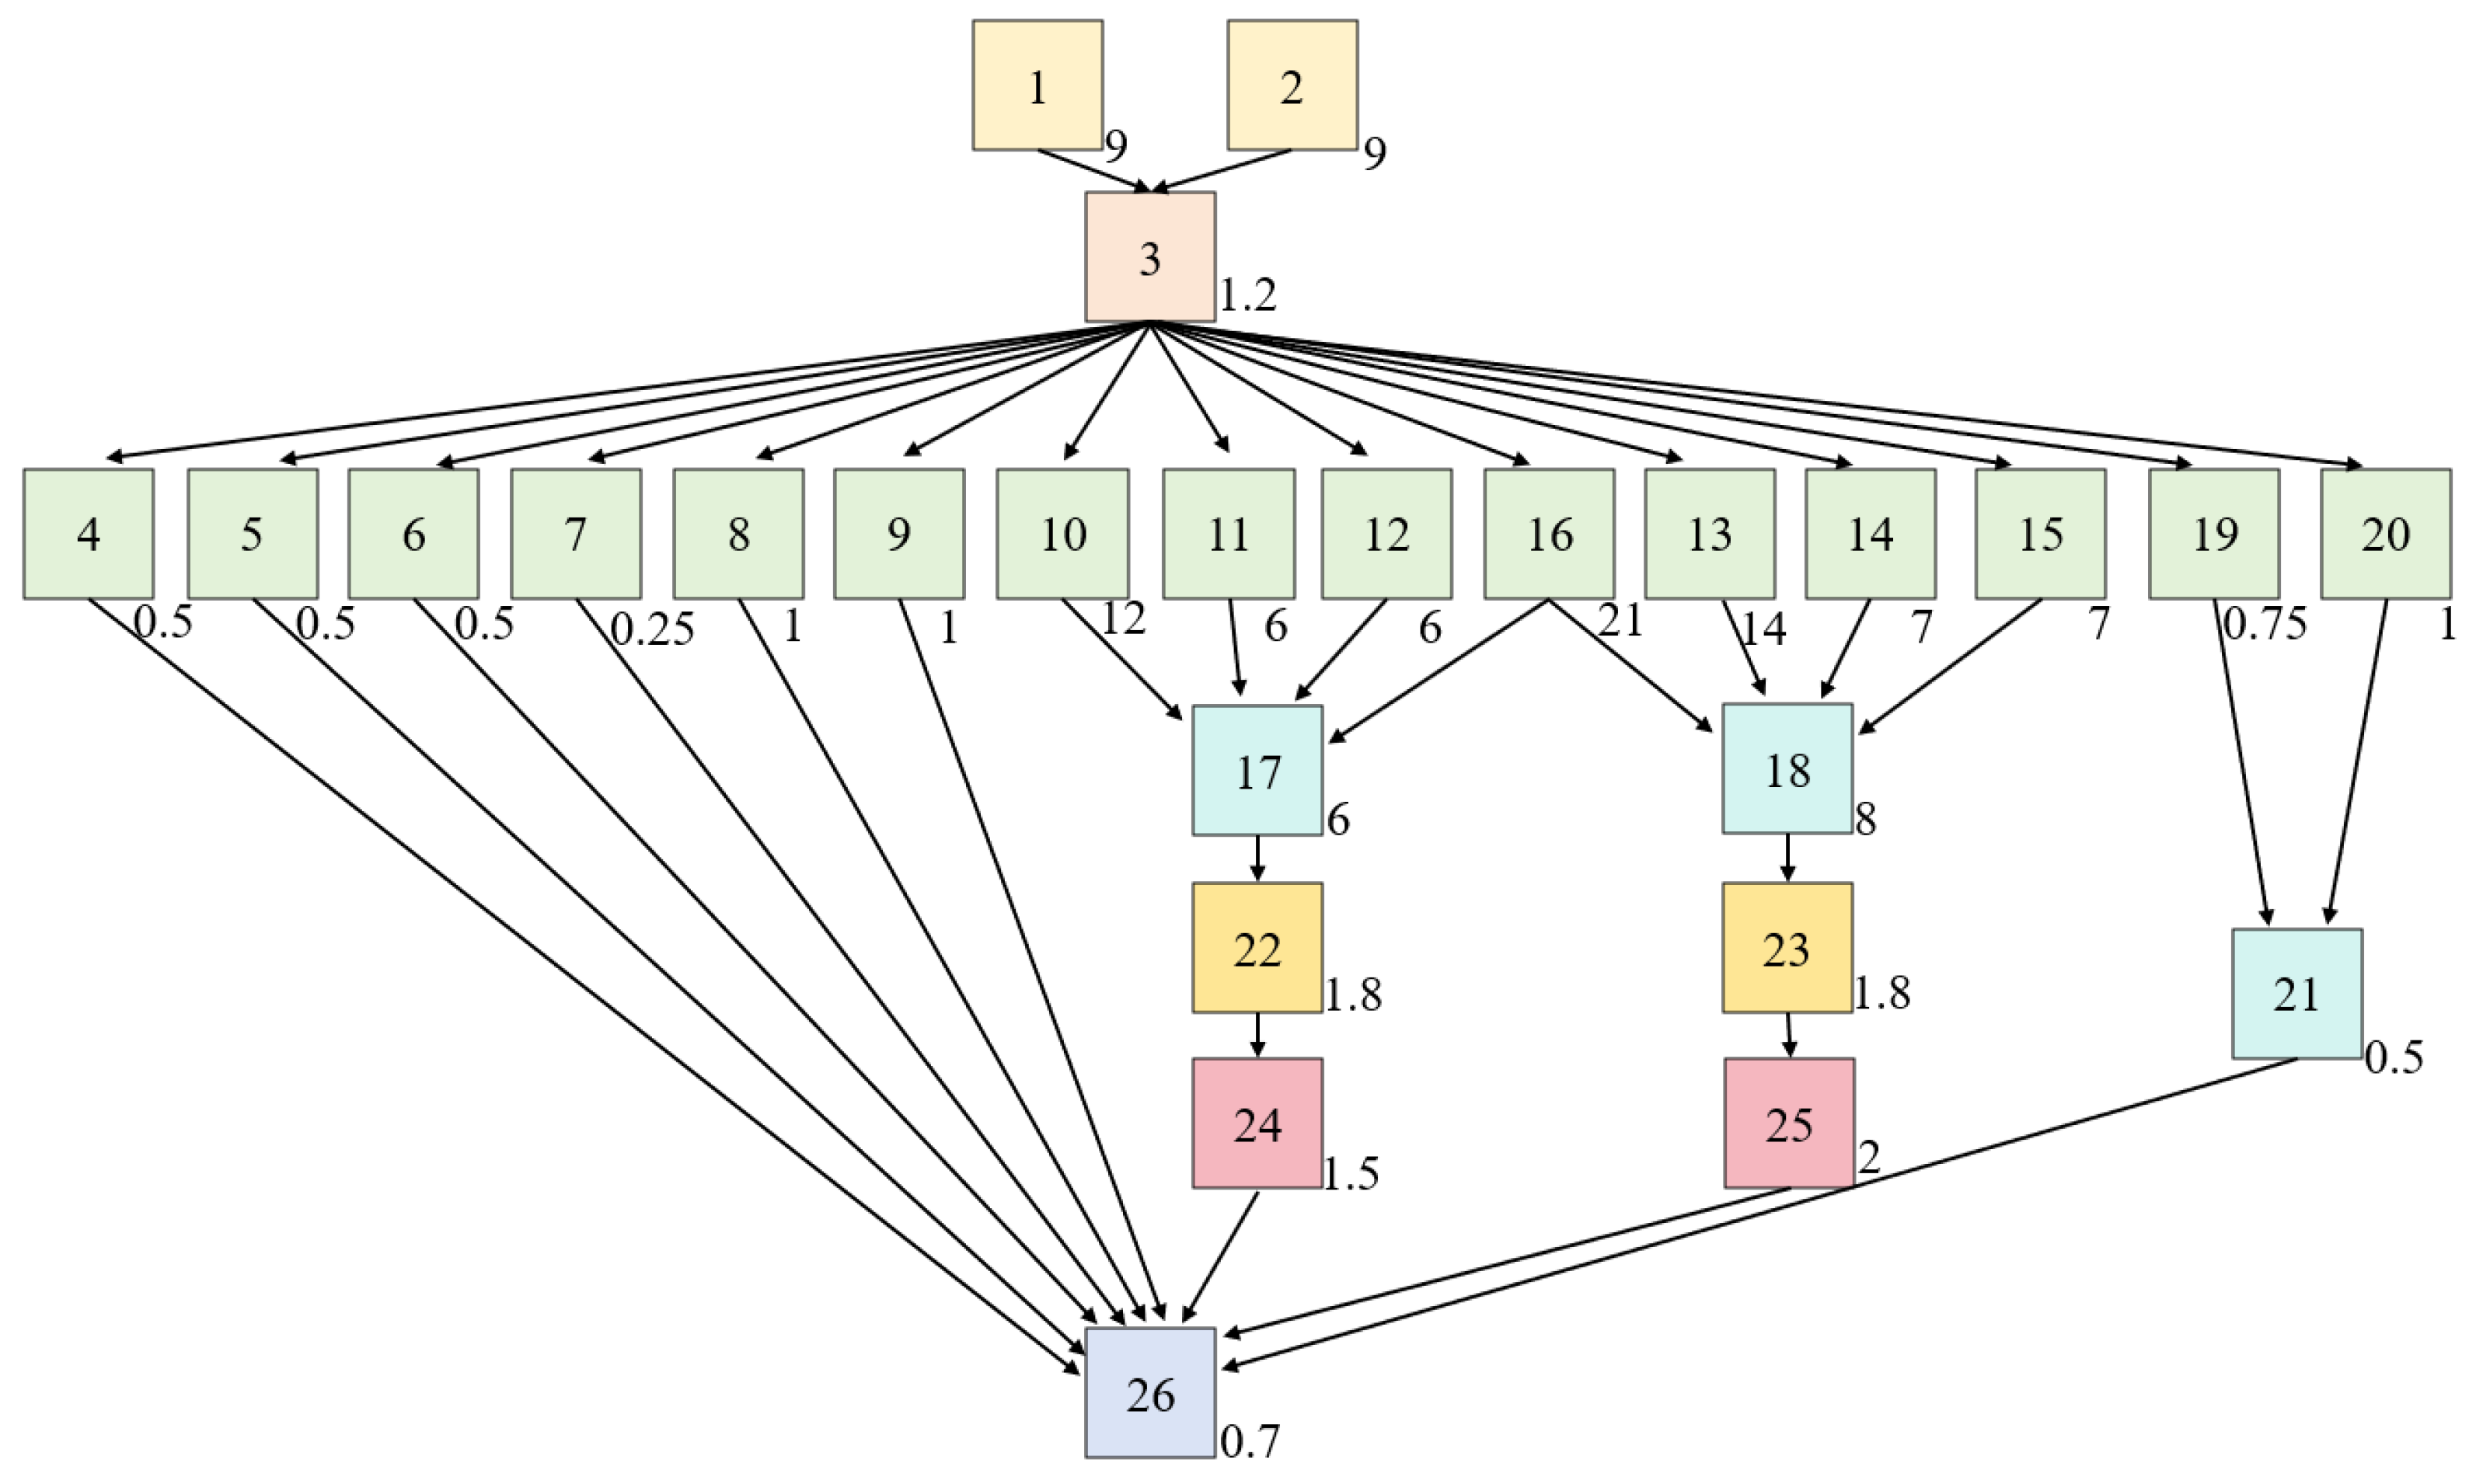
Obviously, battery disassembly needs to be carried out in a certain order of priority. The practical research determines the priority relationships of the battery pack disassembly tasks. These task prioritization relationships are presented in
Figure 3.
Table 1 is the first disassembly task [
31,
32]. The arrows represent the relationship between the immediately preceding and following tasks, with task No.1 being the immediately preceding task of task No.3 and task No.3 being the immediately following task of task No.1. The number in the lower-right corner of the square represents the time required to complete the disassembly task.
3. Multi-Objective Unilateral Disassembly Line Optimization
This section describes unilateral disassembly line task order optimization. The disassembly problem is built on the mathematical model of the traditional disassembly line equilibrium optimization problem. The number of workstations, idle time of workstations, disassembly cost, and minimization of risk value are taken as the optimization objectives under the constraints of satisfying the tight-front–tight-back disassembly relationship, demand beat, and other constraints [
33]. The disassembly assembly line adopts a linear layout. The disassembly method adopts unilateral disassembly [
34]. The model is solved using a novel, improved Northern Goshawk Optimization Algorithm (INGO) and Non-dominated Sorting Genetic Algorithm (NSGA-II) [
35].
3.1. Solution Algorithm
Heuristic algorithms find a set of new solutions by randomly and iteratively finding them from the search space [
36,
37]. For example, the solution string (1-2-4-5-6-7-9-10) in
Figure 4 represents the disassembly sequence. The task sequence needs to be assigned to workstations to form a disassembly line balancing scheme. The scheme comprises the following steps. In the first step, input the generated disassembly task sequence
, the disassembly task number
, and the number of the first workstation
. Assign the assignable disassembly tasks of the current workstation to
,
. In the second step, determine whether the time
corresponding to the task number in the task sequence
is greater than the time limit of the current workstation; if yes, then
, and set the next workstation number is set to
, otherwise
. In the third step, loop the second step until the tasks in the task sequence are fully assigned to the workstations and output the disassembly pipeline solution.
3.1.1. INGO Optimisation Algorithm
The Improved NGO Algorithm (INGO) uses the maximum number of iterations of the algorithm
as the termination condition, and the current number of iterations
as the flag, which is initially set to
, and the algorithm stops when
[
38,
39]. The main idea of the algorithm is described above, and the steps of the improved NGO algorithm are as follows:
Step 0: Set the maximum number of iterations , the population size , and the external archive capacity , and compute the parameter for the combined pair selection and compute the probability parameter for the T1 selection, as well as other problem parameters.
Step 1: Generate an initial disassembly scheme based on the disassembly sequence generation method and the encoding and decoding methods.
Step 2: Apply the proposed discrete recombination operation to optimize the initial disassembly scheme. Select the optimal disassembly scheme based on Pareto domination and the congestion distance calculation.
Step 3: Apply the rules of the predation phase to identify the prey and attack, and update the disassembly sequence again using the optimal disassembly scheme of the current phase.
Step 4: Apply the rules of the chase and escape phases to perform a local search for the solution.
Step 5: Perform Pareto solution computation on the solutions after the local search is completed and save the non-dominated solutions to an external archive; if the external archive is full, filter the archive based on the congestion distance.
Step 6: Perform congestion distance calculations on the solutions in the external archive and update the optimal disassembly scheme.
Step 7: Determine whether the maximum number of iterations is reached. If the termination condition of the main algorithm INGO is reached, output the set of non-dominated solutions; otherwise, return to step 3.
3.1.2. NSGA-II Optimisation Algorithm
NSGA-II employs non-dominated sorting to hierarchically classify solutions based on Pareto dominance, where solution X dominates Y if it equals or exceeds Y on all objectives and surpasses it in at least one [
40]. This stratification process continues until all solutions are ranked. The algorithm maintains diversity through crowding distance computation, preferentially retaining solutions in sparser regions of the objective space. An elite retention strategy combines parent and offspring populations, applying non-dominated sorting and crowding distance to preserve the optimal solutions while ensuring stable evolutionary progress.
3.2. Model Assumptions and Parameter Variables
3.2.1. Model Assumptions
The following modeling assumptions are established:
Battery packs are fully stocked with parts;
Workers at the workstations are capable of completing the dismantling tasks;
Ignore the pause time between disassembly tasks;
Consistent equipment across workstations;
No accidents during disassembly.
3.2.2. Parameter Variables
Parameter Description:
: The collection of disassembly tasks. ,, and indicate the dismantling tasks.
: The collection of workstations. , indicates a workstation.
: The order of disassembly, and indicates the first disassembly.
: The sum of all task execution times for workstation .
: The cost of performing task .
: The sum of all task risk values for a workstation .
: Prioritization relationship matrix representing the disassembled tasks. indicates that task i is prioritized over task for execution. indicates that task has no priority relationship with task .
: The task assignment where task is placed in the disassembly when .
: The longest time in the station or the largest workstation time. .
: The maximum workstation time allowed.
: Disassembled line cost per unit of time, Yen/min.
Decision variables:
: The binary variable indicates whether task is performed. ( if task is executed; otherwise )
: The binary variable indicates the assignment of task to workstation . ( if task is executed; otherwise )
3.3. Optimization Model
The disassembly line balancing problem incorporates three conventional optimization objectives: the number of workstations, workstation idle time, and disassembly cost. Additionally, disassembly risk is introduced as a novel research dimension in this study. The integration of these four optimization objectives enables comprehensive solution optimization. This investigation applies multi-objective optimization theory to address the battery pack disassembly line balancing problem, facilitating balanced optimization across competing objectives.
Minimizing the number of workstations reduces infrastructure and equipment acquisition costs. It avoids unnecessary land occupation and improves the efficiency of space utilization at dismantling sites.
Minimizing idle time balances the work of each workstation, thus increasing the utilization of the disassembly line. The proposed metric significantly minimizes workstation idle periods while ensuring equitable workload distribution among stations, consequently eliminating disparities in task allocation times.
Accidents such as short circuits, fires, and even explosions are likely to occur during the dismantling process of used battery packs. Minimizing the workstation risk value is conducive to reducing the risk of the dismantling process. The total risk value of each workstation increases proportionally with the cumulative risk values of its assigned disassembly tasks.
The cost of dismantling reflects the economic efficiency of the dismantling line. The cost of dismantling includes the cost of dismantling tasks and the operating cost of the dismantling line. The cost of dismantling tasks refers to the cost of dismantling parts, such as workers, equipment, and other costs. The dismantling line operation cost is the cost of energy consumption and other costs incurred during the operation of the dismantling line.
This research employs multi-objective optimization theory to address the disassembly line balancing problem for waste battery packs, achieving balanced optimization across multiple objectives. The mathematical formulation is presented as follows:
Among the constraints, Equation (7) is the beat time constraint, which means that the disassembly time of each workstation is less than or equal to the given cadence time (
). The actual beat time (
) is the maximum value of the disassembly time of all workstations, and the actual cadencet time is less than or equal to the given cadence time. Equation (8) is the task prioritization constraint, which indicates that the disassembly immediately before and immediately after relationship constraints have to be satisfied when assigning disassembly tasks. Equation (9) is the task assignment constraint that all tasks within a workstation must be adjacent, where
denotes the number of elements in the set
of disassembly sequences. Equation (10) is the number of tasks constraint; each workstation has at least one disassembly task, where
denotes the maximum number of workstations.
3.4. Experimental Results
The new INGO algorithm and the conventional NSGA-II algorithm are compared experimentally. For the INGO algorithm, the maximum number of iterations is 300, the population size is 50, the external archive capacity is 30, the parameter for calculating the combined pairwise selection is 0.8, and the probability parameter for calculating the T1 selection is 0.6. For the NSGA-II algorithm, the upper limit of the non-dominated solution archive is set to 30, the maximum number of iterations is taken to be 300, the crossover probability is taken to be 0.8, the variance probability is taken to be 0.1, and the population size is 50.
The optimal set of disassembly order solutions is derived from these algorithms. In order to find the optimal disassembly solution as much as possible, the optimal solutions obtained by the two algorithms are compared, and the optimal solutions of each of the algorithms are listed in the table, with each objective function’s minimal value bolded. From
Table 6, it can be seen that the disassembly solution obtained by the INGO algorithm is better than the disassembly solution obtained by the NSGA-II algorithm.
The three disassembly scenarios derived from the INGO algorithm, as well as the original factory scenario, were analyzed. The disassembly sequence is shown in
Figure 5. The arrows represent the sequence of disassembling the workstations.
The three disassembly configurations generated by our optimization algorithm consistently outperform the original scheme, delivering substantially reduced equipment idle time, significantly improved safety performance, and markedly lower operating costs across all evaluation metrics. These optimized alternatives offer decision-makers greater flexibility in implementation planning.
3.5. Visualization of the Effects of Programme Optimization
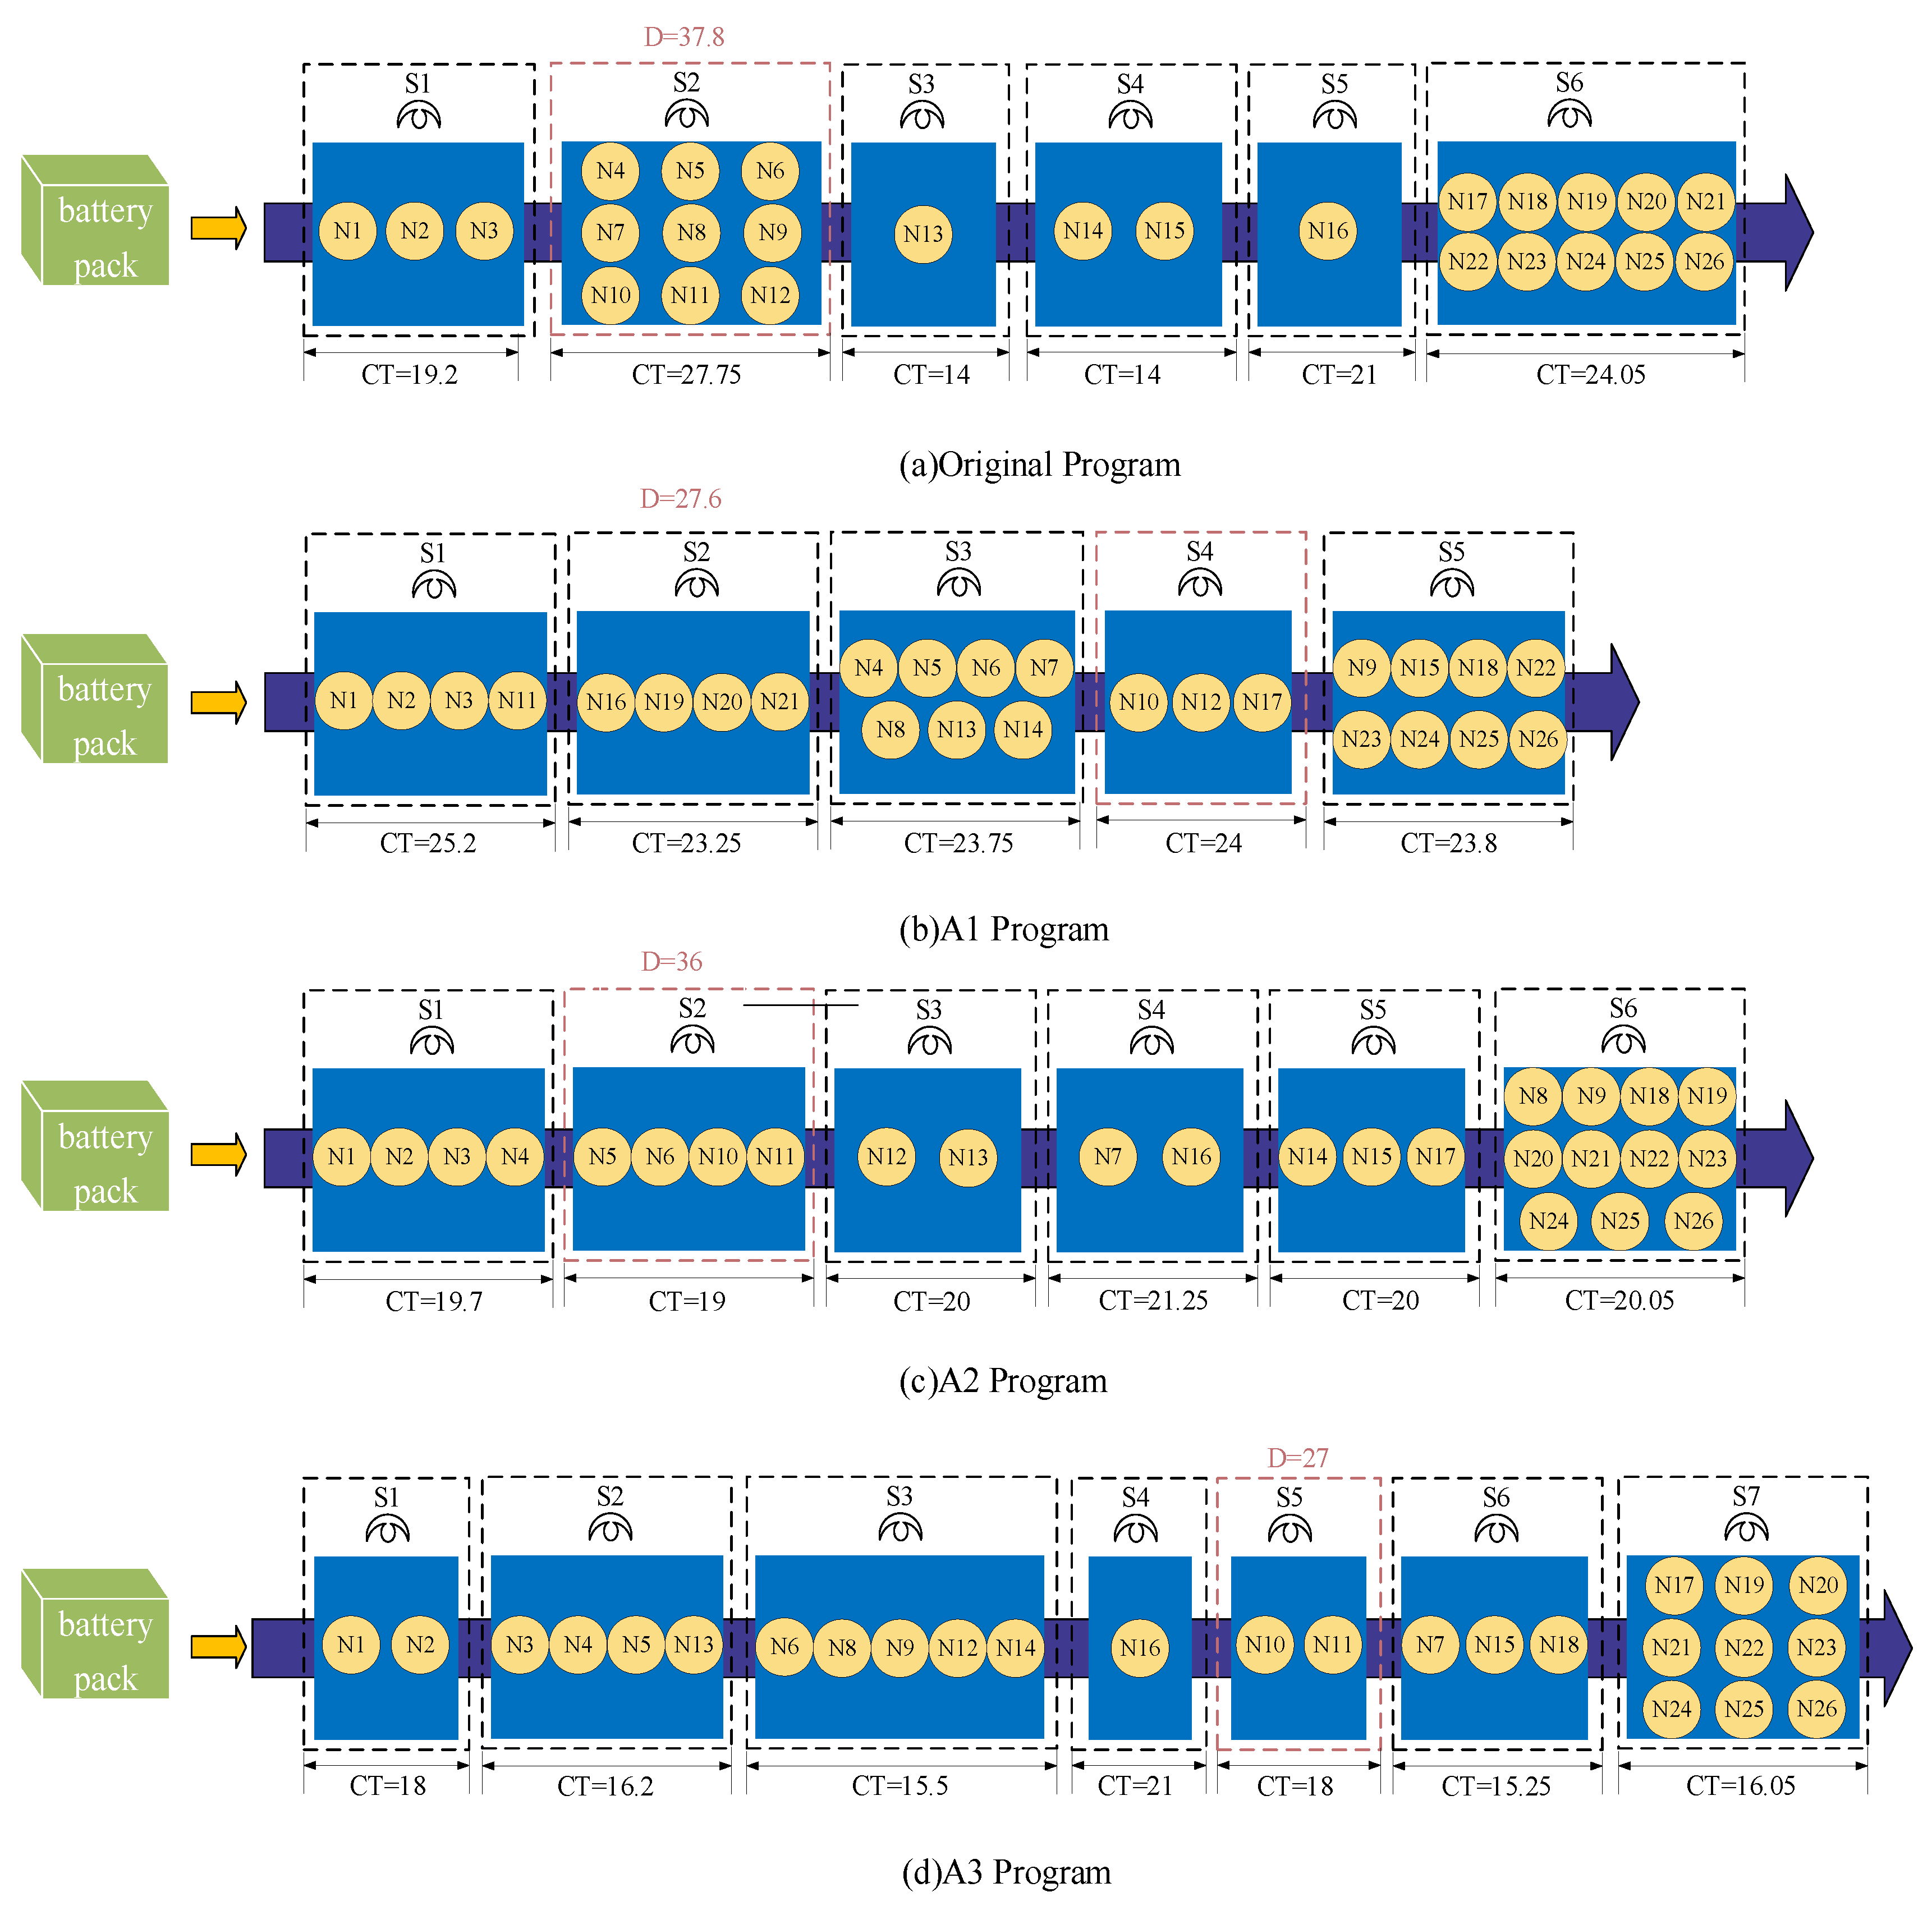
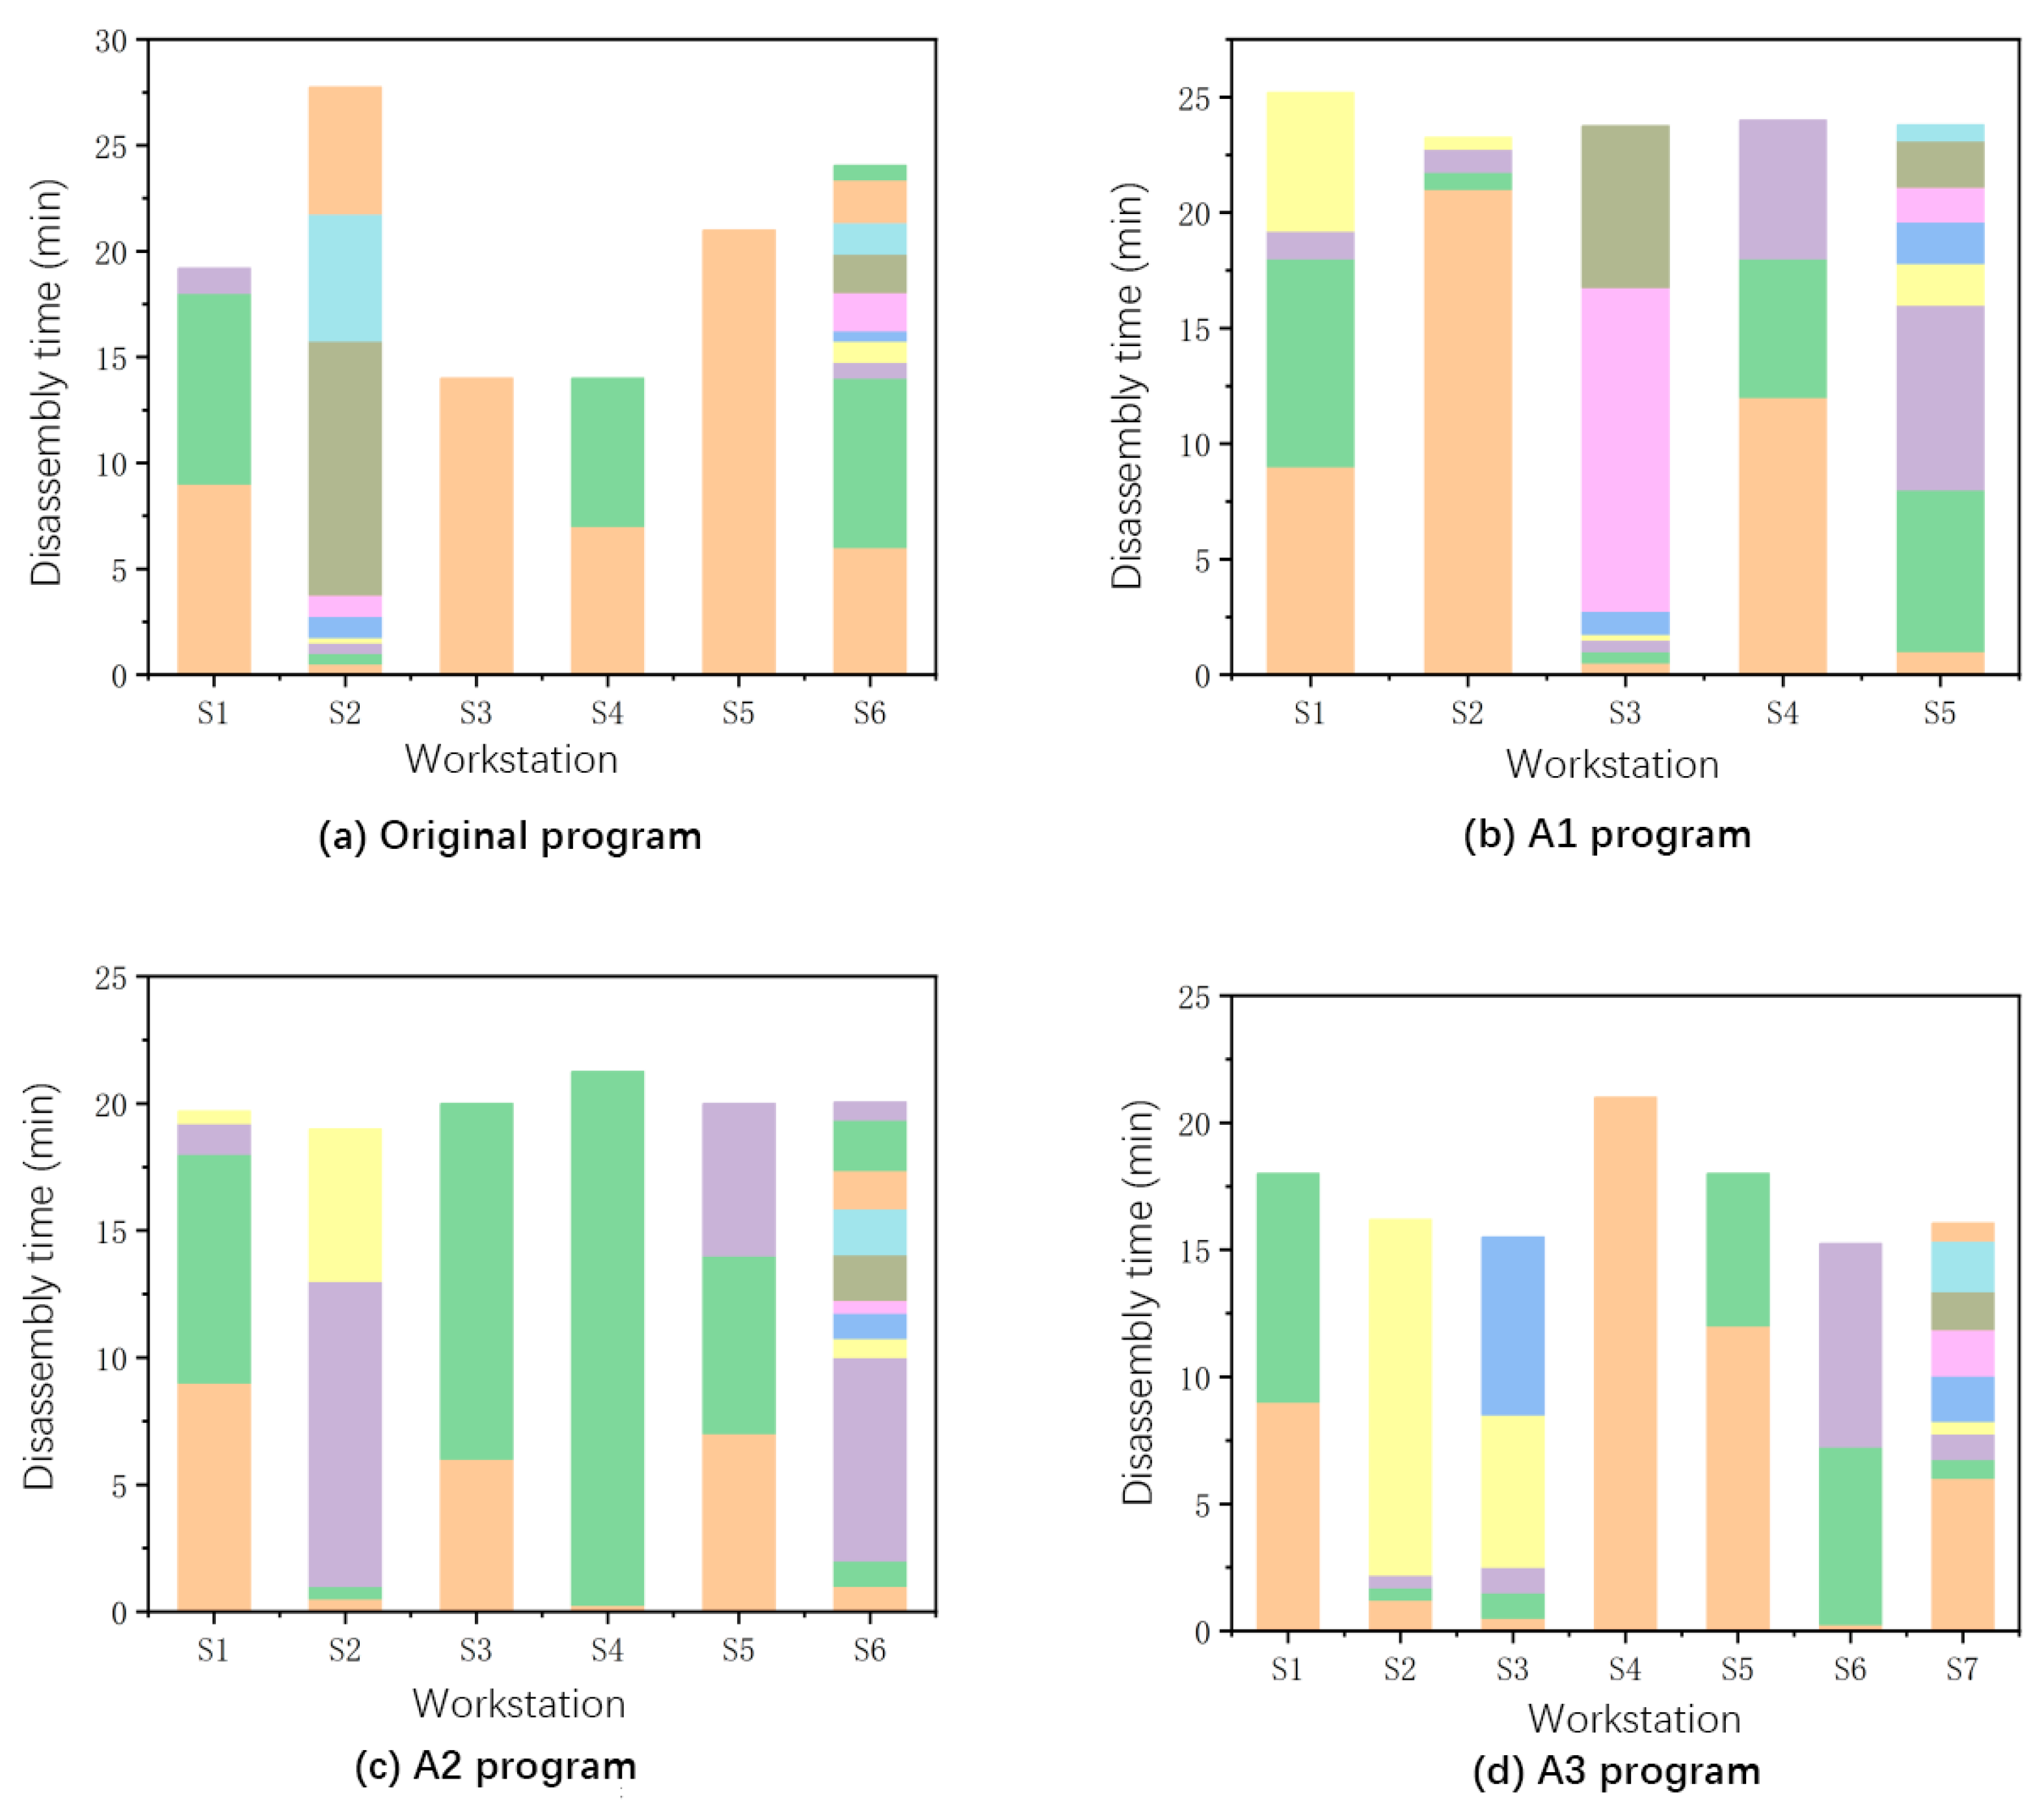
The disassembly times at each workstation for different schemes are shown in
Figure 6, where each color represents the time required to complete a disassembly task. Through a comparative analysis of the original scheme and optimized schemes A1, A2, and A3 in
Figure 6, it is evident that all three optimized schemes demonstrate significant improvements in disassembly line balancing. Specifically, the original scheme exhibits a noticeable cycle time imbalance, where certain workstations (S3, S4) become bottlenecks due to task congestion while others (S1, S2) show considerable idle time. In contrast, the optimized schemes achieve more balanced operational durations across workstations through task reallocation and process improvements.
4. Symmetric Bilateral Disassembly Line Optimization
This section is based on the mathematical model of the disassembly line’s balance optimization problem in the previous chapter. The constraints are tight-front and tight-back disassembly relationships, demand beats, and so on. The optimization objectives are the number of workstations, workstation smoothness, disassembly cost, and risk value minimization. The disassembly assembly line adopts a linear layout. The disassembly method adopts bilateral disassembly. The mutual interference between disassembly tasks is considered. A symmetric bilateral parallel multi-objective disassembly line balance problem mathematical model is established. The INGO and NSGA-II algorithms are used to solve the model.
4.1. Model Description
The dismantling information, model assumptions, and variable parameters of the mathematical model for the optimization of the symmetric bilateral dismantling line for the electric vehicle used batteries have been covered above. The symmetric bilateral model’s featured variables are listed as shown below:
: The collection of workstations.
: Left side of the workstation.
: Right side of the workstation.
: Sum of all task execution times on the left side of the workstation .
: Sum of all task execution times on the right side of the workstation .
: Sum of the risk values of all tasks on the left side of a workstation .
: Sum of all task risk values on the right side of a workstation .
4.2. Optimization Model
For comparison purposes, this chapter constructs a bilateral symmetric dismantling model based on the unilateral model to ensure consistency of the variables throughout the text.
In the case of symmetric bilateral dismantling lines, minimizing the number of workstations also reduces the expenditure of resources and space. Therefore, the number of workstations should also be reduced during the actual operation of the symmetric bilateral dismantling line.
Minimizing idle time similarly balances the work of each workstation in a bilateral disassembly line. Metrics optimization improves the utilization of the disassembly line and avoids an unbalanced distribution of disassembly tasks among workstations, which, in turn, improves productivity. The idle time is calculated in parallel for each workstation on one side of a symmetric bilateral disassembly line. A workstation is divided into left and right sides. Equation (12) keeps both
and
on the left and right sides of a workstation as close to the overall beat time as possible, thus minimizing disassembly idle time.
Minimizing the value at risk is equally beneficial in reducing the risk of the disassembly process in a symmetric bilateral disassembly line. The greater the total risk value of the disassembly tasks within each workstation, the greater the total workstation risk value. The value at risk for each workstation in a symmetric bilateral disassembly line is calculated in parallel.
The cost of a symmetric bilateral disassembly line is shown in Equation (14).
In summary, the mathematical model for multi-objective optimization of symmetric bilateral disassembly lines is established, as shown in Equation (15).
In a symmetric bilateral disassembly line, the constraints are essentially the same as for unilateral disassembly. However, planning occurs when there is no task on one side of the operating point, and the workstation doubling requirement is greater than or equal to the number of tasks. Therefore, Equation (16) is the number of workstations’ constraint, which ensures that a workstation has both left and right operation points for simultaneous disassembly.
4.3. Experimental Results
This section also uses the INGO and NSGA-II algorithms for modeling. Comparing the optimal solutions obtained by the two algorithms, the optimal solutions for each of the algorithms are listed in
Table 7. The minimal values of each objective function are bolded. It can be seen that the disassembly scheme derived by the INGO algorithm is, overall, better than the disassembly scheme derived by the NSGA-II algorithm.
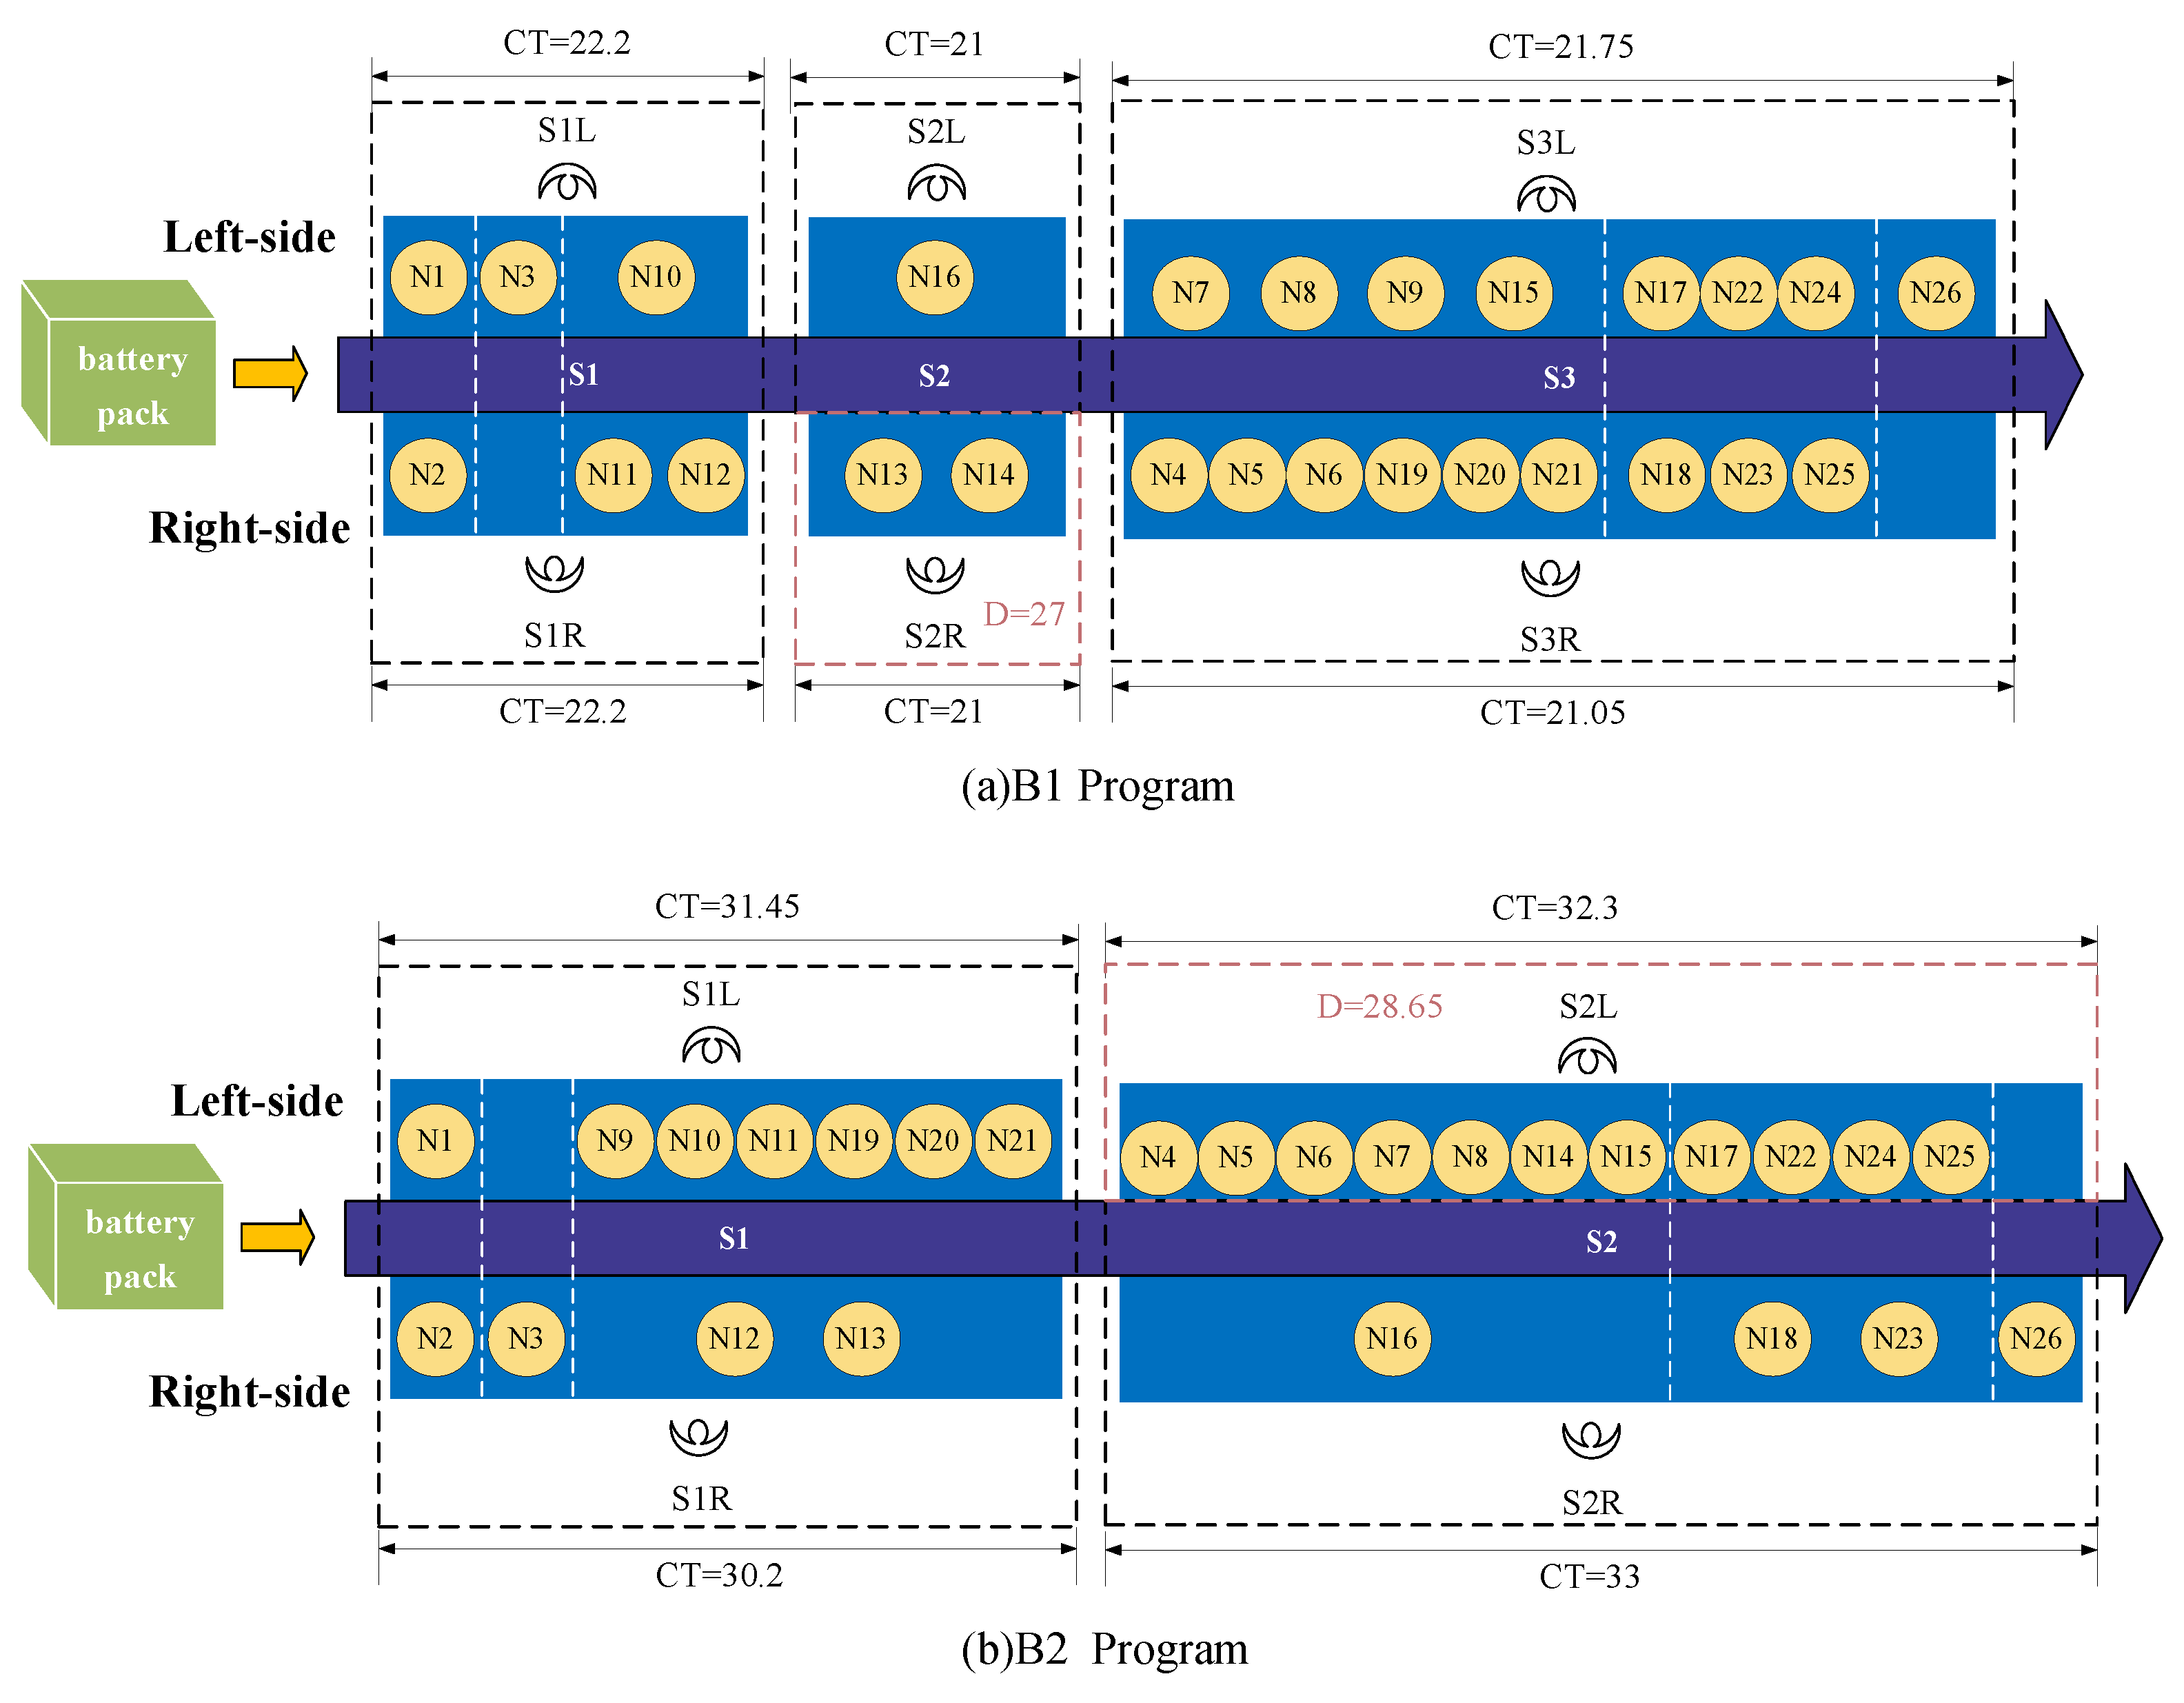
Two disassembly schemes derived from the INGO algorithm as well as the original plant scheme, were analyzed. The disassembly sequence is shown in
Figure 7.
The INGO algorithm solves the symmetric bilateral disassembly scheme for both kinds of metrics to obtain an overall better performance than the unilateral disassembly scheme. In addition, for symmetric double-disassembly lines, the unilateral idle time is less and more secure. The two layouts also give decision-makers more options to choose from.
4.4. Visualization of the Effects of Program Optimization
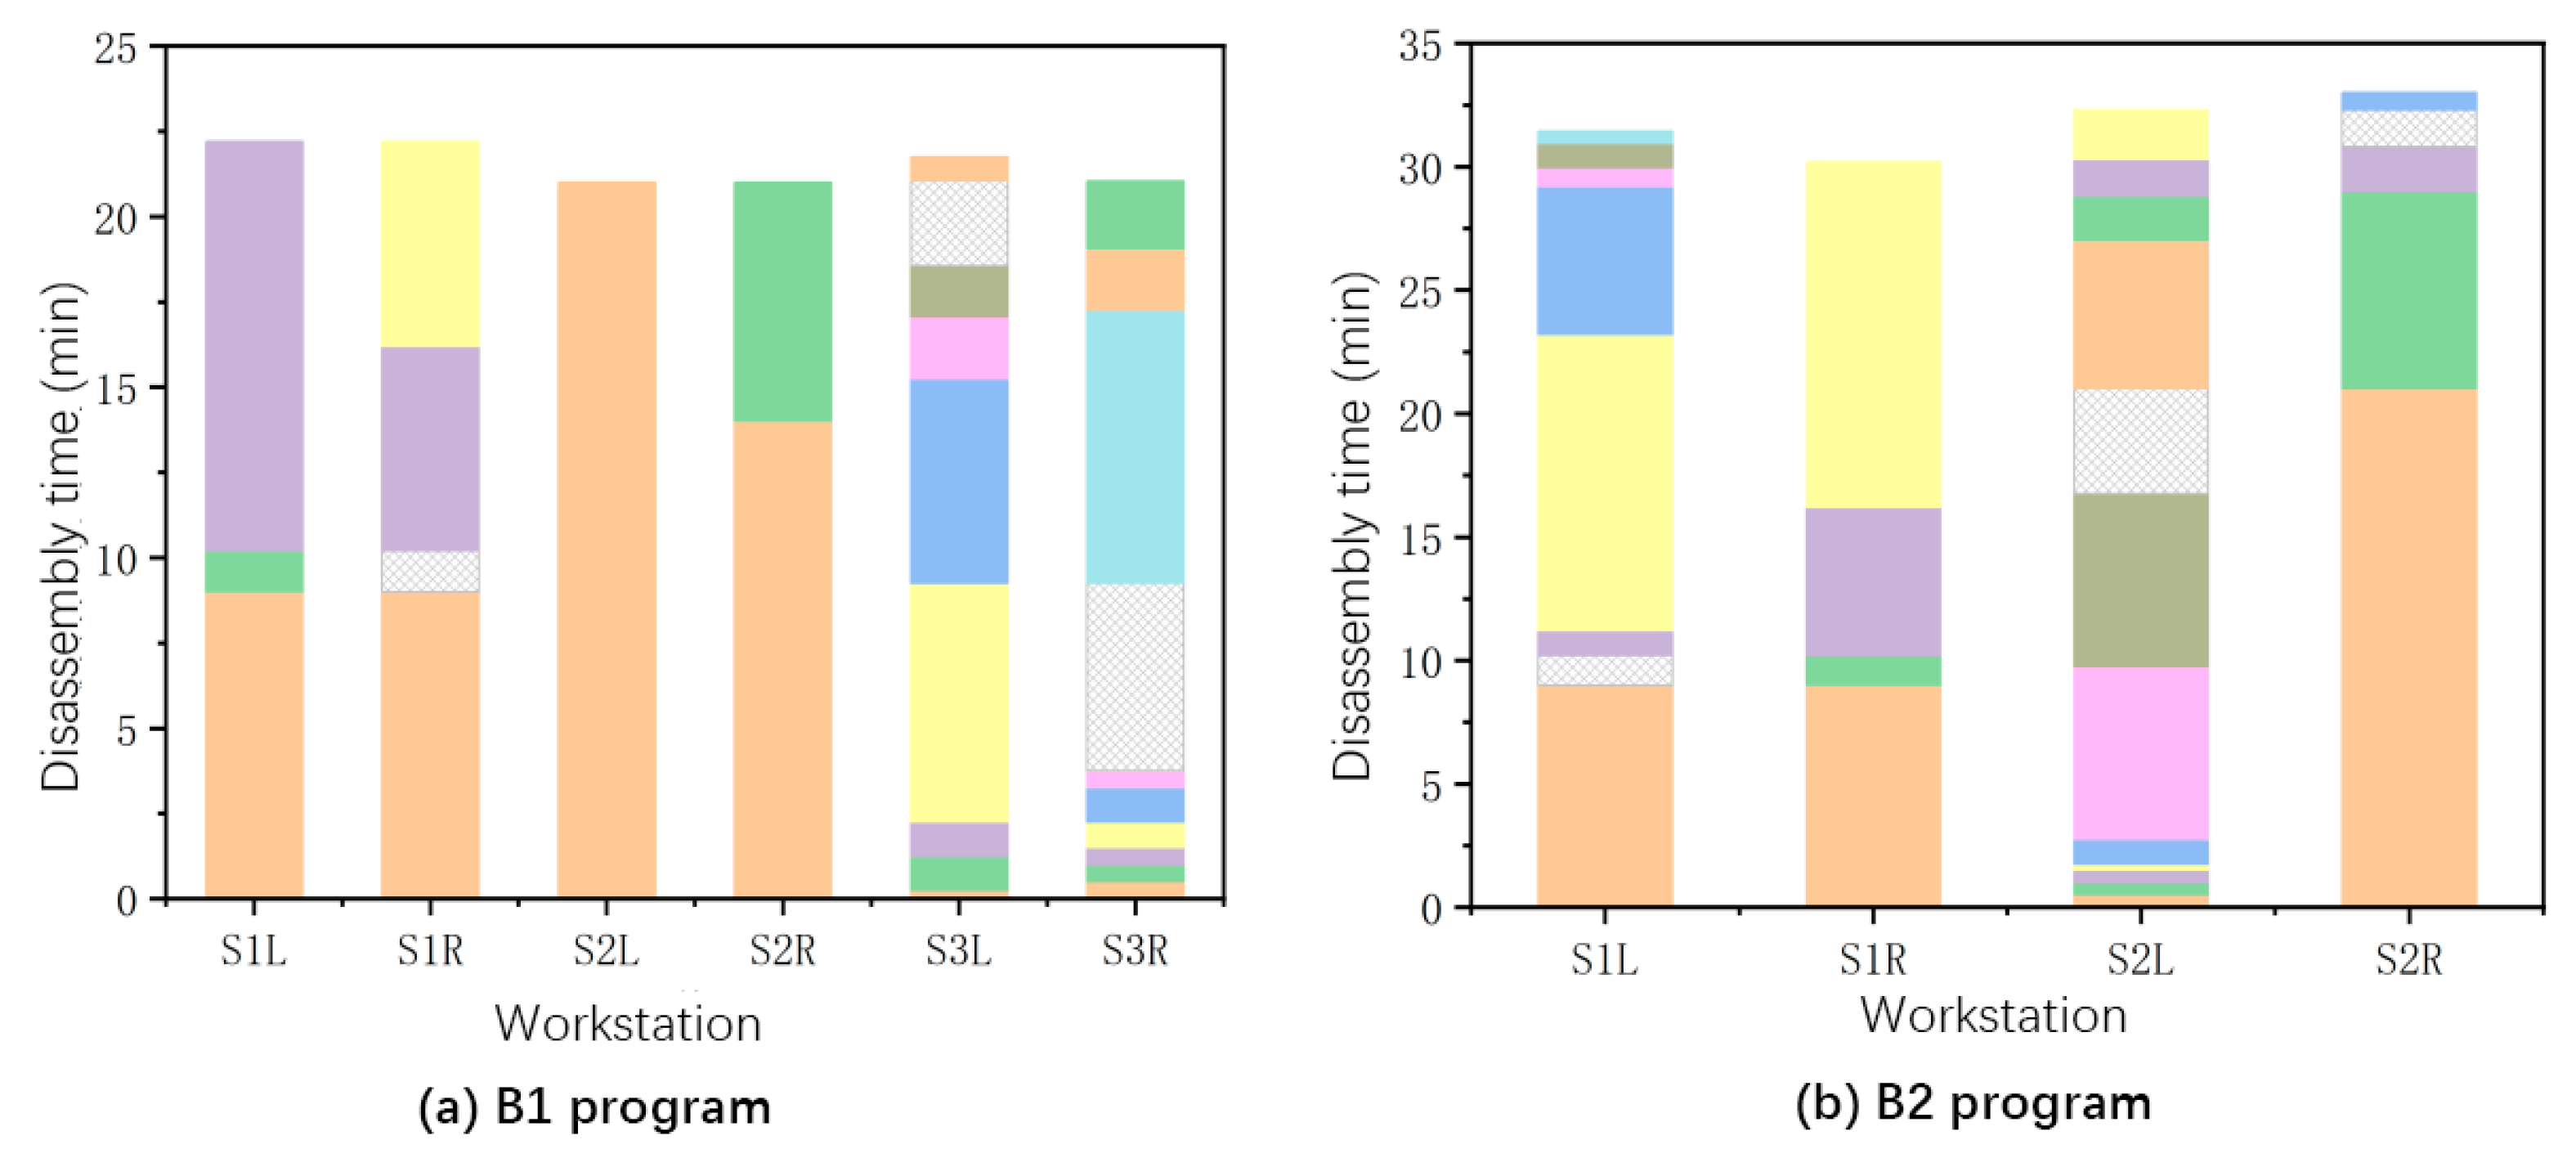
The operating times for each workstation for the different disassembly line scenarios are shown in
Figure 8. Each color in the figure represents the time required to complete a disassembly task. The efficiency of the symmetric bilateral disassembly line model can be found in two key areas. First, the adoption of a left/right symmetrical workstation design enables simultaneous bilateral disassembly of products. This architectural design significantly reduces the total number of workstations compared to traditional single-sided models while maintaining balanced task distribution across workstations. Second, while preserving consistent production task time, this model effectively reduces a workstation’s idle time through coordinated bilateral operations. The left and right workstations can simultaneously process symmetrical components of the products, which not only simplifies the operational procedures but also substantially increases the overall disassembly speed. This design retains the task time control advantages of single-sided models while achieving higher efficiency through parallel processing.
4.5. Evaluation of Results
A linear weighting method was used to evaluate the optimal solution. The steps are as follows:
Dimensionless of the target value. It is known that there are
objective functions and
Pareto solutions. Let the objective function value of the set of Pareto solutions be
, and the dimensionless yields a data matrix of
. The formula is as in Equation (17).
In Equation (17), , ; denotes the maximum value of the objective function of the th, and denotes the minimum value of the objective function of the th.
Determining the weighting of objectives. Set the weight vector , where . Depending on the preference of the decision maker, take , , , .
Calculation of the composite assessment value. The formula is calculated as in Equation (18).
The
in Equation (18) is the combined evaluation value of the ith solution. Take
. Schemes
are evaluated, and the computational results are shown in
Table 8. Solving yields the solution with the highest evaluation value
, which corresponds to the symmetric bilateral scheme
.
The optimized symmetric bilateral disassembly line shortens the length of the disassembly line layout, which can effectively improve the space utilization rate of the disassembly workshop. The new layout makes the dismantling process more standardized and improves the overall dismantling efficiency. The setup of the program also considers the safety of the dismantling process, and the risk value of each workstation is reduced. The arrangement of the dismantling line is more scientific and reasonable. The program helps the enterprise to reduce the dismantling cost and improve the overall efficiency of the company. The program will also generate considerable benefits for the new energy vehicle battery recycling supply chain and ecological protection.
5. Empirical Simulation
The optimization study of the layout of the battery pack disassembly line in the FA company was carried out above, and the theoretically feasible unilateral and bilateral optimal solutions were given. However, it is necessary to verify whether the optimized scheme can achieve the research purpose in the actual disassembly. To validate the effectiveness of the optimized solutions, Plant Simulation 2302 software was employed to model and simulate three distinct scenarios: the original dismantling line configuration, the optimized unilateral scheme, and the optimized bilateral scheme implemented in the FA Company’s dismantling workshop. A comparative analysis of workstation utilization rates and system throughput capacities across these three configurations was conducted to evaluate solution performance.
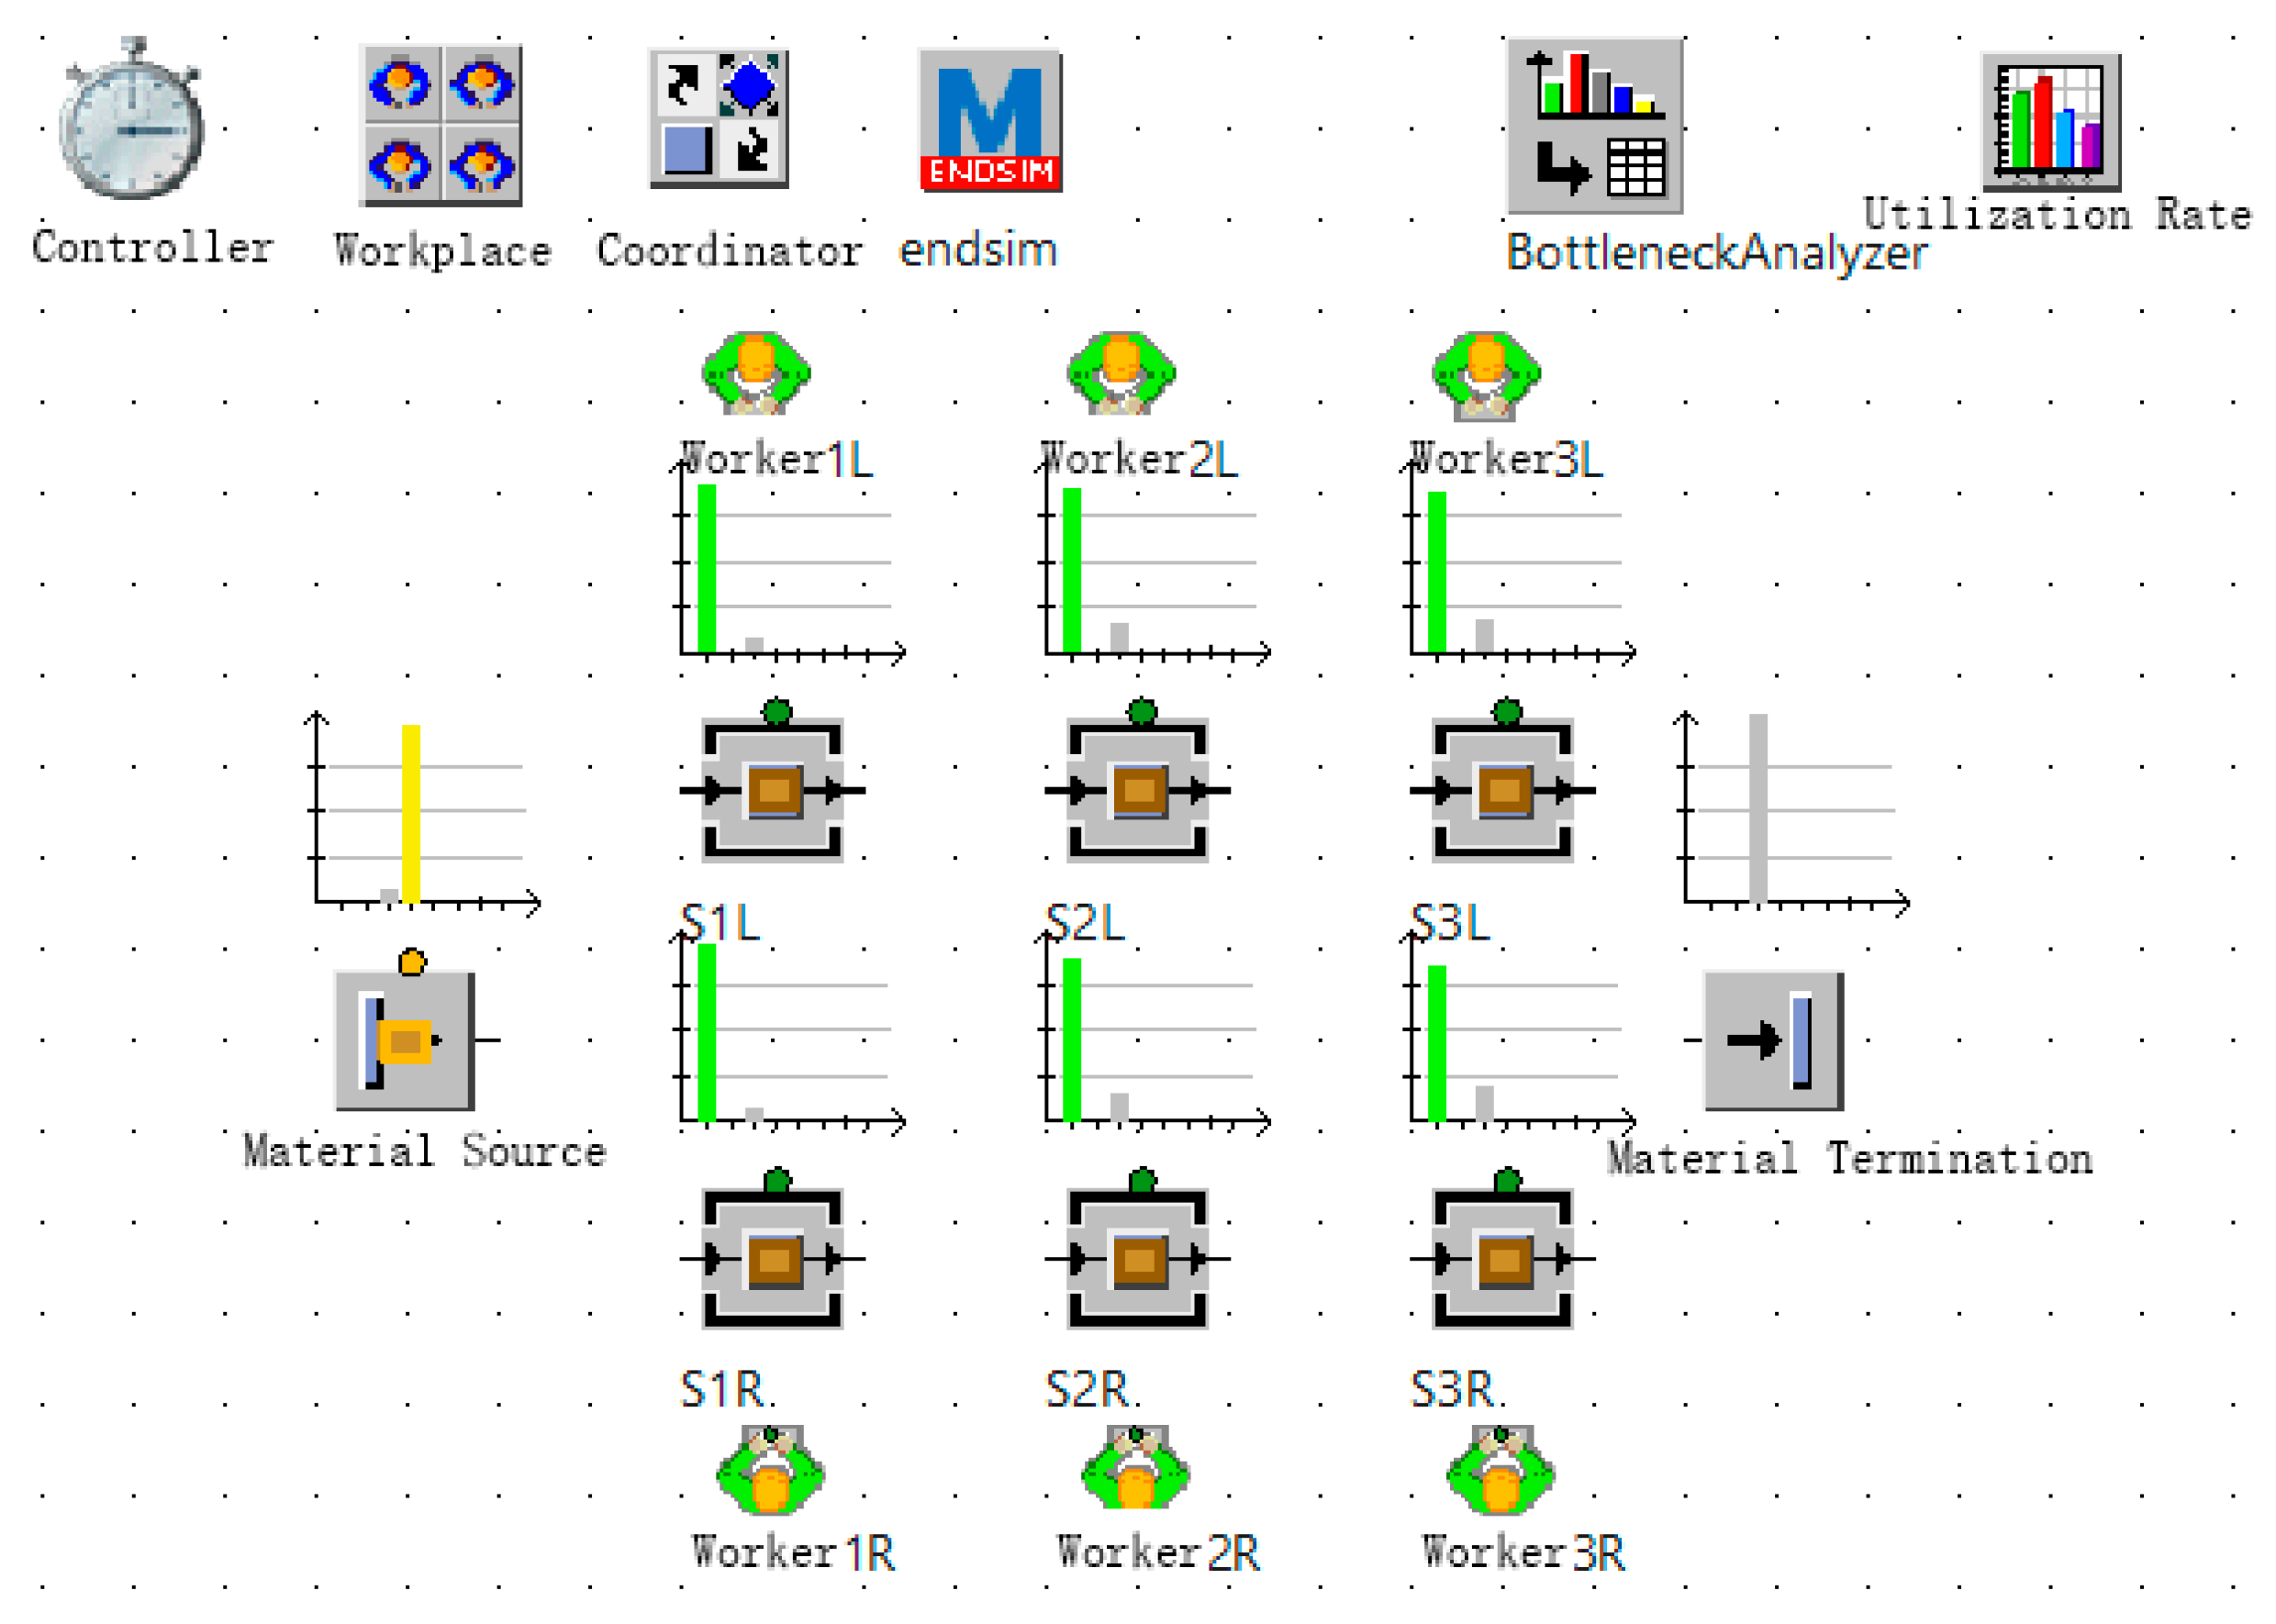
Simulation models were developed for three distinct configurations: the original baseline scheme, the optimized unilateral scheme, and the symmetrically optimized bilateral scheme. The disassembly workstations at the bottom are arranged according to the actual disassembly process. The statistical analysis tool at the top was used to record and display the operation data of each workstation in real time. After the model was built, the simulation model was run, the simulation time was set to 8 h, and the discharging time was set to 20 min. The results of the utilization of each workstation on the disassembly line are shown in
Figure 9,
Figure 10 and
Figure 11. In the figure, green indicates that the workstation is in operation, yellow indicates that the workpiece is blocked, and gray indicates that it is waiting.
The running results of the disassembly line throughput are shown in
Table 9. The throughputs of the optimized unilateral and bilateral schemes are significantly higher compared to the original scheme. The throughput of the symmetric bilateral optimal scheme is greater than that of the unilateral optimal scheme.
The 8 h simulation results show that the optimized unilateral and symmetric bilateral dismantling schemes have significantly improved productivity and workstation utilization efficiency. The capacity of the whole dismantling system increased by 23.08% and 38.46%, respectively, after optimization. The optimized unilateral and symmetric bilateral dismantling schemes can provide a reference for the layout of dismantling lines in enterprises.
6. Conclusions
The current research focuses on the optimization of dismantling lines for used battery packs from electric vehicles with practical case implementation and simulation analysis. This study constructs a disassembly model and selects an appropriate optimization method to establish a theoretical foundation for the optimization of used battery pack disassembly lines. By applying the empirical simulation model built using Plant Simulation software, this paper verifies the reasonableness of the proposed unilateral and symmetrical bilateral dismantling line solutions. Combining the optimized scheme with the actual situation of FA’s dismantling enterprise of used automobile battery packs, the following optimization suggestions are recommended, aiming to help battery pack dismantling enterprises realize more efficient operation and stronger security.
- (1)
Optimization of the dismantling line layout: Enterprises can reasonably optimize the dismantling line layout according to their own production demand and resource allocation based on the unilateral and symmetrical bilateral dismantling line schemes.
- (2)
Strengthening safety management: Ensure the safety of dismantling operations and reduce the risk of workers’ operations. Enterprises should comprehensively strengthen safety management measures and improve the standardization of operations to ensure that each worker operates efficiently in a safe environment.
These results highlight the advantages of disassembly process scheduling based on optimization algorithms in improving disassembly efficiency and controlling risk levels. Additionally, this study examines the impact of system layout planning by comparing the disassembly efficiency between unilateral and symmetrical bilateral layouts.
This research also has some limitations. This study is based on idealized conditions and does not consider factors such as equipment failure or operator fatigue. The simulation model assumed operation in a steady state and did not consider potential disturbances. Future research should incorporate these real-world variables to develop more robust optimization strategies. Due to the limitations of the current stage, manual disassembly is considered in this paper. Furthermore, this paper focuses on the dismantling of only one type of battery. Subsequent research could consider applying computer deep learning, automation, and image recognition techniques to battery dismantling so as to cope with different types of battery dismantling and improve the generalizability of the research methodology.
There are still research directions that can be expanded. Future research could explore the application of automation technologies and artificial intelligence in disassembly processes. For instance, AI algorithms can be employed to predict maintenance needs or optimize workflows dynamically. Additionally, extending the model to include factors such as operator fatigue, part variability, and unexpected equipment failures would provide a more comprehensive understanding of disassembly line optimization.


