
Compiler Identification with Divisive Analysis and Support Vector Machine


Abstract
1. Introduction
2. Related Works
2.1. Related Works Using Traditional Machine Learning Frameworks
2.2. Related Works Using Deep Learning Frameworks
3. Materials and Methods
3.1. Materials
3.2. Methods
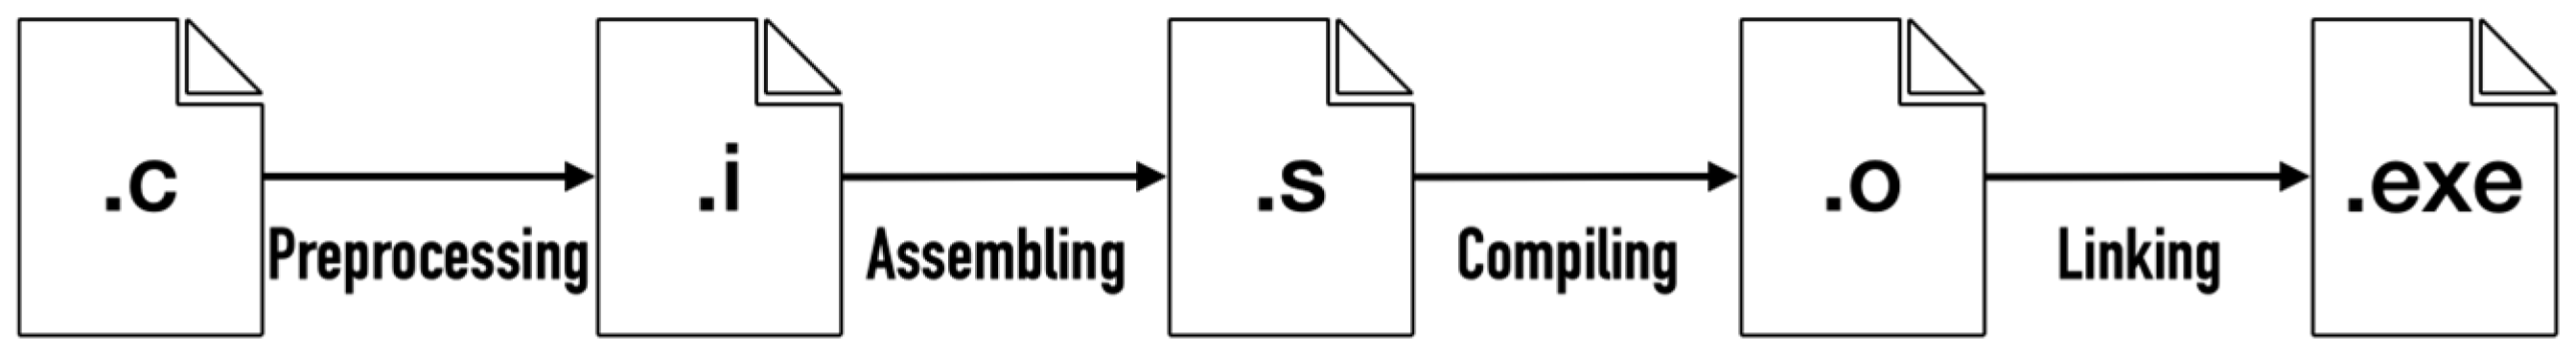
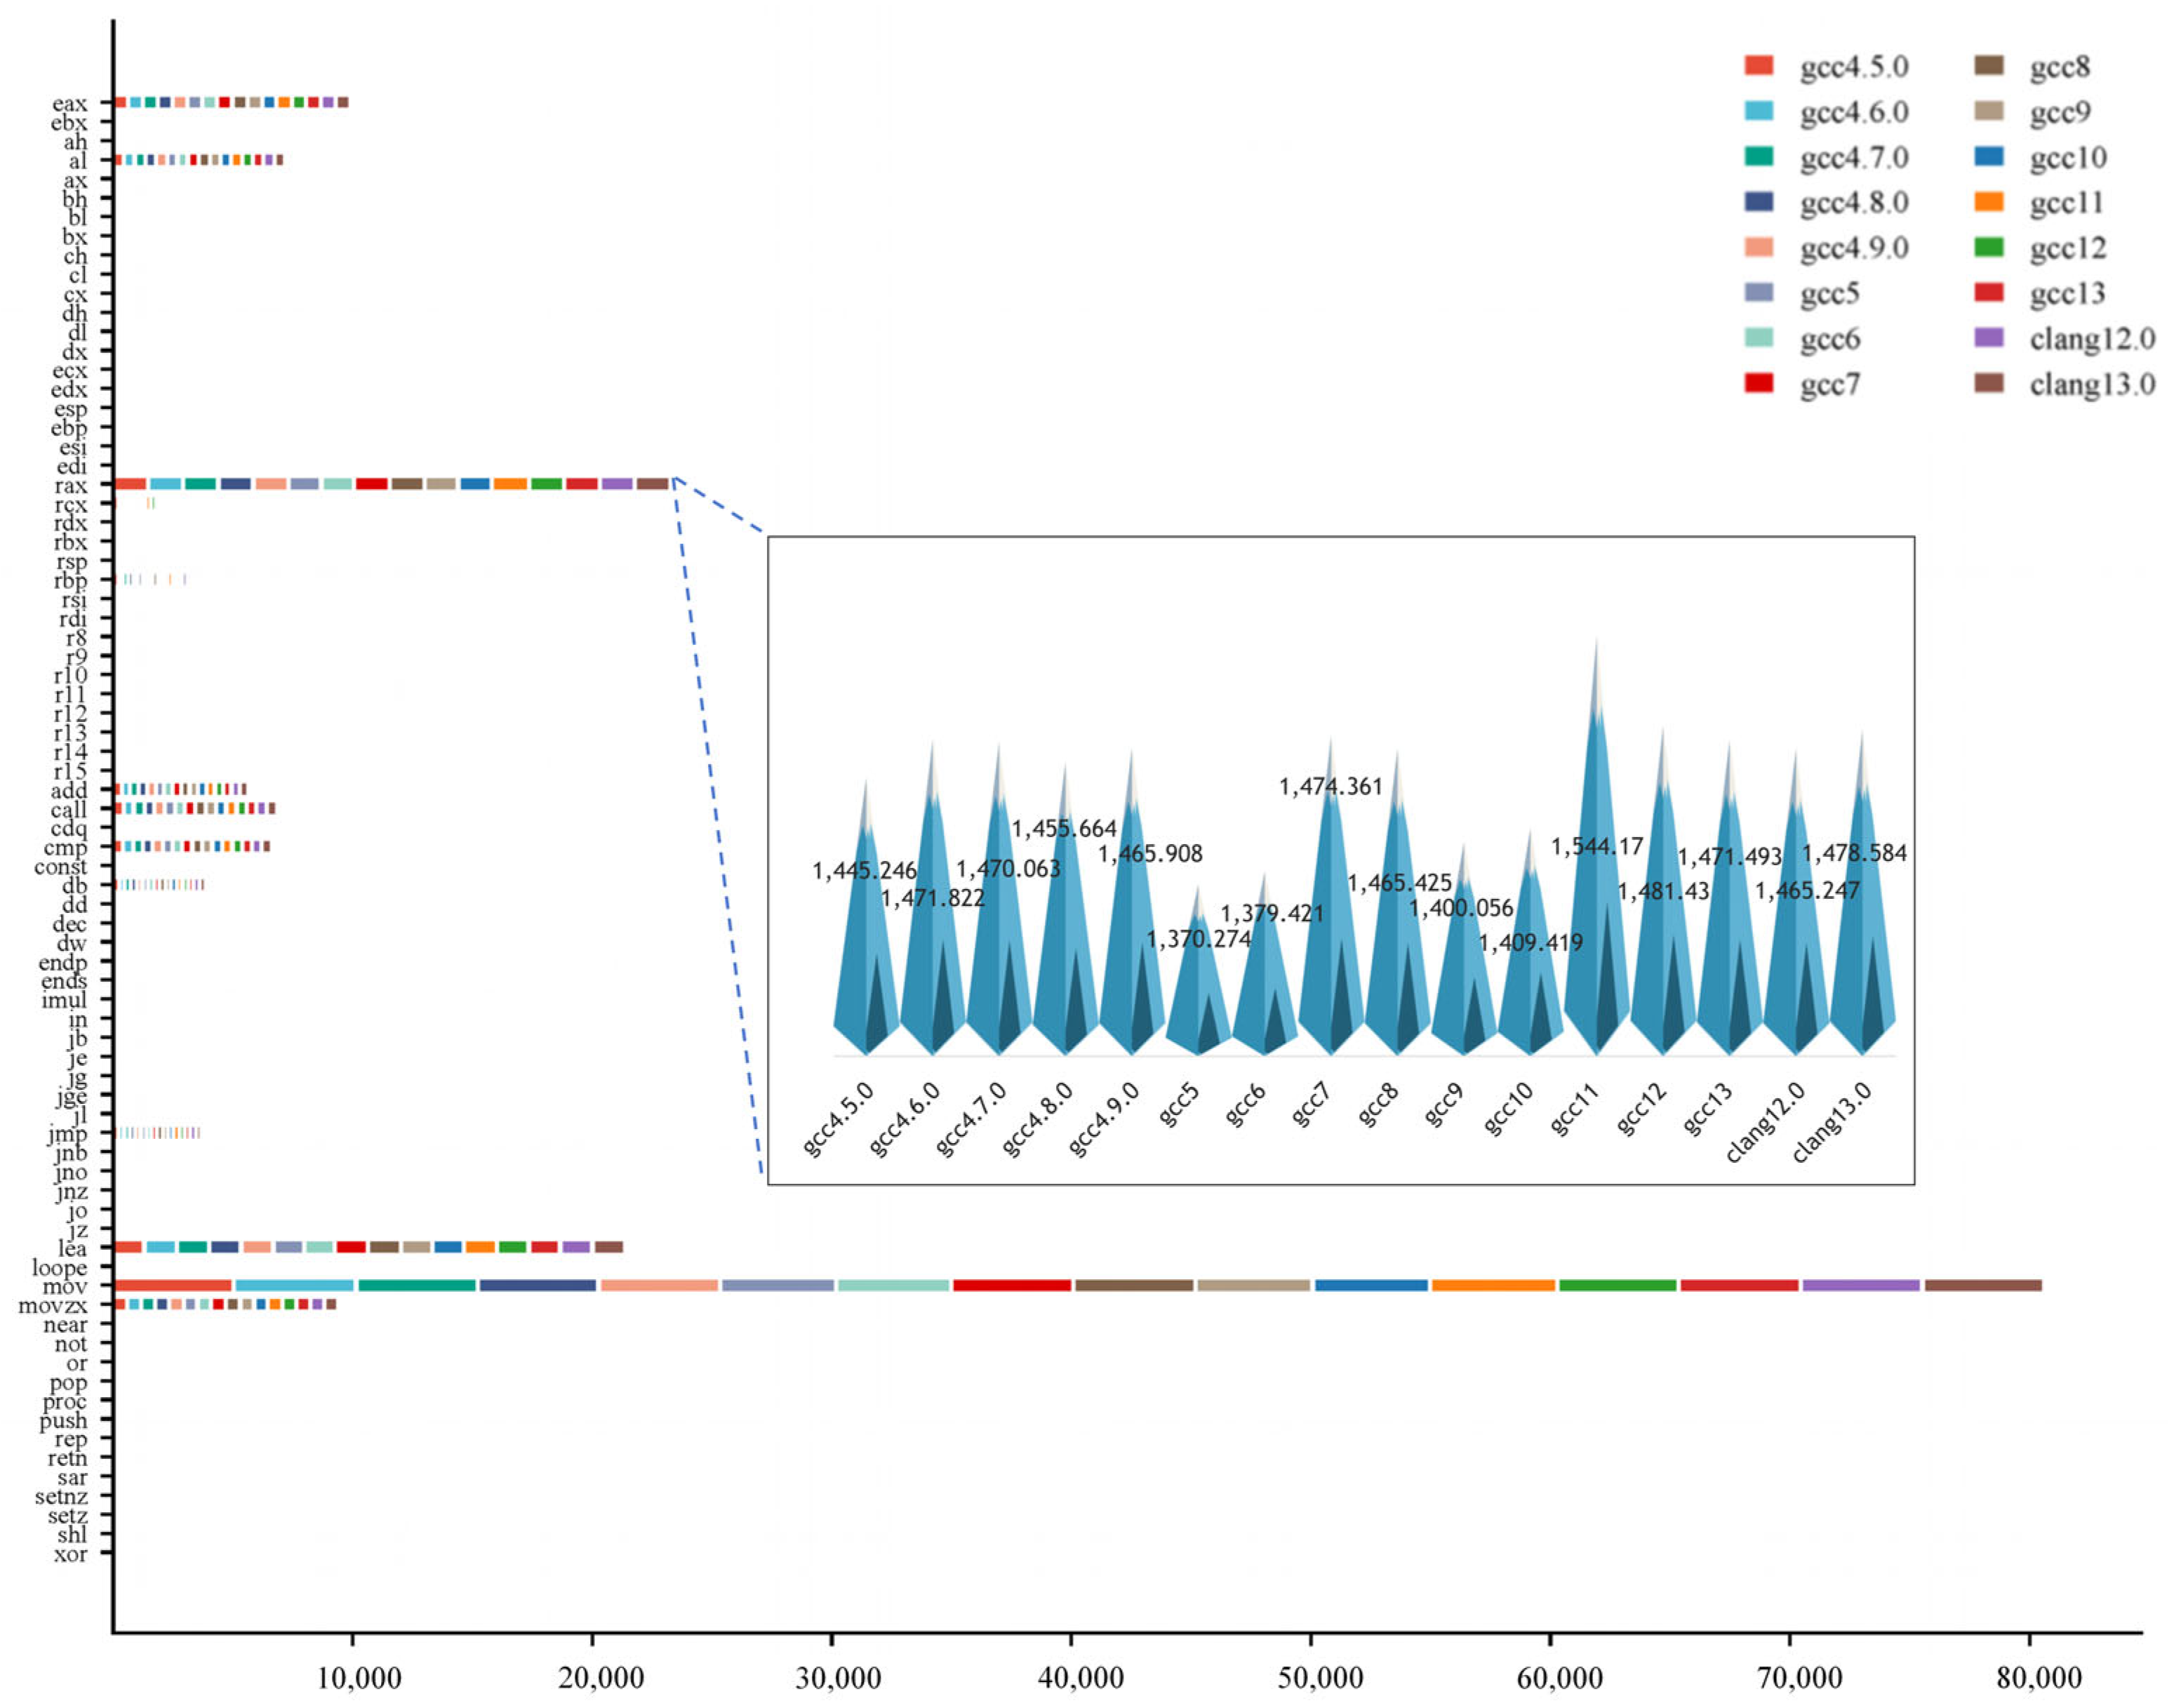
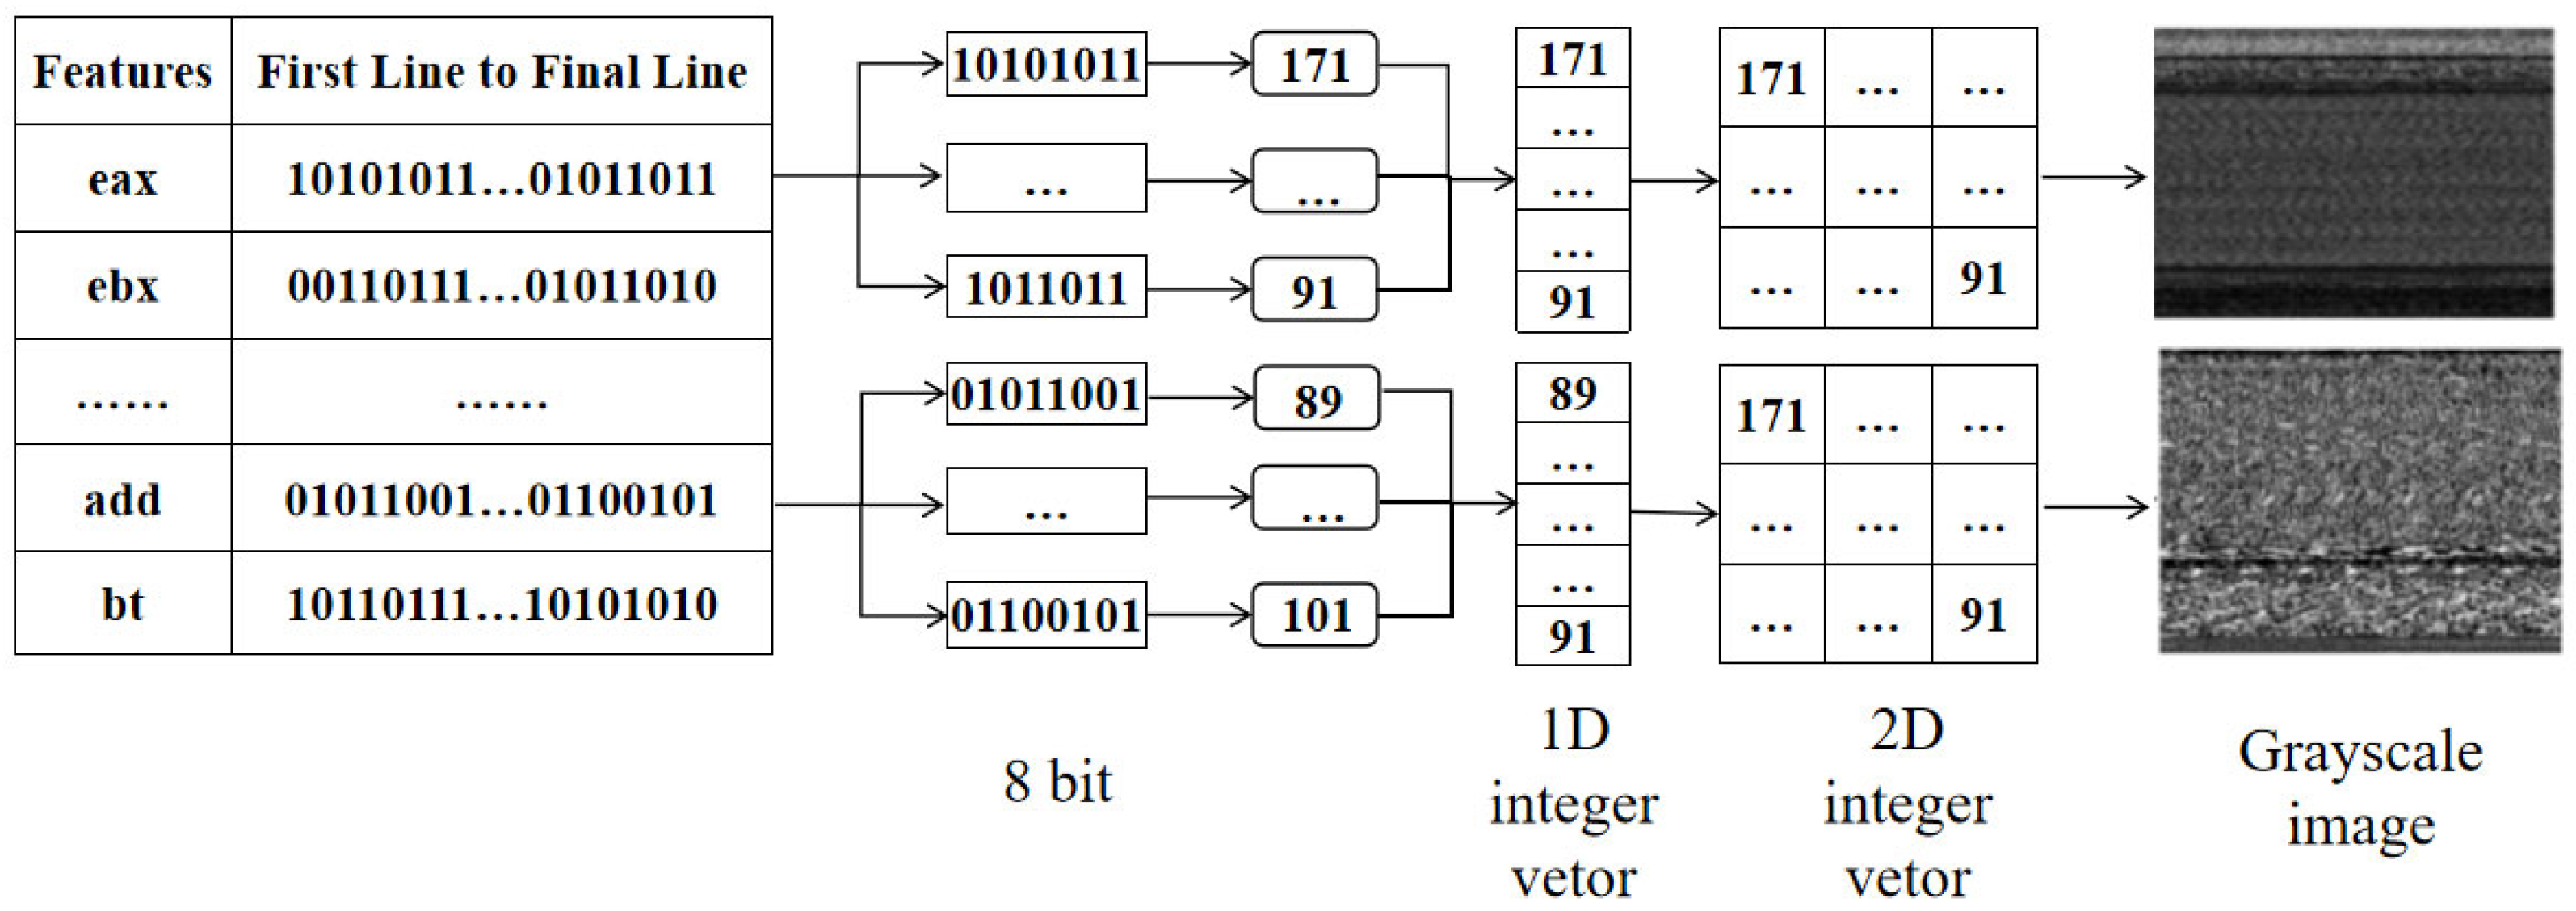
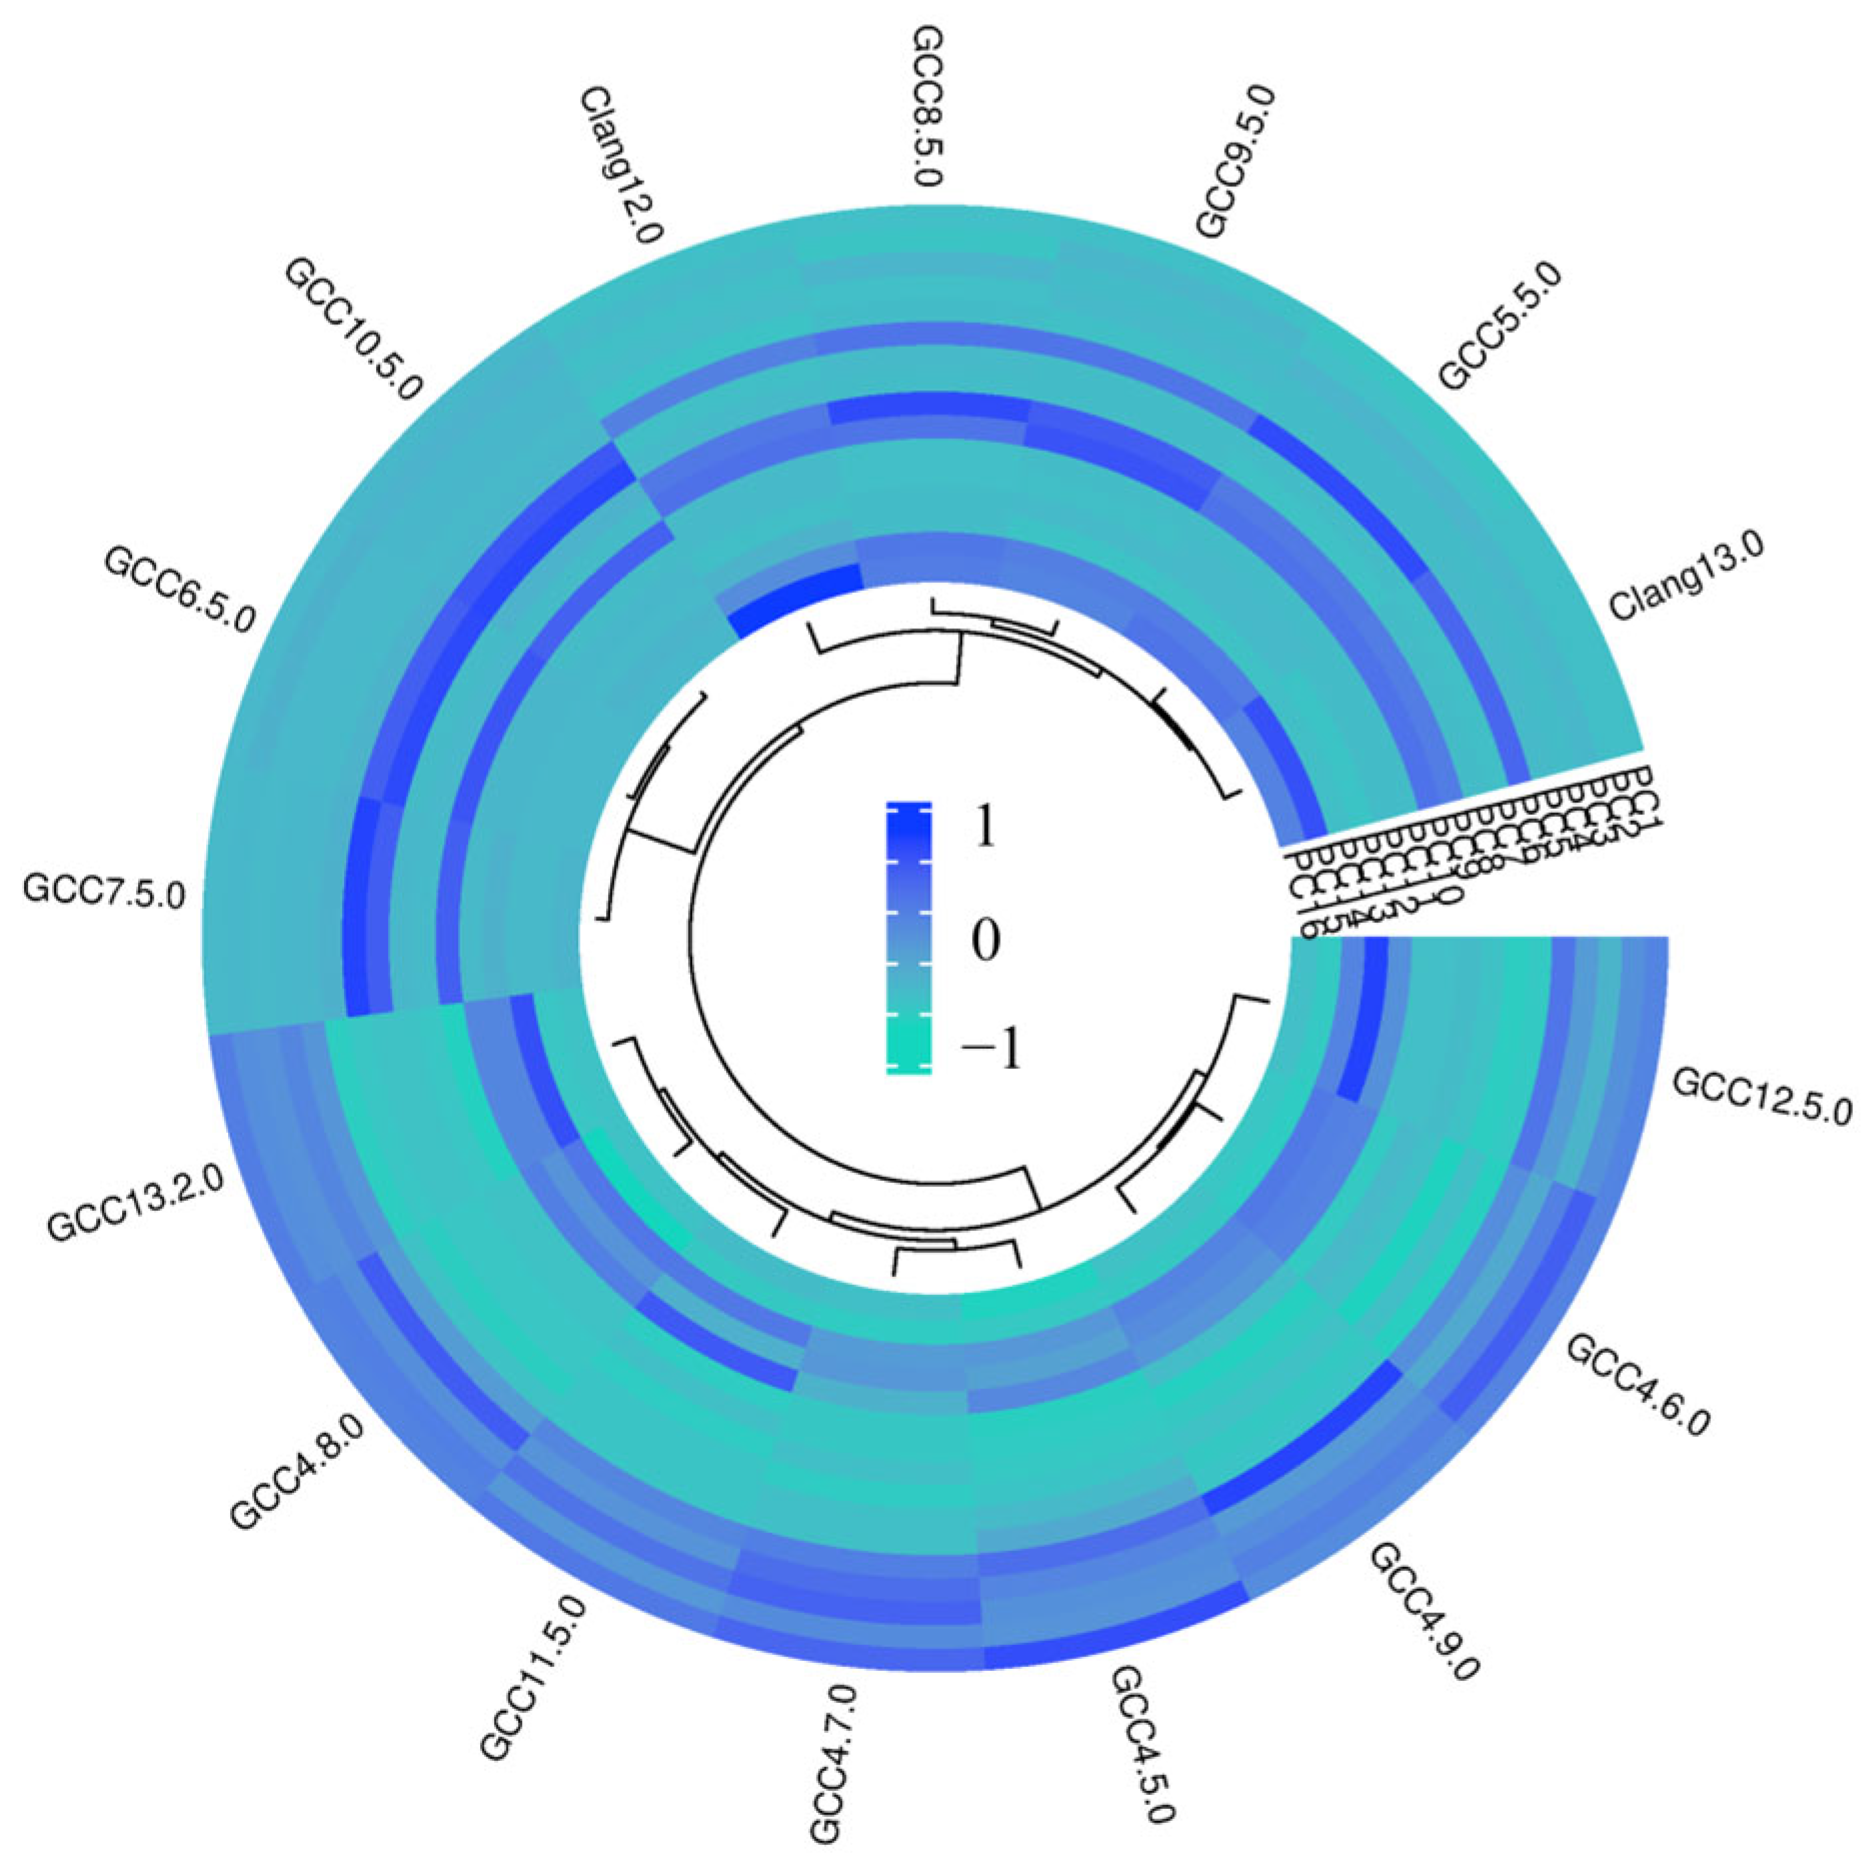
3.2.1. Feature Extraction
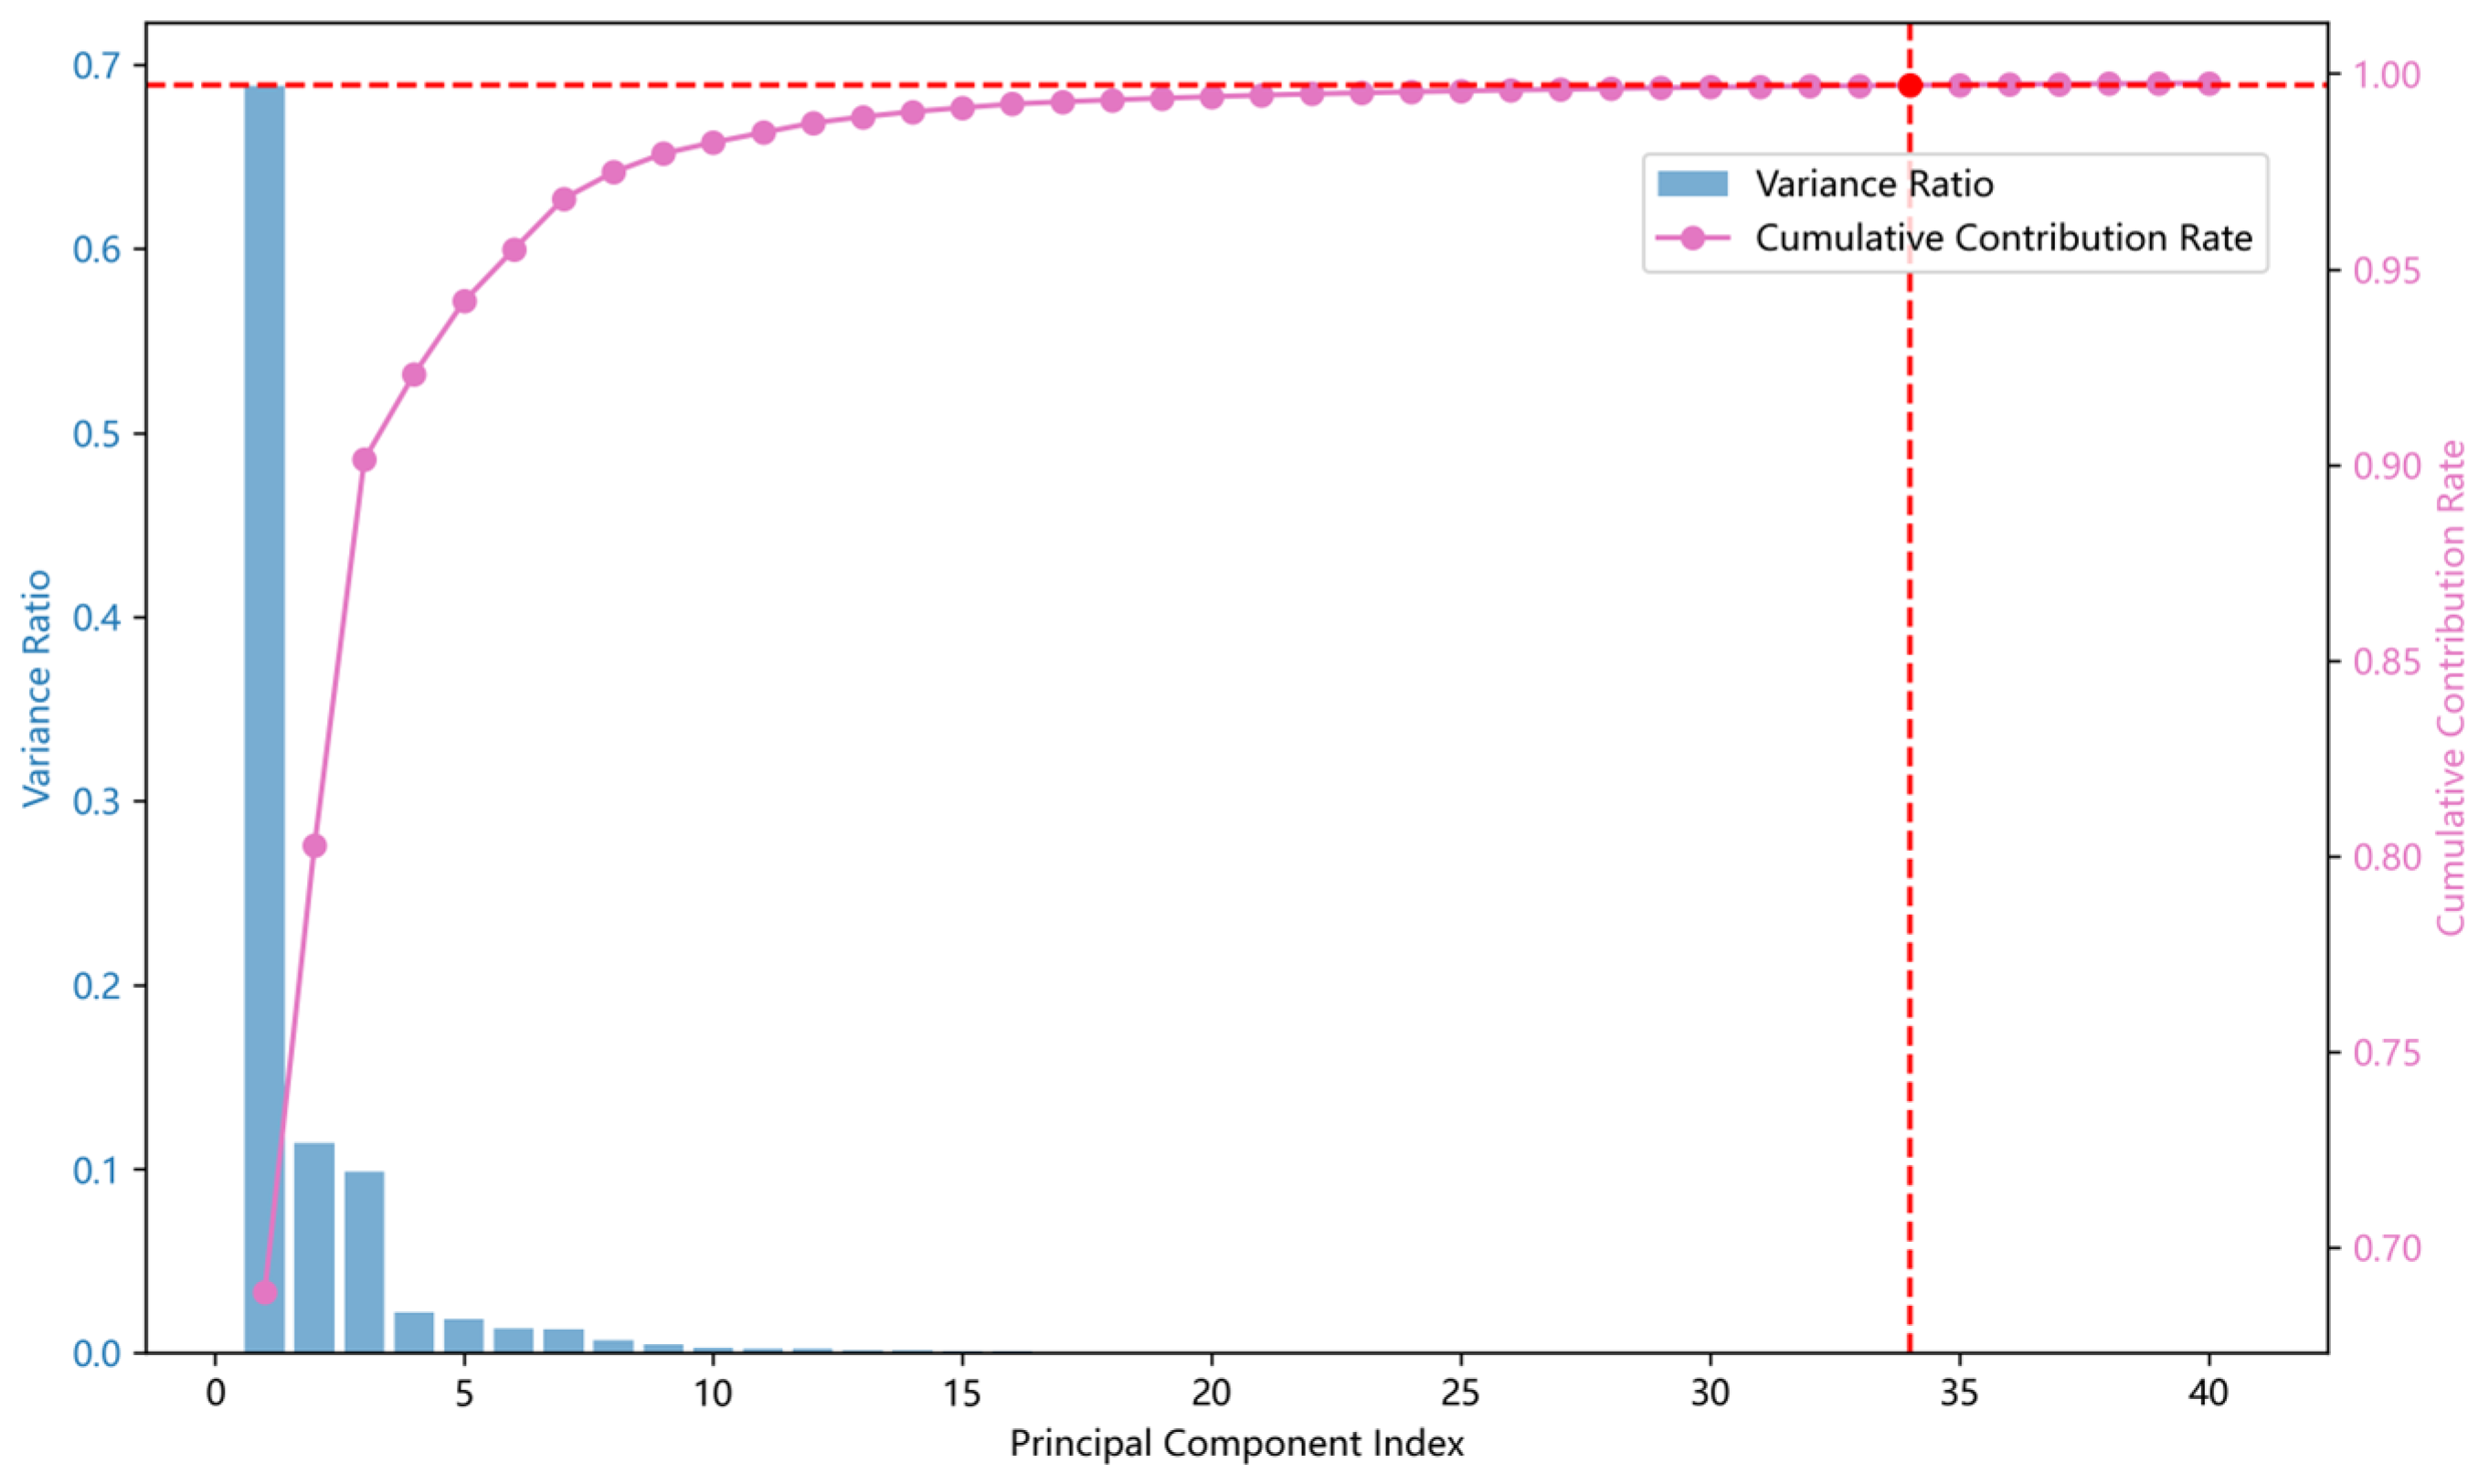
3.2.2. Feature Dimensionality Reduction
3.2.3. Identification Function
4. Experiments and Results
5. Theoretical and Practical Implication
6. Conclusions
Author Contributions
Funding
Data Availability Statement
Conflicts of Interest
References
- Li, M.; Liu, Y.; Liu, X.; Sun, Q.; You, X.; Yang, H.; Luan, Z.; Gan, L.; Yang, G.; Qian, D.P. The Deep Learning Compiler: A Comprehensive Survey. IEEE Trans. Parallel Distrib. Syst. 2021, 32, 708–727. [Google Scholar] [CrossRef]
- Wei, M.; Li, J.; Han, L.; Gao, W.; Zhao, R.; Wang, H. Support and Optimization of Multi-Granularity Quantization Framework for Deep Learning Compiler. Comput. Eng. 2025, 51, 62–72. [Google Scholar]
- Wang, J.; Jiang, W.; Zhang, C. Research on Risk Analysis of Open Source Software Supply Chain Security. Chin. Acad. Cyberspace Stud. 2024, 10, 862–869. [Google Scholar]
- Vinayakumar, R.; Alazab, M.; Soman, K.P.; Poornachandran, P.; Venkatraman, S. Robust Intelligent Malware Detection Using Deep Learning. IEEE Access. 2019, 7, 46717–46738. [Google Scholar] [CrossRef]
- Liu, R. Research on Security Protection Technology Based on Clang Compiler in Linux System. Master’s Thesis, Beijing University of Posts and Telecommunications, Beijing, China, 2019. [Google Scholar]
- Yao, Y. Feature Extraction and Recognition of C Language Compiler Based on Binary Files. Master’s Thesis, Xi’an University of Technology, Xi’an, China, 2023. [Google Scholar]
- Tian, Z.; Huang, Y.; Xie, B.; Chen, Y.; Chen, L.; Wu, D. Fine-grained compiler identification with sequence-oriented neural modeling. IEEE Access 2021, 9, 49160–49175. [Google Scholar] [CrossRef]
- Li, Q.; Peng, H.; Li, J.; Xia, C.; Yang, R.; Sun, L.; Yu, P.S.; He, L. A Survey on Text Classification: From Traditional to Deep Learning. ACM Trans. Intell. Syst. Technol. 2022, 13, 1–41. [Google Scholar] [CrossRef]
- Rohleder, R. Hands-on ghidra-a tutorial about the software reverse engineering framework. In Proceedings of the 3rd ACM Workshop on Software Protection, London, UK, 15 November 2019; pp. 77–78. [Google Scholar]
- Zhang, J.; Qin, Z.; Yin, H.; Ou, L.; Zhang, K. A feature-hybrid malware variants detection using CNN based opcode embedding and BPNN based API embedding. Comput. Secur. 2019, 84, 376–392. [Google Scholar] [CrossRef]
- Raff, E.; Zak, R.; Cox, R.; Sylvester, J.; Yacci, P.; Ward, R.; Tracy, A.; McLean, M.; Nicholas, C. An investigation of byte n-gram features for malware classification. J. Comput. Virol. Hacking Tech. 2021, 14, 1–20. [Google Scholar] [CrossRef]
- Karim, M.E.; Walenstein, A.; Lakhotia, A.; Parida, L. Malware phylogeny generation using permutations of code. J. Comput. Virol. 2019, 1, 13–23. [Google Scholar] [CrossRef]
- Jiang, Q.; Wang, F.; Jia, L. Malicious code detection method based on perceptual hash algorithm and feature fusion. Comput. Appl. 2021, 41, 780. [Google Scholar]
- Rosenblum, N.E.; Miller, B.P.; Zhu, X. Extracting compiler provenance from program binaries. In Proceedings of the 9th ACM SIGPLAN-SIGSOFT Workshop on Program Analysis for Software Tools and Engineering, Toronto, ON, Canada, 5–6 June 2010; pp. 21–28. [Google Scholar]
- Rosenblum, N.; Miller, B.P.; Zhu, X. Recovering the toolchain provenance of binary code. In Proceedings of the 2011 International Symposium on Software Testing and Analysis, Toronto, ON, Canada, 17–21 July 2011; pp. 100–110. [Google Scholar]
- Toderici, A.H.; Stamp, M. Chi-squared distance and metamorphic virus detection. J. Comput. Virol. Hacking Tech. 2013, 9, 1–14. [Google Scholar] [CrossRef]
- Rahimian, A.; Shirani, P.; Alrbaee, S.; Wang, L.; Debbabi, M. Bincomp: A stratified approach to compiler provenance attribution. Digit. Investig. 2015, 14, S146–S155. [Google Scholar] [CrossRef]
- Li, L.; Ding, Y.; Li, B.; Qiao, M.; Ye, B. Malware classification based on double byte feature encoding. Alex. Eng. J. 2022, 61, 91–99. [Google Scholar] [CrossRef]
- Tang, Y.; Qi, X.; Jing, J.; Liu, C.; Dong, W. BHMDC: A byte and hex n-gram based malware detection and classification method. Comput. Secur. 2023, 128, 103118. [Google Scholar] [CrossRef]
- Zhang, Y.; Ren, W.; Zhu, T.; Ren, Y. SaaS: A situational awareness and analysis system for massive android malware detection. Future Gener. Comput. Syst. 2019, 95, 548–559. [Google Scholar] [CrossRef]
- Conti, M.; Khandhar, S.; Vinod, P. A few-shot malware classification approach for unknown family recognition using malware feature visualization. Comput. Secur. 2022, 122, 102887. [Google Scholar] [CrossRef]
- Raff, E.; Sylvester, J.; Nicholas, C. Learning the pe header, malware detection with minimal domain knowledge. In Proceedings of the 10th ACM Workshop on Artificial Intelligence and Security, Dallas, TX, USA, 3 November 2017; pp. 121–132. [Google Scholar]
- Wen, Q.; Chow, K.P. CNN based zero-day malware detection using small binary segments. Forensic Sci. Int. Digit. Investig. 2021, 38, 301128. [Google Scholar] [CrossRef]
- Pizzolotto, D.; Inoue, K. Identifying compiler and optimization options from binary code using deep learning approaches. In Proceedings of the 2020 IEEE International Conference on Software Maintenance and Evolution (ICSME), Adelaide, SA, Australia, 28 September–2 October 2020; pp. 232–242. [Google Scholar]
- Falana, O.J.; Sodiya, A.S.; Onashoga, S.A.; Badmus, B.S. Mal-Detect: An intelligent visualization approach for malware detection. J. King Saud Univ. Comput. Inf. Sci. 2022, 34, 1968–1983. [Google Scholar] [CrossRef]
- Jiang, S.; Hong, Y.; Fu, C.; Qian, Y.; Han, L. Function-level obfuscation detection method based on Graph Convolutional Networks. J. Inf. Secur. Appl. 2021, 61, 102953. [Google Scholar] [CrossRef]
- Liu, C.; Saul, R.; Sun, Y.; Raff, E.; Fuchs, M.; Southard Pantano, T.; Holt, J.; Micinski, K. Assemblage: Automatic Binary Dataset Construction for Machine Learning. arXiv 2024, arXiv:2405.03991. [Google Scholar]
- Yang, X.; Chen, Y.; Eide, E.; Regehr, J. Finding and understanding bugs in C compilers. In Proceedings of the 32nd ACM SIGPLAN Conference on Programming Language Design and Implementation, San Jose, CA, USA, 4–8 June 2011; pp. 283–294. [Google Scholar]
- Pan, J. Exploring the Author Controversy in the Last Forty Chapters of ”Dream of the Red Chamber” from the Perspective of Word Frequency and Word Frequency: A Comparative Study Based on Mathematical Statistics Software. In Proceedings of the International Academic Forum on Cultural and Artistic Innovation (III), Beijing, China, 15–17 July 2022. [Google Scholar]
- Li, H.; Liu, Y. Plagiarism Judgment Based on Language Model and Feature Classification. Comput. Eng. 2013, 39, 230–234. [Google Scholar]
- Feuerriegel, S.; Maarouf, A.; Bär, D.; Geissler, D.; Schweisthal, J.; Pröllochs, N.; Robertson, C.E.; Rathje, S.; Hartmann, J.; Mohammad, S.M.; et al. Using Natural Language Processing to Analyse Text Data in Behavioural Science. Nat. Rev. Psychol. 2025, 4, 96–111. [Google Scholar] [CrossRef]
- Stone, M. The Role of Assembly Language in Modern Compiler Design. J. Comput. Sci. Technol. 2020, 35, 210–225. [Google Scholar]
- Tian, X.; Huang, Y. Analysis of Malicious Application Detection Method Based on N-gram Algorithm. Comput. Simul. 2023, 40, 470–474. [Google Scholar]
- Alibabaei, S.; Rahmani, M.; Tahmasbi, M.; Tahmasebi Birgani, M.J.; Razmjoo, S. Evaluating the Gray Level Co-Occurrence Matrix-Based Texture Features of Magnetic Resonance Images for Glioblastoma Multiform Patients’ Treatment Response Assessment. J. Med. Signals Sens. 2023, 13, 261–271. [Google Scholar] [CrossRef] [PubMed]
- Nataraj, L.; Karthikeyan, S.; Jacob, G.; Manjunath, B.S. Malware images: Visualization and automatic classification. In Proceedings of the 8th International Symposium on Visualization for Cyber Security, Pittsburgh, PA, USA, 20 July 2011; pp. 1–7. [Google Scholar]
- Şahin, D.Ö.; Kural, O.E.; Akleylek, S.; Kılıç, E. Permission-based Android malware analysis by using dimension reduction with PCA and LDA. J. Inf. Secur. Appl. 2021, 63, 102995. [Google Scholar] [CrossRef]
- Vichi, M.; Cavicchia, C.; Groenen, P.J.F. Hierarchical means clustering. J. Classif. 2022, 39, 553–577. [Google Scholar] [CrossRef]
- Cohen-Addad, V.; Kanade, V.; Mallmann-Trenn, F.; Mathieu, C. Hierarchical Clustering: Objective Functions and Algorithms. J. ACM. 2019, 66, 1–42. [Google Scholar] [CrossRef]
- Yao, L.; Wan, Y.; Ni, H.; Xu, B. Action unit classification for facial expression recognition using active learning and SVM. Multimed. Tools Appl. 2021, 80, 24287–24301. [Google Scholar] [CrossRef]
- Cerrada, M.; Aguilar, J.; Altamiranda, J.; Sánchez, R.-V. A Hybrid Heuristic Algorithm for Evolving Models in Simultaneous Scenarios of Classification and Clustering. Knowl. Inf. Syst. 2019, 61, 755–798. [Google Scholar]
- Barut, O.; Luo, Y.; Li, P.; Zhang, T. R1DIT: Privacy-Preserving Malware Traffic Classification With Attention-Based Neural Networks. IEEE Trans. Netw. Serv. Manag. 2023, 20, 2071–2085. [Google Scholar] [CrossRef]
- Ravi, V.; Alazab, M. Attention-Based Convolutional Neural Network Deep Learning Approach for Robust Malware Classification. Comput. Intell. 2023, 39, 145–168. [Google Scholar] [CrossRef]
- Yuan, B.; Wang, J.; Liu, D.; Guo, W.; Wu, P.; Bao, X. Byte-Level Malware Classification Based on Markov Images and Deep Learning. Comput. Secur. 2020, 92, 101740. [Google Scholar] [CrossRef]


| Name | Details | |
|---|---|---|
| CPU | Intel® Core™ i5 Processors @ 2.40 GHz | |
| RAM | 16 GB | |
| System | Windows 11 | |
| VMware Workstation Pro | Version 17 | |
| IOS image file | ubuntukylin-24.04.1-desktop-amd64.iso | |
| Finalshell | Version 3.9.6.2 | |
| GCC | Version | 13.2.0(2023) 12.5.0(2022) 11.5.0(2021) 10.5.0(2020) 9.5.0(2019) 8.5.0(2018) 7.5.0(2017) 6.5.0(2016) 5.5.0(2015) 4.9.0(2014) 4.8.0(2013) 4.7.0(2012) |
| Clang | Version 13.0(2023) 12.0(2022) | |
| CSmith | Version 2.7 | |
| IDA pro | IDA Pro (7.0) and IDA Python 2.7 | |
| Python | Python 3.11.7 | |
| Data Category | Quantity/Piece | Data Specification | Complier Release Year |
|---|---|---|---|
| GCC_13 | 1000 | GCC13.2.0’s binary files | 2023 |
| GCC_12 | 1000 | GCC12.5.0’s binary files | 2022 |
| GCC_11 | 1000 | GCC11.5.0’s binary files | 2021 |
| GCC_10 | 1000 | GCC10.5.0’s binary files | 2020 |
| GCC_9 | 1000 | GCC9.5.0’s binary files | 2019 |
| GCC_8 | 1000 | GCC8.5.0’s binary files | 2018 |
| GCC_7 | 1000 | GCC7.5.0’s binary files | 2017 |
| GCC_6 | 1000 | GCC6.5.0’s binary files | 2016 |
| GCC_5 | 1000 | GCC5.5.0’s binary files | 2015 |
| GCC_4.9.0 | 1000 | GCC4.9.0’s binary files | 2014 |
| GCC_4.8.0 | 1000 | GCC4.8.0’s binary files | 2013 |
| GCC_4.7.0 | 1000 | GCC4.7.0’s binary files | 2012 |
| GCC_4.6.0 | 1000 | GCC4.6.0’s binary files | 2011 |
| GCC_4.5.0 | 1000 | GCC4.5.0’s binary files | 2010 |
| Clang_13 | 1000 | Clang13.0’s binary files | 2023 |
| Clang_12 | 1000 | Clang12.0’s binary files | 2022 |
| DIANA Algorithm |
|---|
| Input: Data and the Number of Clusters K Output: K Clusters
|
| Cumulative Explained Variance | Accuracy of Training Set | Accuracy of Testing Set |
|---|---|---|
| Without PCA | 0.66 | 0.16 |
| PCA (95% cumulative variation) | 0.64 | 0.16 |
| PCA (99% cumulative variation) | 0.68 | 0.20 |
| PCA (99.5% cumulative variation) | 0.70 | 0.23 |
| DIANA | Distance | Linkage | Threshold of Distance | K |
| L2 norm | Ward | 0.34 | 6 | |
| SVM | Kernel | C | Gamma | Score |
| RBF | 100 | 0.1 | 0.94 | |
| CV | Fold | Average Score | Standard Deviations | p-value |
| 10 | 0.941 | 0.00375 | 0.000 *** |
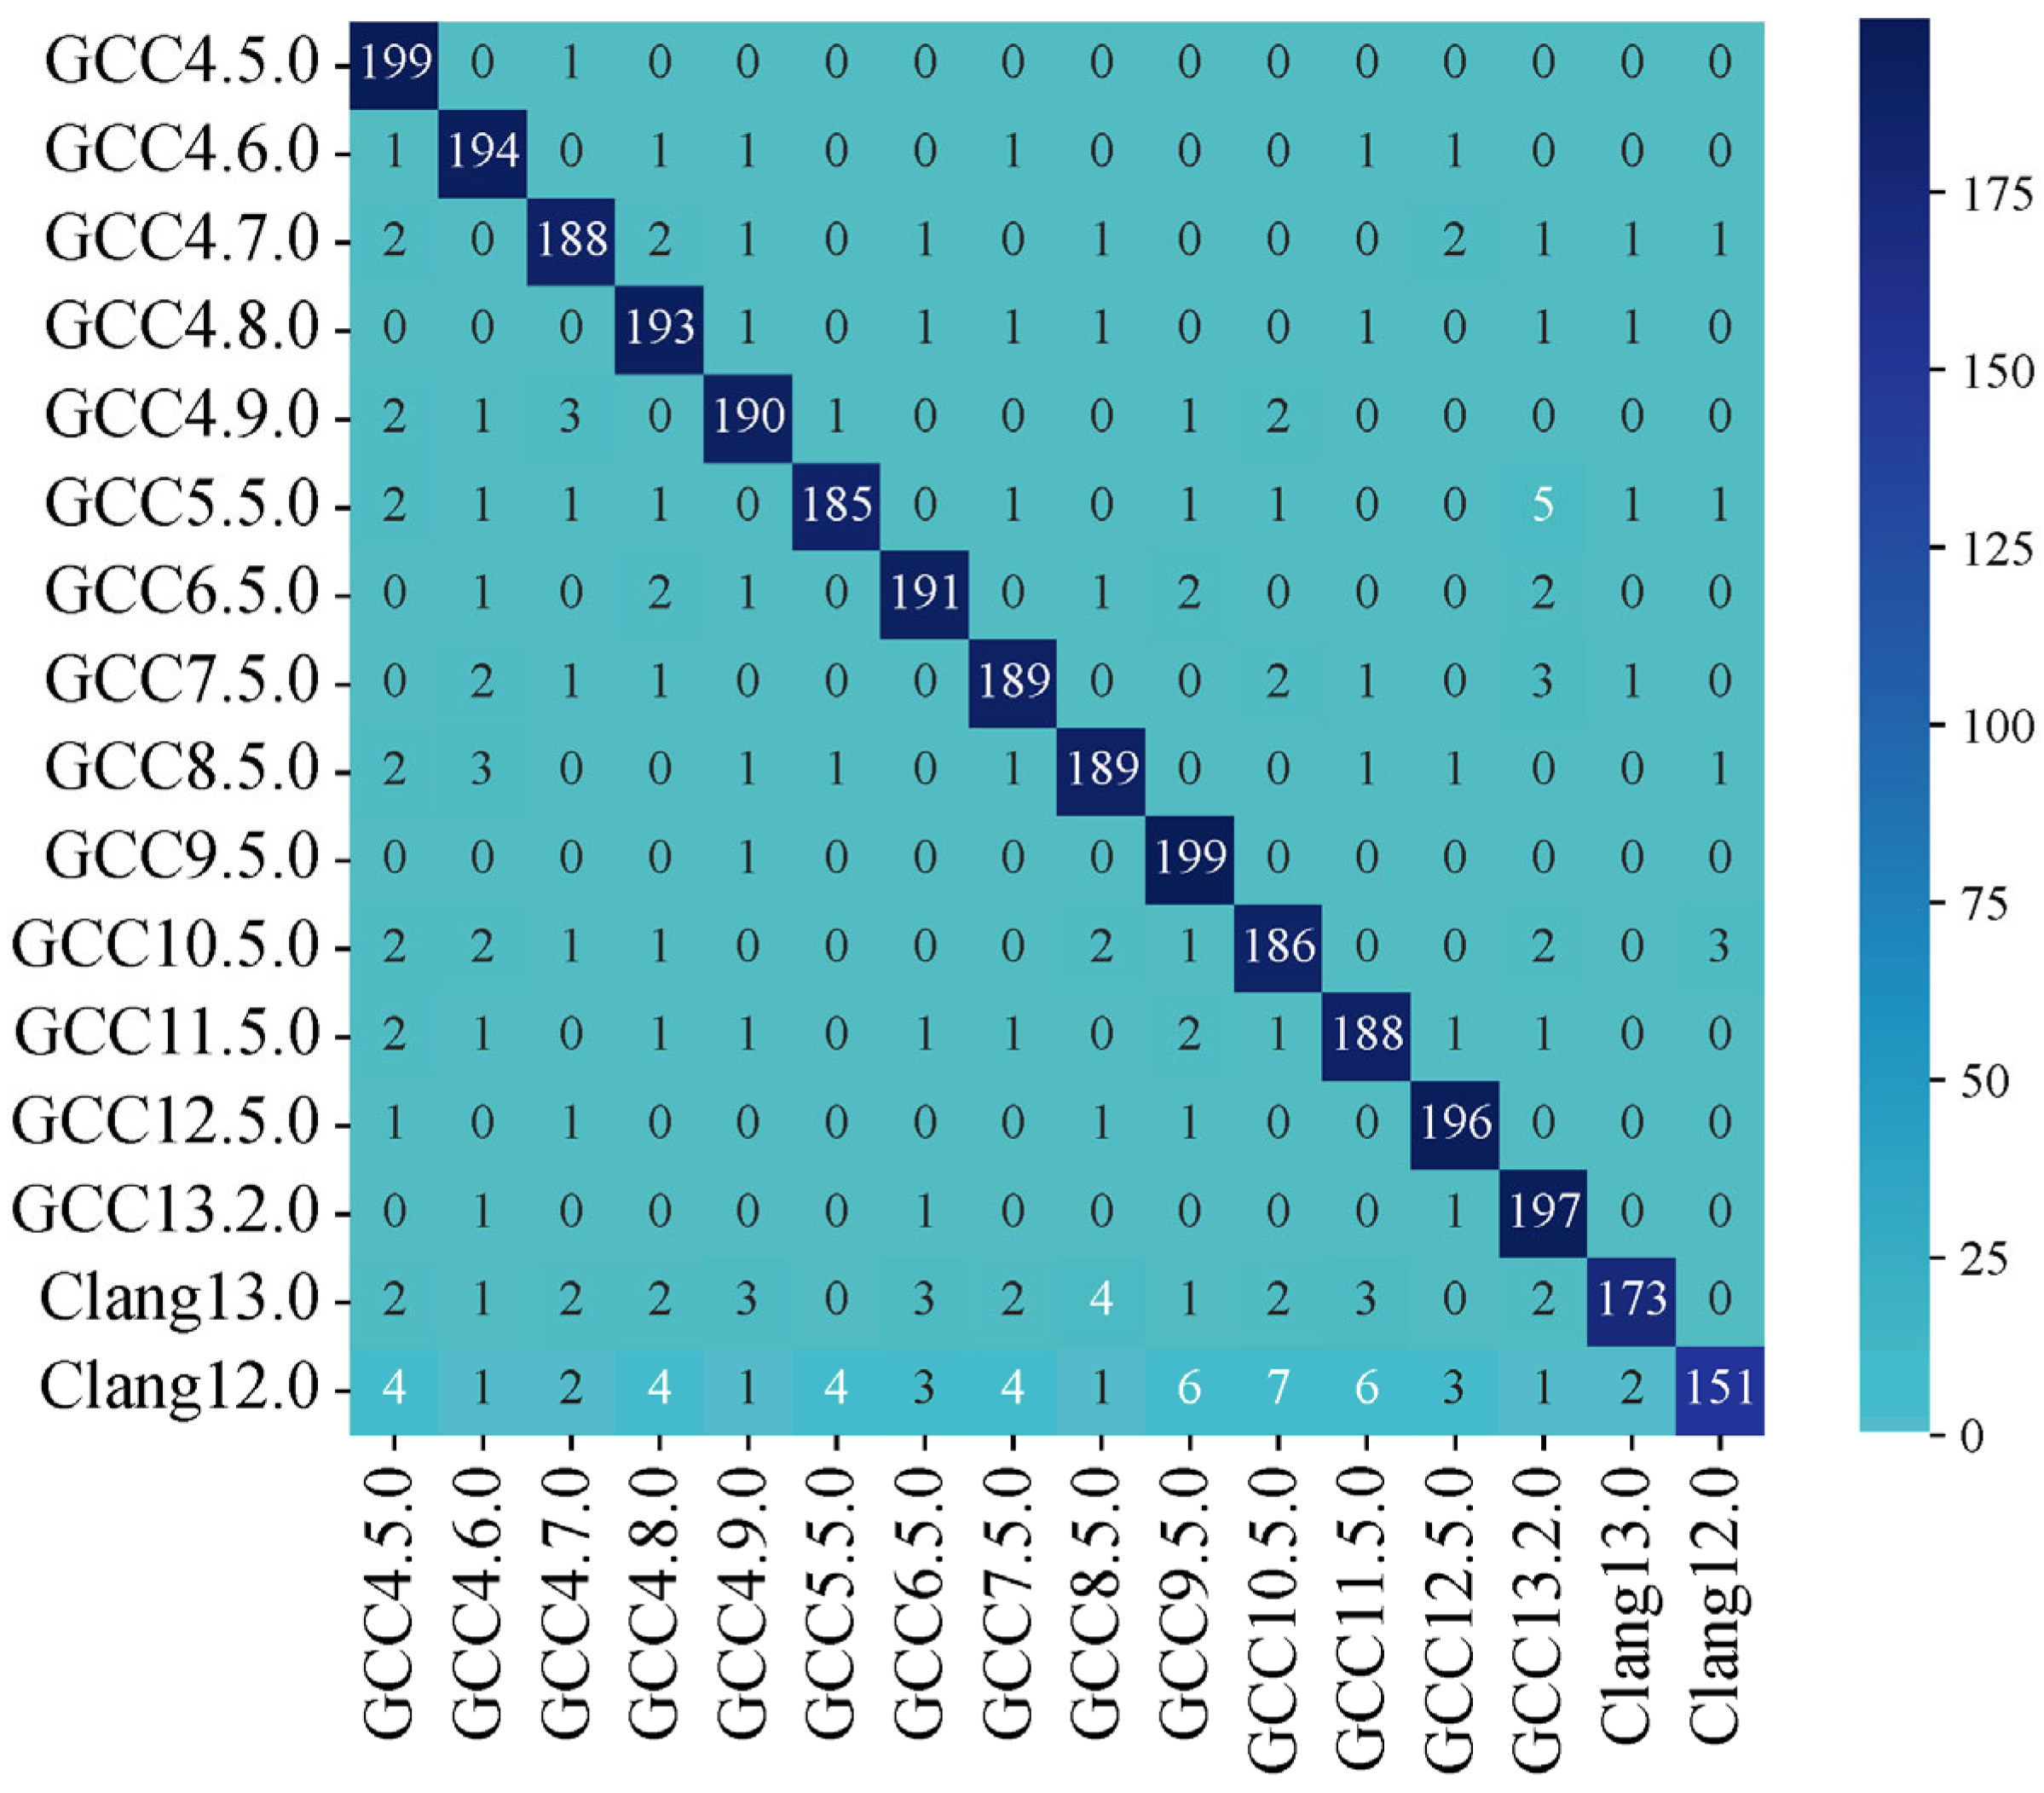
| Classifier | Accuracy of Training Set | Accuracy of Testing Set | Standard Deviations of CV |
|---|---|---|---|
| SVM | 0.70 | 0.23 | 0.0141 |
| KNN | 0.66 | 0.20 | 0.0251 |
| RF | 0.68 | 0.21 | 0.0231 |
| DIANA-SVM | 0.97 | 0.94 | 0.00375 |
| DIANA-KNN | 0.95 | 0.91 | 0.00422 |
| DIANA-RF | 0.95 | 0.93 | 0.00401 |
| Version | Metric | Training Set | Testing Set | ||||
|---|---|---|---|---|---|---|---|
| DIANA SVM | DIANA KNN | DIANA RF | DIANA SVM | DIANA KNN | DIANA RF | ||
| GCC4.5.0 | Precision | 0.961 | 0.947 | 0.961 | 0.909 | 0.915 | 0.903 |
| Recall | 0.975 | 0.98 | 0.985 | 0.995 | 0.965 | 0.98 | |
| F1-score | 0.968 | 0.963 | 0.973 | 0.95 | 0.939 | 0.94 | |
| GCC4.6.0 | Precision | 0.956 | 0.969 | 0.94 | 0.933 | 0.927 | 0.948 |
| Recall | 0.975 | 0.95 | 0.945 | 0.97 | 0.95 | 0.995 | |
| F1-score | 0.965 | 0.96 | 0.943 | 0.951 | 0.938 | 0.971 | |
| GCC4.7.0 | Precision | 0.98 | 0.961 | 0.97 | 0.94 | 0.916 | 0.947 |
| Recall | 0.97 | 0.98 | 0.985 | 0.94 | 0.93 | 0.985 | |
| F1-score | 0.975 | 0.97 | 0.978 | 0.94 | 0.923 | 0.966 | |
| GCC4.8.0 | Precision | 0.961 | 0.966 | 0.945 | 0.928 | 0.879 | 0.961 |
| Recall | 0.99 | 0.995 | 0.945 | 0.965 | 0.91 | 0.995 | |
| F1-score | 0.975 | 0.98 | 0.945 | 0.946 | 0.894 | 0.978 | |
| GCC4.9.0 | Precision | 0.966 | 0.941 | 0.947 | 0.945 | 0.951 | 0.937 |
| Recall | 0.985 | 0.965 | 0.98 | 0.95 | 0.965 | 0.97 | |
| F1-score | 0.975 | 0.953 | 0.963 | 0.948 | 0.958 | 0.953 | |
| GCC5.5.0 | Precision | 0.966 | 0.933 | 0.96 | 0.969 | 0.899 | 0.925 |
| Recall | 0.995 | 0.97 | 0.955 | 0.925 | 0.935 | 0.98 | |
| F1-score | 0.98 | 0.951 | 0.957 | 0.946 | 0.917 | 0.951 | |
| GCC6.5.0 | Precision | 0.975 | 0.94 | 0.933 | 0.95 | 0.885 | 0.933 |
| Recall | 0.96 | 0.935 | 0.98 | 0.955 | 0.965 | 0.91 | |
| F1-score | 0.967 | 0.937 | 0.956 | 0.953 | 0.923 | 0.922 | |
| GCC7.5.0 | Precision | 0.97 | 0.954 | 0.947 | 0.945 | 0.905 | 0.92 |
| Recall | 0.96 | 0.935 | 0.985 | 0.945 | 0.955 | 0.915 | |
| F1-score | 0.965 | 0.944 | 0.966 | 0.945 | 0.929 | 0.917 | |
| GCC8.5.0 | Precision | 0.965 | 0.961 | 0.927 | 0.945 | 0.903 | 0.933 |
| Recall | 0.97 | 0.99 | 0.95 | 0.945 | 0.975 | 0.91 | |
| F1-score | 0.968 | 0.975 | 0.938 | 0.945 | 0.938 | 0.922 | |
| GCC9.5.0 | Precision | 0.98 | 0.936 | 0.959 | 0.93 | 0.905 | 0.899 |
| Recall | 0.99 | 0.955 | 0.935 | 0.995 | 0.9 | 0.93 | |
| F1-score | 0.985 | 0.946 | 0.947 | 0.961 | 0.902 | 0.914 | |
| GCC10.5.0 | Precision | 0.98 | 0.932 | 0.951 | 0.925 | 0.89 | 0.919 |
| Recall | 0.99 | 0.955 | 0.965 | 0.93 | 0.97 | 0.965 | |
| F1-score | 0.985 | 0.943 | 0.958 | 0.928 | 0.928 | 0.941 | |
| GCC11.5.0 | Precision | 0.985 | 0.947 | 0.942 | 0.935 | 0.908 | 0.93 |
| Recall | 0.96 | 0.975 | 0.98 | 0.94 | 0.885 | 0.925 | |
| F1-score | 0.972 | 0.961 | 0.961 | 0.938 | 0.896 | 0.927 | |
| GCC12.5.0 | Precision | 0.96 | 0.952 | 0.979 | 0.956 | 0.918 | 0.915 |
| Recall | 0.965 | 0.99 | 0.94 | 0.98 | 0.835 | 0.86 | |
| F1-score | 0.963 | 0.971 | 0.959 | 0.968 | 0.874 | 0.887 | |
| GCC13.2.0 | Precision | 0.966 | 0.952 | 0.943 | 0.916 | 0.914 | 0.929 |
| Recall | 0.99 | 0.895 | 0.905 | 0.985 | 0.845 | 0.91 | |
| F1-score | 0.978 | 0.923 | 0.923 | 0.949 | 0.878 | 0.919 | |
| Clang13.0 | Precision | 0.979 | 0.953 | 0.937 | 0.966 | 0.932 | 0.939 |
| Recall | 0.945 | 0.92 | 0.895 | 0.865 | 0.96 | 0.93 | |
| F1-score | 0.962 | 0.936 | 0.916 | 0.913 | 0.946 | 0.935 | |
| Clang12.0 | Precision | 0.973 | 0.959 | 0.961 | 0.962 | 0.925 | 0.947 |
| Recall | 0.9 | 0.81 | 0.87 | 0.755 | 0.615 | 0.72 | |
| F1-score | 0.935 | 0.878 | 0.913 | 0.846 | 0.739 | 0.818 | |
Disclaimer/Publisher’s Note: The statements, opinions and data contained in all publications are solely those of the individual author(s) and contributor(s) and not of MDPI and/or the editor(s). MDPI and/or the editor(s) disclaim responsibility for any injury to people or property resulting from any ideas, methods, instructions or products referred to in the content. |
© 2025 by the authors. Licensee MDPI, Basel, Switzerland. This article is an open access article distributed under the terms and conditions of the Creative Commons Attribution (CC BY) license (https://creativecommons.org/licenses/by/4.0/).
Share and Cite
Liu, C.; Zhang, Y.; Zuo, P.; Wang, P. Compiler Identification with Divisive Analysis and Support Vector Machine. Symmetry 2025, 17, 867. https://doi.org/10.3390/sym17060867
Liu C, Zhang Y, Zuo P, Wang P. Compiler Identification with Divisive Analysis and Support Vector Machine. Symmetry. 2025; 17(6):867. https://doi.org/10.3390/sym17060867
Chicago/Turabian StyleLiu, Changlan, Yingsong Zhang, Peng Zuo, and Peng Wang. 2025. "Compiler Identification with Divisive Analysis and Support Vector Machine" Symmetry 17, no. 6: 867. https://doi.org/10.3390/sym17060867
APA StyleLiu, C., Zhang, Y., Zuo, P., & Wang, P. (2025). Compiler Identification with Divisive Analysis and Support Vector Machine. Symmetry, 17(6), 867. https://doi.org/10.3390/sym17060867