Article

Flexible Concentration Gradient Droplet Generation via Partitioning–Recombination in a Shear Flow-Driven Multilayer Microfluidic Chip

by
Linkai Yu
1,†,
Qingyang Feng
1,†,
Yifan Chen
1,2,
Yongji Wu
1,
Haizhen Sun
1,*,
Hao Yang
1,* and
Lining Sun
1
1
School of Mechanical and Electric Engineering, Soochow University, Suzhou 215299, China
2
School of Future Science and Engineering, Soochow University, Suzhou 215299, China
*
Authors to whom correspondence should be addressed.
These authors contributed equally to this work.
Symmetry 2025, 17(6), 826; https://doi.org/10.3390/sym17060826 (registering DOI)
Submission received: 17 April 2025 / Revised: 10 May 2025 / Accepted: 22 May 2025 / Published: 26 May 2025
(This article belongs to the Special Issue Symmetry/Asymmetry in Micro/Nanofluidic Devices and Applications)

Abstract

:
Concentration gradient generation plays a pivotal role in advancing applications across drug screening, chemical synthesis, and biomolecular studies, yet conventional methods remain constrained by labor-intensive workflows, limited throughput, and inflexible gradient control. This study presents a novel multilayer microfluidic chip leveraging shear flow-driven partitioning–recombination mechanisms to enable the flexible and high-throughput generation of concentration gradient droplets. The chip integrates interactive upper and lower polydimethylsiloxane (PDMS) layers, where sequential fluid distribution and recombination are achieved through circular and radial channels while shear forces from the oil phase induce droplet formation. Numerical simulations validated the dynamic pressure-driven concentration gradient formation, demonstrating linear gradient profiles across multiple outlets under varied flow conditions. The experimental results revealed that the shear flow mode significantly enhances mixing uniformity and droplet generation efficiency compared to continuous flow operations, attributed to intensified interfacial interactions within contraction–expansion serpentine channels. By modulating hydrodynamic parameters such as aqueous- and oil-phase flow rates, this system achieved tunable gradient slopes and droplet sizes, underscoring the intrinsic relationship between flow dynamics and gradient formation. The proposed device eliminates reliance on complex channel networks, offering a compact and scalable platform for parallelized gradient generation. This work provides a robust framework for optimizing microfluidic-based concentration gradient systems, with broad implications for high-throughput screening, combinatorial chemistry, and precision biomolecular assays.

1. Introduction

In the fields of chemistry [1,2] and biological sciences [3,4,5], the ability to generate well-controlled chemical substances based on concentration distribution is of paramount importance. This precise manipulation of concentration gradients holds significant implications for various applications, including protein crystallization [6,7,8], clinical diagnostics [9,10], the pharmaceutical industry [11,12], and materials science [13]. However, traditional methods, which predominantly rely on pipettes and multi-well plates, are not only labor-intensive but also struggle to achieve accurate and stable gradient generation while minimizing reagent consumption [14,15].
In recent years, microfluidic platforms have gradually supplanted traditional non-microfluidic systems in concentration gradient generation due to their high controllability, low cost, high efficiency, and portability [16,17,18,19,20,21,22]. Nevertheless, classical “tree”- or “pyramid”-structured microfluidic networks for concentration gradient generation often face limitations such as extensive long channels and complex fabrication [23,24,25]. These systems lack flexibility, and flow-based devices can only generate specific concentrations in one dimension. Furthermore, to enhance mixing performance, active approaches involving external stimuli such as electric fields [26,27] and acoustic fields [28,29] have been introduced into concentration gradient generators. At the same time, by integrating microfluidic technologies such as pneumatic pumps [30,31] and PDMS peristaltic valves [32], the rapid regulation of dynamic gradients has been achieved under centrifugal or pressure-driven conditions, such as the spatiotemporal control of three-dimensional concentrations in antibacterial susceptibility testing [33], significantly improving the efficiency of complex gradient generation and biocompatibility. However, these technologies are strictly constrained by the appropriate selection of fluid conductivity, fluid flux, and external control parameters [34,35]. Additionally, existing technical bottlenecks include the sensitivity of external parameters to flow-rate variations, excessively long static gradient generation times, and the ongoing challenges in the precise control of complex gradients (e.g., three-dimensional spatial gradients) [36,37].
Despite significant advancements in microfluidic technologies for concentration gradient generation, the existing platforms remain constrained by critical limitations in flexibility, throughput, and operational efficiency. To address these challenges, we present a multilayered interactive microfluidic chip that integrates the principles of contraction–expansion and distribution–recombination. The contraction–expansion principle is realized through the design of wide–narrow serpentine channels within the chip, which enhances the mixing efficiency of multiple fluids by compressing and expanding the solutions within the channels. The distribution–recombination principle is implemented via two solution inlets, where the fluids are proportionally distributed and subsequently mixed within the serpentine channels to achieve concentration gradients, as illustrated in Figure 1a. The chip is fabricated by bonding two PDMS layers to a glass substrate, with Figure 1b providing an exploded view of the chip structure. In the annular channel, the fluid is proportionally distributed, while in the cross-shaped radial channel, it is equally distributed. Both configurations undergo micro-mixing to establish the concentration gradients, as demonstrated in Figure 1c,d. The physical image of the chip is shown in Figure 1e, which demonstrates its simple structure and compact size. The chip achieves fluid distribution through pressure-driven flow, enabling the splitting of solutions, and subsequently recombines and mixes them to form the final concentration gradient.
This study introduces a multilayer microfluidic chip that addresses these limitations through shear flow-driven partitioning–recombination and pump-free droplet actuation. Unlike prior systems reliant on external pumps or complex networks, our design leverages oil-phase shear forces to simultaneously generate droplets and linear concentration gradients. By bridging the gap between flexible gradient control and scalable fabrication, this work advances microfluidics toward high-throughput applications in drug discovery and combinatorial chemistry.

2. Materials and Methods

Chip Fabrication: The glass (5 cm × 6 cm, Fangyuan Glass Technology Co., Ltd, Qinhuangdao, China) slides were immersed in a petri dish containing acetone (Sigma-Aldrich, Shanghai, China) and alcohol (Anhydrous Ethanol, Aladdin, Shanghai, China) for cleaning, followed by drying with N2. Under low light intensity, we aligned the film (SD238, Dupont, Suzhou, China) with the glass sheet and placed them into the laminating machine (33939, Deli, Suzhou, China). We employed the thermal lamination process to perform three cycles of pressing [38]. We utilized the layer-by-layer bonding technique to achieve channel height control (single-layer: 38 μm, double-layer: 76 μm, triple-layer: 114 μm). Subsequently, a mask-alignment exposure system (HY-UV0003, 70 W; Haoyun Optoelectronics Technology Co., Ltd., Zhuhai, China) was used for the gradient exposure (single-layer: 4 s, double-layer: 7 s, triple-layer: 10 s). The unexposed regions were removed by soaking in a 2.5% sodium carbonate solution (dry film developer; Aladdin, Shanghai, China). Dimethylchlorosilane (1066-35-9, Macklin, Shanghai, China) was added to a vacuum chamber (CX-001, Yancheng, China), and the glass slides were placed inside for vacuum extraction, lasting 4–5 min. The vacuum chamber was then sealed and left to stand for approximately 10 min to improve the demolding rate. PDMS (Sylgard, Dow Corning, Dongguna, China) and a curing agent (Sylgard, Dow Corning, Dongguna, China) were mixed at a mass ratio of 10:1, poured into the mold, and left to stand for 5 min before being treated in a vacuum pump (VPC22591, Leibo Scientific Instruments Co., Ltd., Wuxi, China). The mold was placed in a constant-temperature oven (DZF-6020; Kangheng Instruments Co., Ltd., Guangzhou, China) at 80 ± 1 °C for 30 min of thermal curing. The channels were cut using a scalpel, and inlet/outlet ports were created at predefined locations using a flat, round needle (13 mm, Dongguan, China). The chip and glass substrate were treated in a plasma cleaner (PDC-MG; Zhongxin Qiheng Scientific Instruments Co., Ltd., Suzhou, China), then transferred to a bonding platform, where a static bonding process was performed under a weight at 65 °C for 15 min. The designed microfluidic chip consisted of two layers of PDMS and a glass substrate. The bonding process between the bottom PDMS layer and the glass substrate was the same as described above. However, the bonding of the two PDMS layers required precise alignment of the fluidic interaction points between the upper and lower channels, ensuring that the solution could flow from the upper channel to the lower channel. This necessitated the coaxial alignment of the chip’s intersection points. First, the dimensions of the two channel inlets were designed to be identical. Second, the two PDMS layers were aligned under a microscope during the bonding process.
Additionally, PDMS is a commonly used material in the fabrication of microfluidic chips. Considering its adsorption effect on certain types of drugs, reagents, and other small molecules, as well as potential chemical reactions, we will proceed with subsequent experimental operations only after the adsorption effect of the PDMS has stabilized. This approach allows us to measure the generated concentration gradient effects while effectively neglecting the impact of this adsorption.
Solution Preparation: The red aqueous phase was formulated by ultrasonically mixing a water-soluble pigment (red, Youjin, Lianyungang, China) with purified water at a mass ratio of 1:10, and the control group utilized uncolored purified water. All solutions were filtered through a 0.22 μm microporous membrane and stored in sterile sample bottles. Dimethyl silicone oil with a viscosity of 10 cSt (PMX-200; Dow Corning, Dongguna, China) was selected as the continuous phase and was pre-mixed with surfactant RSN-0749 at a mass ratio of 50:1 prior to use, and the mixture was subjected to dispersion treatment using an ultrasonic oscillator.
Numerical Foundations: To investigate the mixing efficiency and the performance of the generated concentration gradients in the multilayer microfluidic chips, we conducted simulation studies on the mixing module and the distribution module separately using COMSOL Multiphysics 6.0. The velocity-field and the concentration-field control equations were solved through the laminar-flow physics field and the dilute species-transport physics field, respectively.
The fundamental laws of fluid flow are described by fluid dynamics equations, among which the most central are the Navier–Stokes equations. The Navier–Stokes equations are established based on the continuity equation (mass conservation) and Newton’s second law (momentum conservation), and their basic form includes the continuity equation and the momentum equation.
The continuity equation, also known as the mass conservation equation, describes the law of mass conservation in fluids [39,40]:
ρ t + ( ρ u ) = 0
where   ρ is the fluid density (kg/m3),   u is the fluid velocity field (m/s), and   t is time (s).
For incompressible fluids (where the density, ρ , is constant), the continuity equation simplifies to
u = 0
The Navier–Stokes equations, also known as the momentum conservation equations, describe the principle of momentum conservation in fluid dynamics:
ρ u t + u u = p + μ 2 u + f  
where   p is the pressure (Pa);   μ is the dynamic viscosity (Pa·s); and t is the body force (N/m3).
For incompressible fluids (where the density, ρ , is constant), the Navier–Stokes equations simplify to
u t + u u = 1 ρ p + ν 2 u + f ρ
Here, ν = μ ρ represents the kinematic viscosity (m2/s).
For steady-state flow (where the velocity field does not change with time), the time-derivative term, u t , becomes zero, and the equation simplifies to
u u = 1 ρ p + ν 2 u + f ρ
The characteristic of a dilute solution is that the solute concentration is low, allowing the interactions between the solute particles and the influence of the solute on the fluid flow to be neglected. This equation is primarily employed to embody the rapid formation of uniform concentrations at each outlet through the redistribution and recombination of fluid micro-mixing, thereby furnishing a theoretical foundation for the stable generation of subsequent concentration-gradient variations. Below is the process of establishing the convection–diffusion equation for a dilute solution in a microchannel.
When formulating a convection–diffusion equation, the following assumptions are typically made: the solute concentration is low (dilute solution); the interactions between the solute particles can be neglected; the fluid is an incompressible Newtonian fluid; the diffusion coefficient, D, of the solute is constant and does not vary with the concentration; and chemical reactions or other source terms are ignored. The transport of the solute in the fluid consists of two components: the first is convective transport, where the solute is carried by the fluid flow, and the second is diffusive transport, which arises from the concentration gradient. According to the law of mass conservation, the rate of change in a solute concentration is equal to the sum of the net fluxes due to convection and diffusion.
For the solute concentration, c, the mass conservation equation can be written as [41]
c t + J = 0
where c is the solute concentration (mol/m3 or kg/m3)   a n d   J is the solute flux (mol/(m2·s) or kg/(m2·s)).
The solute flux, J , is composed of two parts, convection and diffusion:
J = J convection + J diffusion
The convective flux is driven by the movement of the fluid, carrying the solute along, and its expression is
J convection = c u
The diffusive flux arises from the concentration gradient and, according to Fick’s Law, is expressed as
J diffusion = D c
where D is the diffusion coefficient of the solute (m2/s). Therefore, the total flux is
J = c u D c
Substituting the total flux into the mass conservation equation yields the convection–diffusion equation:
c t + ( c u ) = ( D c )
If the diffusion coefficient, D, is constant, the final convection–diffusion equation can be obtained:
c t + u c = D 2 c
The mixing performance is evaluated using the following formula [42]:
M e = 1 s C C d S s C d S
where C is the concentration at a specific cross-section of the microchannel and C   is the concentration under the condition of complete mixing. The value of M e   ranges from 0 to 1, indicating the state from completely unmixed (0) to fully mixed (1).
System Setup: During the operation of the microfluidic chip, the fluid flows from the upper PDMS layer through the distribution channels into the lower PDMS layer, where the interaction of the different fluids occurs at the Y-shaped junction. The oil phase (Qoil) enters from the upper PDMS channel and is evenly distributed into four branches via a circular channel. The aqueous phase channels are divided into Inlet 1 and Inlet 2, referred to as Q1 and Q2, respectively, in the subsequent sections of this article. Q1 enters through Inlet 1 and is sequentially distributed into four branches via a circular channel to achieve a concentration gradient, with the flow rate determined by the actual channel dimensions. Q2 enters through Inlet 2 and is equally distributed into four branches via a cross-shaped radial channel, simultaneously flowing toward the Y-shaped junction. The oil phase exerts a shear force on the continuous-phase fluid at the end of the Y-shaped junction, generating uniformly sized microdroplets. The generated microdroplets are independent, individual entities, which facilitates the study of the experimental results. Analyzing their colors and diameters can further reflect the stability of the chip’s operation and the concentration gradient changes at each outlet. The entire experiment was conducted using an external syringe pump (Harvard Apparatus, Shanghai, China) to independently control the flow rates of Qoil, Q1, and Q2 (ranging from 0 to 9 mL/h). The prepared solutions were co-injected into the microchannels. The observations revealed that the system stabilized approximately 30 s after adjusting the flow rates, at which point uniformly sized droplets were generated. The mixing process of the solutions and the droplet generation process were monitored using a microscope (IX73, Olympus, Tokyo, Japan) equipped with a CMOS camera (Prime 95B, Photometrics, Shanghai, China). The captured images, as well as the measurement of the collected droplets and the analysis of their grayscale values, were processed using ImageJ software (version 1.50b, NIH, Bethesda, MD, USA).

3. Results and Discussion

3.1. Analysis of Simulation Results

The convection–diffusion channel model in this study comprises a hybrid architecture integrating a circular distribution channel (210 μm width) and a radial distribution channel (110 μm width), both with a uniform height of 76 μm. This dual-channel configuration facilitates dynamic fluid partitioning: the circular channel divides the external fluid into four branches with progressively varying flow ratios through sequential pressure-driven bifurcations, while the radial channel ensures the uniform volumetric distribution of the internal fluid across all branches via symmetric bifurcation geometry. Following computational mesh generation, boundary conditions were systematically defined to replicate physical constraints. Specifically, inlet velocity profiles, outlet pressure conditions (atmospheric reference), and no-slip wall boundaries were imposed. A dilute species transport module was coupled with laminar flow physics to resolve the convective–diffusive mass transfer. The initial concentration fields were assigned as follows: the primary inlet (c1) was set to 1 mol/m3 to represent the solute source, while the secondary inlet (c2) was initialized at 0 mol/m3 to simulate pure solvent, establishing a binary concentration gradient framework. This configuration enabled the parametric investigation of flow ratio-dependent mixing dynamics while maintaining the geometric scalability for multi-outlet gradient generation.
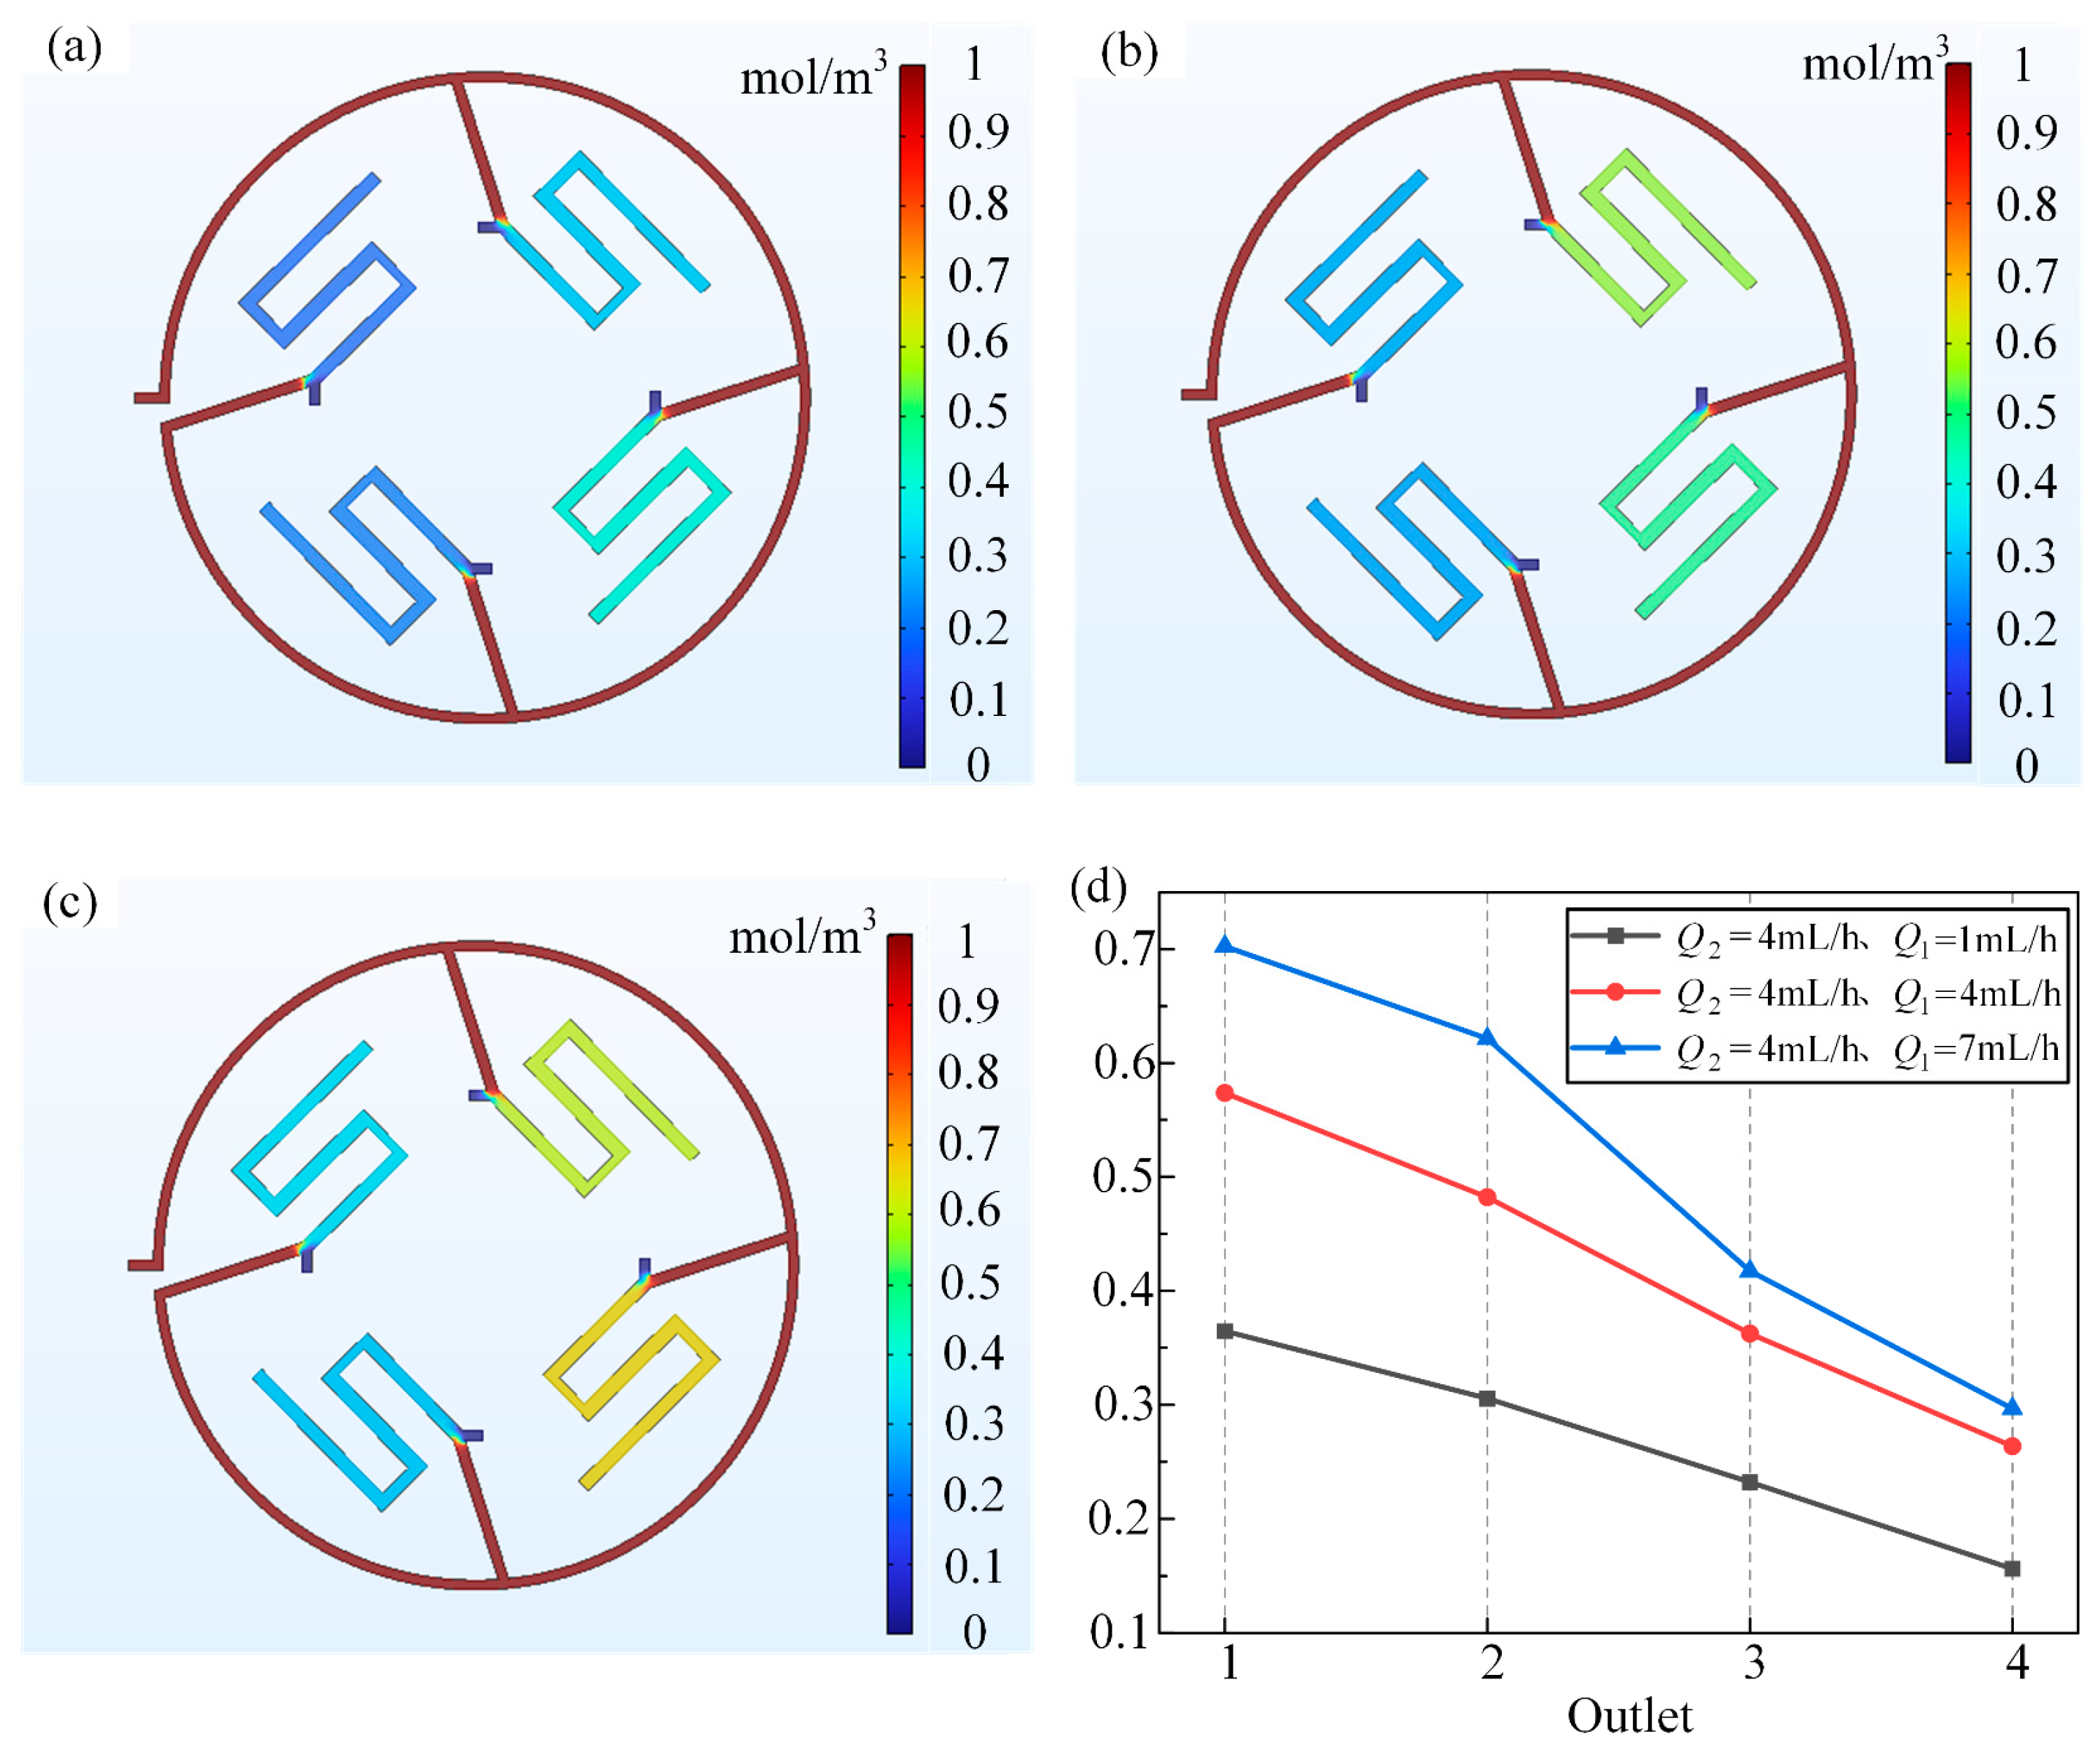
To systematically investigate the hydrodynamic modulation of the concentration gradients, we performed a parametric analysis of the primary flow rates (Q1) at 1, 4, and 7 mL/h while maintaining a constant secondary flow rate (Q2 = 4 mL/h). The results incorporated concentration and surface (tds) data, with coloring selected from the rainbow color map. The simulation results, as depicted in Figure 2, visually demonstrate the presence of a concentration gradient through the rainbow map, thereby validating the designed circular concentration-gradient generator’s capability to produce concentration gradients. In Figure 2a–c, it is observable that the concentration at each outlet generally exhibits a linear relationship with the outlet number. This indicates that the fluid pressure distribution within the model adheres to the initial design intent, where the external fluid pressure decreases linearly as it progresses through the channels. Figure 2d quantitatively compares the normalized outlet concentrations under these three Q1 conditions (1, 4, and 7 mL/h). The normalization analysis of this figure was performed by setting the initial concentration at the inlet at a constant value of 1 mol/m3. The concentrations at the various outlets under different flow rates were then normalized by calculating their ratios relative to this reference value. Along the circular channel’s flow direction (from Outlet 1 to Outlet 4), a linear reduction in the solute concentration was observed. Specifically, under a primary flow rate of Q1 = 4 mL/h, the normalized concentration decreased linearly by an average of 17.8% per outlet along the circular channel, with values declining from 0.58 at Outlet 1 to 0.27 at Outlet 4 (total reduction: 53.4%). Notably, increasing Q1 enhanced the convective solute transport, resulting in elevated concentrations across all outlets. At Outlet 1, the normalized concentration increased by 91.9% (from 0.37 to 0.71) as Q1 escalated from 1 to 7 mL/h, while Outlet 4 exhibited a milder increase of 93.7% (from 0.16 to 0.31). This differential amplification confirms the dominance of flow-rate modulation in the proximal regions of the gradient generator. These results validate the generator’s capability to maintain precise gradient linearity under operational perturbations, fulfilling the design criteria for scalable microfluidic applications.

3.2. Experimental Study on the Partitioning–Recombination of Two Fluids Under Continuous Flow Conditions

In previous studies, the feasibility of generating concentration gradients in a circular gradient generator based on the principle of distribution–recombination was successfully validated through COMSOL simulations, providing a theoretical foundation for practical operations. In this section, experiments are conducted on the designed chip to verify whether the distribution–recombination principle can be effectively applied in the circular gradient generator under actual operating conditions. Theoretically, the fluid entering through aqueous inlet 1 experiences a pressure decrease as it progresses through the channel, creating a pressure differential. This results in varying pressures at the four outlets. Meanwhile, by introducing a colorless aqueous solution through inlet 2, four outlet streams with identical pressures can be achieved. At the critical contact area (the contact area here refers to the section of the Y-shaped channel where the oil phase shears the aqueous-phase fluid), this setup enables the formation of mixtures with varying compositions. The pressure-induced differences in composition lead to the generation of color gradients in the mixed solutions during the subsequent mixing processes. Under this framework, the desired outcome is a sequential dilution of solution concentration along the order of the circular channel outlets. The distribution aspect is manifested in the allocation of the solutions from the two inlets, which can be understood as pressure-dependent fluid distribution. The recombination aspect occurs at the critical mixing junctions, where solutions of different compositions combine to ultimately form a concentration gradient. In the experimental procedure, a colorless aqueous solution was used as the fluid for aqueous inlet 2 to ensure four equally pressurized solution streams at the mixing junctions. A solution prepared by uniformly mixing colorless aqueous solution with a deep-red dye at a mass ratio of 5:1 was introduced through aqueous inlet 1 to serve as the pressure-varied colored solution.
During the experimental procedure, two 10 mL syringes were utilized to aspirate the colorless aqueous solution and the deep-red dye mixture, respectively. These syringes were securely mounted on a syringe pump, ensuring the absence of air bubbles within the syringes. The syringe needles were connected to the chip via flexible tubing. The chip, after undergoing hydrophobic treatment, was placed on the experimental platform. The flow rate was set to 10 mL/h to fill the tubing with the solutions. The deep-red dye mixture was connected to inlet 1 and introduced at a flow rate of 5 mL/h. Once the deep-red solution fully occupied the channel and ensured the absence of air bubbles, the colorless aqueous solution was connected to inlet 2 upon observing of the liquid outflow. The flow rate was adjusted to generate the desired concentration gradient. After ensuring of proper connections at both inlets, distinct variations in composition at the critical mixing junctions were visibly observed, as in Figure 3a,b, demonstrating the automated generation of solutions with varying color intensities at the four outlets under appropriate pressure distributions. The results, as depicted in Figure 3c, confirmed the successful generation of a concentration gradient using the circular gradient generator. When the flow rate of inlet 1 was adjusted to 4 mL/h and that of inlet 2 to 9 mL/h, the experimental data were compared with the simulation results, as shown in Figure 3d. The comparison revealed a close agreement between the simulation and experimental results, with similar concentration decline trends and minimal discrepancies at the outlets. After allowing of the chip to stabilize, the solutions from each outlet were collected in small glass vials, as illustrated in Figure 3e. From left to right, the vials correspond to outlets 1 to 4, clearly demonstrating the variation in the concentration gradients, thereby validating the feasibility of the chip in generating concentration gradients in practice.
The generation of the concentration gradients is attributed to the pressure distribution between the two inlets, with the key factor influencing pressure being the fluid flow rate. By fixing the flow rate of one inlet and varying the flow rate of the other, different concentration gradients could be achieved. To investigate the impact of fluid velocity on the resulting concentration gradient, Q2 was initially fixed at 5 mL/h while Q1 was varied from 0.5 mL/h to 4 mL/h. Subsequently, Q1 was fixed at 3 mL/h while Q2 was adjusted from 4 mL/h to 9 mL/h. The ratio of colorless water to dye at the critical mixing regions was visualized under corresponding flow-rate conditions, and patterns were derived from the data. In both scenarios described, the colors of the microdroplets collected at each outlet were quantified using ImageJ software, normalized, and matched with the respective flow-rate conditions.
For when Q2 was fixed at 5 mL/h, the experimental images are shown in Figure 3f, and the normalized results are presented in Figure 3g. At Q1 = 0.5 mL/h, the fourth outlet exhibited the maximum extent of the colorless water compressing the dyed water, while at Q1 = 4 mL/h, the first outlet showed the maximum extent of the dyed water compressing the colorless water. For a given flow rate, the concentration at each outlet decreased sequentially, and the concentration at the same outlet increased with increasing Q1, consistent with experimental expectations. Similarly, for when Q1 was fixed at 5 mL/h, the experimental images are shown in Figure 3h and the normalized results are presented in Figure 3i. At Q2 = 9 mL/h, the fourth outlet displayed the maximum extent of the colorless water compressing the dyed water, while at Q2 = 4 mL/h, the first outlet showed the maximum extent of the dyed water compressing the colorless water. For a given flow rate, the concentration at each outlet decreased sequentially, and the concentration at the same outlet decreased with the increasing Q2, also aligning with the experimental expectations. Furthermore, comparing the concentration differences in Figure 3g,i, it can be observed that fixing Q2 and varying Q1 resulted in larger concentration differences at each outlet, whereas fixing Q1 and adjusting Q2 yielded smaller concentration differences at each outlet. However, within the same experiment, fixing Q1 and varying Q2 enabled the generation of a larger concentration gradient across the four outlets. For future experiments using this chip, fixing Q1 and adjusting Q2 are recommended to achieve significant concentration gradient differences across the four outlets, while fixing Q2 and varying Q1 are preferable for obtaining larger concentration gradients at individual outlets.
In summary, the designed circular concentration gradient generator, validated by fluid pressure-matching simulations, efficiently produced distinct concentration gradients, providing a robust foundation for subsequent experiments.

3.3. Flexible Generation and Analysis of Concentration Gradient Droplets

The interactive functionality of the chip designed in this study was achieved through the bonding of multiple layers of PDMS chips. Specifically, the fluid, after being distributed in the upper PDMS chip, flowed through the channels into the lower PDMS channels to participate in further fluid distribution. This enabled fluid interaction between the layers at the micron level.
In this experiment, a mixture of surfactant RSN-0749 and silicone oil was introduced into the inlet of the upper chip while a red dye solution was injected into inlet 1 of the lower chip and pure water was introduced into inlet 2. It was crucial to follow this sequence: first, the solution from inlet 1 is introduced until the channel is free of air and the solution flows out from inlet 2, ensuring no air enters the channel. Once stable, the oil phase is introduced when the solution flows out from the upper chip inlet, achieving pressure matching after stabilization.
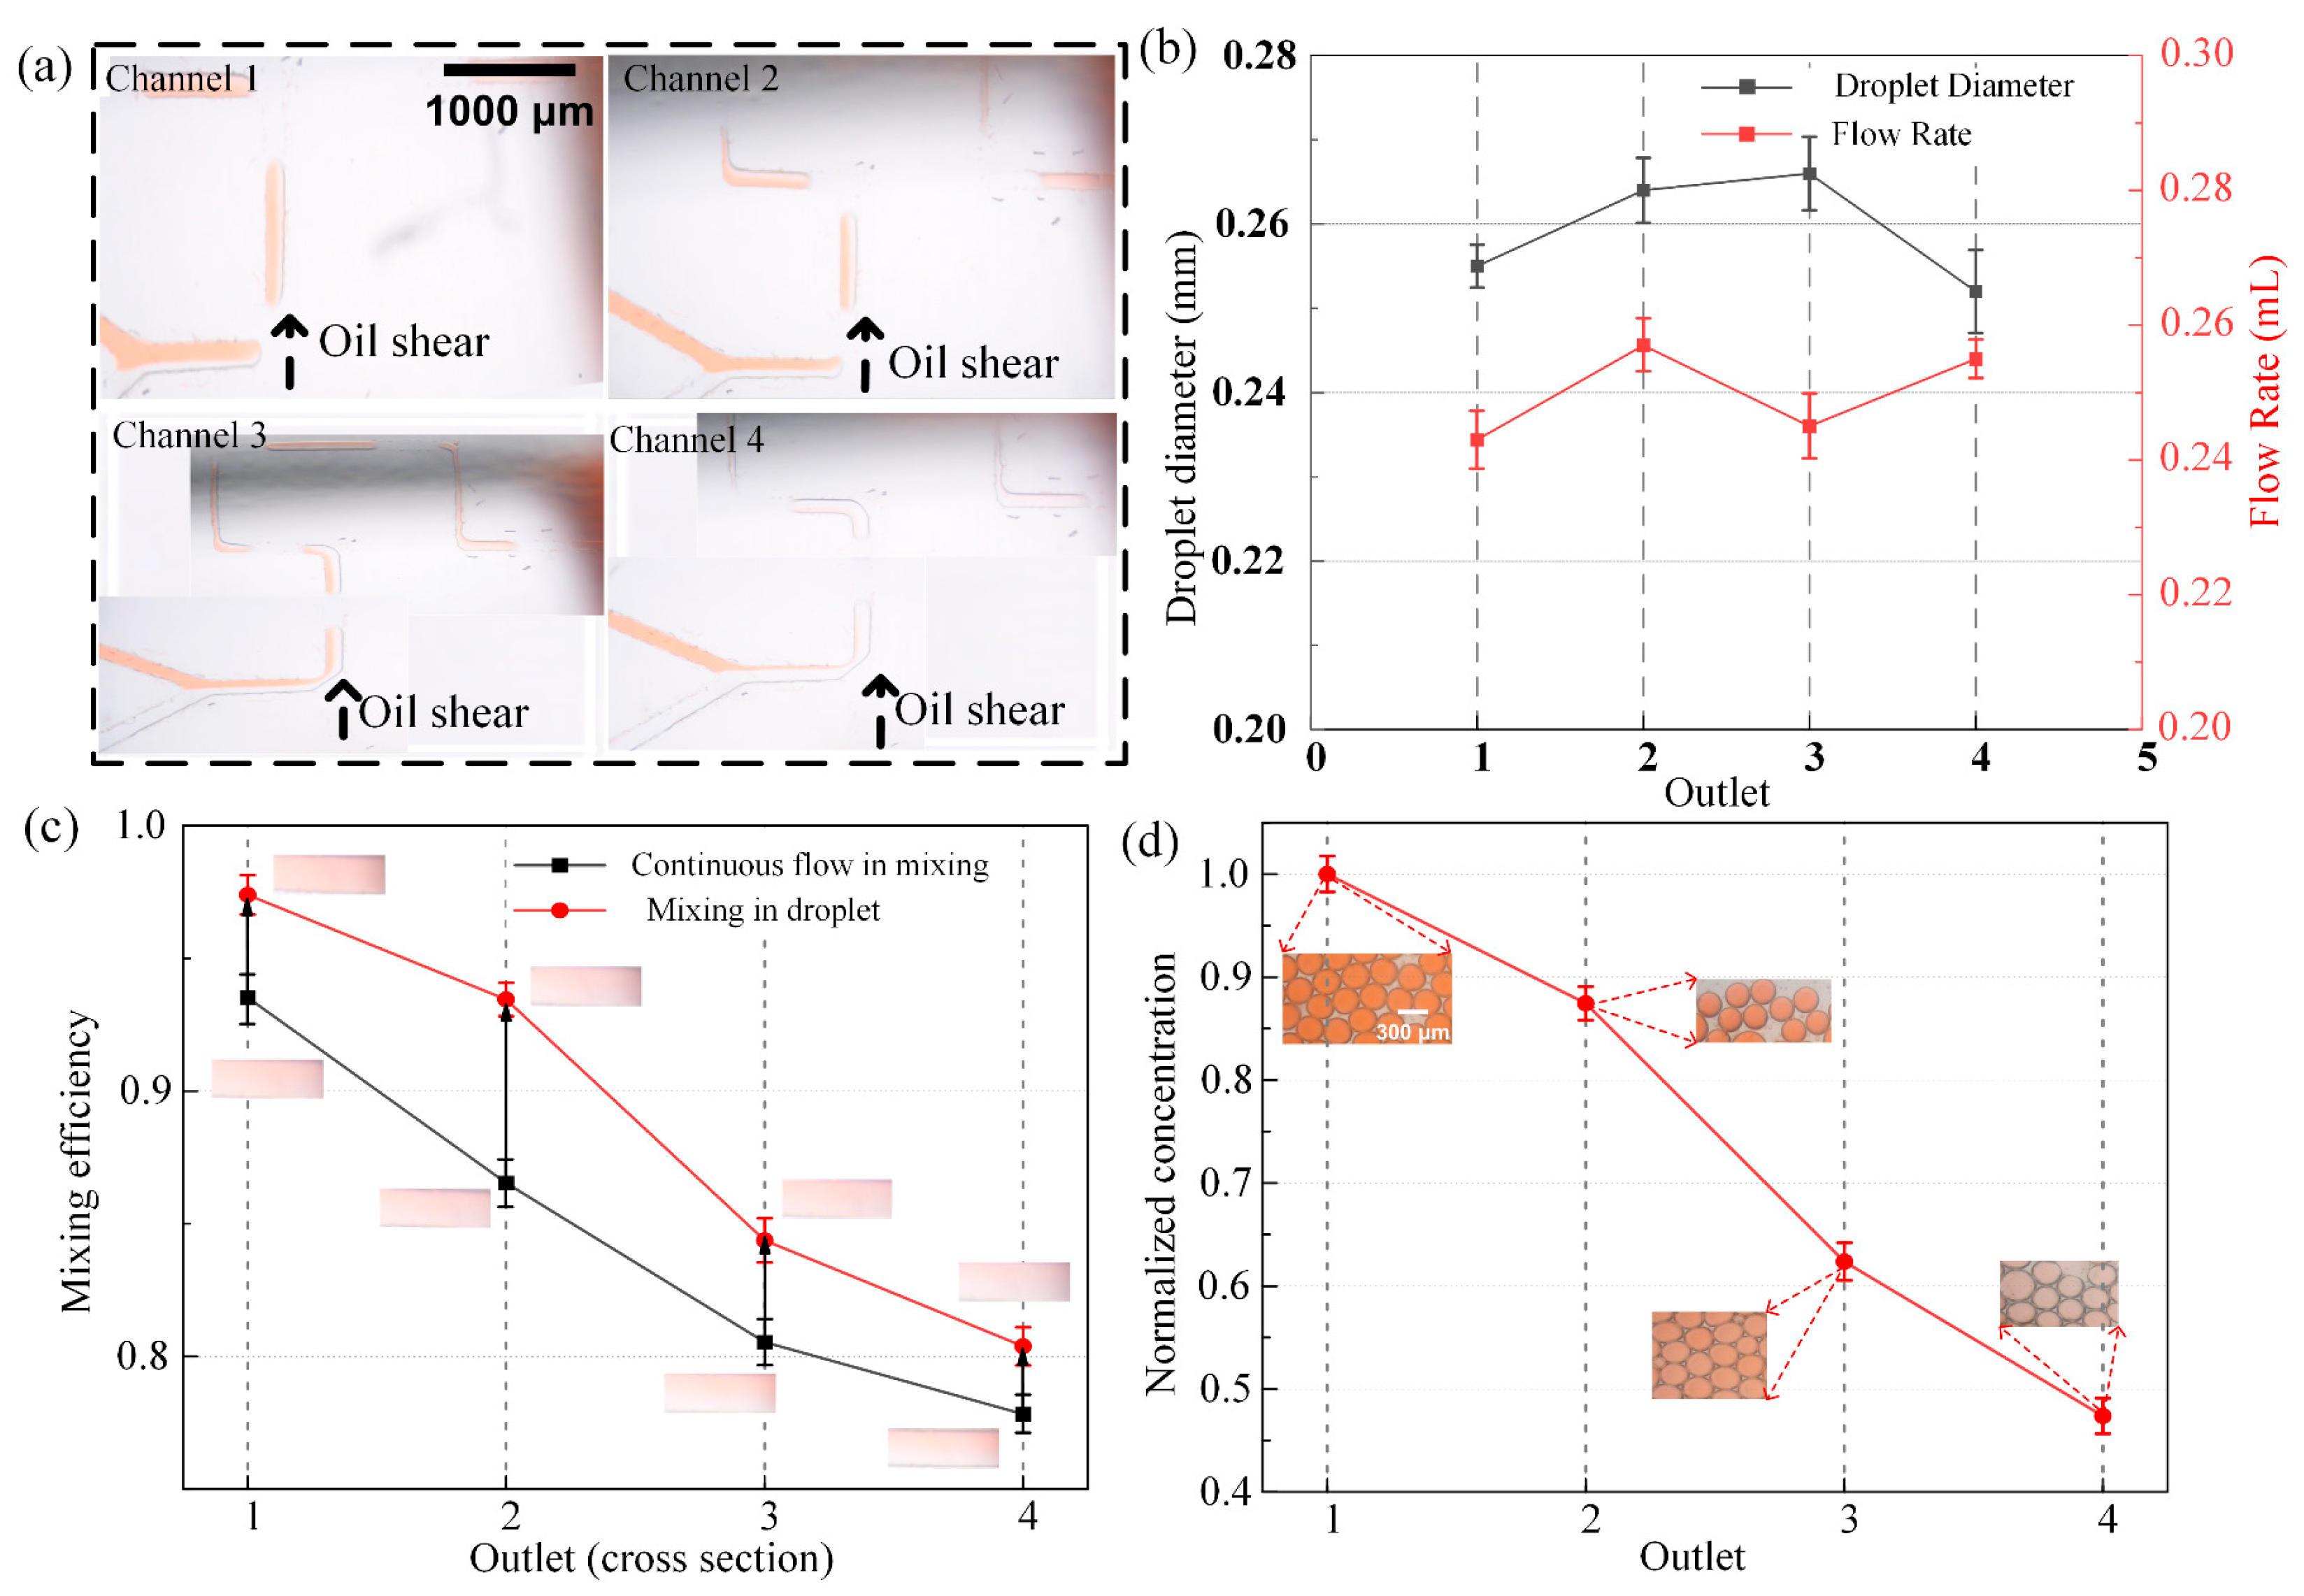
The overall experimental process is illustrated in Figure 4a. It demonstrates that, based on the fluid pressure distribution–recombination mechanism for forming concentration gradients, the mixing process is enhanced by the shearing effect of the oil phase. The two-phase flow is sheared into microdroplets at critical contact points by the oil phase, allowing the two-phase fluids to mix in the form of microdroplets within the serpentine contraction–expansion microchannels. This successfully combines microdroplet generation with the two theoretical principles.
During the experiment, Q1 was fixed at 3 mL/h, Q2 at 9 mL/h, and Qoil at 2 mL/h. The chip was operated under stable conditions for approximately 5 min, and the solutions collected from each outlet exhibited similar flow rates, indicating uniform microdroplet generation with minimal variation in the outlet flow rates, as shown in Figure 4b. Most of the generated microdroplets had inner diameters of approximately 0.26 mm. The concentrations of the collected microdroplets from the corresponding outlets were quantified and compared to the continuous flow condition under the same flow rates, as depicted in Figure 4c. The results show a stable improvement in the mixing efficiency within the microdroplets compared to the continuous flow condition. Figure 4d illustrates the concentration gradient changes across the four outlets. The normalized concentration reveals distinct gradient variations consistent with the theoretical and simulation results. Additionally, the microdroplets generated at each outlet were uniform in size, with no significant differences in diameter, thereby validating the rationality of the pressure-distribution design in the multilayered chip.
With Qoil fixed at 2 mL/h, Q1 and Q2 of the lower chip were adjusted separately, and the results were processed into data and compared with the data obtained under the continuous flow conditions using bar charts, as shown in Figure 5. Within these velocity ranges, the stable generation of microdroplets and effective mixing of components within the droplets were achieved, with the concentration exhibiting a linear relationship with the flow rate. By comparing the concentration differences in Figure 5a,b, it can be observed that when Q2 is fixed, changing Q1 results in significant differences in the concentration gradient at each outlet, whereas when Q1 is fixed, varying Q2 leads to smaller differences in the concentration gradient at each outlet. This further validates the conclusion drawn under continuous flow conditions. Additionally, the small experimental errors indicate that the fluid mixing process is stable and effective, demonstrating the rationality and feasibility of the designed channel.
In previous studies, we utilized a three-fluid micro-mixing technique to achieve concentration gradients in fluids [22]. However, due to the channel structure and the need for separate control of multiple fluids, it could only generate one fluid concentration at a time, resulting in low efficiency. Through practical concentration-gradient experiments conducted on the chip designed in this study, it was demonstrated that this shear flow-driven multilayer microfluidic chip can simultaneously achieve multiple concentration gradients in a single operation and generate microdroplets. This approach addresses the limitations of low throughput and efficiency in the current related research. Moreover, it enables the rapid generation of high-throughput microdroplets while maintaining high mixing efficiency, providing valuable insights for subsequent high-throughput concentration gradient-generation studies.

4. Conclusions

This study presents a novel multilayer microfluidic chip designed to enable flexible and high-throughput generation of concentration gradient droplets through a shear flow-driven partitioning–recombination mechanism. By integrating circular and radial channel networks within bonded polydimethylsiloxane (PDMS) layers, the chip achieved sequential fluid distribution, dynamic recombination, and droplet formation via oil-phase shear forces. Numerical simulations validated the dynamic pressure-driven gradient formation, revealing linear concentration profiles across four outlets under varying flow rates. The experimental results demonstrated that the shear flow conditions significantly enhanced the mixing uniformity and droplet generation efficiency compared to continuous flow operations. By modulating hydrodynamic parameters such as the aqueous- and oil-phase flow rates, the system allows precise control over gradient slopes and droplet sizes, highlighting the intrinsic correlation between flow dynamics and gradient formation. Notably, the elimination of complex channel networks and reliance on external pumps underscore the chip’s scalability and operational simplicity. Furthermore, during the fabrication of the lower PDMS droplet-generation channels in the chip, it was initially challenging to achieve selective hydrophilicity and hydrophobicity in specific regions of the channels, which was essential for ensuring that only the aqueous phase flowed into the hydrophilic sections. To address this issue, we opted to uniformly render the entire channel hydrophobic during the surface treatment process. In subsequent in-depth experiments, the separation of phases can be achieved by leveraging pneumatic pressure-based flow-control mechanisms. These advancements provide a robust framework for optimizing microfluidic systems in applications requiring parallelized gradient generation, such as high-throughput drug screening, combinatorial chemistry, and biomolecular assays. Future work could explore three-dimensional gradient configurations and integration with real-time monitoring technologies to further expand its utility in precision-driven biomedical research.

Author Contributions

Conceptualization, H.S. and H.Y.; methodology, L.Y. and Q.F.; software, Y.W.; validation, L.Y. and L.S.; formal analysis, L.Y.; investigation, Y.W.; resources, H.S.; data curation, Y.C. and Q.F.; writing—original draft preparation, H.S. and L.S.; writing—review and editing, H.Y.; visualization, Y.C. and L.S.; supervision, L.S.; project administration, H.S. All authors have read and agreed to the published version of the manuscript.

Funding

This work is financially supported by the Natural Science Foundation of Jiangsu Province (China) (No. BK20220489) and the National Natural Science Foundation of China (No. 62073230), Jiangsu QingLan Project.

Data Availability Statement

The original contributions presented in this study are included in the article. Further inquiries can be directed to the corresponding authors.

Conflicts of Interest

The authors declare no conflicts of interest.

References

  1. Bacchin, P.; Leng, J.; Salmon, J.-B. Microfluidic Evaporation, Pervaporation, and Osmosis: From Passive Pumping to Solute Concentration. Chem. Rev. 2022, 122, 6938–6985. [Google Scholar] [CrossRef] [PubMed]
  2. Hua, D.; Xiong, R.; Braeckmans, K.; Scheid, B.; Huang, C.; Sauvage, F.; De Smedt, S.C. Concentration Gradients in Material Sciences: Methods to Design and Biomedical Applications. Adv. Funct. Mater. 2021, 31, 2009005. [Google Scholar] [CrossRef]
  3. Yang, D.; Hu, Q.; Zhao, S.; Hu, X.; Gao, X.; Dai, F.; Zheng, Y.; Yang, Y.; Cheng, Y. An Optofluidic System for the Concentration Gradient Screening of Oocyte Protection Drugs. Talanta 2024, 278, 126472. [Google Scholar] [CrossRef]
  4. Shourabi, A.Y.; Kashaninejad, N.; Saidi, M.S. An Integrated Microfluidic Concentration Gradient Generator for Mechanical Stimulation and Drug Delivery. J. Sci. Adv. Mater. Devices 2021, 6, 280–290. [Google Scholar] [CrossRef]
  5. Cardoso, B.D.; Castanheira, E.M.S.; Lanceros-Méndez, S.; Cardoso, V.F. Recent Advances on Cell Culture Platforms for in Vitro Drug Screening and Cell Therapies: From Conventional to Microfluidic Strategies. Adv. Healthc. Mater. 2023, 12, e2202936. [Google Scholar] [CrossRef]
  6. Zhang, Q.; Toprakcioglu, Z.; Jayaram, A.K.; Guo, G.; Wang, X.; Knowles, T.P.J. Formation of Protein Nanoparticles in Microdroplet Flow Reactors. ACS Nano 2023, 17, 11335–11344. [Google Scholar] [CrossRef]
  7. Huang, L.; Yang, D.; Yu, Z.; He, J.; Chen, Y.; Zhou, J. Deep Learning-Aided High-Throughput Screening of Time-Resolved Protein Crystallization on Programmable Microliter-Droplet Systems. Chem. Eng. J. 2022, 450, 138267. [Google Scholar] [CrossRef]
  8. Das, T.K.; Sreedhara, A.; Colandene, J.D.; Chou, D.K.; Filipe, V.; Grapentin, C.; Searles, J.; Christian, T.R.; Narhi, L.O.; Jiskoot, W. Stress Factors in Protein Drug Product Manufacturing and Their Impact on Product Quality. J. Pharm. Sci. 2022, 111, 868–886. [Google Scholar] [CrossRef]
  9. Deng, J.; Zhao, S.; Li, J.; Cheng, Y.; Liu, C.; Liu, Z.; Li, L.; Tian, F.; Dai, B.; Sun, J. One-Step Thermophoretic AND Gate Operation on Extracellular Vesicles Improves Diagnosis of Prostate Cancer. Angew. Chem. Int. Ed. Engl. 2022, 61, e202207037. [Google Scholar] [CrossRef]
  10. Cheng, S.; Li, Y.; Yan, H.; Wen, Y.; Zhou, X.; Friedman, L.; Zeng, Y. Advances in Microfluidic Extracellular Vesicle Analysis for Cancer Diagnostics. Lab Chip 2021, 21, 3219–3243. [Google Scholar] [CrossRef]
  11. Wu, J.; McElroy, W.; Pawliszyn, J.; Heger, C.D. Imaged Capillary Isoelectric Focusing: Applications in the Pharmaceutical Industry and Recent Innovations of the Technology. TrAC Trends Anal. Chem. 2022, 150, 116567. [Google Scholar] [CrossRef]
  12. Ozcan, A.; Perego, C.; Salvalaglio, M.; Parrinello, M.; Yazaydin, O. Concentration Gradient Driven Molecular Dynamics: A New Method for Simulations of Membrane Permeation and Separation. Chem. Sci. 2017, 8, 3858–3865. [Google Scholar] [CrossRef]
  13. Spinnrock, A.; Martens, M.; Enders, F.; Boldt, K.; Cölfen, H. Controlled Preparation of Nanoparticle Gradient Materials by Diffusion. Nanomaterials 2019, 9, 988. [Google Scholar] [CrossRef] [PubMed]
  14. Berthier, E.; Beebe, D.J. Gradient Generation Platforms: New Directions for an Established Microfluidic Technology. Lab Chip 2014, 14, 3241–3247. [Google Scholar] [CrossRef] [PubMed]
  15. Chen, X.; Chen, H.; Wu, D.; Chen, Q.; Zhou, Z.; Zhang, R.; Peng, X.; Su, Y.-C.; Sun, D. 3D Printed Microfluidic Chip for Multiple Anticancer Drug Combinations. Sens. Actuators B Chem. 2018, 276, 507–516. [Google Scholar] [CrossRef]
  16. Xu, B.-Y.; Hu, S.-W.; Qian, G.-S.; Xu, J.-J.; Chen, H.-Y. A Novel Microfluidic Platform with Stable Concentration Gradient for on Chip Cell Culture and Screening Assays. Lab Chip 2013, 13, 3714–3720. [Google Scholar] [CrossRef]
  17. Wang, X.; Liu, Z.; Pang, Y. Concentration Gradient Generation Methods Based on Microfluidic Systems. RSC Adv. 2017, 7, 29966–29984. [Google Scholar] [CrossRef]
  18. Hu, C.; Liu, J.; Chen, H.; Nie, F. Microfluidic Platforms for Gradient Generation and Its Applications. Biochem. Anal. Biochem. 2017, 06, 2161. [Google Scholar] [CrossRef]
  19. Tang, M.; Huang, X.; Chu, Q.; Ning, X.; Wang, Y.; Kong, S.-K.; Zhang, X.; Wang, G.; Ho, H.-P. A Linear Concentration Gradient Generator Based on Multi-Layered Centrifugal Microfluidics and Its Application in Antimicrobial Susceptibility Testing. Lab Chip 2018, 18, 1452–1460. [Google Scholar] [CrossRef]
  20. Qi, X.; Zhou, Q.; Li, X.; Hu, G. Generation of Multiple Concentration Gradients Using a TwoDimensional Pyramid Array. Anal. Chem. 2023, 96, 856–865. [Google Scholar] [CrossRef]
  21. Hong, B.; Xue, P.; Wu, Y.; Bao, J.; Chuah, Y.J.; Kang, Y. A Concentration Gradient Generator on a Paper-Based Microfluidic Chip Coupled with Cell Culture Microarray for High-Throughput Drug Screening. Biomed. Microdevices 2016, 18, 21. [Google Scholar] [CrossRef] [PubMed]
  22. Sun, H.; Wu, Y.; Feng, Q.; Qiu, X.; Sun, L.; Yang, H. Rapid In-Droplet Tri-Fluid Micromixing and Concentration Gradient Generation for Nanoparticle Synthesis. Colloids Surf. A Physicochem. Eng. Asp. 2025, 708, 135983. [Google Scholar] [CrossRef]
  23. Ebadi, M.; Moshksayan, K.; Kashaninejad, N.; Saidi, M.S.; Nguyen, N.-T. A Tool for Designing Tree-like Concentration Gradient Generators for Lab-on-a-Chip Applications. Chem. Eng. Sci. 2020, 212, 115339. [Google Scholar] [CrossRef]
  24. Rismanian, M.; Saidi, M.S.; Kashaninejad, N. A New Non-Dimensional Parameter to Obtain the Minimum Mixing Length in Tree-like Concentration Gradient Generators. Chem. Eng. Sci. 2019, 195, 120–126. [Google Scholar] [CrossRef]
  25. Wang, S.; Chen, X. Simulation and Experimental Investigation on Tree Concentration Gradient Generator with U-Shape Microchannel. Microsyst. Technol. 2019, 25, 1111–1119. [Google Scholar] [CrossRef]
  26. An, R.; Minerick, A.R. Reaction-Free Concentration Gradient Generation in Spatially Nonuniform AC Electric Fields. Langmuir 2022, 38, 5977–5986. [Google Scholar] [CrossRef]
  27. Wu, Y.; Hu, B.; Ma, X.; Zhang, H.; Li, W.; Wang, Y.; Wang, S. Generation of Droplets with Adjustable Chemical Concentrations Based on Fixed Potential Induced-Charge Electro-Osmosis. Lab Chip 2022, 22, 403–412. [Google Scholar] [CrossRef]
  28. Im, Y.; Kim, S.; Park, J.; Sung, H.J.; Jeon, J.S. Antibiotic Susceptibility Test under a Linear Concentration Gradient Using Travelling Surface Acoustic Waves. Lab Chip 2021, 21, 3449–3457. [Google Scholar] [CrossRef]
  29. Destgeer, G.; Im, S.; Ha, B.H.; Jung, J.H.; Ansari, M.A.; Sung, H.J. Adjustable, Rapidly Switching Microfluidic Gradient Generation Using Focused Travelling Surface Acoustic Waves. Appl. Phys. Lett. 2014, 104, 023506. [Google Scholar] [CrossRef]
  30. Kong, M.C.R.; Salin, E.D. Pneumatically pumping fluids radially inward on centrifugal microfluidic platforms in motion. Anal. Chem. 2010, 82, 8039–8041. [Google Scholar] [CrossRef]
  31. Hess, J.F.; Zehnle, S.; Juelg, P.; Hutzenlaub, T.; Zengerle, R.; Paust, N. Review on pneumatic operations in centrifugal microfluidics. Lab Chip 2019, 19, 3745–3770. [Google Scholar] [CrossRef] [PubMed]
  32. Skafte-Pedersen, P.; Sabourin, D.; Dufva, M.; Snakenborg, D. Multi-channel peristaltic pump for microfluidic applications featuring monolithic PDMS inlay. Lab Chip 2009, 9, 3003–3006. [Google Scholar] [CrossRef]
  33. Lee, W.B.; Chien, C.C.; You, H.L.; Kuo, F.C.; Lee, M.S.; Lee, G.B. An integrated microfluidic system for antimicrobial susceptibility testing with antibiotic combination. Lab Chip 2019, 19, 2699–2708. [Google Scholar] [CrossRef]
  34. Wu, Z.; Yang, H.; Xu, H.; Dai, W.; Xu, L.; Du, H.; Zhang, D. A Review on the Development and Application of Microfluidic Concentration Gradient Generators. Phys. Fluids 2024, 36, 072014. [Google Scholar] [CrossRef]
  35. Sun, H.; Ren, Y.; Tao, Y.; Jiang, T.; Jiang, H. Three-Fluid Sequential Micromixing-Assisted Nanoparticle Synthesis Utilizing Alternating Current Electrothermal Flow. Ind. Eng. Chem. Res. 2020, 59, 12514–12524. [Google Scholar] [CrossRef]
  36. Feng, X.; Ren, Y.; Sun, H.; Chen, X.; Zhang, K.; Jia, Y.; Hou, L.; Xiao, M.; Jiang, H. Effect of Vortex on Mass Transport and Mixing in Microcapillary Channels. Chem. Eng. J. 2019, 362, 442–452. [Google Scholar] [CrossRef]
  37. Cabaleiro, J.M. Flowrate Independent 3D Printed Microfluidic Concentration Gradient Generator. Chem. Eng. J. 2020, 382, 122742. [Google Scholar] [CrossRef]
  38. Feng, X.; Ren, Y.; Jiang, H. An Effective Splitting-and-Recombination Micromixer with Self-Rotated Contact Surface for Wide Reynolds Number Range Applications. Biomicrofluidics 2013, 7, 54121. [Google Scholar] [CrossRef] [PubMed]
  39. Hadjigeorgiou, A.G.; Boudouvis, A.G.; Kokkoris, G. Thorough Computational Analysis of the Staggered Herringbone Micromixer Reveals Transport Mechanisms and Enables Mixing Efficiency-Based Improved Design. Chem. Eng. J. 2021, 414, 128775. [Google Scholar] [CrossRef]
  40. Sun, H.; Li, Z.; Wu, Y.; Fan, X.; Zhu, M.; Chen, T.; Sun, L. Analysis of Sequential Micromixing Driven by Sinusoidally Shaped Induced-Charge Electroosmotic Flow. Micromachines 2022, 13, 1985. [Google Scholar] [CrossRef]
  41. Zhang, K.; Ren, Y.; Hou, L.; Tao, Y.; Liu, W.; Jiang, T.; Jiang, H. Continuous Microfluidic Mixing and the Highly Controlled Nanoparticle Synthesis Using Direct Current-Induced Thermal Buoyancy Convection. Microfluid. Nanofluid. 2020, 24, 1. [Google Scholar] [CrossRef]
  42. Yuan, S.; Jiang, B.; Peng, T.; Zhou, M.; Drummer, D. Investigation of Efficient Mixing Enhancement in Planar Micromixers with Short Mixing Length. Chem. Eng. Process. 2022, 171, 108747. [Google Scholar] [CrossRef]
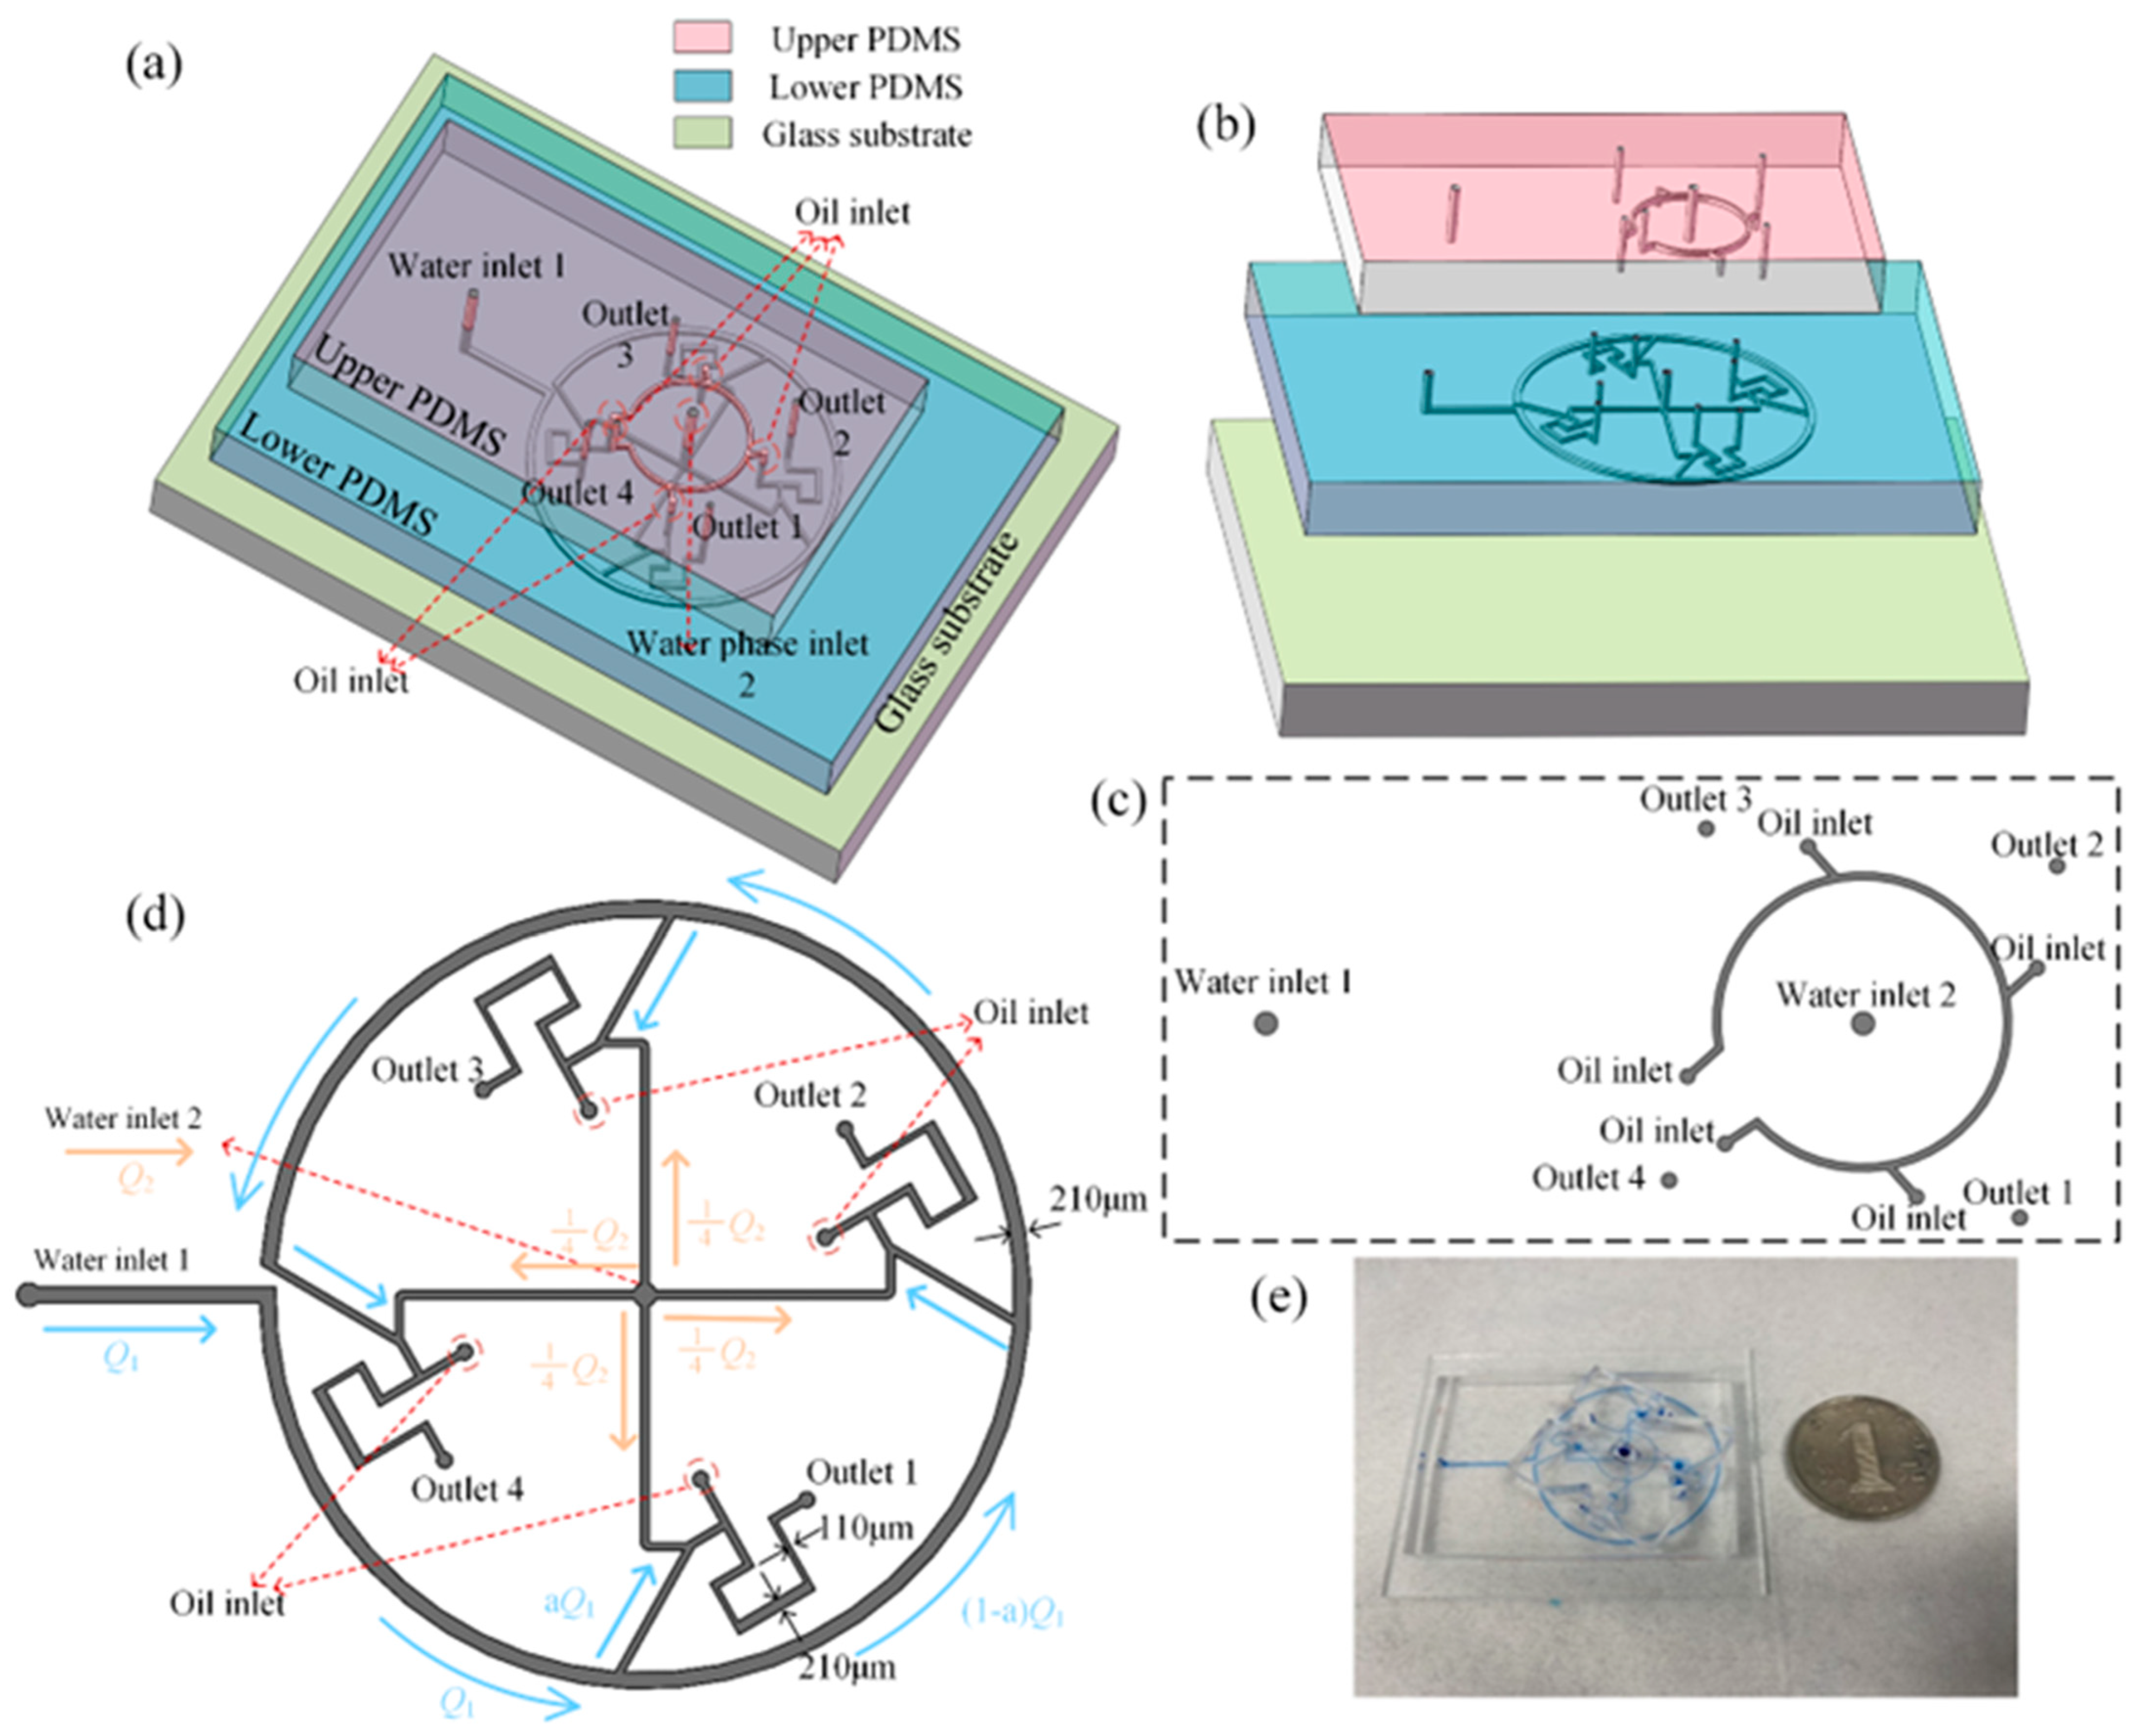
Figure 1. Schematic diagram of the microfluidic chip device. (a) Three-dimensional view of the two-layer chip. (b) Exploded view of the chip assembly. (c) Schematic of the upper layer chip channels. (d) Schematic of the lower layer chip channels. (e) Picture of the actual chip.
Symmetry 17 00826 g001
Figure 2. Illustrations of the simulated concentration gradient of the chip under a fixed flow rate at inlet 2. (a) The flow rate at aqueous inlet 1 is 1 mL/h. (b) The flow rate at aqueous inlet 1 is 4 mL/h. (c) The flow rate at aqueous inlet 1 is 7 mL/h. (d) A comparison of the final concentrations at each outlet under the three flow rates.
Symmetry 17 00826 g002
Figure 3. Comparison of actual flow rate variations in the chip. (a) Concentration distributions at each outlet under specific flow rates. (b) Critical-contact regions in each channel under specific flow rates. (c) Actual generation of the concentration gradient. (d) Comparison of experimental and simulated concentration gradients under specific flow rates. (e) Final collection and comparison of solutions. (f) Fixed Q2 with adjusted Q1. (g) Experimental results with fixed Q2 and adjusted Q1. The different colored blocks in the diagram correspond to the variations in concentration gradients at the four outlets as a result of altering Q1. (h) Fixed Q1 with adjusted Q2. (i) Experimental results with fixed Q1 and adjusted Q2. The different colored blocks in the diagram correspond to the variations in concentration gradients at the four outlets as a result of altering Q2.
Symmetry 17 00826 g003
Figure 4. Experimental results and analysis of rapid generation of concentration-gradient microdroplets. (a) Experimental image of the critical-contact region under shearing conditions. (b) Analysis of other parameters under specific flow rates in shearing conditions. (c) Comparison of mixing efficiency between continuous and shearing conditions. (d) Normalized concentration analysis under specific flow rates in shearing conditions.
Symmetry 17 00826 g004
Figure 5. Experimental results of concentration gradient generation under shear and continuous conditions. (a) Comparison of concentrations at four outlets under shear and continuous conditions with Q2 fixed. (b) Comparison of concentrations at four outlets under shear and continuous conditions with Q1 fixed.
Symmetry 17 00826 g005
Disclaimer/Publisher’s Note: The statements, opinions and data contained in all publications are solely those of the individual author(s) and contributor(s) and not of MDPI and/or the editor(s). MDPI and/or the editor(s) disclaim responsibility for any injury to people or property resulting from any ideas, methods, instructions or products referred to in the content.