Abstract
Electrocardiogram (ECG) interpretation using deep learning models holds immense potential for improving cardiac diagnosis. However, existing models often suffer from overconfident predictions and lack the capability to directly quantify uncertainty, leading to unreliable clinical guidance. To address this challenge, we propose a model for uncertainty-aware ECG interpretation. The model employs a deep convolutional architecture with max-pooling residual modules to capture both local and global spatiotemporal features from raw ECG signals. The architectural design respects the symmetry inherent in ECG waveforms—such as periodicity and morphological consistency across cardiac cycles—enabling the network to extract clinically relevant features more effectively. Then, unlike conventional models that rely on softmax-based probability outputs, our approach parameterizes class distributions using the Dirichlet distribution, while Subjective Logic translates these parameters into interpretable belief masses and uncertainty scores. We evaluate the model on the PhysioNet Challenge 2017 dataset, our model achieves an accuracy of 86.12%, an F1 score of 83.14%, a Precision-Recall Area Under the Curve (PR-AUC) of 85.25%, and a Receiver Operating Characteristic Area Under the Curve (ROC-AUC) of 92.87%—outperforming baseline models in three out of four metrics. Critically, the model reduces overconfidence to 0.59% (compared to 12–22% in softmax-based baselines), aligning prediction confidence with true accuracy. By progressively increasing the uncertainty threshold u, the model dynamically filters low-confidence predictions, leading to consistently improved performance—reaching up to 93.59% accuracy, 93.22% F1 score, 89.17% PR-AUC, and 95.10% ROC-AUC at u = 0.1. These results validate the model’s capacity for reliable ECG interpretation while leveraging physiological signal symmetry for enhanced feature extraction.
1. Introduction
Cardiovascular diseases (CVDs), including arrhythmias, premature atrial contractions, atrial fibrillation, myocardial infarction, and congestive heart failure, significantly impact global health by increasing morbidity, mortality, and economic costs. According to Roth et al. [1], CVDs remain the leading cause of death worldwide, with their burden continuing to rise over the past decades. Early detection of these conditions is crucial for mitigating their adverse effects and improving patient outcomes.
The electrocardiogram (ECG) records the heart’s physiological activities over time. It gives key insights into cardiac health. Accurate ECG data interpretation is important for diagnosing cardiac conditions [2]. Accurate ECG signal deciphering requires cardiologists’ analytical expertise and careful attention. But these skills differ a lot among cardiologists and may decline when one cardiologist has more ECG readings. Automated ECG data interpretation is a good way to overcome these limitations.
Historically, automated ECG interpretation relied on diagnostic gold standards. This two-stage process involved human experts initially engineering pertinent features from raw ECG data—referred to as “expert features”—and subsequently applying decision rules or machine learning techniques to generate diagnostic outcomes [3,4,5]. However, data quality and limited human expert knowledge often restricted these methods [6,7]. Recent algorithmic progress has changed this situation. Deep learning models have demonstrated significant capabilities in learning complex patterns from data and offer adaptable processing architectures. They eliminate the need for manual feature extraction by human experts. Convolutional Neural Networks (CNNs) [8] and Recurrent Neural Networks (RNNs) [9] are two prominent deep learning frameworks. Both models, along with their variations—such as attention mechanisms [10] and residual modules [11]—have been applied to ECG interpretation with promising, and in some cases, state-of-the-art results [12,13,14,15,16,17,18].
Despite their outstanding performance, the outputs (interpretations) of computational models serve merely as references within the constraints of current regulatory and ethical frameworks. Thus, providing accurate prediction confidence for these interpretations is as important as overall predictive performance. This is because it enables cardiologists to evaluate the reliability of machine-generated interpretations and make timely and appropriate decisions. Unfortunately, this aspect is frequently overlooked by existing models. Current models typically consist of multiple feature extraction layers followed by a softmax output layer. The softmax layer assigns probabilities to the predefined classes, with the sum of probabilities being 1. These probabilities are interpreted as the model’s confidence scores. But softmax tends to inflate the probability assigned to the predicted class [19,20,21]. This issue is particularly critical in clinical applications, where misaligned confidence scores may result in inappropriate reliance on automated outputs, potentially compromising patient safety. Leibig et al. [22] demonstrated that softmax-based models exhibit >20% overconfidence on ambiguous medical images, despite achieving only 70% accuracy.
In addition, the current ECG analysis models face another key limitation: they cannot say “I am not sure” like human cardiologists. When dealing with unclear ECG patterns, standard models may produce confidence scores that are nearly indistinguishable across multiple diagnostic categories. This indicates that the models lack sufficient discriminative capacity to handle ambiguous cases. But, even then, they select the class associated with the marginally higher confidence score as the final prediction. Such forced predictions are of limited value in clinical practice, as they reflect algorithmic constraints rather than informed medical judgment. An improved system would emulate clinical reasoning by deferring judgment or indicating uncertainty when evidence is insufficient.
The aforementioned limitations render deep learning-based ECG interpretations clinically unreliable. To address these challenges, this study presents a reliable deep learning model for ECG interpretation. The proposed model first extracts high-level features from raw ECG data using multiple convolutional layers with max-pooling shortcut connections, enabling abstraction while preserving critical waveform dynamics information. Importantly, the model architecture is designed to exploit the symmetry and periodic structure inherent in ECG signals—such as repeating waveforms across cardiac cycles—which enhances the robustness of learned features and ensures consistency in temporal pattern recognition. These features are then used to estimate Dirichlet distribution parameters, which serve as support for classes via evidence. Finally, a belief function framework based on Subjective Logic is applied to these Dirichlet parameters, yielding explicit uncertainty quantification. Our model offers two key advantages: (1) prediction confidence derived from Dirichlet parameters inherently mitigates softmax-induced probability inflation, and (2) comprehensive uncertainty estimation is achieved without requiring additional labeled data.
Our model was evaluated using the publicly available dataset—PhysioNet Challenge 2017. It achieved 86.12% accuracy, 83.14% F1 score, 85.25% PR-AUC, and 92.87% ROC-AUC. Moreover, the model significantly reduces overconfidence, with an overconfidence (OC) score of 0.59%, in contrast to the 12–22% typically observed in baseline models. When low-confidence predictions are filtered out, the model demonstrates improved performance, achieving accuracy, F1, PR-AUC, and ROC-AUC of 93.59%, 93.27%, 89.17%, and 95.10%, respectively. These results highlight the model’s ability to detect uncertain cases, thereby supporting more targeted expert evaluation.
2. Related Work
2.1. Deep Learning in ECG Interpretation
The application of deep learning techniques has significantly advanced automated ECG interpretation, enabling models to learn complex temporal and morphological patterns directly from raw signals. Hannun et al. [12] developed a CNN-based model that achieved cardiologist-level performance in classifying 12 rhythm classes using over 90,000 single-lead ECG recordings. Li et al. [13] introduced a cascaded CNN architecture for ECG-based biometric identification, enhancing recognition accuracy. Additionally, Li et al. [16] developed a CNN model with channel-wise attention for automated heartbeat classification, improving the model’s focus on relevant signal features.
RNNs have also been employed for arrhythmia classification. Schwab et al. [14] proposed an RNN-based model that utilized heartbeat segmentation and attention to classify arrhythmias. Similarly, Liu et al. [15] combined Symbolic Aggregate Approximation with Long Short-Term Memory (LSTM) networks for heart disease classification, demonstrating improved accuracy and reduced response time compared to baseline techniques.
2.2. Uncertainty Estimation in ECG Classification
Although deep neural networks have shown remarkable success in ECG classification tasks, they typically lack mechanisms for uncertainty quantification, which limits their trustworthiness in high-stakes clinical decision-making. To address this limitation, several studies have explored Bayesian Neural Networks (BNNs) and ensemble methods.
BNNs introduce probabilistic modeling by learning distributions over network weights, enabling the estimation of epistemic uncertainty. Zhang et al. [23] proposed a deep BNN that incorporated a rejection mechanism to identify uncertain cardiac arrhythmia predictions, enabling safer deployment in practice. Similarly, Li et al. [24] used bidirectional LSTM networks enhanced by Bayesian optimization to improve both performance and robustness in ECG classification. Another noteworthy contribution comes from Islam et al. [25], who introduced an uncertainty-aware ECG classification framework based on CNN with Monte Carlo Dropout (MCD). By applying MCD at inference time, the model approximated Bayesian inference and estimated predictive uncertainty, thereby increasing trust in automated diagnoses.
Ensemble methods, which aggregate predictions from multiple models, offer an alternative approach to uncertainty estimation. Essa et al. [26] proposed an ensemble of deep learning-based multi-model for ECG heartbeat arrhythmia classification, demonstrating improved performance over individual models. Additionally, Alsayat et al. [27] developed a deep learning ensemble approach for precise ECG image classification, highlighting the effectiveness of combining multiple CNN architectures to enhance diagnostic accuracy.
A common limitation of both BNNs and ensemble-based methods is their reliance on the variability of multiple predictions to quantify uncertainty. This approach assumes that the spread of predicted probabilities accurately reflects the model’s confidence. However, standard DNNs often utilize softmax outputs to represent predictive probabilities, which can lead to overconfident predictions. This overconfidence undermines the reliability of uncertainty estimates derived from such probabilistic outputs in ECG automated interpretation [28].
2.3. Dirichlet-Based Uncertainty Modeling in Deep Learning
The Dirichlet distribution has been increasingly utilized in deep learning to enhance uncertainty quantification in classification tasks. Sensoy et al. [19] introduced Evidential Deep Learning, modeling class probabilities as Dirichlet distributions to capture both aleatoric and epistemic uncertainties without relying on Bayesian inference. Wu et al. [29] further advanced this approach by employing Dirichlet mixture models to approximate complex uncertainty distributions, enabling the construction of credible intervals for classification probabilities. Additionally, Hobbhahn et al. [30] developed a method to approximate softmax outputs with Dirichlet distributions, facilitating efficient uncertainty estimation in large-scale neural networks. These studies collectively demonstrate the efficacy of Dirichlet-based methods in providing reliable uncertainty estimates, particularly in safety-critical applications such as medical diagnostics.
3. Materials and Methods
In this section, we delineate the model design. As illustrated in Figure 1, the model is composed of two primary components: Feature Extraction and Prediction & Estimation (PE). The Feature Extraction part, detailed in Section 2.1, is responsible for deriving high-level representations from input ECG data, while the PE component, described in Section 2.2, generates the predicted probability over classes and uncertainty according to these representations. To enhance model performance on the task, three types of loss are introduced, as detailed in Section 2.3.
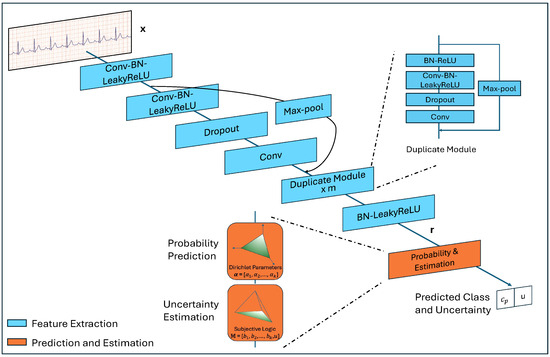
Figure 1.
The architecture of the proposed model.
3.1. Feature Extraction
To extract high-level abstract features from input ECG data, we developed a deep neural network, building upon the previous work [12]. The network includes multiple convolutional layers and max-pool shortcut connections.
Each convolutional layer is followed by Batch Normalization (BN), Leaky Rectified Linear Unit (LeakyReLU) activation, and Dropout (the first and the last one do not include Dropout), and each shortcut connects the modules preceding two convolutional layers to the ones following them. Due to this structure, the depth of the model can be adapted according to the computation limit and data complexity, but the ratio between the two module types must be maintained at 2l + 1 to l, where . When , repeated structures appear in the network. To improve clarity, we use the label ‘Duplicated Module’ in Figure 1 to represent this structure. The number of such modules is , .
The convolutional layers have a filter width of w and n filters, every other shortcut performs subsampling by a factor of two. Stride s is a hyper-parameter, and padding is set as valid.
Given an input and a network with 2l + 1 convolutional layers and l shortcut connections, we will get a corresponding representation , .
3.2. Probability Prediction and Uncertainty Estimation
At this stage, let us assume there are K types of cardiac abnormalities. Traditional deep learning models apply a transformation followed by a softmax function to the low-dimensional representation to derive the probabilities across the K classes, , where denotes the predicted probability of class i. The class with the highest probability is then selected as the output. These probabilities are typically interpreted as the model’s confidence in its predictions.
However, this confidence is often artificially inflated. First, the exponentiation in the softmax function can greatly amplify differences between class probabilities, far more than the original values would warrant. Conversely, for excessively noisy or complex ECG readings, the prediction may effectively be a random guess—where true certainty is absent, yet the output probability remains near . Both situations can result in overconfident but incorrect predictions.
Mathematically, class probabilities can be represented as the parameters of a multinomial distribution, which characterizes the likelihood of mutually exclusive events [31]. The Dirichlet distribution, often considered the conjugate prior of the multinomial distribution, provides a predictive distribution for these probabilities [32]. For the class classification task, the Dirichlet distribution, parameterized by , serves as a probabilistic model by:
where is the K-dimensional multinomial beta function and is the dimensional unit simplex, defined as:
Figure 2 visually depicts various Dirichlet distributions with varying parameter values over possible outcomes.
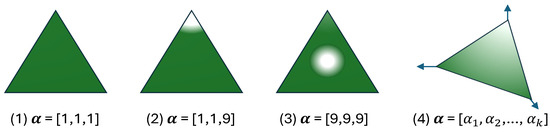
Figure 2.
The probability density function of the Dirichlet distribution over possible outcomes [21,31,33,34]. (1) corresponds to high uncertainty (uniform probability across 3 classes); (2) reflects low uncertainty (high confidence in the third class); (3) indicates high certainty with uniform probabilities; (4) represent k outputs.
Once the parameters of this distribution are calculated, the probability of class i is ascertained by , which is not subject to the amplification effect. Moreover, all Dirichlet parameters are non-negative [35], they can be interpreted as the belief mass through evidence for each corresponding singleton within Subjective Logic (SL) [36].
In the classification context with K mutually exclusive classes, SL defines a subjective opinion as a set of belief masses and an uncertainty mass u, satisfying:
where and . The quantifies the degree of support for class i, and u indicates the uncertainty across all classes.
The concept of belief mass is equivalent to evidence in evidential deep learning frameworks [37]. Evidence refers to non-negative values produced by the model, indicating the strength of support for each class. For , the model outputs a vector , where each corresponds to the evidence associated with the i-th class. It happens to align with the Dirichlet parameters .
While it may seem intuitive to set , this leads to when , potentially causing the Dirichlet distribution to degenerate toward the corners of the simplex. Such degeneration introduces numerical instabilities, including division-by-zero errors during training. To address this, we follow the approach in [37], defining . This formulation ensures , thereby maintaining a weak uniform prior and improving numerical stability in both parameter learning and uncertainty estimation. The belief and the uncertainty u are computed as follows:
The collective set of belief masses and uncertainty mass u constitutes a subjective opinion, formally denoted as . As illustrated in Figure 3, this representation visualizes a subjective opinion over K mutually exclusive outcomes, where quantifies the evidence for the i-th class, and u captures the overall uncertainty inherent in the classification decision.
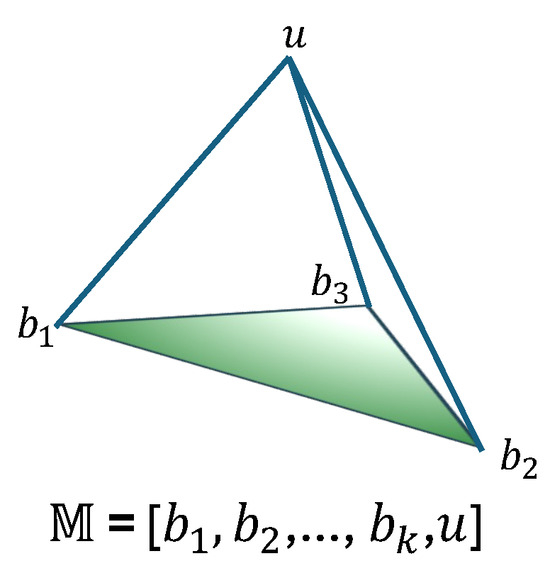
Figure 3.
A subjective opinion with K outcomes and overall uncertainty [21].
Based on the above formulation, the Dirichlet parameters are obtained from the learned representation through a linear transformation followed by a non-linear activation. Specifically, we define:
where is a learnable weight matrix. The function ensures the non-negativity of the output. We adopt LeakyReLU as the activation function in our implementation. The addition of 1 guarantees that all , which stabilizes training and avoids degenerate distributions.
3.3. Optimization Objectives
The proposed model is first trained to align its predicted probabilities with the ground truth labels. To this end, cross-entropy loss is employed. The model estimates the associated Dirichlet distribution based on . The cross-entropy loss is then computed using the Dirichlet parameters and the ground truth label , where is a one-hot vector such that indicates the ground-truth class, as defined by the following Equation [19]:
where is the digamma function.
Ideally, the parameter for should be equal to 1 to prevent the generation of misleading parameters for incorrect classes. To achieve this, divergence is used to quantify the discrepancy between the estimated parameters and the ideal ones, which is incorporated as a loss term. To penalize incorrect predictions without negatively impacting the correct class, the divergence loss for is computed as follows:
where = , representing the Dirichlet parameters after excluding the non-misleading components from the predicted parameters of ; denotes a vector of ones of length K; denotes the uniform Dirichlet distribution; is the gamma function; and is the digamma function.
Finally, to reduce the risk of overfitting, we apply regularization to the trainable parameters of the network. The total loss for a training set with N samples is computed by summing the individual losses for each sample:
where is the regularization term, denotes the parameters of the network, and and are hyper-parameters that balance the divergence loss and regularization, respectively. To prevent the model from overemphasizing the divergence loss at the early stages of training–which could lead to inadequate exploration of the parameter space and produce an almost flat uniform distribution [38], we incrementally increase in training.
3.4. Source of Data and Preprocssing
We conducted all experiments using publicly accessible ECG data from PhysioNet Challenge 2017 databases [39]. The dataset contains 8528 de-identified ECG recordings, including 5076 Normal, 758 AF, 2415 Other, and 279 Noisy. These recordings range from 9 s to just over 60 s in duration and were sampled at 300 Hz using the AliveCor device. The summary statistics of the dataset are presented in Table 1.

Table 1.
Data profile of PhysioNet Challenge 2017 dataset.
The Noisy category refers to recordings that are unreadable even to cardiologists upon visual inspection. Such recordings would not be used for diagnosis in a clinical setting. Furthermore, research and guidelines [40,41] indicate that ECG recordings typically need to last at least 30 s to be suitable for diagnostic monitoring. To better reflect real clinical conditions, we exclude the Noisy class and any recordings with a duration of less than 30 s. Additionally, to facilitate computation, we standardize the length of all recordings by retaining only 30-s segments.
We randomly split the data into 75% for training, 10% for validation, and 15% for testing. To ensure all classes are represented in each subset, the split is performed independently within each class. Each recording undergoes Butterworth band-pass filtering and Z-score normalization to mitigate the effects of power line interference, baseline drift, and variations in signal amplitude. To address class imbalance, we apply upsampling to the training set.
3.5. Baseline Models
We compared the proposed model with the following models:
- PCNN: The model architecture is adapted from [42], with multiple convolutional layers applied sequentially to the ECG recordings, utilizing shared weights across the layers. The kernel size of the convolutional layers is progressively halved from the initial to the final layer, making the features stacked like a ’pyramid’. Each convolutional layer is followed by an activation function, batch normalization, max-pooling and dropout. A fully connect layer and softmax layer are used for prediction.
- SE-PCNN: We integrated an attention mechanism into the PCNN by calculating the weights across different channels in each convolutional layer, following the Squeeze-and-Excitation approach [43].
- RNN: The bi-directional GRU is utilized to extract features from ECG samples, followed by a batch normal layer, a fully connected layer and a softmax layer applied to the top hidden layer.
- AttRNN: Based on RNN, with attention [44].
- PCRNN: We modified the architecture presented in [45] by substituting the original convolutional structure with that of the PCNN and replacing the LSTM structure with the GRU used in RNN. Batch normal layer, dense layer and softmax layer are the same as RNN.
- AttPCRNN: Based on PCRNN, with attention [44].
- MP-ResNet: The model is adapted from [12] and is composed of multiple convolutional layers, each followed by batch normalization, activation, and dropout layers. Every two convolutional layers are linked by a residual connection implemented via max pooling. The model concludes with a dense layer and a softmax layer. Additionally, we tried incorporating attention module and RNN module into this model, there was no significant change in the performance.
3.6. Implementation Details
We conducted a grid search for the following hyper-parameter settings, taking into account our computational constraints and the data complexity.
The proposed model consists of 15 convolutional layers with a filter size of 64. The corresponding number of filters for each layer is [12, 12, 12, 12, 12, 24, 24, 24, 24, 48, 48, 48, 48, 96, 96]. The coefficient , where t denotes the current training epoch, is gradually increased from 0 to 1. The hyper-parameters for MP-ResNet match those of the proposed model. The PCNN, SE-PCNN, PCRNN, and AttPCRNN models each include four convolutional layers. The filter size for the first convolutional layer is set to 64, and it is halved in each subsequent layer. The number of filters is fixed at 64, with a stride of 2; both pooling size and pooling stride are also set to 2. Each of the RNN, ARNN, and AttPCRNN models employs two recurrent layers with 128 hidden units per layer.
All models were trained with a batch size of 64, a dropout rate of 0.5, and an initial learning rate of . The learning rate was progressively reduced using cosine annealing. Optimization was performed using the Adam algorithm. The L2 regularization coefficient was set to for all models. LeakyReLU was used as the activation function throughout. Training lasted for 300 epochs, sufficient to achieve optimal performance, and the final model was selected using early stopping based on validation performance.
The experiments were conducted with a system equipped with 64GB RAM (Kingston Technology, Fountain Valley, CA, USA), AMD Ryzen 3700X CPU (Advanced Micro Devices, Santa Clara, CA, USA) and Nvidia Geforce RTX 3080 (NVIDIA Corporation, Santa Clara, CA, USA).
3.7. Metrics
The model’s performance was evaluated using metrics that assess both classification accuracy and prediction reliability. Accuracy (ACC) measures the overall correctness of predictions, defined as the ratio of correctly classified samples to the total samples. To address class imbalance, the F1 score—the harmonic mean of precision and recall—was adopted. For comprehensive evaluation across classification thresholds, Area Under the Precision-Recall Curve (PR-AUC) quantified the trade-off between precision and recall, while Area Under the Receiver Operating Characteristic Curve (ROC-AUC) assessed the model’s ability to distinguish classes by plotting true positive rate against false positive rate. Formally, the metrics are calculated as follows:
where TP, TN, FP, and FN stand for True Positives, True Negatives, False Positives, and False Negatives respectively; , , , and are TP, TN, FP, and FN at threshold .
Additionally, Overconfidence (OC) was introduced to quantify the discrepancy between the model’s confidence (maximum predicted probability) and its actual accuracy, calculated as the average difference between confidence scores and correctness indicators across all samples:
where N is the total number of samples, is the predicted probability for the i-th sample, and is the indicator function, which equals 1 if the prediction matches the true label , and 0 otherwise.
4. Results
To reduce the variance of results due to a random split, we report the average performance over five runs. Table 2 summarizes the performance of all models. Regarding classification performance, our model achieved performance an ACC of 86.12%, F1 of 83.14%, PR-AUC of 85.27%, and ROC-AUC of 92.87%. It surpassed all baseline models in terms of ACC, F1, and ROC-AUC by margins of 0.59%, 0.78%, and 0.79%, respectively. While trailing the leading model by 0.01% in PR-AUC.
Table 2.
Performance comparison. For all metrics except OC, higher values signify better performance, while for OC, lower values indicate superior performance. Each matric’s best performance is shown in boldface.
Regarding predictive reliability, our model demonstrated an exceptionally low overconfidence rate of 0.59%, an 11.68% reduction compared to the second-best baseline (MP-ResNet, 12.27%). This corresponds to a 97.3% relative improvement compared to the poorest-performing baseline (RNN, 21.93%). These results validate the effectiveness of our model in aligning confidence with true accuracy.
5. Discussion
5.1. Diagnostic Feature Requirements and Model Capabilities
When interpreting an ECG recording, cardiologists rely on various diagnostic indicators, such as the intervals between R waves (RR intervals), the presence or absence of P waves, the duration of the QRS complex, and the regularity of RR intervals. Some of these features can be identified from short ECG segments, whereas others require analysis of longer sequences or even the entire recording. The absence of either local or global diagnostic cues can compromise diagnostic accuracy. This distinction between local and global evidence is reflected in our experimental findings.
CNNs are widely recognized for their capability to extract local features, while RNNs are adept at modeling temporal dependencies in sequential data, which constitute a form of global representation [46,47]. However, each architecture lacks the complementary strengths of the other. Consequently, models such as PCNN, SE-PCNN, RNN, and AttRNN tend to underperform relative to hybrid architectures like PCRNN and AttPCRNN, despite the performance gains achieved by enhanced variants such as SE-PCNN and AttRNN.
Technically, neither MP-ResNet nor our proposed model incorporates recurrent structures to explicitly model long-range dependencies, as RNNs do. Nevertheless, their architectural depth—enabled by residual modules—compensates for this limitation. These deep residual networks possess significantly greater depth than the other models under comparison, which allows them to extend their receptive field and extract more abstract and complex features [48,49]. As a result, both MP-ResNet and our model exhibit superior overall predictive performance.
Moreover, the incorporation of the divergence penalty term (Equation (7)) regularizes our model to generate stronger evidential support for correct classifications, which critically contributes to its superior performance over MP-ResNet. To validate this mechanism, we conducted an ablation study by setting the KL-term coefficient . The resulting model exhibited degraded performance: 85.36% accuracy (−0.76% vs. full model), 82.59% F1 (−0.55%), 85.17% PR-AUC (−0.10%), 92.61% ROC-AUC (−0.26%), and 6.91% overconfidence (+6.32%). These results quantitatively confirmed the penalty’s essential role in suppressing overconfident predictions while maintaining diagnostic accuracy.
5.2. Overconfidence Mitigation
The most notable improvement of our model lies not in its absolute predictive performance, but in its substantial reduction of overconfidence. While all baseline models exhibit overconfidence (OC) levels ranging from 12% to 22%, our proposed model achieves a markedly lower rate of just 0.59%. This demonstrates that the confidence estimates produced by our model are significantly more reliable. The overconfidence in baseline models mainly comes from the softmax function. It inflates predicted probabilities because of its exponential calculation: . For example, for an input [30, 28, 27], the softmax function predicts a probability of 84.38%, while the probability based on the parameters of Dirichlet distribution is only 34.11%, computed as . We can see that small input value differences can cause large softmax output probability variations.
5.3. Uncertainty Quantification for Dynamic Triage
Leveraging the Subjective Logic framework, our model explicitly quantifies classification uncertainty via Equations (3) and (4), where u denotes the uncertainty level. This direct uncertainty estimation enables prediction abstention through adaptive thresholds u, thereby emulating cardiologists’ protocol of deferring low-confidence diagnoses. To systematically evaluate the impact of uncertainty thresholds on diagnostic reliability, we conducted a comprehensive analysis by varying the uncertainty parameter u from 1.0 to 0.1 in 0.1 decrements. Notably, a lower-bound threshold of was empirically excluded, as no samples exhibited zero uncertainty—a consequence of the Dirichlet evidence parameterization inherently avoiding absolute certainty ( for all classes). Thresholds were implemented by retaining samples with uncertainty less than or equal to the specified value. For instance, a threshold of retains all samples, while selects only predictions where the model’s uncertainty falls below 10%. The model’s performance under each threshold was evaluated and compared, as detailed in Figure 4.
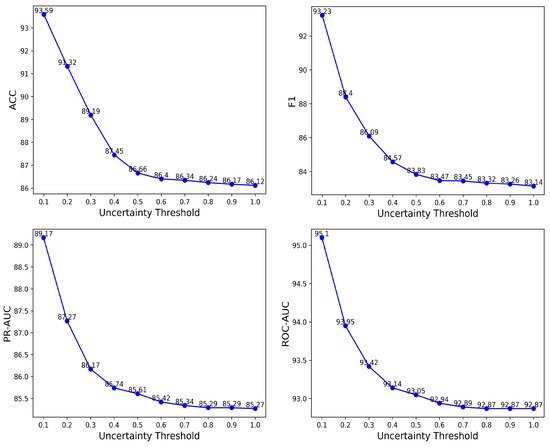
Figure 4.
The change of ACC, F1, PR-AUC and ROC-AUC with respect to the uncertainty threshold for the proposed model.
As shown in Figure 4, progressively lowering the uncertainty threshold (from to ) excludes low-confidence predictions, resulting in consistent improvements across all performance metrics: accuracy increases from 86.12% to 93.59%, F1 from 83.14% to 93.22%, PR-AUC from 85.25% to 89.17%, and ROC-AUC from 92.87% to 95.10%. These threshold-dependent enhancements validate the model’s ability to reliably distinguish between high- and low-confidence predictions. This capability supports the implementation of dynamic triage protocols: automated nurse-led interventions for high-confidence cases and prioritized cardiologist evaluation for uncertain predictions, thereby optimizing resource allocation in time-sensitive healthcare environments with high patient throughput.
5.4. Limitations
While the proposed model demonstrates strong performance and reliable uncertainty estimation, several limitations should be acknowledged. First, the model was trained and evaluated solely on the PhysioNet 2017 Challenge dataset. Although this dataset is widely used and clinically relevant, the generalizability of our approach to other ECG datasets or real-world clinical environments remains unverified. Second, the current model operates on single-lead ECG signals, which may restrict its applicability in multi-lead clinical settings where richer diagnostic information is available. Third, although Subjective Logic provides an interpretable uncertainty measure, the clinical utility of uncertainty-guided triage has not been prospectively validated with human experts. Future work should explore external validation, integration with multi-lead ECGs, and prospective clinical evaluation to establish broader applicability and real-world effectiveness.
6. Conclusions
In this paper, we present a deep learning model for the reliable interpretation of ECG signals. The model leverages shortcut connections to construct a sufficiently deep network capable of extracting comprehensive and high-level features. Instead of the conventional softmax function—which is prone to overconfidence and poses risks in clinical applications—we employ the Dirichlet distribution to estimate class probabilities as predictive confidence. Additionally, the model incorporates Subjective Logic to explicitly quantify overall uncertainty, thereby enabling dynamic triage decisions aligned with clinical protocols.
Evaluated on the PhysioNet Challenge 2017 dataset, the model outperformed baselines on 3 of 4 classification metrics and reduced overconfidence to just 0.59%, compared to baseline models ranging from 12% to 22%. By decreasing the uncertainty threshold to reject low-confidence predictions, the model’s performance improved monotonically, achieving 93.59% accuracy, 93.22% F1, 89.17% PR-AUC, and 95.10% ROC-AUC at the optimal threshold . These results underscore the model’s clinical relevance, bridging algorithmic reliability with trustworthiness—particularly crucial in time-sensitive settings where overconfidence can lead to misdiagnosis.
Author Contributions
X.L. conceptualized the study. X.L., Q.Z., S.Z. and S.F. developed the methodology. X.L. drafted the initial manuscript, while S.F., Y.C. and K.Y. revised it. All authors have read and agreed to the published version of the manuscript.
Funding
This work was funded by the Scientific Research Fund of Chengdu University of Information Technology (No.KYTZ2023044). It was also supported by the Research Project of Key R&D Programs in Tibet Autonomous Region (No.XZ202501ZY0094), by the National Key Research and Development Plan of China, Key Project of Cyberspace Security Governance (No.2022YFB3103103), the Key Research and Development Project of Chengdu (No.2023-XT00-00002-GX), the Key Research and Development Support Program Project of Chengdu (No.2024-YF05-01227-SN).
Data Availability Statement
The dataset is available at https://physionet.org/content/challenge-2017/1.0.0/ (accessed on 14 May 2025), and our code at https://github.com/bruceli518/TrustECG (accessed on 14 May 2025).
Acknowledgments
The authors would like to thank Shenda Hong in National Institute of Health Data Science (NIHDS) at Peking University for his advice. The authors would also like to thank the anonymous reviewers for their valuable comments.
Conflicts of Interest
Author Ke Ye was employed by the company Coloplast Inc. The remaining authors (Xuedong Li, Qingxiao Zheng, Shibin Zhang, Shipeng Fu, Yingke Chen) declare that the research was conducted in the absence of any commercial or financial relationships that could be construed as a potential conflict of interest.
References
- Roth, G.A.; Mensah, G.A.; Johnson, C.O.; Addolorato, G.; Ammirati, E.; Baddour, L.M.; Barengo, N.C.; Beaton, A.Z.; Benjamin, E.J.; Benziger, C.P.; et al. Global burden of cardiovascular diseases and risk factors, 1990–2019: Update from the GBD 2019 study. J. Am. Coll. Cardiol. 2020, 76, 2982–3021. [Google Scholar] [CrossRef] [PubMed]
- Gupta, V.; Mittal, M.; Mittal, V. Chaos theory and ARTFA: Emerging tools for interpreting ECG signals to diagnose cardiac arrhythmias. Wirel. Pers. Commun. 2021, 118, 3615–3646. [Google Scholar] [CrossRef]
- Romero, I.; Serrano, L. ECG frequency domain features extraction: A new characteristic for arrhythmias classification. In Proceedings of the 2001 Conference Proceedings of the 23rd Annual International Conference of the IEEE Engineering in Medicine and Biology Society, Istanbul, Turkey, 25–28 October 2001; IEEE: New York, NY, USA, 2001; Volume 2, pp. 2006–2008. [Google Scholar]
- Nasiri, J.A.; Naghibzadeh, M.; Yazdi, H.S.; Naghibzadeh, B. ECG arrhythmia classification with support vector machines and genetic algorithm. In Proceedings of the 2009 Third UKSim European Symposium on Computer Modeling and Simulation, Athens, Greece, 25–27 November 2009; IEEE: New York, NY, USA, 2009; pp. 187–192. [Google Scholar]
- Escalona-Morán, M.A.; Soriano, M.C.; Fischer, I.; Mirasso, C.R. Electrocardiogram classification using reservoir computing with logistic regression. IEEE J. Biomed. Health Inform. 2014, 19, 892–898. [Google Scholar] [CrossRef]
- Guglin, M.E.; Thatai, D. Common errors in computer electrocardiogram interpretation. Int. J. Cardiol. 2006, 106, 232–237. [Google Scholar] [CrossRef]
- Shah, A.P.; Rubin, S.A. Errors in the computerized electrocardiogram interpretation of cardiac rhythm. J. Electrocardiol. 2007, 40, 385–390. [Google Scholar] [CrossRef]
- LeCun, Y.; Bengio, Y.; Hinton, G. Deep learning. Nature 2015, 521, 436–444. [Google Scholar] [CrossRef]
- Hochreiter, S.; Schmidhuber, J. Long short-term memory. Neural Comput. 1997, 9, 1735–1780. [Google Scholar] [CrossRef]
- Luong, M.T.; Pham, H.; Manning, C.D. Effective approaches to attention-based neural machine translation. arXiv 2015, arXiv:1508.04025. [Google Scholar]
- He, K.; Zhang, X.; Ren, S.; Sun, J. Deep residual learning for image recognition. In Proceedings of the IEEE Conference on Computer Vision and Pattern Recognition, Las Vegas, NV, USA, 27–30 June 2016; pp. 770–778. [Google Scholar]
- Hannun, A.Y.; Rajpurkar, P.; Haghpanahi, M.; Tison, G.H.; Bourn, C.; Turakhia, M.P.; Ng, A.Y. Cardiologist-level arrhythmia detection and classification in ambulatory electrocardiograms using a deep neural network. Nat. Med. 2019, 25, 65–69. [Google Scholar] [CrossRef]
- Li, Y.; Pang, Y.; Wang, K.; Li, X. Toward improving ECG biometric identification using cascaded convolutional neural networks. Neurocomputing 2020, 391, 83–95. [Google Scholar] [CrossRef]
- Schwab, P.; Scebba, G.C.; Zhang, J.; Delai, M.; Karlen, W. Beat by beat: Classifying cardiac arrhythmias with recurrent neural networks. In Proceedings of the 2017 Computing in Cardiology (CinC), Rennes, France, 24–27 September 2017; IEEE: New York, NY, USA, 2017; pp. 1–4. [Google Scholar]
- Liu, M.; Kim, Y. Classification of heart diseases based on ECG signals using long short-term memory. In Proceedings of the 2018 40th Annual International Conference of the IEEE Engineering in Medicine and Biology Society (EMBC), Honolulu, HI, USA, 17–21 July 2018; IEEE: New York, NY, USA, 2018; pp. 2707–2710. [Google Scholar]
- Li, F.; Wu, J.; Jia, M.; Chen, Z.; Pu, Y. Automated heartbeat classification exploiting convolutional neural network with channel-wise attention. IEEE Access 2019, 7, 122955–122963. [Google Scholar] [CrossRef]
- Yang, T.; Gregg, R.E.; Babaeizadeh, S. Detection of strict left bundle branch block by neural network and a method to test detection consistency. Physiol. Meas. 2020, 41, 025005. [Google Scholar] [CrossRef]
- Rawi, A.A.; Elbashir, M.K.; Ahmed, A.M. Deep learning models for multilabel ECG abnormalities classification: A comparative study using TPE optimization. J. Intell. Syst. 2023, 32, 20230002. [Google Scholar] [CrossRef]
- Sensoy, M.; Kaplan, L.; Kandemir, M. Evidential deep learning to quantify classification uncertainty. Adv. Neural Inf. Process. Syst. 2018, 31, 1–11. [Google Scholar]
- Van Amersfoort, J.; Smith, L.; Teh, Y.W.; Gal, Y. Uncertainty estimation using a single deep deterministic neural network. In Proceedings of the International Conference on Machine Learning, Virtual Event, 13–18 July 2020; PMLR: Warrington, UK, 2020; pp. 9690–9700. [Google Scholar]
- Han, Z.; Zhang, C.; Fu, H.; Zhou, J.T. Trusted multi-view classification with dynamic evidential fusion. IEEE Trans. Pattern Anal. Mach. Intell. 2022, 45, 2551–2566. [Google Scholar] [CrossRef]
- Leibig, C.; Allken, V.; Ayhan, M.S.; Berens, P.; Wahl, S. Leveraging uncertainty information from deep neural networks for disease detection. Sci. Rep. 2017, 7, 1–14. [Google Scholar] [CrossRef]
- Zhang, W.; Di, X.; Wei, G.; Geng, S.; Fu, Z.; Hong, S. A deep Bayesian neural network for cardiac arrhythmia classification with rejection from ECG recordings. arXiv 2022, arXiv:2203.00512. [Google Scholar]
- Li, H.; Lin, Z.; An, Z.; Zuo, S.; Zhu, W.; Zhang, Z.; Mu, Y.; Cao, L.; Garcia, J.D.P. Automatic electrocardiogram detection and classification using bidirectional long short-term memory network improved by Bayesian optimization. Biomed. Signal Process. Control. 2022, 73, 103424. [Google Scholar] [CrossRef]
- Islam, M.F.; Zabeen, S.; Mehedi, M.H.K.; Iqbal, S.; Rasel, A.A. Monte carlo dropout for uncertainty analysis and ecg trace image classification. In Proceedings of the Joint IAPR International Workshops on Statistical Techniques in Pattern Recognition (SPR) and Structural and Syntactic Pattern Recognition (SSPR), Montreal, QC, Canada, 26–27 August 2022; Springer: Berlin/Heidelberg, Germany, 2022; pp. 173–182. [Google Scholar]
- Essa, E.; Xie, X. An ensemble of deep learning-based multi-model for ECG heartbeats arrhythmia classification. IEEE Access 2021, 9, 103452–103464. [Google Scholar] [CrossRef]
- Alsayat, A.; Mahmoud, A.A.; Alanazi, S.; Mostafa, A.M.; Alshammari, N.; Alrowaily, M.A.; Shabana, H.; Ezz, M. Enhancing cardiac diagnostics: A deep learning ensemble approach for precise ECG image classification. J. Big Data 2025, 12, 7. [Google Scholar] [CrossRef]
- Yu, B.; Liu, Y.; Wu, X.; Ren, J.; Zhao, Z. Trustworthy diagnosis of Electrocardiography signals based on out-of-distribution detection. PloS ONE 2025, 20, e0317900. [Google Scholar] [CrossRef] [PubMed]
- Wu, Q.; Li, H.; Li, L.; Yu, Z. Quantifying intrinsic uncertainty in classification via deep Dirichlet mixture networks. arXiv 2019, arXiv:1906.04450. [Google Scholar]
- Hobbhahn, M.; Kristiadi, A.; Hennig, P. Fast predictive uncertainty for classification with Bayesian deep networks. In Proceedings of the Thirty-Eighth Conference on Uncertainty in Artificial Intelligence, Eindhoven, The Netherlands, 1–5 August 2022; PMLR: Warrington, UK, 2022; Volume 180, pp. 822–832. [Google Scholar]
- Şensoy, M.; Kaplan, L.M.; Julier, S.; Saleki, M.; Cerutti, F. Risk-aware classification via uncertainty quantification. Expert Syst. Appl. 2025, 265, 125906. [Google Scholar] [CrossRef]
- Bishop, C.M.; Nasrabadi, N.M. Pattern Recognition and Machine Learning; Springer: Berlin/Heidelberg, Germany, 2006; Volume 4. [Google Scholar]
- Malinin, A.; Mlodozeniec, B.; Gales, M. Ensemble distribution distillation. arXiv 2019, arXiv:1905.00076. [Google Scholar]
- Malinin, A.; Gales, M. Predictive uncertainty estimation via prior networks. Adv. Neural Inf. Process. Syst. 2018, 31, 1–12. [Google Scholar]
- Taboga, M. Lectures on Probability Theory and Mathematical Statistics; Amazon Publishing: Seattle, WA, USA, 2017. [Google Scholar]
- Jsang, A. Subjective Logic: A Formalism for Reasoning Under Uncertainty; Springer: Berlin/Heidelberg, Germany, 2018. [Google Scholar]
- Bao, W.; Yu, Q.; Kong, Y. Evidential deep learning for open set action recognition. In Proceedings of the IEEE/CVF International Conference on Computer Vision, Virtual, 11–17 October 2021; pp. 13349–13358. [Google Scholar]
- Higgins, I.; Matthey, L.; Pal, A.; Burgess, C.P.; Glorot, X.; Botvinick, M.M.; Mohamed, S.; Lerchner, A. beta-vae: Learning basic visual concepts with a constrained variational framework. ICLR 2017, 3. [Google Scholar]
- Clifford, G.D.; Liu, C.; Moody, B.; Li-wei, H.L.; Silva, I.; Li, Q.; Johnson, A.; Mark, R.G. AF classification from a short single lead ECG recording: The PhysioNet/computing in cardiology challenge 2017. In Proceedings of the 2017 Computing in Cardiology (CinC), Rennes, France, 24–27 September 2017; IEEE: New York, NY, USA, 2017; pp. 1–4. [Google Scholar]
- Brandes, A.; Stavrakis, S.; Freedman, B.; Antoniou, S.; Boriani, G.; Camm, A.J.; Chow, C.K.; Ding, E.; Engdahl, J.; Gibson, M.M.; et al. Consumer-led screening for atrial fibrillation: Frontier review of the AF-SCREEN international collaboration. Circulation 2022, 146, 1461–1474. [Google Scholar] [CrossRef]
- Crawford, M.H.; Bernstein, S.J.; Deedwania, P.C.; DiMarco, J.P.; Ferrick, K.J.; Garson, A., Jr.; Green, L.A.; Greene, H.L.; Silka, M.J.; Stone, P.H.; et al. ACC/AHA guidelines for ambulatory electrocardiography: Executive summary and recommendations: A report of the American College of Cardiology/American Heart Association task force on practice guidelines (committee to revise the guidelines for ambulatory electrocardiography) developed in collaboration with the north American society for pacing and electrophysiology. Circulation 1999, 100, 886–893. [Google Scholar]
- Jiang, M.; Lu, Y.; Li, Y.; Xiang, Y.; Zhang, J.; Wang, Z. Research on electrocardiogram classification using deep residual network with pyramid convolution structure. J. Biomed. Eng. 2020, 37, 692–698. [Google Scholar]
- Hu, J.; Shen, L.; Sun, G. Squeeze-and-excitation networks. In Proceedings of the IEEE Conference on Computer Vision and Pattern Recognition, Salt Lake City, UT, USA, 18–23 June 2018; pp. 7132–7141. [Google Scholar]
- Zhou, P.; Shi, W.; Tian, J.; Qi, Z.; Li, B.; Hao, H.; Xu, B. Attention-based bidirectional long short-term memory networks for relation classification. In Proceedings of the 54th Annual Meeting of the Association for Computational Linguistics, Berlin, Germany, 7–12 August 2016; Volume 2, pp. 207–212. [Google Scholar]
- Zihlmann, M.; Perekrestenko, D.; Tschannen, M. Convolutional recurrent neural networks for electrocardiogram classification. In Proceedings of the 2017 Computing in Cardiology (CinC), Rennes, France, 24–27 September 2017; IEEE: New York, NY, USA, 2017; pp. 1–4. [Google Scholar]
- Goodfellow, I. Deep Learning; MIT Press: Cambridge, MA, USA, 2016. [Google Scholar]
- Karpathy, A.; Fei-Fei, L. Deep visual-semantic alignments for generating image descriptions. In Proceedings of the IEEE Conference on Computer Vision and Pattern Recognition, Boston, MA, USA, 7–12 June 2015; pp. 3128–3137. [Google Scholar]
- Zagoruyko, S. Wide residual networks. arXiv 2016, arXiv:1605.07146. [Google Scholar]
- Xie, S.; Girshick, R.; Dollár, P.; Tu, Z.; He, K. Aggregated residual transformations for deep neural networks. In Proceedings of the IEEE Conference on Computer Vision and Pattern Recognition, Honolulu, HI, USA, 21–26 July 2017; pp. 1492–1500. [Google Scholar]
Disclaimer/Publisher’s Note: The statements, opinions and data contained in all publications are solely those of the individual author(s) and contributor(s) and not of MDPI and/or the editor(s). MDPI and/or the editor(s) disclaim responsibility for any injury to people or property resulting from any ideas, methods, instructions or products referred to in the content. |
© 2025 by the authors. Licensee MDPI, Basel, Switzerland. This article is an open access article distributed under the terms and conditions of the Creative Commons Attribution (CC BY) license (https://creativecommons.org/licenses/by/4.0/).