1. Introduction
Remote sensing image change detection involves utilizing remote sensing images captured at two distinct time points to identify changes in land cover or ground features between these intervals. This process is crucial across various application domains, including urban landscape monitoring [
1], agricultural surveys [
2], land cover mapping [
3], and natural resource management [
4]. It represents a significant research direction within the field of computer vision. Traditional methods predominantly rely on manually designed feature extraction algorithms, which exhibit limited capacity for feature representation, strong dependence on specific scenes and datasets, as well as low precision and computational efficiency. In recent years, deep learning techniques have gained rapid traction in the realm of remote sensing [
5,
6] due to the availability of vast amounts of remote sensing data and advancements in deep learning methodologies. Deep learning-based approaches can automatically learn robust feature representations from extensive datasets, capturing richer and more intricate patterns of change while demonstrating strong generalization capabilities. Furthermore, these methods can be applied to remote sensing data from diverse regions and time periods, facilitating automatic detection of changes in remote sensing images through end-to-end training processes. This results in significantly enhanced accuracy and computational efficiency.
Transformers were originally proposed by Vaswani et al. in 2017 to address sequence modeling tasks in natural language processing [
7]. Their core mechanism, self-attention, enables the modeling of long-range dependencies without relying on traditional recurrent neural networks (RNNs) or convolutional neural networks (CNNs) [
8]. Compared with RNNs, Transformers offer higher parallel computation efficiency and more stable performance on long sequences; comparable with CNNs, Transformers are capable of capturing global contextual information by attending to the entire input [
9,
10]. With the introduction of the Vision Transformer (ViT), Transformer architectures have been successfully adapted to the field of computer vision, achieving remarkable results in tasks such as image classification, object detection, and image segmentation [
11]. Due to their powerful feature extraction and modeling capabilities, Transformers have gradually been applied to remote sensing image processing tasks [
12,
13]. In particular, they show great potential in change detection by effectively capturing subtle yet critical differences between images through self-attention mechanisms, thereby improving the accuracy of identifying change regions [
14]. As a result, Transformers are becoming a significant direction in the research of remote sensing image change detection.
The success of Transformers in the field of natural language processing [
15,
16] has attracted increasing attention within the domain of computer vision, particularly in remote sensing image change detection, which represents a significant application area. In recent years, several Transformer-based models have been introduced. These models predominantly employ a two-stream architecture that integrates Transformers with various components such as U-shaped Network (UNet) [
17], other CNN [
18], and additional attention mechanisms [
19]. BIT [
20] is a change detection method grounded in Transformers that features an element known as the bitemporal Image Transformer. This approach initially extracts features from each image using Residual Network (ResNet) and subsequently transforms these features into a set of semantic tags through a spatial attention mechanism. A Transformer model is then utilized to process contextual information both spatially and temporally. The feature difference images are computed by projecting the resulting annotations back into pixel space from two context-rich feature maps. Finally, CNN is employed for change prediction. However, this method struggles to effectively suppress interference caused by irrelevant features and pseudo changes while enhancing true change features during remote sensing image change detection. Fully Convolutional Early Fusion (FC-EF) [
21] combines fully convolutional networks with UNet architecture. Unlike U-Net’s five sampling layers, FC-EF consists solely of four maximum pooling layers and four upsampling layers. The network input involves concatenating two images along the channel dimension from a pair of images. Fully Convolutional Siamese Network with Concatenation (FC-Siam-conc) [
21] utilizes twin networks that share parameters to process pre- and post-change images before merging them with generated features at the decoding layer. Meanwhile, FC-Siam-diff [
21] computes the differences between the front and back image features based on concatenation before integrating them with the generated decoding layer features. However, the accuracy and generalization capabilities of these methods are insufficient for effective change detection in remote sensing images.
The dual encoder–decoder (DED) architecture [
22] is designed to input images from two different time periods into a dual encoder–decoder framework. This approach segments the target object within the image and subsequently fuses it into a single decoder to generate a variation map. EDED [
22] shares the same structural design as DED; however, in EDED, features are exchanged between encoders so that each branch incorporates features from both time periods. Despite this innovative feature exchange mechanism, the EDED structure exhibits suboptimal performance when faced with background interference in images, highlighting an urgent need for enhancements in both accuracy and generalization capabilities.
The attention mechanism [
23] is a data processing approach that emulates human attention allocation, enabling machine learning models to identify target regions containing significant information amidst numerous irrelevant background areas [
24]. This method enhances both the performance and efficiency of the model. In remote sensing images, a notable characteristic is the prevalence of extensive background regions, with change regions requiring detection typically constituting only a small fraction of the overall image. Consequently, the attention mechanism assists the model in concentrating on critical change regions by assigning varying weights to features [
25]. This process improves the network’s ability to differentiate between foreground targets in remote sensing images and complex backgrounds while mitigating interference from these intricate backgrounds during change detection tasks. Ultimately, this leads to improved accuracy in detecting changes within remote sensing imagery [
26]. Furthermore, different types of changes depicted in an image—such as increases in buildings, modifications to roads, or alterations in vegetation—exhibit unique characteristics. The attention mechanism empowers the model to focus on key features pertinent to each specific type of change, thereby facilitating effective detection of those changes [
27]. It can be observed that this mechanism significantly enhances the adaptability and generalization capabilities of the model.
By integrating the strengths of the aforementioned methods, this paper introduces DACA-Net based on the EDED architecture. Unlike the standard EDED architecture, our network incorporates a carefully designed DACAM module that enables immediate capture of fine-grained differences between T1 and T2 at each encoding layer. It achieves dynamic and adaptive bidirectional information flow across both the channel and temporal dimensions. This multi-level, cross-temporal attention enhancement strategy allows for earlier, finer, and more comprehensive exploitation of temporal change features in the image sequence, significantly improving the model’s sensitivity to subtle changes and its segmentation accuracy. The core component of this network is DACAM, which automatically adjusts its scale in accordance with the input image and effectively fuses contextual feature information. This approach enhances the ability to capture change information in remote sensing images, thereby improving both accuracy and generalization capabilities of the network. Furthermore, DACA-Net facilitates feature exchange within the feature extraction layer, enabling each encoder to access features from both branches of two time-series images. This mechanism is employed to refine change regions more effectively.
The primary contributions of this paper are as follows:
We propose the DACA-Net, which fully leverages the features of two temporal images and significantly enhances the performance of change detection in remote sensing imagery.
The DACAM is designed to learn attention weights, enabling automatic adjustment of the appropriate scale based on the characteristics of the input image. This approach effectively fuses multi-scale contextual features to maximize the capture of change information in remote sensing imagery while mitigating interference from complex backgrounds during change detection.
We have constructed a UAV remote sensing image dataset, GBCNR, to address the existing gap in wetland remote sensing image datasets.
2. Specific Work
2.1. The Challenges of Change Detection in Remote Sensing Images
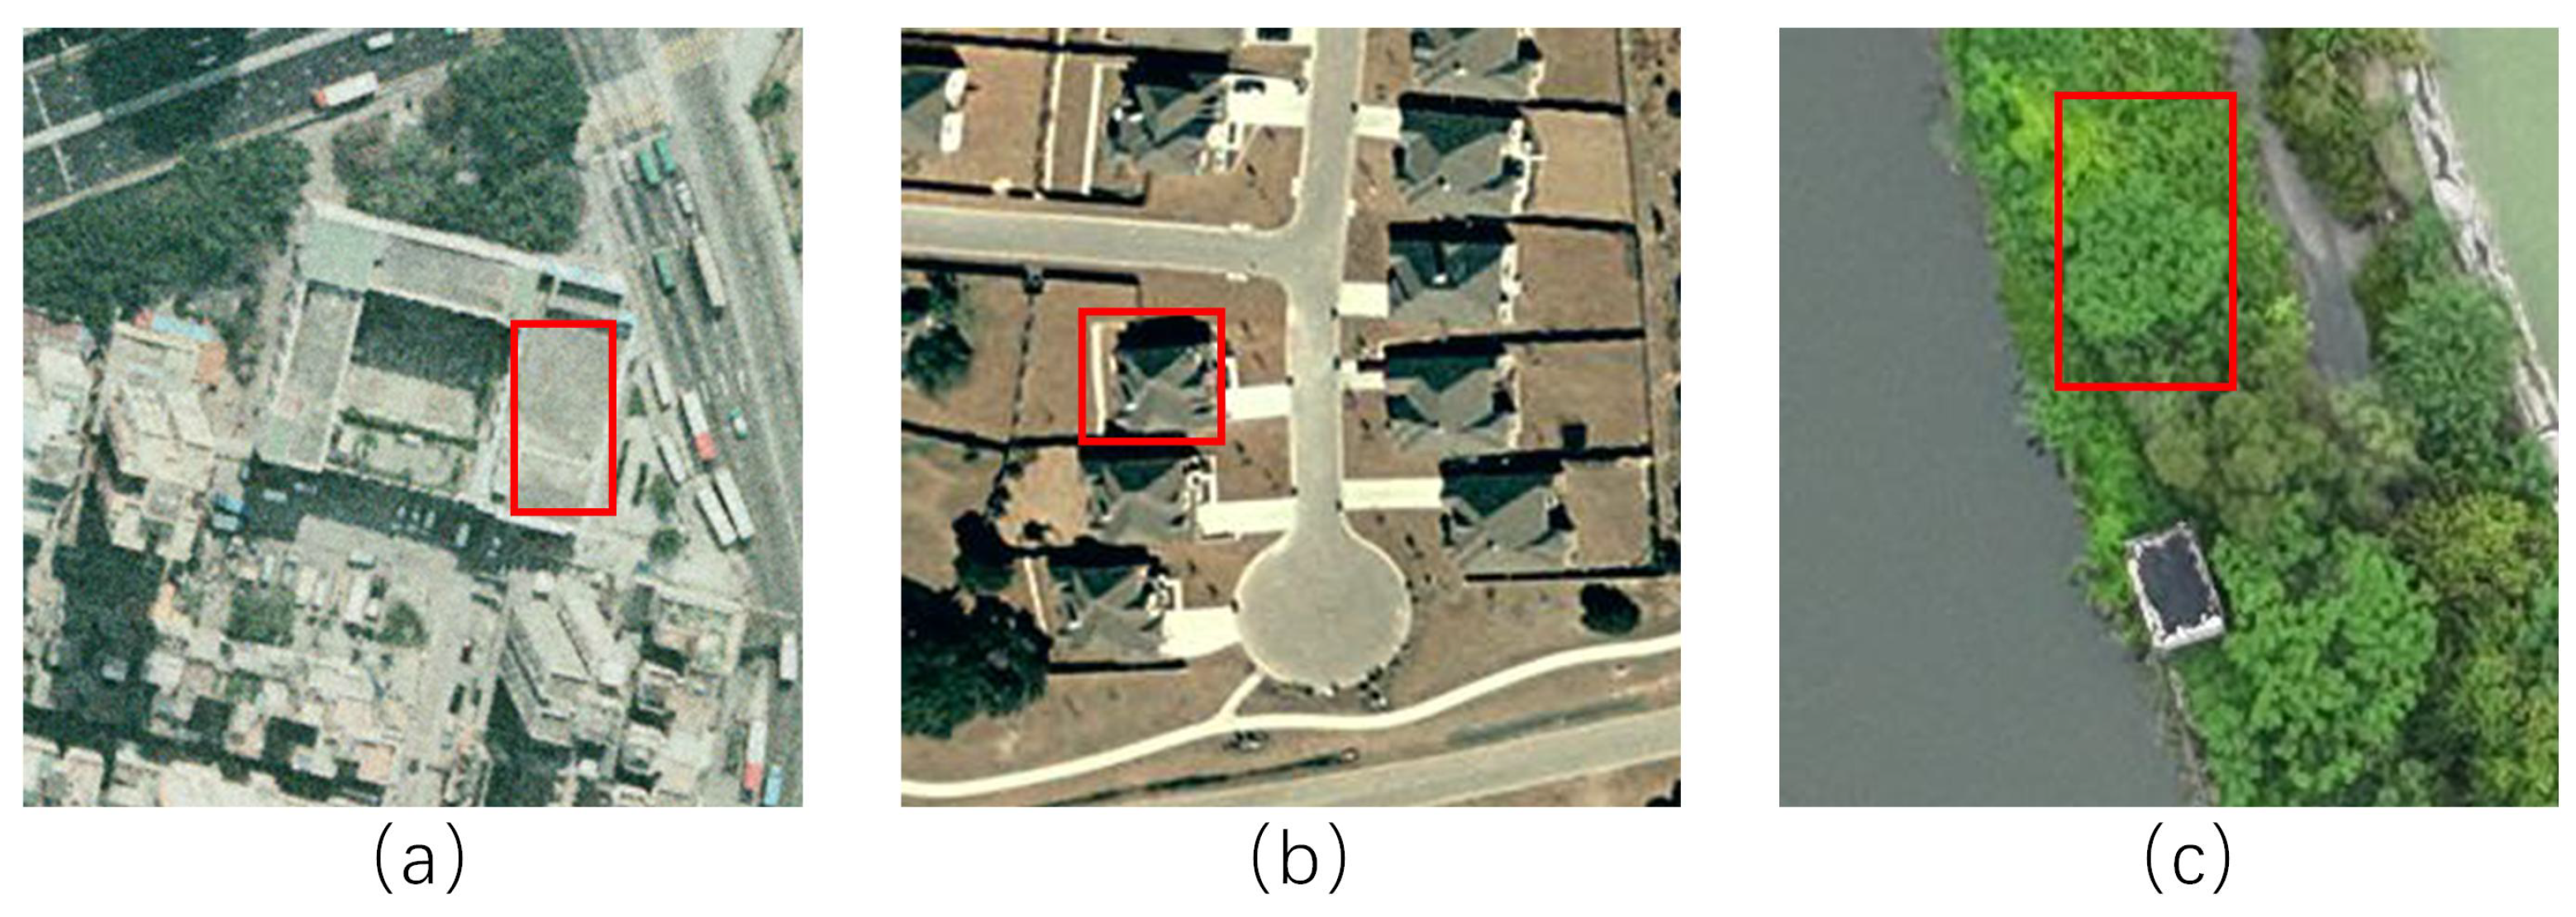
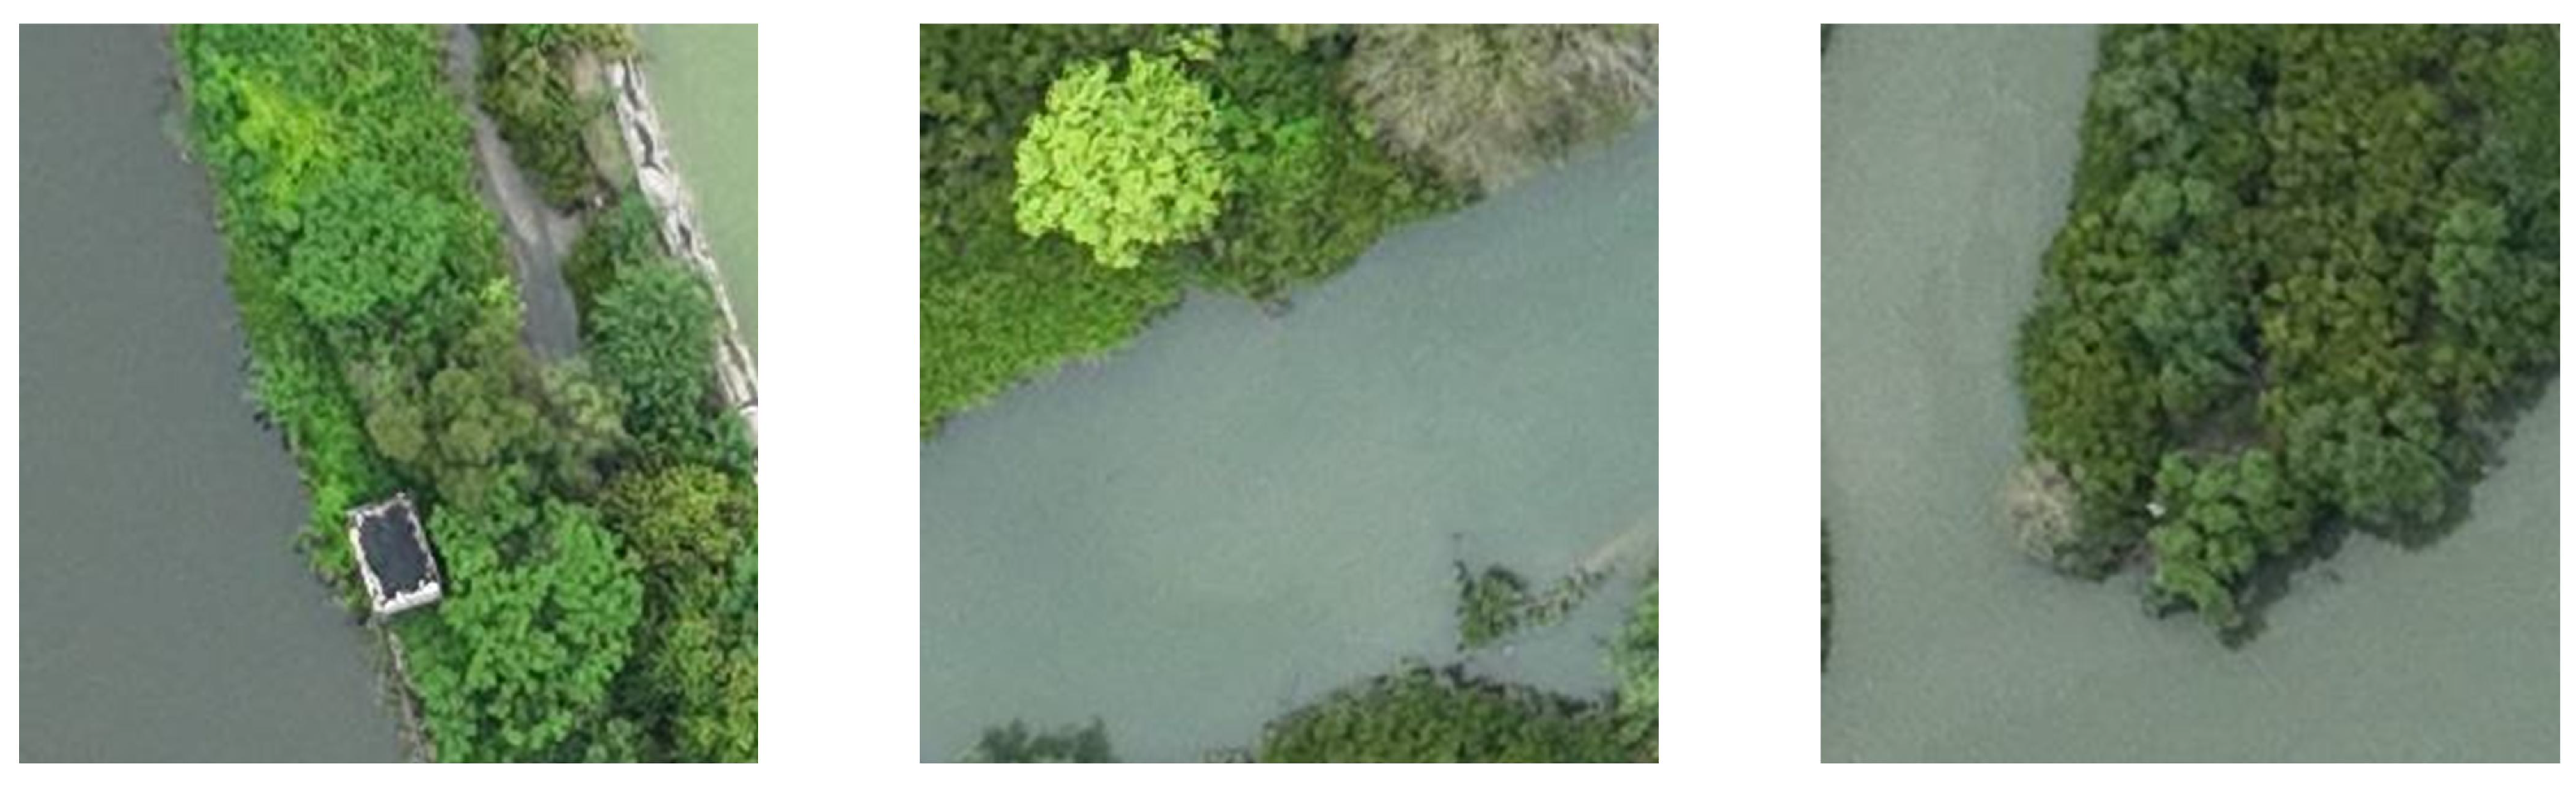
As illustrated in
Figure 1, remote sensing images typically encompass multiple objects, including wetlands, mangroves, roads, and buildings, alongside extensive background areas. In the context of change detection tasks, it is often observed that only a limited subset of objects of interest—such as mangroves—are effectively detected. Consequently, the primary focus of remote sensing image change detection should be directed towards the target change area, specifically the mangrove regions. Furthermore, as depicted in
Figure 1, other entities such as water bodies and infrastructure are present within the remote sensing images; these can lead to issues related to background interference. In remote sensing imagery, “background interference” refers to elements that appear to change visually but are unrelated to the actual targets of interest. Examples include shadow variations caused by differing illumination conditions, vegetation differences due to wind-induced tree movement, or reflections on water surfaces. These non-target changes can mislead detection models and produce false change results; therefore, they must be effectively suppressed in change detection tasks. However, existing methodologies frequently struggle to adequately mitigate the interference stemming from irrelevant features and pseudo changes. This presents significant challenges for effective change detection; for instance, while the advanced EDED structure demonstrates commendable performance overall, it does not sufficiently address background interference. To tackle this issue more effectively, this paper proposes the incorporation of an attention mechanism aimed at alleviating these challenges.
2.2. The Overall Structure of the Network Is Presented
In image change detection, the encoder–decoder architecture is a commonly used deep learning framework. The encoder is responsible for extracting high-level features from the images, effectively compressing them into informative representations. The decoder then reconstructs these features into pixel-level change detection results. This architecture enables a better understanding of image content and spatial information, making it well-suited for change detection tasks in remote sensing imagery.
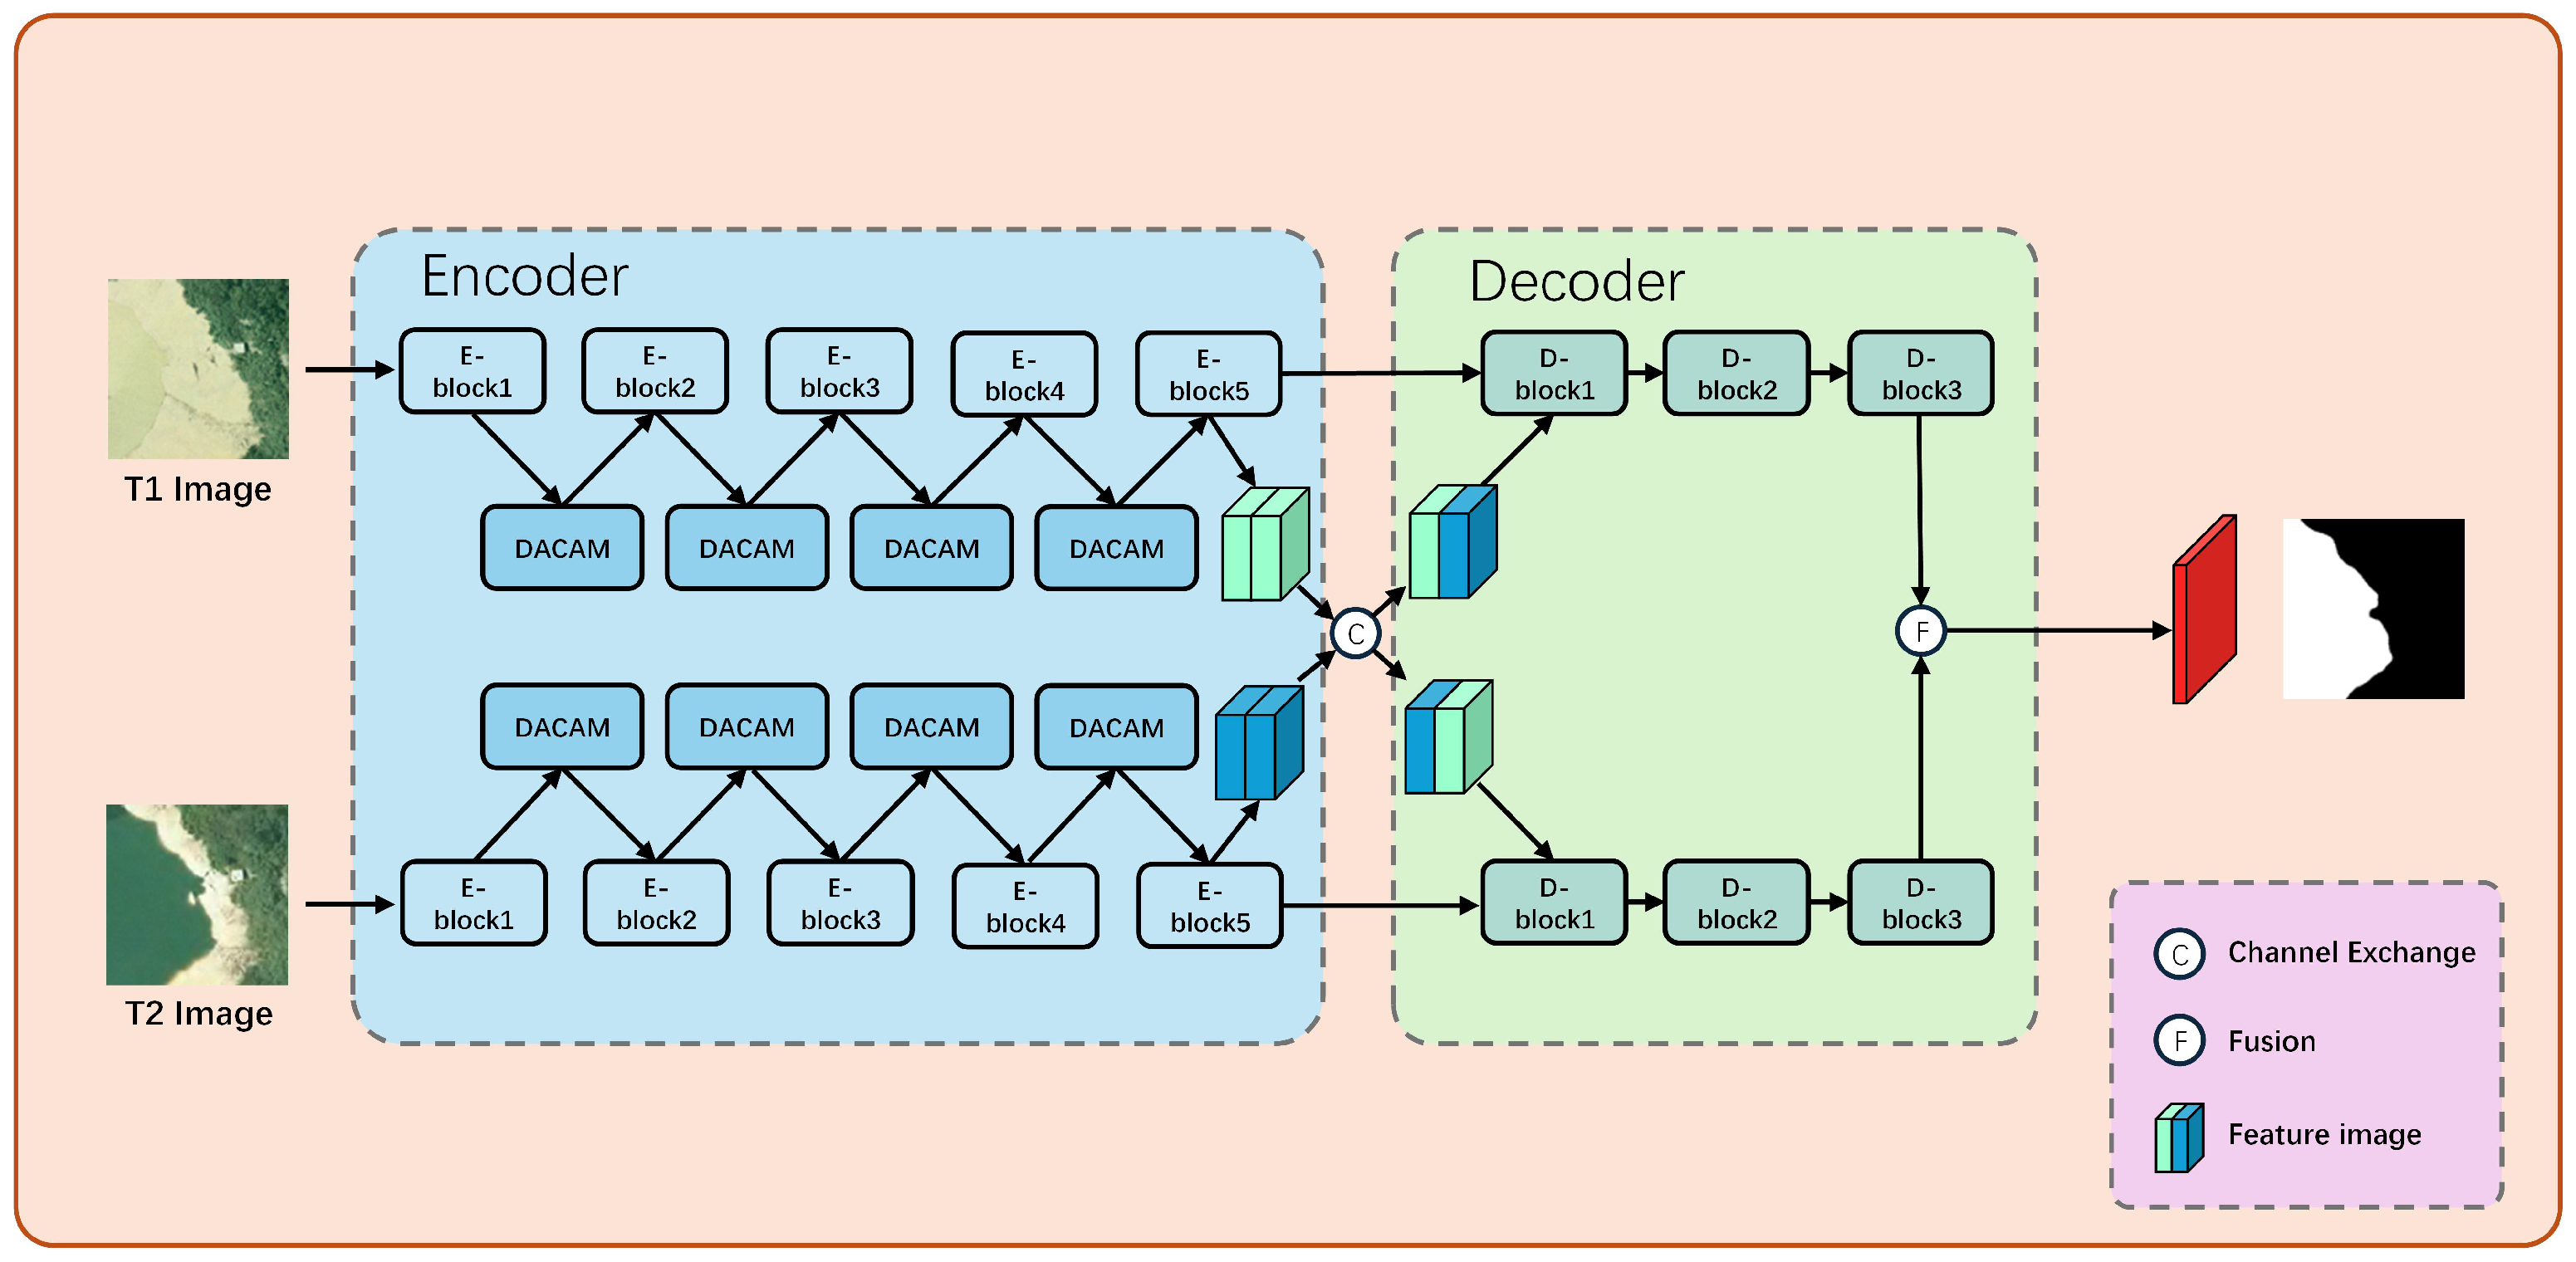
Based on the EDED architecture, this paper presents a remote sensing image change detection method named DACA-Net. The overall structure of DACA-Net is illustrated in
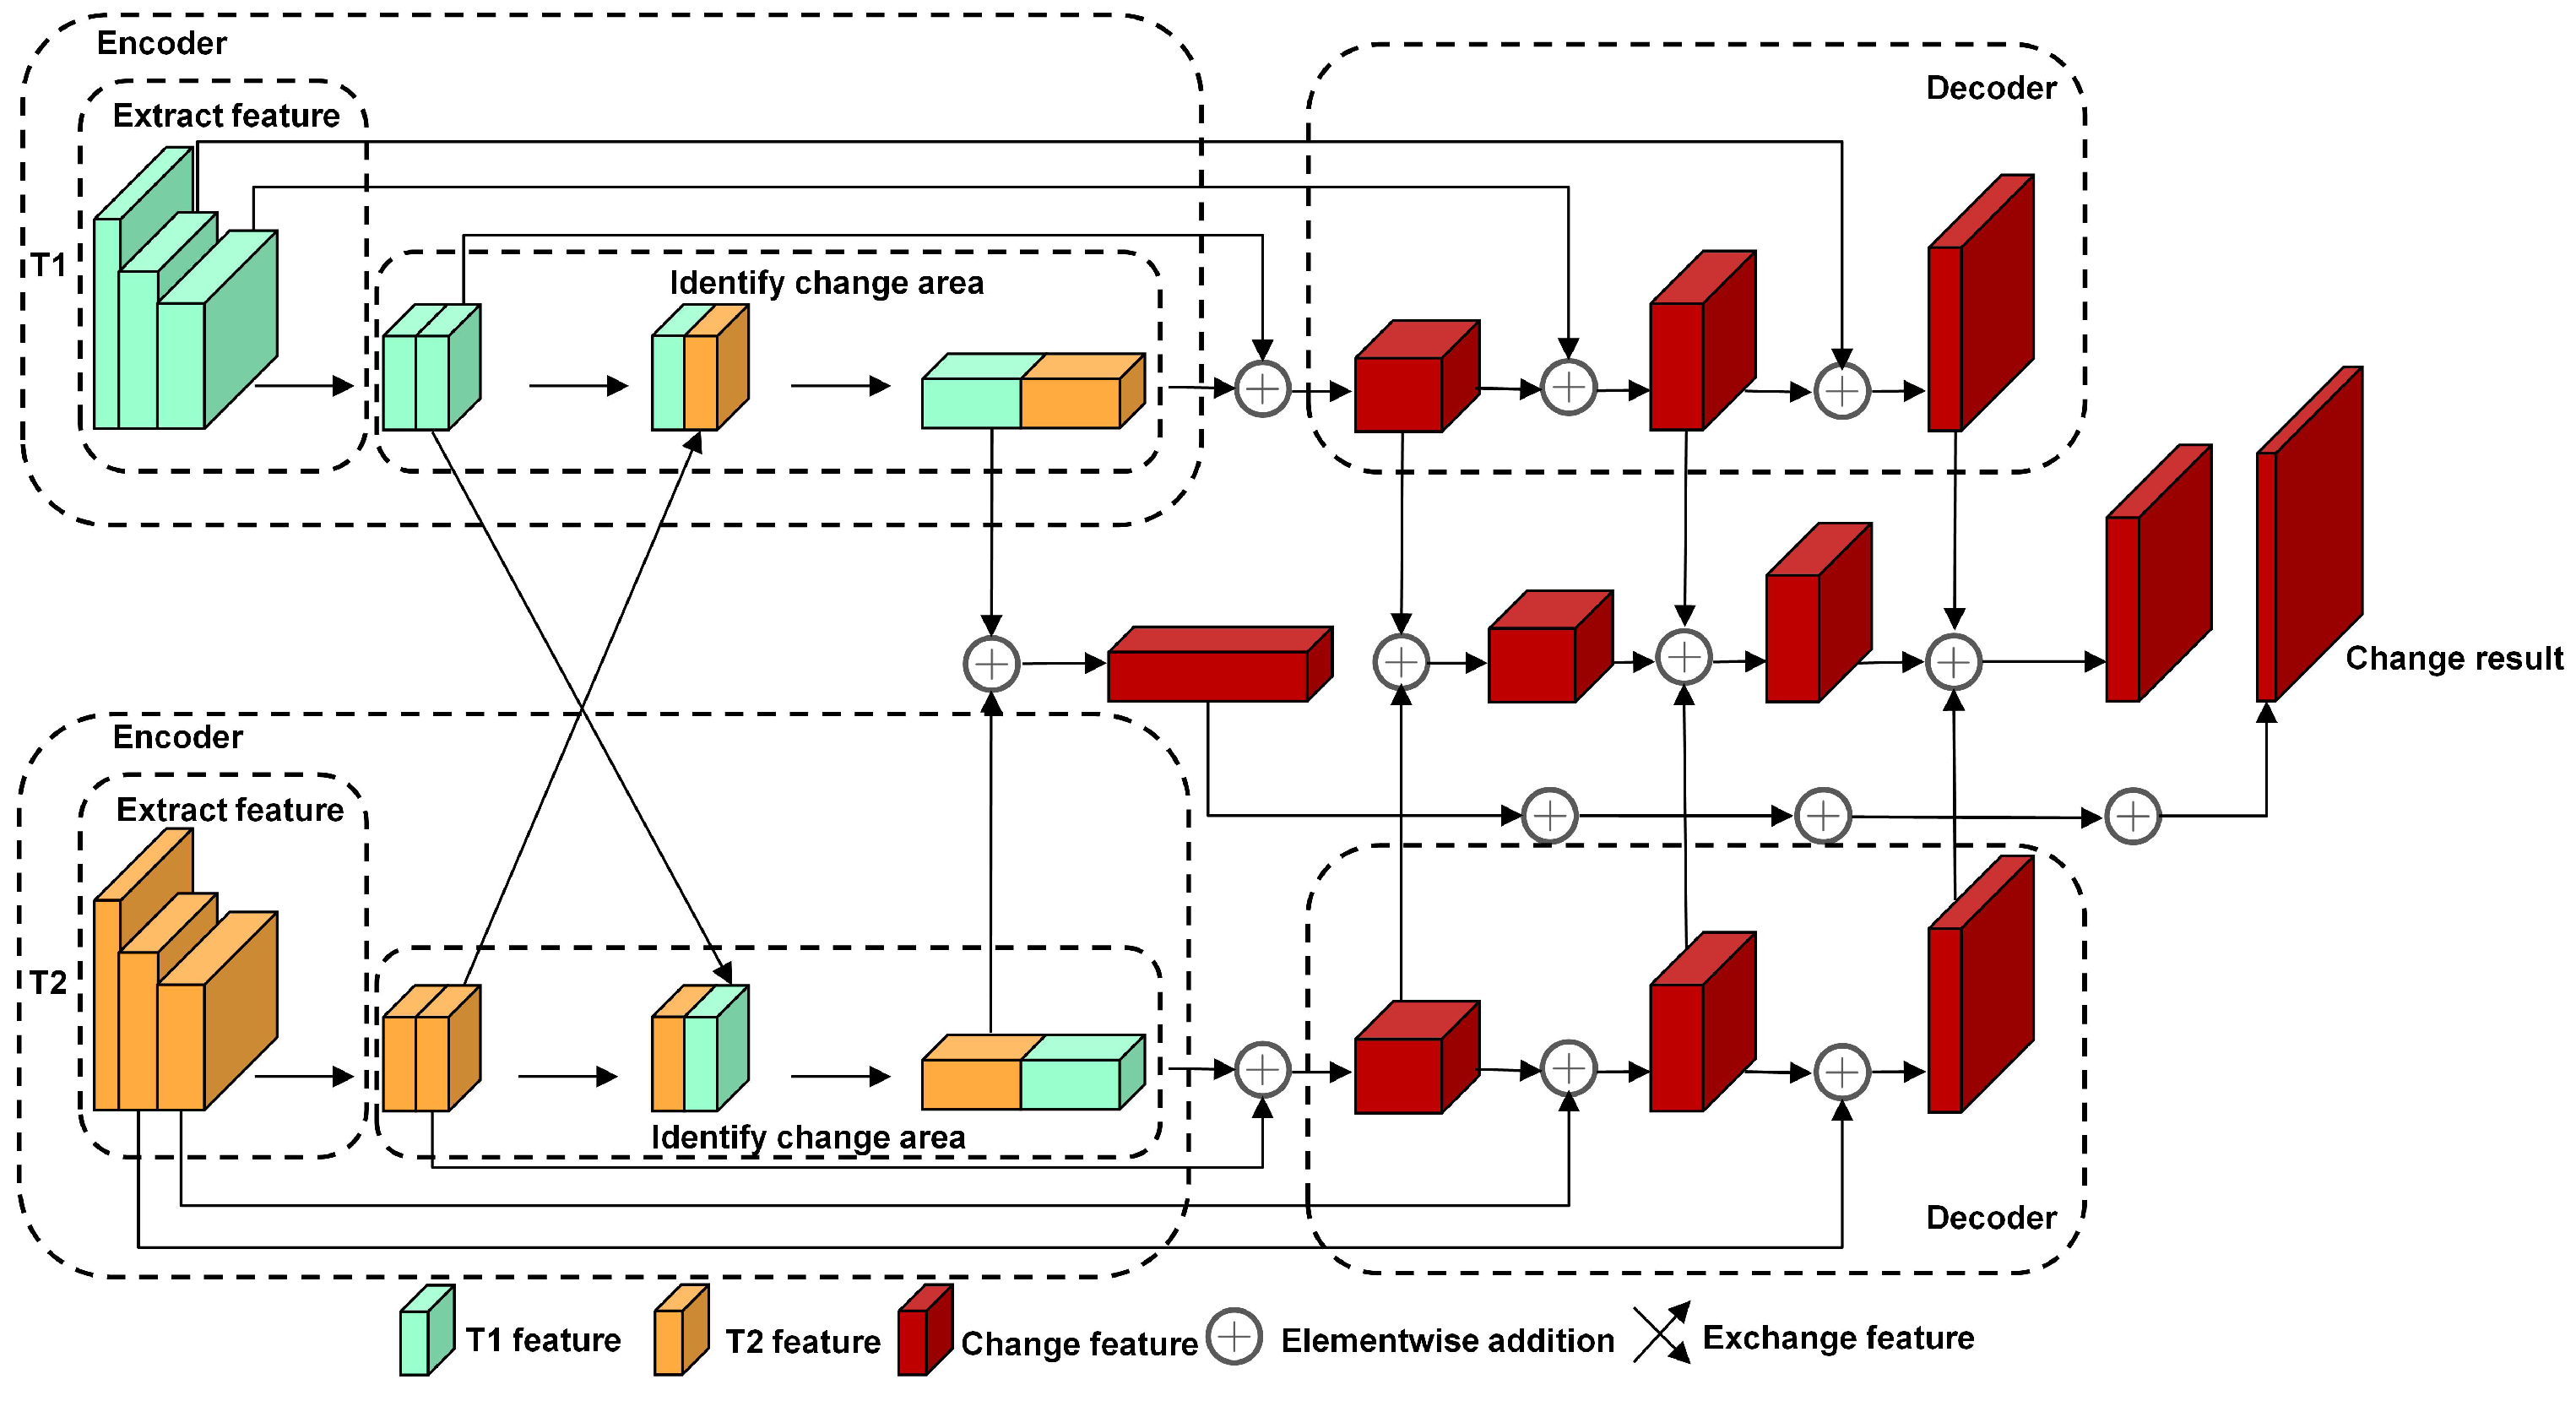
Figure 2. To overcome the limitation of the conventional EDED architecture in capturing multi-scale and fine-grained changes, this paper incorporates a DACAM module after each feature extraction stage in the encoder. This design enables dynamic recalibration and cross-temporal attention fusion of T1/T2 features. The EDED architecture is illustrated in
Figure 3. DACA-Net comprises a dual encoder–decoder framework featuring two weight-shared encoders and two weight-shared decoders. Each encoder consists of a convolutional unit and a DACAM, specifically designed for effective feature extraction. The weight-sharing mechanism allows the encoders to extract spatial features from two temporal images. The T1 image and T2 image represent remote sensing images captured at the same location during different time periods, which are input into the respective weight-shared encoders. Subsequently, the features extracted by both encoders undergo semi-exchange, enabling each encoder to incorporate characteristics from both time periods. This process facilitates an initial identification of changing areas within each encoder’s output.
The two decoder branches are upsampled to generate a change mask that is half the size of the input image. Subsequently, these two decoders are fused to produce a change mask that matches the dimensions of the input image, which constitutes the output of DACA-Net. Encoders 1–5 employ a 3 × 3 convolution for processing input features and subsequently utilize DACAM to enhance these features. The encoders effectively facilitate feature extraction, endowing them with rich spatial and semantic characteristics. Decoders 1–3 perform upsampling on the features before fusing those from both branches in order to accurately identify regions of variation.
2.3. DACAM
The attention mechanism is a technique that simulates the human visual focus system, allowing the model to concentrate on more important regions when processing images. Similar to how humans tend to focus on areas with the most noticeable changes when viewing a scene, attention mechanisms assign different weights to various parts of the image, enabling the model to highlight key change regions while suppressing background interference, thereby improving detection accuracy.
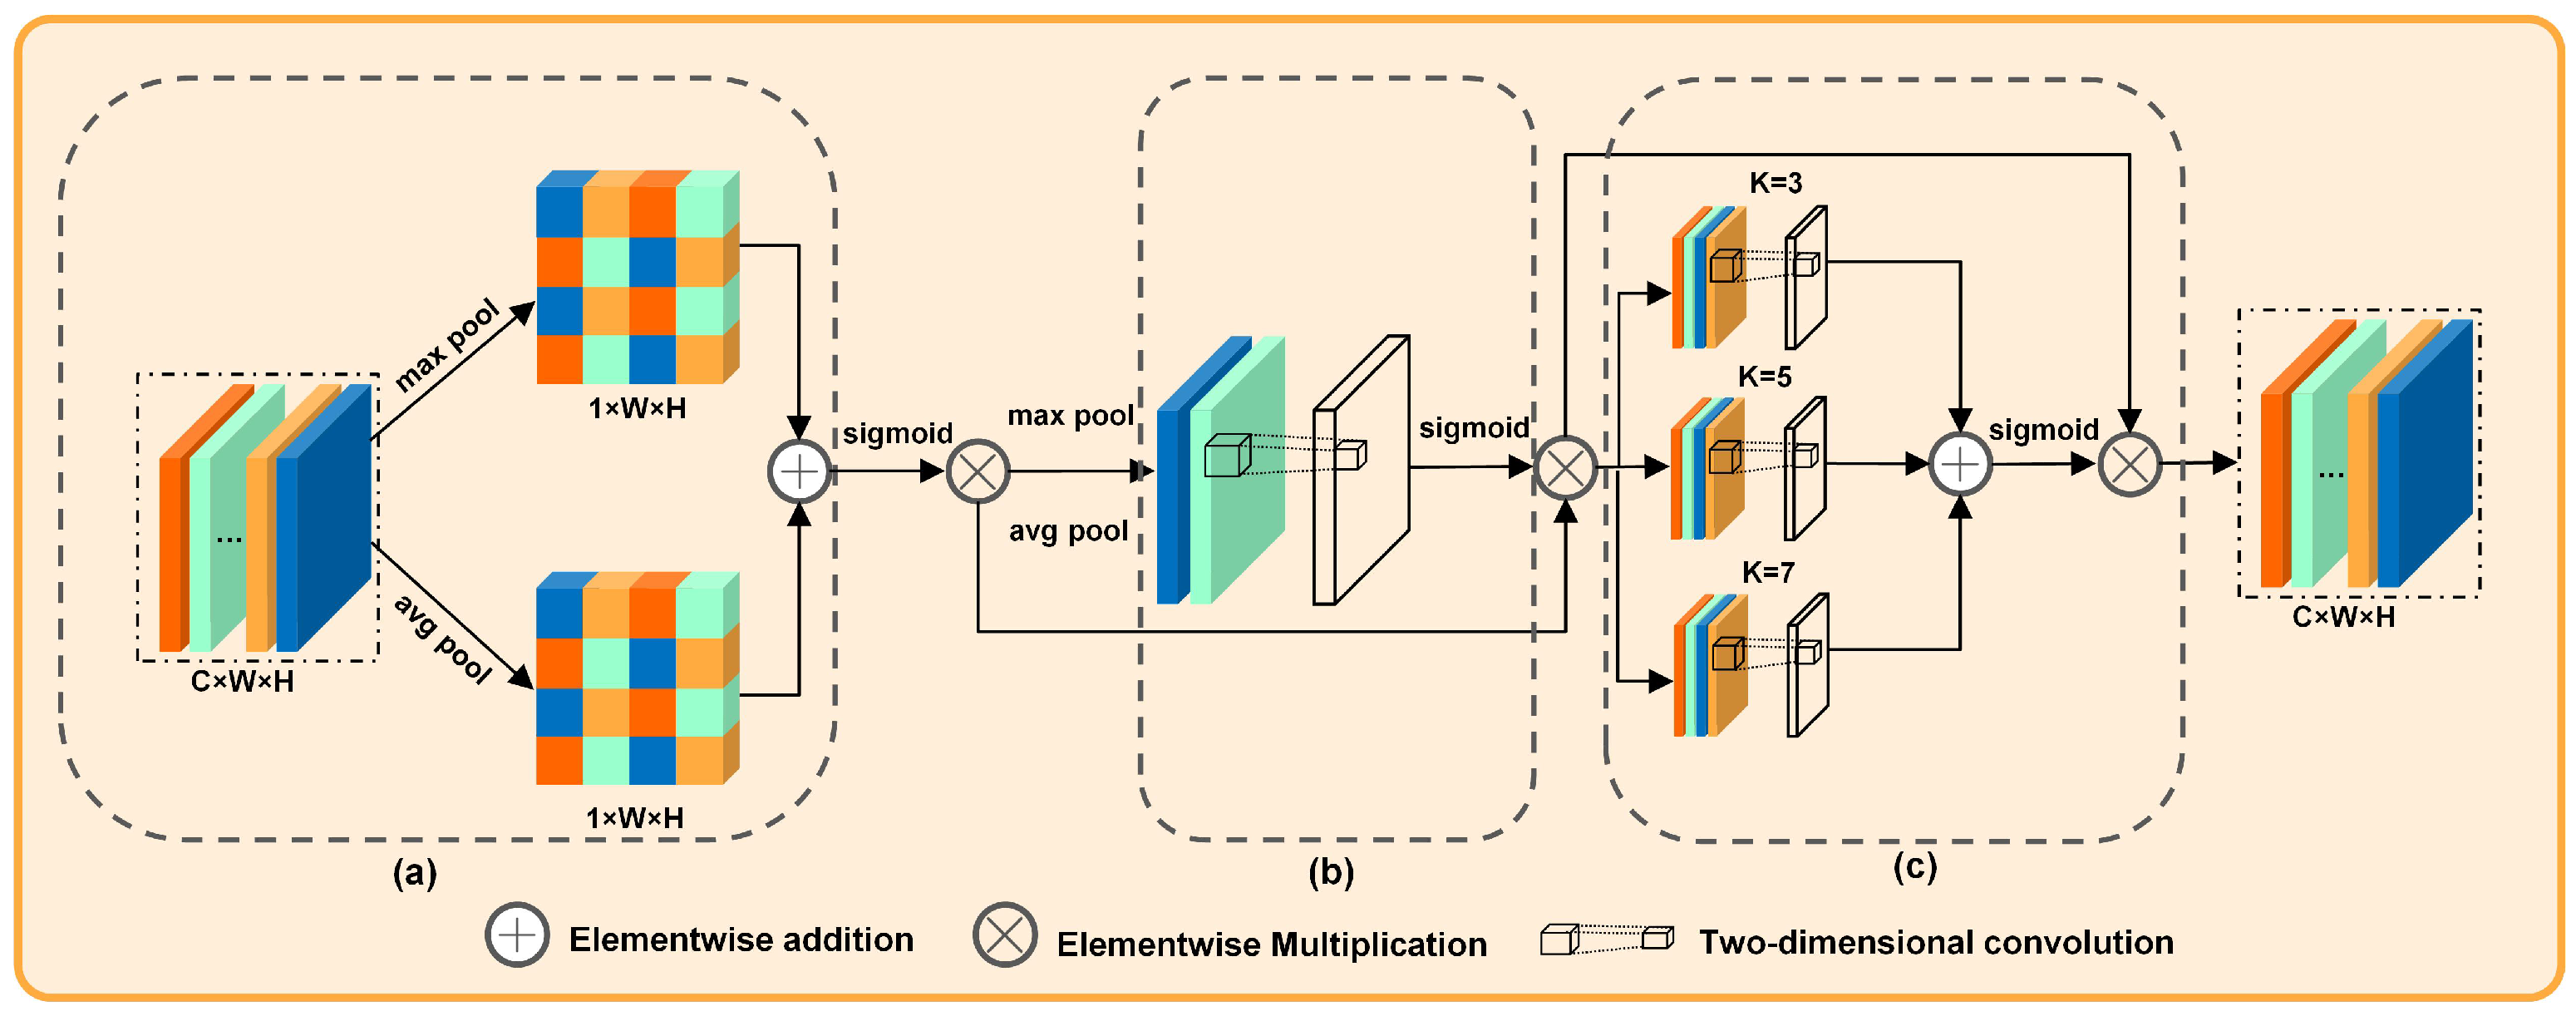
DACAM serves as the core component of DACA-Net, with its structure illustrated in
Figure 4. The DACAM module is divided into three stages, which perform attention modulation on the channel, spatial, and scale dimensions, respectively. DACAM effectively captures change feature information from remote sensing images by learning attention weights across multiple scales and maximizing the fusion of multi-scale contextual information while simultaneously mitigating the interference caused by complex backgrounds during change detection.
The model first determines the importance of each channel. For instance, some channels may focus more on buildings, while others are more sensitive to water bodies. We apply average pooling and max pooling to obtain preliminary statistics, followed by convolution operations to compute the channel attention weights, thereby enhancing the more informative channels. As shown in
Figure 4a, in the initial stage, the channel convolution layer is designed to assess the significance of each channel within the feature map. This layer adaptively assigns weights to channels, thereby enhancing feature representation capabilities, improving model performance and computational efficiency, and facilitating adaptive feature learning. As illustrated in the first stage of
Figure 4, average and maximum pooling operations are conducted on the input features to compute both mean and maximum channel attention. Subsequently, a one-dimensional convolutional layer is employed to calculate the channel attention weights by transforming the number of input channels from 2 to 1 while constraining these weights within a range of 0 to 1. The resulting channel attention weights are then applied to the input feature map in order to derive a channel attention-weighted feature map.
Next, the model evaluates the importance of each spatial location in the image. For example, changes may only occur in the bottom-right region. After spatial pooling, we use a convolution to generate a spatial attention map that highlights key regions. As shown in
Figure 4b, the second stage consists of a spatial convolution layer that emphasizes key spatial positions within the feature map. This layer adaptively assigns weights to different spatial locations, thereby enhancing the extraction of features from critical areas such as targets and improving the model’s capacity to leverage spatial positional information, ultimately leading to enhanced model performance. As illustrated in
Figure 4, the mean and maximum values of spatial attention are derived by averaging and maximizing the feature maps weighted by channel attention. Subsequently, the spatial attention weight is computed using a two-dimensional convolution layer that processes two-dimensional data, resulting in a reduction in channels from 2 to 1 while constraining values between 0 and 1. The calculated spatial attention weight is then applied to the feature map that has been weighted by channel attention.
Finally, the model applies convolutional kernels of varying sizes (e.g., 3 × 3, 5 × 5, and 7 × 7) to process the image, capturing changes at multiple scales. This step mimics how humans observe images from different perspectives and enhances the model’s robustness in detecting both large-scale and fine-grained changes. As shown in
Figure 4c, the third stage consists of multi-scale convolution layers, which effectively capture features of various target sizes and details through adaptive attention mechanisms and the fusion of feature information across different scales. This approach enhances the model’s ability to perceive and utilize multi-scale information, thereby improving its performance in complex scenarios. As illustrated in the three stages of
Figure 4, three distinct convolution layers with kernel sizes of 3, 5, and 7 are applied to the spatial attention-weighted feature maps to generate three multi-scale attention maps. Following this process, a sigmoid activation function is applied to these feature maps to derive the multi-scale attention weights. These weights are then utilized on the spatially attended feature map to produce the final output feature map.
The DACAM framework incorporates channel attention, spatial attention, and multi-scale attention as sequential structures. It processes input feature maps through their respective pooling operations and learning weights before fusing the resulting outputs. This design is predicated on the complementary nature of the three attention mechanisms, which collectively enhance feature extraction capabilities. Consequently, this approach improves overall performance and generalization ability while adapting effectively to complex data distributions.
2.4. Loss Function
The change detection task in remote sensing imagery is framed as a binary classification problem, wherein the objective is to ascertain whether a specific pixel has undergone any changes. Given that unchanged pixels typically constitute the majority of the dataset, this leads to sample imbalance issues. To mitigate the effects of such imbalances, this paper proposes a loss function that integrates the binary cross-entropy loss [
28] with the similarity coefficient loss [
29]. This combined approach effectively addresses the challenges posed by unbalanced binary classification and avoids excessively penalizing the model for predicting unchanged pixels.
The binary cross-entropy loss function is presented in Formula (1).
In this context, n denotes the total number of samples within the dataset, while represents the true label for the sample, which can take on values of either 0 or 1. Additionally, indicates the predicted probability output generated by the model for the sample, with values ranging between 0 and 1.
The primary objective of this loss function is to minimize the discrepancy between the model’s predicted probabilities and the actual labels.
The similarity coefficient loss function is presented in Formula (2).
In this context,
p denotes the probability value predicted by the model, while
t represents the binary value of the actual label, which can take on values of either 0 or 1. Specifically,
and
correspond to the predicted and true values for the
pixel, respectively. To mitigate issues related to division by zero, a small smoothing term
is typically incorporated. This loss function emphasizes the overall degree of overlap between the prediction results and the actual labels rather than focusing solely on individual pixel accuracy; thus, it effectively addresses challenges associated with sample imbalance.
Therefore, the loss function proposed in this paper is defined as the combination of the binary cross-entropy loss and the similarity coefficient loss, as illustrated in Formula (3).
2.5. Evaluation Metrics
In this study, F1 is adopted as a comprehensive metric to evaluate the model’s performance in change detection. Recall (R) measures the proportion of actual change regions that are correctly identified, while P quantifies the proportion of correctly detected changes among all predicted change regions. Intersection over Union (IoU) assesses the degree of overlap between the predicted change regions and the ground truth.
Precision refers to the ratio of true change regions within the predicted change regions. It is defined as shown in Formula (4).
Here, True Positive (TP) refers to correctly detected change regions, pixels that are predicted as changes by the model and actually correspond to real changes. False Positive (FP) denotes falsely detected change regions, i.e., pixels predicted as changes by the model but in fact unchanged. A higher precision indicates a lower false alarm rate of the model.
Recall refers to the proportion of actual change regions that are correctly detected. It is defined as shown in Formula (5).
False Negative (FN) refers to missed change regions, pixels where actual changes occurred but were not detected by the model. A higher recall indicates a lower miss rate of the model.
IoU is used to measure the overlap between the change regions detected by the model and the actual change regions. The definition of IoU is shown in Formula (6).
Here, TP refers to pixels that are detected as changes and actually correspond to changes. FP denotes falsely detected change regions, while FN refers to missed change regions. A higher IoU value indicates a greater overlap between the model’s detected change regions and the actual change regions.
F1 is the harmonic mean of precision and recall, used to provide a comprehensive evaluation of the model’s performance in change detection. The definition of the F1 is shown in Formula (7).
A higher F1 indicates better overall performance of the model.
3. Experiment and Analysis
3.1. The Constructed GBCNR Dataset
Although several public change detection datasets exist (e.g., LEVIR-CD, WHU-CD, and CDD), most of them focus on urban structural changes and are primarily based on satellite or aerial imagery with relatively low spatial resolution. These datasets are insufficient for high-precision ecological monitoring tasks. In contrast, wetland changes are typically characterized by blurred boundaries, slow evolution, and semantic ambiguity, which require more refined spatial-temporal perception from deep learning models. However, current datasets rarely include scenes related to coastal wetland ecosystems, and there is a lack of dedicated benchmarks for such ecological scenarios. Furthermore, most existing datasets are annotated by non-experts, which may compromise label quality. By contrast, our proposed GBCNR dataset is specifically designed for wetland change detection and presents several unique advantages: (1) high-resolution UAV images captured by DJI Mavic drones over the coastal wetlands of Beihai, Guangxi, at centimeter-level resolution, enabling the detection of subtle ecological changes; (2) expert-guided pixel-level annotations under the supervision of environmental ecologists, ensuring high label accuracy and domain relevance; (3) diverse and challenging real-world scenes with wide wetland coverage and ecological variability.As a result, the GBCNR dataset offers a unique and challenging benchmark for remote sensing change detection in ecological contexts. It helps fill the gap in existing datasets and can support applications in ecological monitoring, wetland conservation, and natural resource management.
We developed the GBCNR dataset, which was captured by a drone over the nature reserves along the Guangxi Beihai coast. The images were acquired at an altitude of 500 m using the DJI Mavic series UAV, with each image measuring 5280 × 3956 pixels. Under the guidance of environmental ecologists, these images were annotated using the LabelMe tool to identify wetland areas. To satisfy the input requirements of our proposed deep learning models, selected regions from the images were cropped to dimensions of 256 × 256 pixels and randomly divided into a training set (1748 pairs), a validation set (499 pairs), and a test set (249 pairs). Some samples from the GBCNR dataset are presented in
Figure 5.
3.2. Common Dataset
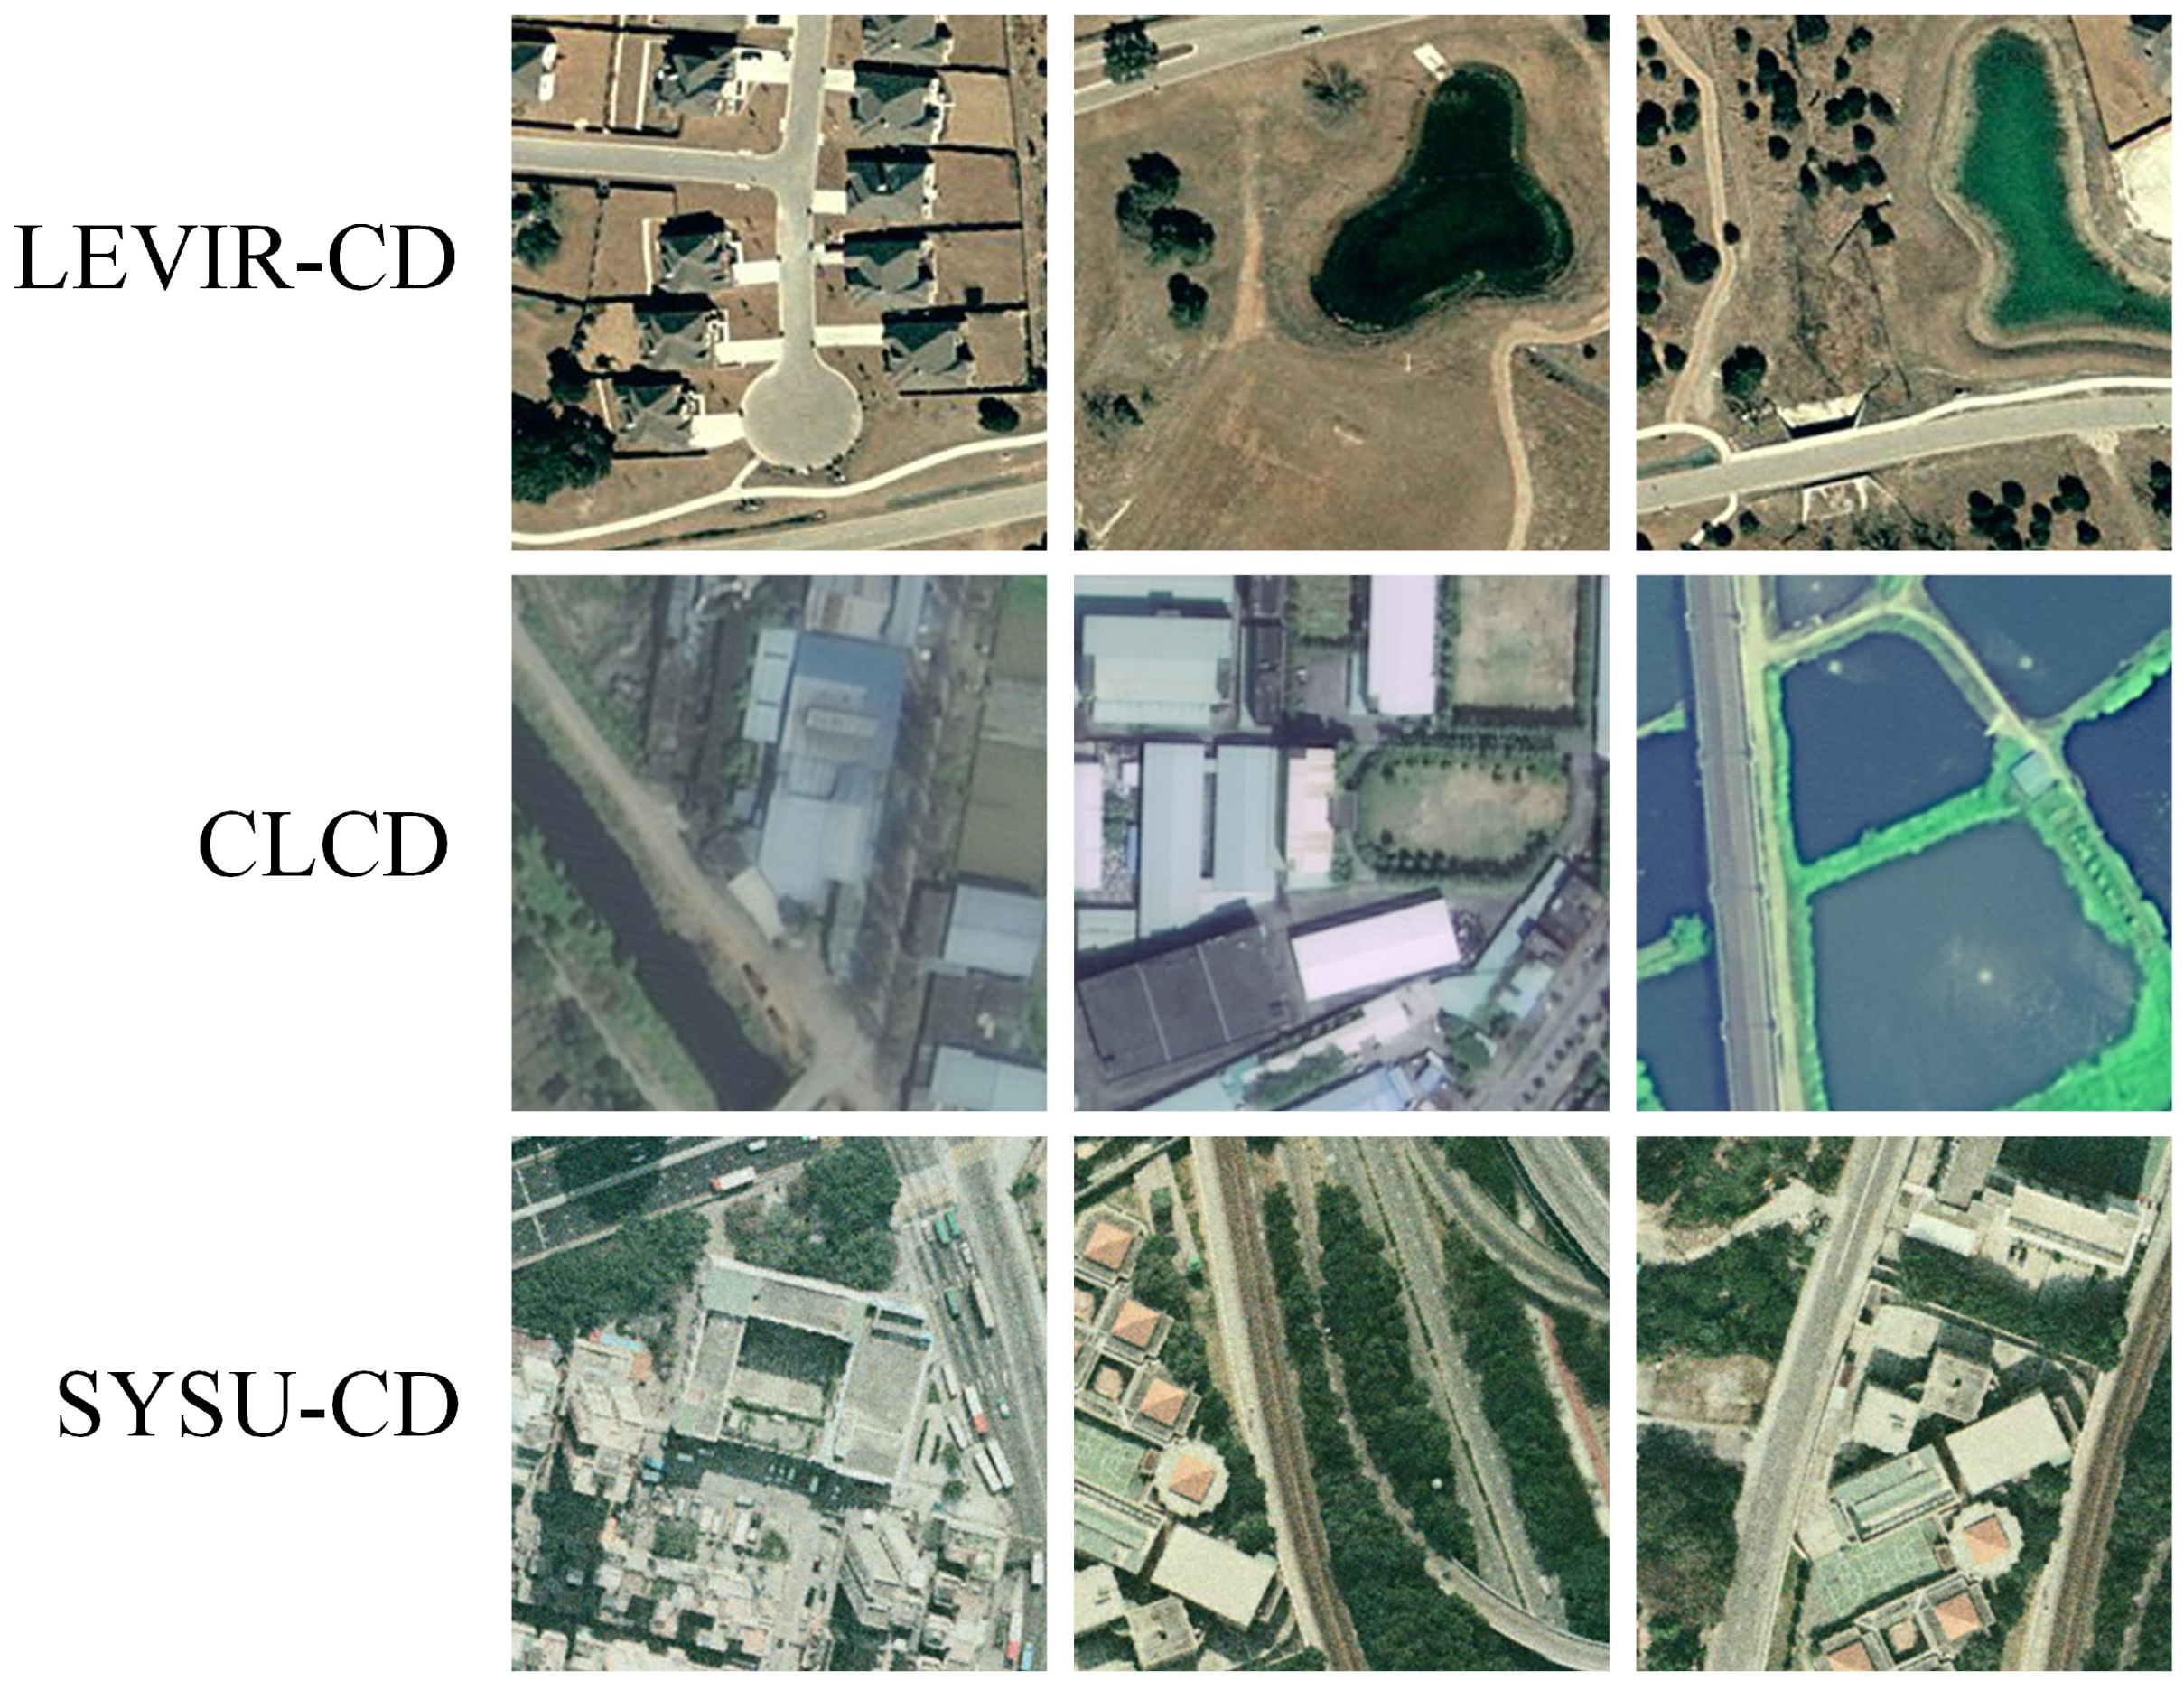
Verification experiments were conducted on four commonly utilized datasets in the field of remote sensing image change detection, specifically LEVIR-CD [
30], CLCD [
31], and SYSU-CD [
32].
The LEVIR-CD dataset comprises 637 pairs of high-resolution remote sensing images, each with dimensions of 1024 × 1024 pixels and a resolution of 0.5 m. This dataset encompasses various types of buildings, including villa homes, high-rise apartments, small garages, and large warehouses. To alleviate the computational burden on the GPU server, we cropped each image to a size of 256 × 256 pixels. In this study, the training set consists of 7120 pairs of clipped images, while the verification set contains 1024 pairs, and the test set includes 2048 pairs. Some samples from the LEVIR-CD dataset are illustrated in
Figure 6.
The CLCD dataset is an annual land cover dataset of China, developed by Wuhan University utilizing 335,709 Landsat images on Google Earth Engine. This dataset provides year-by-year land cover information for China from 1985 to 2020, with a spatial resolution of 30 m. To facilitate deep learning tasks, each image in the CLCD has been cropped into segments of 256 × 256 pixels and subjected to random rotations. The training set consists of 1440 pairs of cropped images, while the verification and test sets comprise 480 pairs each. Some samples from the CLCD dataset are illustrated in
Figure 6.
The SYSU-CD dataset comprises 20,000 pairs of aerial images captured in Hong Kong between 2007 and 2014. These images depict a variety of complex change scenarios, including road expansions, new urban developments, vegetation alterations, suburban transformations, construction foundations, and more. Each image has dimensions of 256 × 256 pixels and a spatial resolution of 0.5 m. In this study, the training set, validation set, and test set were created by randomly rotating each image; they consist of 12,000 pairs for training and 4000 pairs each for validation and testing. Some samples from the SYSU-CD dataset are illustrated in
Figure 6.
3.3. Data Enhancement Strategies
In the training phase, several data augmentation strategies were implemented to enhance the diversity of the training dataset and improve the model’s generalization capabilities.
Random flip: the images are randomly flipped, including both horizontal and vertical flips, with a flipping probability of 0.5;
Random rotation: the images undergo random rotation within an angle range of −45° to 45°, with a rotation probability set at 0.3;
Random constant angle rotation: the images are rotated at fixed angles of 90°, 180°, or 270°, with a rotation probability of 0.5;
Gaussian noise: Gaussian noise is added randomly to the image pairs, with an addition probability of 0.3.
3.4. Experimental Setup and Evaluation Metrics
The proposed DACA-Net is implemented within the PyTorch2.1.0 framework, utilizing a single NVIDIA GeForce RTX 4090 GPU for training, validation, and testing. During the training phase, the Adam optimizer is employed with an initial learning rate of 0.001 and weight decay set to 0.001; additionally, the network operates with a batch size of 64. In this study, binary cross-entropy loss serves as the loss function. The experiments involved training DACA-Net for 300 epochs across the Levi-CD, CLCD, SYSU-CD, and GBCNR datasets while saving checkpoints corresponding to the highest F1 score on the validation set for subsequent testing.
In this paper, P, R, F1, and IoU are employed as evaluation metrics for change detection [
14]. These metrics are widely recognized as standard performance indicators for assessing change detection methods. The precision metric quantifies the extent of false detections among changing pixels, with a higher value signifying a lower incidence of false positives. Conversely, the recall metric assesses the degree of missed detections, where a higher value indicates fewer missed pixels. However, achieving high levels of both accuracy and recall simultaneously presents significant challenges. The F1 offers a comprehensive assessment by integrating both precision and recall through its harmonic mean. Lastly, the IoU metric measures the overlap between predicted changes and actual changes; a higher value reflects more accurate model predictions.
3.5. Ablation Experiments
In this study, we conducted a series of ablation experiments on our self-constructed GBCNR dataset to evaluate the effectiveness of the proposed DACAM method. The experimental results are presented in
Table 1. The baseline method (BaseLine) is the standard EDED architecture. The proposed DACAM module is decomposed into three components: the channel attention module in the first stage—channel attention (CA); the spatial attention module in the second stage—spatial attention (SA); and the multi-scale fusion module in the third stage—multi-scale attention (MS). A set of ablation experiments was performed to assess the individual contribution of each component.
As shown in
Table 1, each individual component contributes to performance improvement. Specifically, introducing the CA alone yields a noticeable gain over the baseline. When CA is combined with the SA, the performance further improves, demonstrating their complementarity. Finally, integrating all three components achieves the best performance across all metrics, validating the overall effectiveness of the DACAM design. These results confirm that each part of DACAM contributes positively, and their combined effect is greater than the sum of their individual contributions.
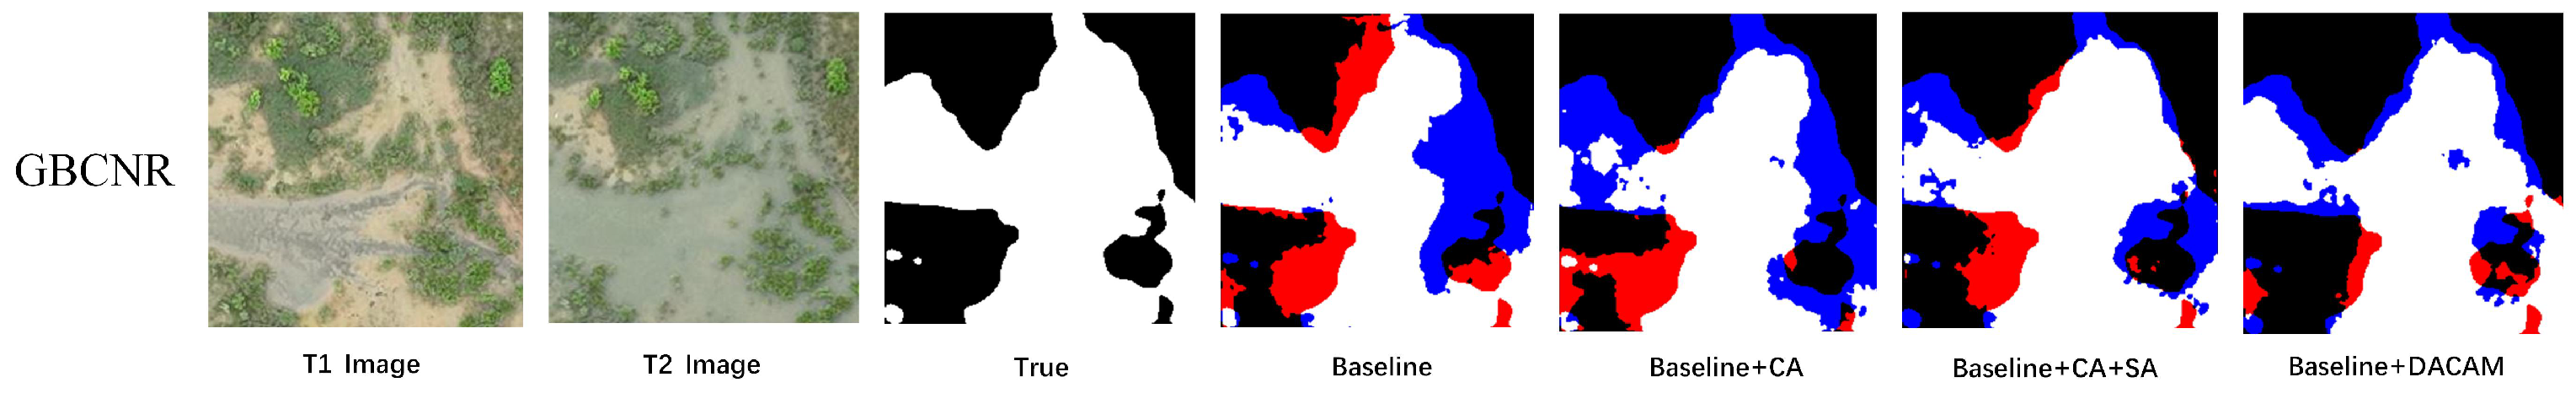
Figure 7 shows a visual comparison of change detection results on the GBCNR dataset under different ablation settings. The ground truth (True) is presented alongside the results from the baseline model and models enhanced with CA, CA+SA, and the complete DACAM module. From the visualizations, we observe that the baseline model generates a substantial number of false positives and false negatives. The addition of channel attention (Baseline+CA) helps reduce noise and better focuses on changed regions but still misses some fine-grained changes. Incorporating spatial attention (Baseline+CA+SA) further refines the change boundaries and suppresses irrelevant areas. The full DACAM module achieves the most accurate and complete change detection results, effectively reducing false positives in red and false negatives in blue, closely aligning with the ground truth.
3.6. Comparative Experiments
To validate the advantages and effectiveness of the proposed DACA-Net, we conducted comparative experiments with several currently popular networks, including SNUNet [
33], FC-EF [
21], FC-Siam-Diff [
21], FC-Siam-Conc [
21], BiT [
20], and SGSLN [
22]. The results are presented in
Table 2.
The comparison results on the LEVIR-CD dataset are presented in
Table 2. As illustrated in
Table 2, the proposed DACA-Net outperforms all other methods evaluated, achieving the highest IoU of 85.81%, F1 of 92.36%, and P of 93.16% on the LEVIR-CD dataset. The R stands at 91.58%, and notably, the F1 of the proposed DACA-Net shows an improvement of 0.31% comparable with the suboptimal method. Although our method shows only a modest improvement over the SGSLN method on the LEVIR-CD dataset, we include it in the statistics to demonstrate the stronger cross-scene generalization ability of our method across multiple datasets.
As shown in
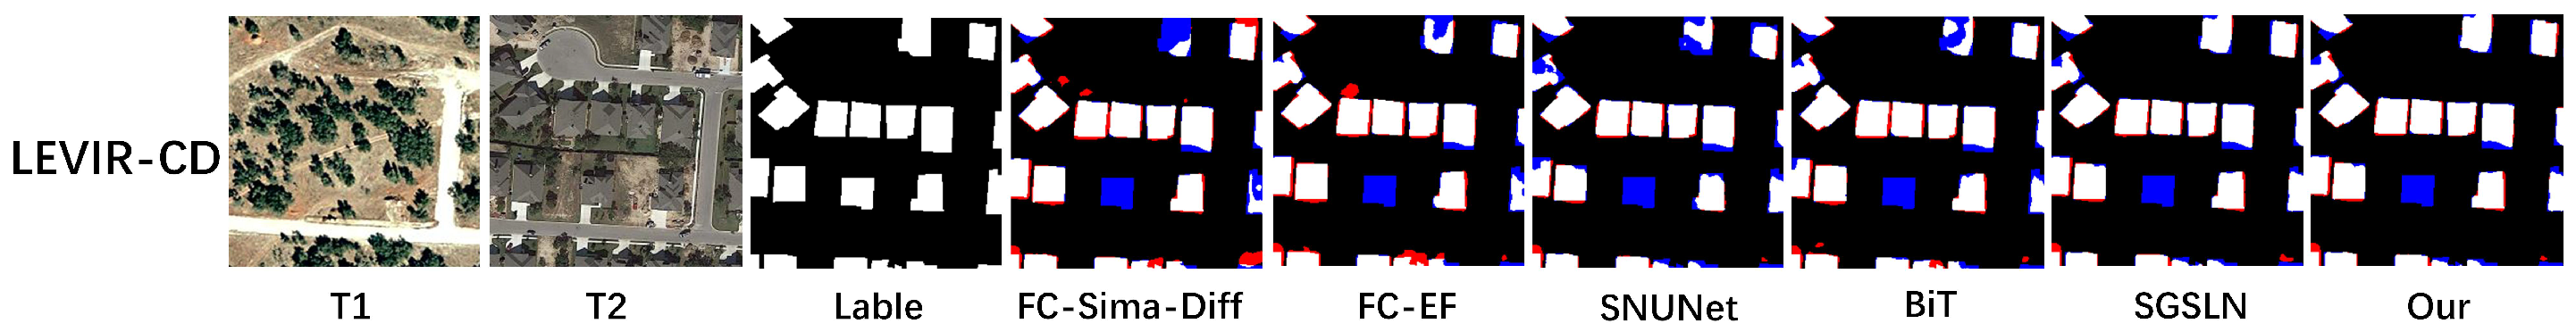
Figure 8, the visual comparison of change detection results on the LEVIR-CD dataset reveals significant performance differences among various methods in suppressing false positives and false negatives. A horizontal comparison of the original bi-temporal images (T1, T2) and the ground truth labels shows that the FC-EF method produces dense red false detection patches along building edges, while the SNUNet algorithm exhibits systematic blue false negatives in low-contrast regions. Although the BiT model effectively suppresses missed detections, it suffers from diffuse red false positives. Notably, the SGSLN method maintains the integrity of the main building structures but introduces fine-grained mixed red–blue errors within roof regions due to excessive smoothing. In contrast, the method proposed in this study demonstrates a significant advantage in balancing false positives and false negatives. Its detection results exhibit the highest spatial consistency with the ground truth, with only sparse blue false negatives observed in shadow transition areas. This indicates that our network effectively mitigates intra-class variation caused by illumination changes and viewpoint shifts and demonstrates superior spatial-context modeling capabilities, particularly in the fine-grained change detection of complex urban structures.
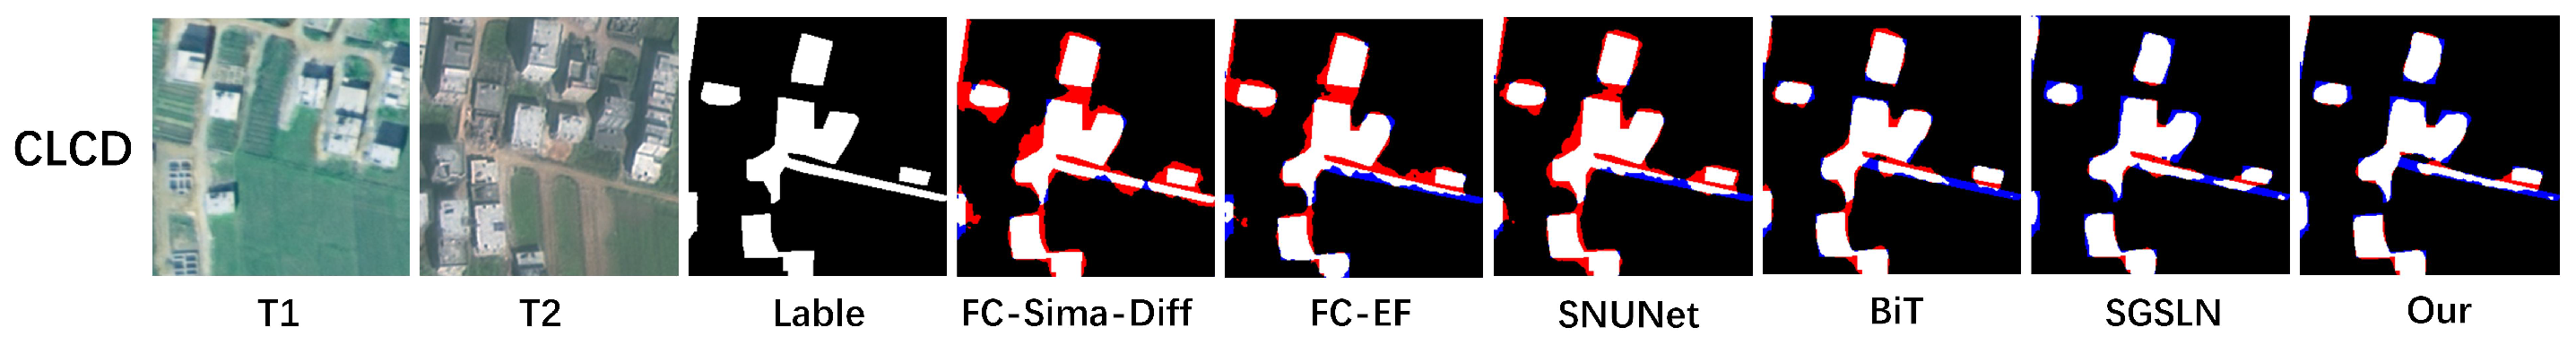
The comparison results on the CLCD dataset are presented in
Table 3. As illustrated in
Table 3, the proposed DACA-Net outperforms all other models under comparison, achieving the highest IoU of 60.46%, an F1 of 75.36%, and a P of 77.32% on the CLCD dataset. The R is at 73.5%, and notably, the F1 of the proposed DACA-Net has been enhanced by 4.26% comparable with the suboptimal method.
As shown in
Figure 9, the visual comparison of change detection results on the CLCD dataset reveals significant differences among algorithms in terms of sensitivity to complex land cover changes and robustness to interference. A spatial comparison between reference images (T1, T2) and ground truth labels indicates that the FC-Siam-Diff method suffers from extensive red false positives and blue false negatives due to feature confusion. The FC-EF algorithm produces dispersed false positives along building edges, while the SNUNet model, despite detecting major change regions, exhibits systematic false negatives in medium- to low-contrast vegetated areas. Although the BiT method suppresses false negatives through deep feature fusion, it results in linear false positives spreading along roads. The SGSLN algorithm, affected by excessive smoothing, introduces fragmented red–blue alternating errors in small change regions. In contrast, the proposed method, equipped with an improved multi-scale contextual attention module, preserves farmland boundaries and effectively suppresses shadow interference. Its detection results demonstrate the highest spatial consistency with the ground truth, with only sparse false negatives observed in regions of overlapping land cover. These findings suggest that our network effectively mitigates intra-class variation caused by seasonal changes and lighting differences in multi-temporal remote sensing imagery and shows superior discriminative capability, particularly in the fine-grained extraction of heterogeneous land cover boundaries.
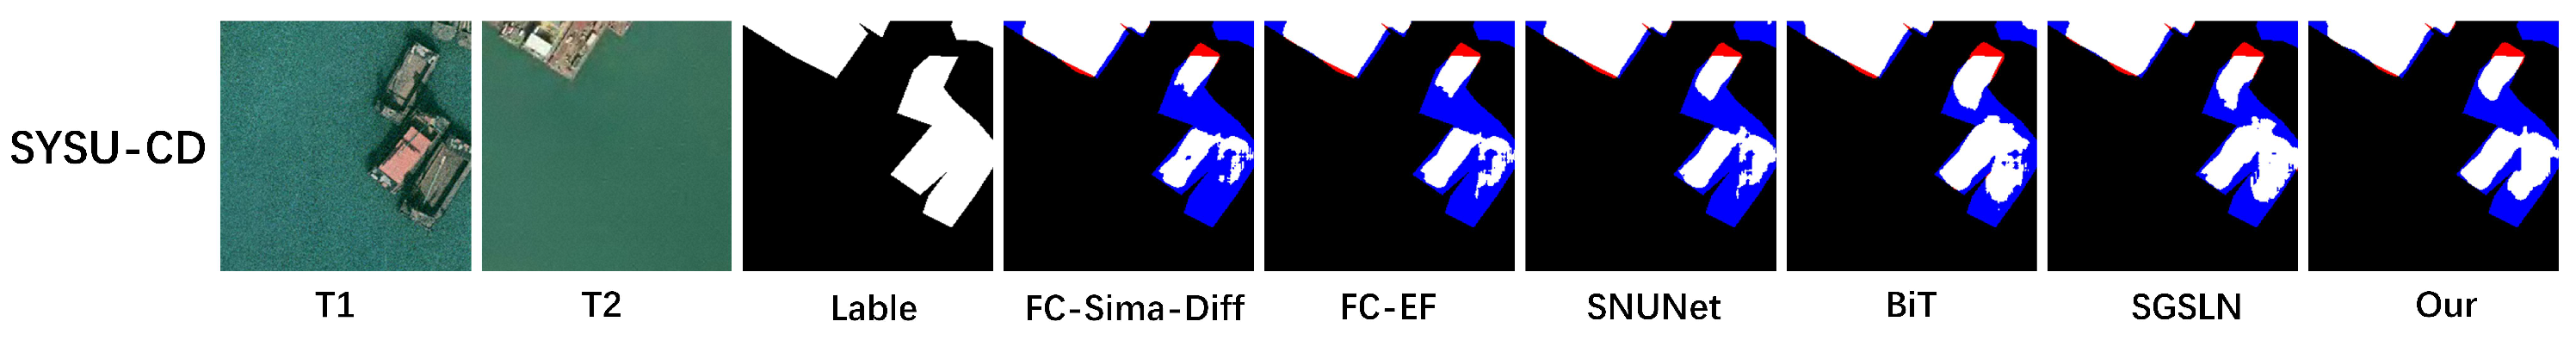
The comparison results on the SYSU-CD dataset are presented in
Table 4. Given that the semantic information of change objects within the SYSU-CD dataset is ambiguous and encompasses multiple object classes, other change detection methods struggle to accurately identify these change objects. In contrast, our proposed DACA-Net effectively detects all classes of change objects and delineates the change regions for each identified object. As illustrated in
Table 4, DACA-Net achieves the highest IoU at 71.07% and an F1 of 83.09% on this dataset. Notably, the F1 attained by DACA-Net represents a 1.2% improvement over that of the suboptimal method, thereby significantly surpassing all other compared approaches.
As shown in
Figure 10, the visualized results of the change detection comparison experiments on the SYSU-CD dataset demonstrate significant performance differences among various algorithms in capturing the complex interactions between coastal building clusters and dynamic marine environments. A spatial comparison of the bi-temporal images (T1/T2) and ground truth labels reveals that the FC-EF method produces large areas of false positives (red artifacts) in the intertidal zone. The SNUNet algorithm introduces jagged false detections with alternating red and blue edges due to feature confusion near building contours. Although the BiT model effectively captures the main structural changes in buildings, it suffers from systematic false negatives (blue regions) caused by wave reflections in the marine background. The SGSLN approach, due to excessive smoothing, yields fragmented red–blue noise within detailed rooftop structures. In contrast, the proposed method not only preserves the geometric integrity of building clusters but also effectively suppresses pseudo-changes induced by tidal variations. Its detection results exhibit the highest spatial alignment with the ground truth, with only minor false negatives observed in high-reflectance transitional water areas. These findings highlight the superior robustness and spatial consistency of our network in handling sub-pixel-level changes along building boundaries in tidal inundation zones.
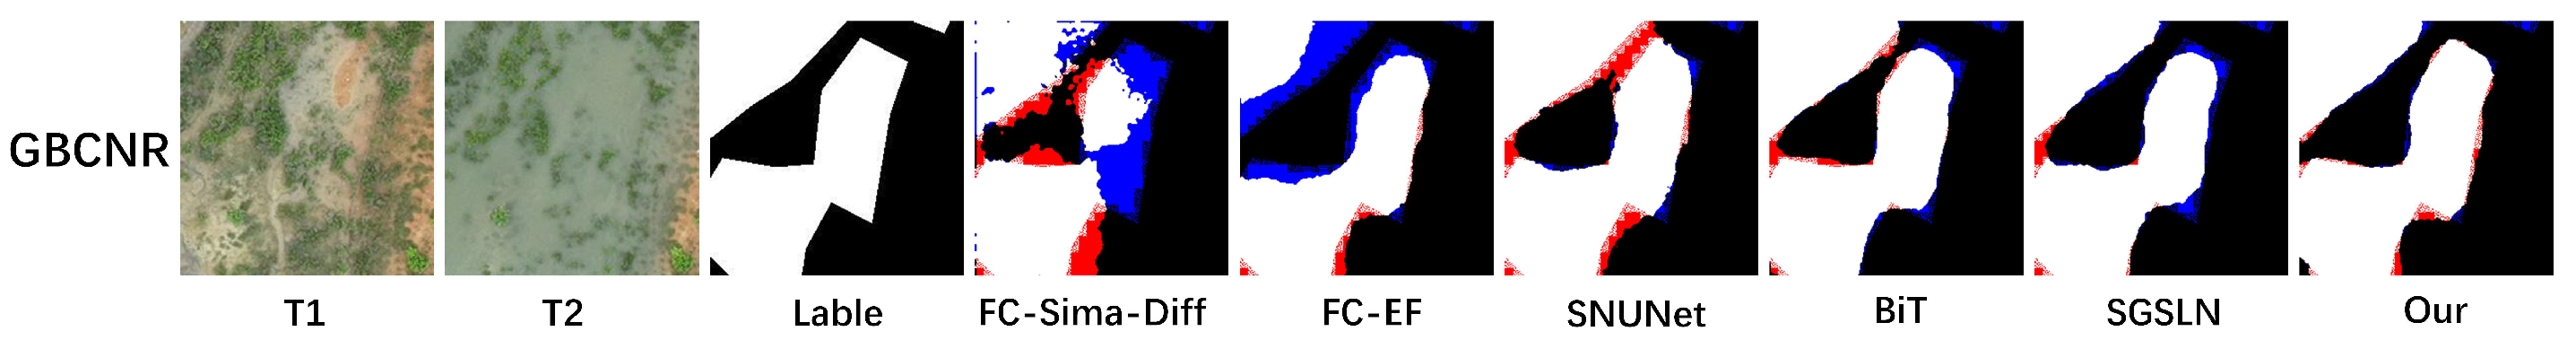
The comparison results on the GBCNR dataset are presented in
Table 5. As indicated in
Table 5, the proposed DACA-Net outperforms other methods, achieving the highest scores of 56.3% for IoU, 72.04% for F1, and 66.59% for P on the GBCNR dataset. Additionally, the R rate reaches 78.46%, and the F1 shows an improvement of 3.94% comparable with the suboptimal method.
This result indicates that our method achieves substantial improvement on wetland remote sensing datasets such as GBCNR, demonstrating that it not only performs well on datasets involving buildings and roads but also exhibits superior generalization ability across diverse scene types.
As shown in
Figure 11, the visualized comparison experiments on change detection using the self-constructed GBCNR dataset reveal significant performance differences among various methods in addressing intra-class variation and boundary ambiguity in natural surface scenes. Spatial comparisons between the bi-temporal images (T1 and T2) and the ground-truth labels demonstrate that the traditional FC-Siam-Diff method suffers from extensive red–blue mixed artifacts due to feature confusion. The deep learning-based FC-EF method exhibits diffuse red false alarms in vegetated areas, while SNUNet and BiT effectively suppress missed detections but still show residual blue omissions in overlapping regions. The SGSLN method, affected by excessive smoothing, generates fragmented red–blue errors along building edges. In contrast, the proposed method preserves the structural integrity of farmland-to-building transition zones while effectively suppressing shadow-induced disturbances. The blue omission regions are mainly concentrated in sub-pixel-level change areas, indicating that our network achieves superior feature discrimination, particularly for low-contrast object boundaries. This highlights its robustness and suitability for fine-grained change detection in complex natural environments.
5. Conclusions
This paper presents DACA-Net, a novel architecture for remote sensing image change detection based on the EDED framework. DACA-Net comprises two encoders, two decoders, and a DACAM module. The DACAM employs a combination of spatial attention mechanisms, channel attention mechanisms, and multi-scale attention mechanisms to learn the attention weights. This approach enables the model to automatically adjust the appropriate scale in accordance with the features of the input image, thereby assisting the encoder in accurately extracting relevant features from an abundance of background information within the image. This capability provides guidance for precisely locating changing regions in future analyses. DACAM effectively integrates multi-scale contextual features to maximize its ability to capture changes in remote sensing images while minimizing interference from complex backgrounds. Furthermore, experimental results demonstrate that DACAM significantly enhances the model’s generalization capabilities and improves both accuracy and overall performance. Additionally, this study constructs a UAV remote sensing image dataset, GBCNR, focused on Guangxi Beihai coastal nature reserves to address gaps present in existing wetland remote sensing datasets. Extensive experiments were conducted using three public datasets—LEVI-CD, CLCD, and SYSU-CD—and our self-constructed UAV dataset, GBCNR. DACA-Net demonstrates excellent performance across the four datasets: LEVIR-CD, CLCD, SYSU-CD, and GBCNR, with F1 improving by 0.31%, 4.26%, 1.2%, and 3.94% comparable with the second-best methods, respectively. Notably, the improvements are particularly pronounced in more complex scenarios with greater interference, such as CLCD and GBCNR. The proposed DACAM significantly enhances the model’s ability to perceive target change regions and effectively suppresses background interference. Furthermore, the self-constructed GBCNR wetland remote sensing change detection dataset fills a gap in this field. The findings of this study are expected to be widely applied in areas such as land use monitoring, ecological environment protection, and urban expansion identification, providing more efficient and intelligent remote sensing change detection tools for related fields.


