Abstract
This study introduces a custom-designed CNN architecture that extracts robust, multi-level facial features and incorporates preprocessing techniques to correct or reduce asymmetry before classification. The innovative characteristics of this research lie in its integrated approach to overcoming facial asymmetry challenges and enhancing CNN-based emotion recognition. This is completed by well-known data augmentation strategies—using methods such as vertical flipping and shuffling—that generate symmetric variations in facial images, effectively balancing the dataset and improving recognition accuracy. Additionally, a Loss Weight parameter is used to fine-tune training, thereby optimizing performance across diverse and unbalanced emotion classes. Collectively, all these contribute to an efficient, real-time facial emotion recognition system that outperforms traditional CNN models and offers practical benefits for various applications while also addressing the inherent challenges of facial asymmetry in emotion detection. Our experimental results demonstrate superior performance compared to other CNN methods, marking a step forward in applications ranging from human–computer interaction to immersive technologies while also acknowledging privacy and ethical considerations.
1. Introduction
In recent years, immersive technologies, such as virtual reality (VR), augmented reality (AR), and mixed reality (MR), have become major subjects of interest in research and industry due to their potential to transform various fields, from education and entertainment to professional training and healthcare. Recent studies have mainly focused on the development and optimization of haptic feedback, which provides users with a tactile sensation or physical interaction in virtual environments, thereby enhancing the level of realism and engagement.
However, emotional feedback, which can be observed and interpreted through facial expressions, represents another essential component of immersive experiences. The ability to understand and respond to users’ emotions in real time plays an important role in creating a natural and authentic interaction between humans and immersive systems. Recognizing facial emotions through convolutional neural networks (CNNs) is an advanced and effective tool for analyzing emotional experiences and providing appropriate feedback.
Facial emotions are not only essential indicators of a person’s internal state but also mechanisms that provide fundamental information about intentions and attitudes. They can be defined as a universal language through which we communicate our affective experiences. Throughout history, researchers and psychologists have explored the complexity of human emotions, focusing, in particular, on the facial expressions that accompany them. In this context, the study of facial emotion recognition is grounded in Charles Darwin’s [1] evolutionary theory, which suggests that certain facial expressions emerged as a way to communicate emotional states that could influence survival and social interactions.
Studies show that recognizing “what is seen on the face” can influence not only our perception of others but also our emotional reactions. For example, a facial expression of joy can generate a sense of comfort and openness, while an expression of Fear or anger can induce a state of alertness or even anxiety [2]. This emphasizes the interconnection between expressed and perceived emotions, having a direct impact on social dynamics.
Research conducted by Paul Ekman, a pioneer in this field, emphasizes that there are seven fundamental emotions that are recognized through facial expressions: joy, Sadness, Fear, anger, Disgust, surprise, and contempt [3]. Each of these emotions has a distinct function and is associated with physiological and behavioral responses that reflect the way an individual perceives and reacts to the surrounding environment.
This classification has not only revolutionized the understanding of emotions but has also opened new directions for research regarding non-verbal communication and social perception.
However, not all researchers agree with Ekman’s assertions. Gendron and his collaborators conducted a similar study, but unlike Ekman, they did not provide definitions of facial expressions, which led to difficulties in replicating results [4]. Other research, such as that conducted by Reisenzein et al., has highlighted the existence of reduced coherence between the identified universal emotions and the associated facial expressions [5]. This suggests that, despite some partial consensus, the debate regarding the universality of these emotions and expressions is far from settled.
The recognition of facial emotions through CNNs is significantly influenced by the concepts of symmetry and asymmetry in facial expressions. Research indicates that facial asymmetries are not merely cosmetic but play a major role in how emotions are expressed and perceived, which is vital for training effective CNN models. For instance, the authors of [6] emphasize that the left side of the face often displays more intense emotional expressions due to the right hemisphere’s dominance in emotional processing. This inherent asymmetry can create challenges for CNNs, as traditional datasets may not adequately represent the emotional cues present in the less expressive side of the face. Additionally, the work by [7] highlights that the intensity of expressions can vary based on hemispheric dominance, suggesting that CNNs must be trained on diverse datasets that capture these details to improve accuracy in emotion recognition. Furthermore, ref. [8] provides evidence that the orientation of facial poses affects emotional expression, indicating that CNN architectures should be designed to account for variations in pose and expression to enhance their robustness. By integrating all these into the design and training of CNNs, models can be created that are capable of accurately recognizing emotions that reflect the complexities of human emotional expression.
In this context, in order to address the challenges associated with facial emotion recognition and to contribute to the development of efficient and innovative solutions in this field, this paper aims to achieve the following objectives:
OB1: Leveraging symmetry and addressing asymmetry.
OB2: Development and validation of a custom CNN model.
Beyond investigating symmetry techniques aimed at improving facial emotion recognition through CNNs, this study also proposes the development of a network focused on creating an efficient model for facial emotion recognition and its implementation in a real-time facial expression recognition application. Building a CNN from scratch for facial emotion recognition provides a detailed understanding of the internal mechanisms of the network, thereby facilitating the customization and optimization of the network architecture. Unlike pre-trained models, such as EfficientNet or ResNet, which are computationally expensive and may include redundant features not specifically tailored for facial emotion recognition, our approach ensures a lightweight, interpretable, and resource-efficient model optimized for real-time applications.
It is important to note that the images used for facial emotion recognition were not included in the datasets covered by standard pre-trained models. This reality emphasizes the need to develop a comprehensive learning model that can be appropriately adapted to the unique characteristics and specific requirements of the addressed problem. Thus, a customized model responds more adequately to current challenges in the field and contributes to the overall advancement of facial emotion recognition technologies, opening new research and application possibilities across various domains, from psychology and sociology to human–computer interaction and marketing.
Therefore, this endeavor is not limited to technical improvements but has profound implications for how we can advance our understanding of human emotions through modern technologies.
2. Literature Review
Among the most popular techniques developed in the initial period of this field are Fisherfaces [9] and Eigenfaces [10], which used advanced mathematical methods such as Principal Component Analysis (PCA) [11] and Linear Discriminant Analysis (LDA) [12]. In the contemporary technological era, facial emotion recognition methods have evolved significantly, benefiting from advances in the field of artificial intelligence. CNNs have become an exceptionally effective tool for the automatic recognition of these facial emotions, demonstrating promising applications in computer vision [13]. Several relevant studies have used widely recognized datasets, such as Cohn–Kanade (CK) [14], Cohn–Kanade Extended (CK+) [15], facial expression recognition (FER2013) [16], and Japanese Female Facial Expression (JAFFE) [17]. These resources include the seven fundamental emotions recognized in the research conducted in this field [18].
Supta et al. [19] developed an FER system utilizing Histogram of Oriented Gradients (HOG) and Support Vector Machine (SVM) technology, achieving remarkable accuracy levels of 97.62% for the JAFFE dataset and 98.61% for the CK dataset. Traditional methods for feature extraction in emotion recognition systems typically involve complex image preprocessing and manual feature extraction, which are time-consuming [20]. This manual process heavily relies on the prior knowledge and experience of researchers, and the techniques used can significantly influence the efficiency of the extracted features, potentially leading to variations in system performance. In contrast, an automated approach based on deep learning has proven highly effective for image classification, though it requires large datasets for training to achieve efficient recognition. Recent studies have shown the effectiveness of automated approaches in the feature extraction process, particularly using CNN algorithms. These approaches enable more robust feature extraction that is less susceptible to subjective variations, thereby enhancing the accuracy and efficiency of emotion recognition systems.
Ramalingam and Garzia [21] developed a CNN algorithm that integrates a convolutional layer, rectified linear unit (ReLU), max pooling layer for feature extraction, and a fully connected layer, achieving an accuracy of approximately 60% on the FER2013 dataset, which contains 35,887 images. In another study, they employed transfer learning with the pre-trained VGG16 model on FER2013, achieving an accuracy of 78%. Both these accuracies are rather low.
Raja Sekaran et al. [22] implemented a transfer learning method using AlexNet as a pre-trained model and introduced an early stopping mechanism to address overfitting. This model achieved an accuracy of 70.52% on the FER2013 dataset. Abdulsattar and Hussain [23] developed six dedicated deep learning models for facial expression identification, including MobileNet, VGG16, VGG19, DenseNet121, Inception-v3, and Xception. They evaluated these models through transfer learning strategies and fine-tuning on the FER2013 dataset. Their results demonstrated that fine-tuning outperformed transfer learning, with efficiency variations ranging from 1% to 10%. Notably, pre-trained models like ResNet101V2 achieved remarkable performance, with a training accuracy of 93.08% and a validation accuracy of 92.87%. These findings highlight the effectiveness of deep learning approaches in facial expression recognition and the importance of advanced preprocessing and model optimization, but they require considerable computational resources.
Sajjanhar et al. [24] showed that the type of preprocessing applied to input data can significantly influence the quality of the resulting model. Meena et al. [25] investigated the use of a CNN for emotion identification based on facial expressions, utilizing both the CK+ and FER2013 datasets. They developed various architectures to assess the effectiveness of the models on these datasets. The CNN-3 model, which classifies expressions into three categories—positive, negative, and neutral—achieved 79% accuracy on FER2013 and 95% on CK+. In comparison, the CNN-7 model, which recognizes seven basic expressions, demonstrated slightly lower accuracy: 69% on FER2013 and 92% on CK+. These results indicate that the complexity of facial expression classification affects model efficiency, keeping low accuracies on the FER2013 dataset.
Recent research has also explored advanced models to improve emotion recognition from video data [26,27]. Bilotti et al. [27] proposed a multimodal approach using CNNs, integrating frames with human faces, optical flow, and Mel spectrograms. This method achieved an accuracy of approximately 95% on the BAUM-1 dataset and 95.5% on the RAVDESS dataset. The accuracies are very high, but the BAUM-1 and RAVDESS datasets provide multimodal datasets that include audio–visual recordings with posed expressions and speech components, while FER2013 consists of a large number of unconstrained, in-the-wild grayscale facial images covering seven fundamental emotions.
The limitations in the current literature on FER are multifaceted and significantly impact the effectiveness of existing systems. One major issue is the tendency of deep learning models to overfit, particularly when trained on limited datasets, which can result in poor generalization to real-world scenarios [18,23]. Additionally, the reliance on specific datasets, such as the Cohn–Kanade (CK) dataset, raises concerns about the representativeness of the training data, as these datasets often contain posed expressions rather than spontaneous emotional responses, leading to discrepancies in model performance [15]. The computational complexity of deep learning approaches further complicates their practical application, as they require substantial resources for training and inference, which may not be feasible in real-time settings [24]. Moreover, the simplistic categorization of human emotions in many models fails to capture the nuanced and dynamic nature of emotional expressions, which can vary significantly across individuals and contexts [25,26]. Finally, ethical considerations surrounding the deployment of FER technologies, particularly in sensitive areas such as surveillance and healthcare, necessitate careful scrutiny to prevent potential misuse and ensure respect for individual privacy [20]. Collectively, these limitations highlight the need for ongoing research to develop more robust, generalizable, and ethically sound FER systems.
In light of the previously presented research, significant progress can be observed in the field of facial emotion recognition, particularly through the use of CNNs and modern deep learning methods. Studies highlight both the efficiency of customized CNN architectures and the advantages of using pre-trained models through transfer learning and fine-tuning to enhance performance.
However, certain challenges remain regarding the optimization of CNN architectures to address the complexity of facial expressions, especially under conditions of asymmetric variability and the need for advanced preprocessing of input data. Also, data augmentation methods and asymmetry correction strategies represent promising directions for robustly improving system performance.
These aspects pave the way for more detailed investigations into the following research questions:
- What are the most effective methods for correcting the asymmetry of facial expressions to achieve improved performance of the CNN model?
- To what extent does data augmentation, through the generation of symmetrical variations, contribute to increasing accuracy in facial emotion recognition?
- How can the architecture of a CNN be optimized to improve real-time facial emotion recognition?
- How can the performance of the CNN be evaluated, and what are the limitations of the model in facial emotion recognition?
3. Materials and Methods
The objectives guide the methods and approaches adopted in this study, as shown in Figure 1.
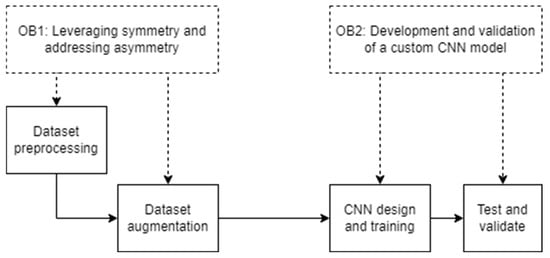
Figure 1.
Research flowchart illustrating the objectives and methods employed.
OB1: Leveraging symmetry and addressing asymmetry. To improve the performance of CNNs in recognizing facial emotions, image preprocessing techniques aimed at correcting or reducing asymmetry in facial expressions are used. Asymmetry often poses a challenge for models by introducing variability that can affect accurate classification. Additionally, image augmentation methods are employed to generate symmetrical variations, thereby enhancing the diversity and representativeness of the training dataset. These methods aim to provide the model with more balanced and varied data, improving its ability to generalize across different cases.
OB2: Development and validation of a custom CNN model. To address the unique challenges posed by real-time facial emotion recognition, the focus is on the development of a custom CNN model. The model is designed and trained to efficiently classify facial expressions, with particular attention to the complexities introduced by asymmetrical features. Following its development, the CNN is tested for its performance in recognizing emotions. Validation is conducted on unseen datasets to assess the model’s generalizability and robustness, ensuring its applicability in real-world cases.
The following subsections provide a detailed overview of all the materials and methods involved.
3.1. Dataset Analysis
In selecting the dataset for this study, we considered several widely used benchmarks in FER, including Cohn–Kanade Extended (CK+), FER2013, AffectNet, and RAF-DB, each with distinct characteristics and advantages. CK+ is a well-structured dataset containing high-quality, sequentially captured facial expressions, primarily in controlled environments. While it is effective for analyzing posed emotions, its relatively small size and limited diversity in real-world variations make it less suitable for deep learning models that require large-scale data. AffectNet and RAF-DB provide more extensive emotion annotations, including compound expressions, offering a richer dataset for fine-grained emotion recognition. However, these datasets come with increased computational costs due to their complexity and larger image resolutions.
Given the objectives of our study, we chose FER2013, a widely recognized benchmark dataset, for its large-scale, diverse, and challenging nature. FER2013 contains 35,887 grayscale images of facial expressions across seven fundamental emotions, collected from various sources under unconstrained, real-world conditions. Unlike CK+, FER2013 provides significant variability in facial angles, lighting, and occlusions, which better simulates the challenges encountered in real-world FER applications. However, we acknowledge certain limitations of FER2013, including its class imbalance—where emotions such as Disgust are underrepresented—as well as inconsistencies in annotation quality due to its automatic collection process. Despite these limitations, FER2013 remains one of the most widely used datasets for benchmarking CNN-based emotion recognition models, ensuring comparability with existing research while providing a robust training and evaluation platform.
FER2013 is a dataset provided by Kaggle, introduced at the International Conference on Computer Vision (ICCV) in 2013 [28,29,30]. This dataset was developed to support the advancement of research in the field of emotion recognition through the analysis of facial expressions. The dataset contains images sized 48 × 48 pixels that capture various facial expressions. The images are grouped into the 7 types of emotions. Each image is associated with a label indicating the predominant emotion, thus facilitating the training of machine learning models. The dataset is divided into two parts: one for training and one for testing, which is essential for evaluating the performance of the developed models.
A notable aspect of the dataset is that the images contain facial expressions of individuals of different ages, genders, and races, leading to diversity and balanced representation. As research in artificial intelligence continues to evolve, FER2013 will remain a cornerstone for future innovations in recognizing and interpreting human emotions.
3.2. Data Augmentation
To address the challenges of asymmetry in improving facial emotion recognition based on a CNN, we considered various data augmentation techniques and class weight adjustments:
- Case 1: Training the CNN using data augmentation with the Shuffle function.
- Case 2: Training the CNN using data augmentation with the Shuffle and Flip-Vertical functions.
- Case 3: Training the CNN using data augmentation with the Loss Weight parameter.
- Case 4: Training the CNN using data augmentation with the Shuffle function and the Loss Weight parameter.
- Case 5: Training the CNN using data augmentation with the Flip-Vertical and Shuffle functions and the Loss Weight parameter.
- Case 6: Training the CNN using data augmentation with the Shuffle function and a larger number of images in the test set.
All programs and tests were run on a general-purpose laptop with an Intel Core i7 processor, 1.80 GHz, 16 GB RAM, and a 512 GB hard drive, and no GPU. The software used to run the program was Python 3.9 with the Keras and TensorFlow 2.16 libraries, which are optimized for emotion-classification tasks based on images.
In this paper, for all cases, images from the FER2013 dataset were used for training the network, and the distribution of images is presented in Figure 2. There is an imbalance between classes in both the training and testing sets. The training set contains 28,412 images of size 48 × 48 pixels in grayscale.

Figure 2.
Emotion image distribution in the training and validation sets.
For the proposed Cases 1–5, images from the FER2013 dataset [31] were used, which were divided as follows: 80% for the training set and 20% for validation. For the validation images, publicly labeled images from the FER2013 dataset were used, while privately labeled images were replaced with images from another source on kaggle.com [32]. The validation set contained 7066 images that were not included in the training set. Their distribution is presented in Table 1.

Table 1.
Distribution of data in the validation set.
For Case 6, the images in the dataset were divided as follows: 68% of the images were for the training set, and 32% were for the validation set. The test set contained 13,846 images and was enhanced with images that were not known, meaning they were not found in the training set. Their distribution is presented in Figure 2.
Regardless of the images we had in the datasets for facial expressions, the testing and training images were processed by normalizing the pixel values. Two image generators were created: one for training and one for testing/validation.
The flow from the folder function was used to scan the subfolders and collect and process all the data. Each image was resized to 48 × 48 pixels, and batches of size 64 were created with the color mode set to grayscale, while the class mode created categories based on the structure of the subfolders.
The proposed network architecture is designed to process grayscale images of 48 × 48 pixels and aims to classify them into one of the seven emotion categories. This specification directly influences the architecture of the neural network, setting the number of neurons in the output layer to 7, allowing the model to associate features extracted from the data with the seven emotions. The model evaluates each input against these emotions, using the ReLU activation function to determine the probability that an input belongs to a specific class.
3.3. Convolutional Neural Network
A CNN represents a specialized category of a neural network that has been specifically developed to address the challenges associated with image classification and recognition [33]. It is an advanced technology frequently used in fields where data are of considerable complexity or size, exceeding the capabilities of traditional machine learning methods. These systems are structured in a series of layers, each with distinct responsibilities that contribute to the learning process and optimization of the model’s performance [34]. CNNs use a specific type of layer called a convolutional layer, which performs a convolution operation on an input image, thereby generating a feature map at the output [35]. In the context of image classification, the convolution operation serves to detect patterns within images, indicating the presence of a specific object or feature unique to a particular class.
The main components of a CNN are as follows:
- The first layer is the input layer, whose main function is to process the raw image data. It is responsible for transforming visual information into a compatible format usable for the subsequent stages of the model.
- The next layer, the convolutional layer, applies a series of filters to the image. These filters are essential as they extract relevant features from the image, such as edges, corners, and textures. This feature extraction is important for understanding facial structures and the emotions they send. After applying the filters, the pooling layer serves to reduce the image size, thus decreasing the amount of data that needs to be processed. This reduction not only makes processing more efficient but also helps achieve a better level of model generalization.
- Furthermore, the use of a dropout layer is a common method in training neural networks. This layer randomly sets a percentage of the neurons in that layer to zero during each training iteration, typically between 20% and 50%. The goal of this method is to prevent excessive dependence of the network on a single feature or neuron, which could lead to overfitting and, consequently, poor generalization on new data.
- Finally, the output layer synthesizes the processed information and produces the final classification. To effectively train a CNN for facial emotion detection, it is essential to have a large dataset of appropriately labeled images that reflect the desired emotions.
Regardless of the chosen method, facial expression recognition consists of 4 main stages, as represented in Figure 3.
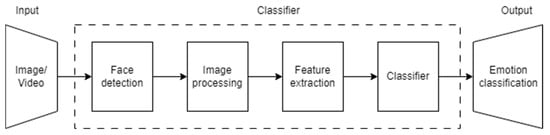
Figure 3.
Stages of facial expression recognition.
Face detection is the stage responsible for selecting the region of interest (ROI) from an input image that will be used in the next stages of facial expression recognition systems.
In the literature, a notable example of this type of approach is the Viola–Jones face detector, recognized for its efficiency in this field [36]. Within this algorithm, a significant number of positive images (those containing faces) and negative images (those not containing faces) are used to train the model. An essential aspect of this process is the use of Haar features, which are systematically applied to all images in the training set. The goal is to determine the most suitable threshold for classifying faces as positive or negative detections, thus optimizing the model’s accuracy.
However, it is important to mention that although faces can be identified in the input image, this does not guarantee that they are in a suitable condition for analysis. It is essential to verify the geometric correlation of the face whose emotions are to be classified with the geometric models of the faces used in the training of the classifier. Thus, geometric variations that can affect the quality of face detection and analysis include, in particular, scaling, rotation, and the presence of noise [37]. These transformations can negatively influence the emotional identification process and, therefore, must be carefully managed to ensure an accurate and correct assessment of affective states.
Image processing represents a fundamental step in facial emotion recognition systems. This phase involves transforming and organizing raw data to enhance its quality and relevance. In the absence of proper processing, data analysis can generate inadequate or even incorrect results.
The use of processing techniques, such as normalization, noise filtering (bilateral filter [38], Gaussian filter [39]), and anomaly detection and correction (histogram equalization [40]), allows for the extraction of significant and relevant features from these datasets.
Ensuring a high standard of data quality is an essential factor for the performance of the machine learning model. A dataset that has been properly processed is not only capable of improving prediction accuracy but also contributes to the efficiency of the algorithms used. Datasets dedicated to emotion recognition are generally small in size. This limitation constitutes a major obstacle because training on low-volume datasets can lead to overfitting, a phenomenon frequently encountered in machine learning models [41]. Overfitting occurs when a model successfully classifies the data used during the training process but faces significant challenges in classifying new data that were not previously used in the training process. This situation results in poor generalization performance, which is a major limitation for the practical use of that model.
To counteract this problem, which is often the result of using small datasets, data augmentation techniques are employed to increase the volume of the available data by modifying the data while preserving the integrity of the original meanings. The implementation of data augmentation can be achieved through a series of geometric and chromatic transformations, such as cropping, flipping, rotating, adjusting brightness, or resizing [42].
Regarding feature extraction, in the context of facial emotion recognition techniques, researchers apply a variety of conventional methods to extract relevant features from input images. These methods include cropping faces followed by converting them into monochrome [43] images, approaches based on Local Binary Patterns (LBPs) [44], optical flow analysis [45], and Principal Component Analysis (PCA) [46], as well as the use of Histogram of Oriented Gradients (HOG) [19]. Also, a significant number of studies resort to using automated methods for feature extraction by implementing algorithms based on CNNs.
Classification involves applying specialized algorithms to the features extracted from the initial data. After these features have been extracted and appropriately processed, the next step is to implement classification algorithms to determine the emotion expressed on the human face. Among the most common classification techniques are CNNs, which are recognized for their ability to learn complex representations from input data [47]. By using convolutional layers, these networks can identify and extract relevant features from visual or textual data, significantly impacting the accuracy of emotion classification.
3.4. Metrics Used in Evaluation
To evaluate the proposed neural network, we used the following metrics: confusion matrix, F1 score, precision, and recall [48].
The confusion matrix is an essential tool in evaluating the performance of a classification model, providing information regarding the correct and incorrect classifications of instances. In the literature, it is also referred to by the name the error matrix. True Positive (TP) indicates instances in the dataset correctly classified as belonging to the positive class; True Negative (TN) indicates instances in the dataset correctly classified as belonging to the negative class; false positive (FP) indicates instances in the dataset that were incorrectly classified as positive; and False Negative (FN) indicates instances in the dataset that were incorrectly classified as negative.
The values on the diagonal represent the number of instances correctly classified for each class. The values outside the diagonal indicate the number of instances that were misclassified.
Accuracy is the ratio of correctly predicted values to the total predicted values. The higher the accuracy, the better the performance of the model.
Precision measures the accuracy of the model’s positive predictions [49]. It is calculated according to the formula:
Recall or sensitivity measures the ability of the model to correctly identify positive instances [50]. It is calculated according to the formula:
The F1 score is the harmonic mean of precision and recall. It is an essential metric used to evaluate the performance of a classification model, especially in the case of datasets with unbalanced classes, as it provides a more balanced assessment than using precision or recall alone [51]. It is calculated according to the formula:
The F1 score ranges from 0 (poor performance) to 1 (perfect performance). A higher F1 score indicates better model performance.
3.5. CNN Architecture
The model was defined sequentially. This approach facilitates adding layers in a specific order, thus creating a network architecture that is intuitive and easy to manage. The model structure is designed to reflect a gradual progression in complexity, which allows for efficient and accurate processing of input data. The network structure is represented in Figure 4.

Figure 4.
Network structure.
The proposed model includes three convolutional layers (Conv2D), each with a different number of filters: 32, 64, and 128. These layers play an essential role in extracting relevant features from the input images. The first convolutional layer, with 32 filters, is responsible for detecting basic features such as edges and textures. Then, the second layer, with 64 filters, captures more complex features like shapes and patterns. Finally, the 128-filter layer deepens the analysis, identifying more complex combinations of features and allowing the model to learn meaningful representations of the visual data.
To introduce non-linearities into the network, the ReLU activation function was chosen. This is a frequently used choice in modern neural network architectures, having the advantage of allowing the network to learn complex functions and handle various classification tasks. In addition to the ReLU activation function, a subsampling technique called MaxPooling was applied. MaxPooling helps reduce the volume of information, keeping the most relevant features extracted from the previous layers and resulting in a more efficient and manageable network.
Another important aspect of the model is the use of Dropout as a regularization method. This technique plays an important role in preventing overfitting, a common problem in deep learning. By deactivating neurons randomly during training, Dropout helps the model not to depend too much on a limited set of neurons, which improves its generalization to new data.
To be able to efficiently interact with fully connected layers, we included a Flatten layer, which transforms the result of the last convolutional layer into a one-dimensional matrix. This step is essential because it allows the model to process the extracted features into a format suitable for classification. Data flattening ensures that complex information extracted by previous layers is presented in a form that can be used by fully connected layers.
The Dense layer, which follows the Flatten layer, is responsible for classifying the data. It receives the features extracted from the convolutional layers as input and processes them to determine the belonging to the different classes. In this layer, we included a ReLU activation function, which helps introduce non-linearity into the model, making it easier to learn complex relationships between the data. We also implemented Dropout with a rate of 20% to add an additional layer of regularization, which helps to prevent overfitting and improve the generalization of the model on new data.
In the end, the output layer is created using a Dense function, with the number of units equivalent to the number of classes we want to classify, in this case, 7 classes of emotions. The softmax activation function is applied to this layer, generating belonging probabilities for each of the defined classes. This allows the model to provide a probability distribution, indicating how likely it is that each input is associated with a particular emotion.
Our custom CNN architecture is optimized for facial emotion recognition, integrating convolutional layers for feature extraction, pooling layers for dimensionality reduction, and fully connected layers for classification. The network processes grayscale images of size 48 × 48, extracting hierarchical spatial features through successive convolutional layers with ReLU activation functions, ensuring non-linearity and efficient gradient propagation. Mathematically, the convolutional operation can be expressed as:
where is the output of the convolution at layer l, represents the filter weights, is the input feature map, is the bias term, and f(⋅) denotes the ReLU activation function.
To improve generalization and prevent overfitting, Dropout layers are incorporated at different stages, randomly deactivating neurons during training. Additionally, categorical cross-entropy loss is minimized during optimization, given by:
where represents the true label and is the predicted probability for class i. The model is optimized using the Adam optimizer, which updates weights iteratively as:
where mt and vt are moving averages of the gradient gt, β1 and β2 are decay rates, and α is the learning rate.
This model is designed to efficiently extract emotion-related features while maintaining computational feasibility for real-time applications. Further refinements, such as loss weighting and data augmentation, enhance its robustness to challenges like class imbalance and facial asymmetry, ensuring reliable emotion classification.
In our model implementation, weight initialization is handled by default in Keras when using ReLU activation functions in both convolutional and dense layers. This initialization technique prevents issues such as vanishing or exploding gradients, ensuring stable training and facilitating efficient learning. To further enhance generalization and mitigate overfitting, we incorporated Dropout layers at multiple stages, with dropout rates of 0.25 and 0.5, randomly deactivating neurons during training. This technique reduces model dependency on specific neurons, encouraging more robust feature learning.
For optimization, we utilized the Adam optimizer with a learning rate of 0.0001 and a decay factor of 10−6. Adam is a widely used adaptive optimization algorithm that combines the advantages of momentum-based and RMSprop optimization, leading to efficient weight update while maintaining stability across varying learning rates. The inclusion of weight decay ensures that learning rate adjustments continue throughout training, preventing the model from overfitting and maintaining generalization.
While explicit early stopping is not implemented in the training pipeline, the number of epochs (50) was carefully determined based on prior experiments to optimize model convergence. The combination of weight decay, dropout, and structured CNN architecture helps mitigate overfitting while maintaining strong generalization capabilities. Additionally, by monitoring validation accuracy trends during training, manual early stopping can be applied if performance degradation is observed.
The training process is designed to balance efficiency and stability using mini-batch stochastic gradient descent (SGD) with a batch size of 64. This approach optimally distributes computational resources while ensuring gradient stability. Furthermore, the steps per epoch and validation steps were configured to ensure that all available training and validation samples contribute effectively to the learning process, leading to a well-trained and generalizable model.
In our study, class imbalance was addressed through weighted loss adjustments, which ensured that underrepresented classes contribute proportionally to the overall loss function, thereby reducing bias toward majority classes. While focal loss and SMOTE (Synthetic Minority Over-sampling Technique) are widely used for handling imbalance, our approach was chosen for its computational efficiency and compatibility with our CNN model. Focal loss is particularly effective in object detection tasks where hard-to-classify examples require more emphasis, but in our case, weighted categorical cross-entropy provided a simpler and effective way to balance class contributions. Additionally, SMOTE, while useful for generating synthetic samples in tabular data, is less commonly applied to image-based datasets due to the complexity of generating realistic facial expression variations. Instead, our study leveraged data augmentation techniques (such as flipping and rescaling) to enhance representation across all classes.
4. Results and Analysis
4.1. CNN Testing
Confusion matrices are presented in this section.
The best classification for Case 1 (Figure 5) is for the emotion Happy, at 95%, with 1738 correctly predicted images. This is also due to the large number of images in the training set for this emotion. The worst performance is seen for the emotion Disgust, with a predictability percentage of 86%, which represents 96 correctly predicted images. It is also the class with the fewest images in the training set.
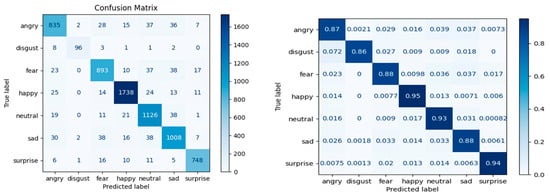
Figure 5.
Confusion matrix—Case 1: data augmentation with the Shuffle function.
The model’s performance for Case 2 (Figure 6) improves, where the Happy emotion increases to 96%, and the Sad, Fear, Angry, and Disgust emotions have a percentage of 88%. The prediction percentages are more homogeneous.
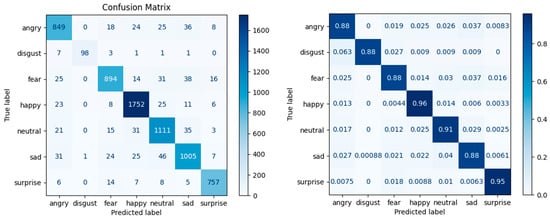
Figure 6.
Confusion matrix—Case 2: data augmentation with the Shuffle and Flip-Vertical functions.
In Case 3 (Figure 7), the prediction for the Fear class improves to 90%. The Disgust class remains with the lowest percentage of predictability, at 86%, and the Happy class remains with the highest percentage, at 94%.
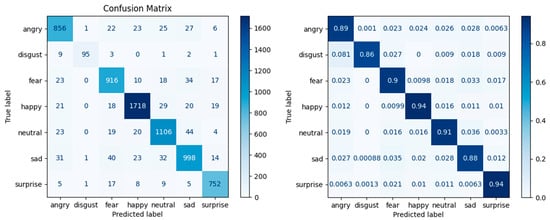
Figure 7.
Confusion matrix—Case 3: data augmentation with the Loss Weight parameter.
In Case 4 (Figure 8), 850 instances of Angry were correctly classified as “Angry”, representing 0.89, or 89%, correct classifications.
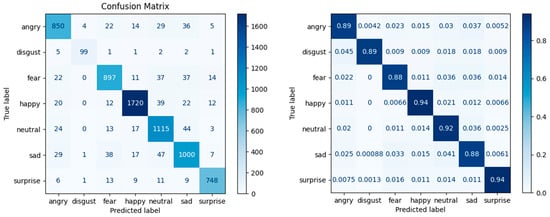
Figure 8.
Confusion matrix—Case 4: data augmentation with the Shuffle function and the Loss Weight parameter.
We notice that the best classification is for the emotion Happy, at 94%, with 1720 correctly predicted images. This is also due to the large number of images in the training set for this emotion. We see the weakest performance for the feelings of Fear and Sadness, at 88%, with 897 and 1000 correctly predicted images, respectively. One explanation is that the facial expressions for the feelings of Angry, Fear, and Sad can be similar in some circumstances, as seen in Figure 9.

Figure 9.
Similarities between feelings in the FER2013 dataset.
For example, we observe the following incorrect classifications for the feelings of Angry, Fear, and Sad:
- A total of 36 cases where the real emotion was “Angry” were incorrectly classified as “Sad”.
- A total of 37 cases where the real emotion was “Fear” were incorrectly classified as “Sad”.
Although in the training set, the fewest images were for the emotion Disgust, and we expected it to be in the last position in the hierarchy of prediction values, due to the similarity between the emotions Fear, Angry, and Sad, it is it is ranked in the second-to-last position with a percentage of 89% predictability, meaning that 99 images were correctly predicted.
In Case 5 (Figure 10), the emotion Happy has the best predictability percentage, at 94%, but the emotion Sad has the lowest predictability percentage, at 86%. The explanation, in this case, is also the similarity between the Fear, Angry, and Sad emotions.
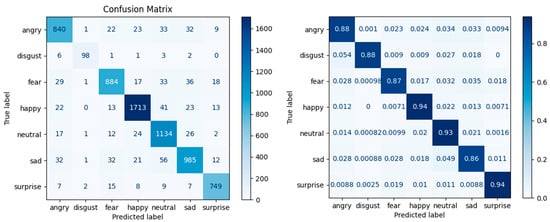
Figure 10.
Confusion matrix—Case 5: data augmentation with the Flip-Vertical and Shuffle functions and the Loss Weight parameter.
Case 6 (Figure 11) shows improvements for most classes and a general tendency to classify the emotions Angry and Disgust better.
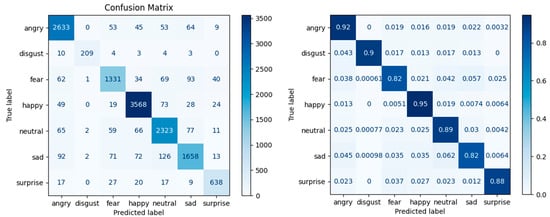
Figure 11.
Confusion matrix—Case 6: data augmentation with the Shuffle function and a larger number of images in the test set.
Table 2 presents, for all six cases proposed, the values for precision and accuracy at training and at testing, as well as the number of epochs for training.
Table 2.
Results of training for the six cases.
In the first five cases, the model achieved an accuracy between 91% and 92%, indicating good performance in terms of correctly identifying positive classes. These results suggest that the model is able to effectively recognize facial expressions. It was observed that the training accuracy was also quite high in these cases, demonstrating the model’s ability to learn from the available data.
In Case 6, the number of images in the validation set was higher but also more unbalanced compared to the rest of the cases. This is reflected in the accuracy value, indicating a decrease in performance in terms of generalizing the model on the test set. This difference shows the importance of balancing and preparing the dataset for the expected results.
In a specific way, Case 2 stands out for its use of data augmentation functions, i.e., shuffle and vertical flip, achieving the best overall performance. The augmentation by vertical flip addresses the asymmetry in the human face.
The performances on the test set for Cases 1–5 ranged between 90.51% and 91.16%, while Case 6 achieved the lowest accuracy on the test set of 89.25%.
The number of epochs varied between 25 and 50 in the analyses performed. Case 1, trained for 25 epochs, managed to achieve good performance, thus demonstrating that the developed model achieved an efficient adaptation to its data. This suggests that a smaller number of epochs is not necessarily a disadvantage but may indicate efficient learning in the particular context of the data used. On the other hand, Case 2, with 46 epochs, achieved the best precision of 92% and a training accuracy of 93.94%. This suggests that an average number of epochs can contribute to optimizing the performance, but there is no universal rule, as there are also situations in which models trained on a large number of epochs can suffer from the phenomenon of overtraining.
The metrics obtained on the emotion classes are found in Table 3.
Table 3.
Results for the six cases.
Accuracy analysis: Case 2 demonstrates a remarkable accuracy of 0.99 for the Disgust emotion class, suggesting that this model is exceptionally efficient in correctly identifying this emotion. Such performance is significant, as accuracy scores close to 1.0 indicate exceptional accuracy, reflecting the model’s ability to make clear distinctions between adjacent emotions and minimize classification errors. On the other hand, Case 4, with an accuracy of 0.84, shows a significantly poorer performance in identifying the Disgust emotion. This discrepancy may suggest that the model used in this case fails to capture the specific details of the expressions or the context in which Disgust is expressed.
When focusing on the emotion Angry, we observe a variable accuracy, ranging from 0.88 and 0.90. Case 6 stands out as having the best performance, with a score of 0.90. This suggests a robust ability in identifying an emotion that, although it may seem, in many cases, easy to recognize, can still vary considerably depending on the specific context and the associated facial expressions. The stability of the accuracy between cases suggests that the models used were trained on diverse and well-labeled datasets, but there remains potential for enhancement to achieve optimal performance.
Regarding the emotion Surprised, Cases 2 and 4 demonstrate their efficiency with a precision of 0.95, which highlights an accurate identification of this emotion. However, Case 6, with an accuracy of 0.87, indicates an inferior performance. This situation highlights the complexity of emotions and the challenges they present in automatic classification.
Recall analysis: Analyzing the case of the emotion Angry, it is observed that the model achieves a recall of 0.92, which suggests remarkable performance in identifying cases of Anger. This high value indicates that the model is able to detect the majority of instances in which Anger is present, thus demonstrating significant accuracy.
In contrast, the emotion Fear presents a lower recall of 0.82. This value suggests difficulties in correctly identifying the Fear emotion, indicating an area where the model needs improvement. The emotion Fear can often be subtle and can vary significantly depending on the context. For example, Fear can be expressed through a wide range of behaviors and facial expressions, which are not always obvious. This diversity makes the model face challenges in distinguishing Fear from other similar emotions, such as Sadness or Anger. In this regard, a deeper analysis of the training data and the social context is required to improve the identification of this emotion.
Regarding the emotion Happy, the results show constant and good performance, with a recall ranging from 0.94 and 0.96 for all analyzed cases. These high values suggest that the model is effective in recognizing the emotion Happy, which is logical considering that this is an emotion that is often easier to identify.
F1 score analysis: In the case of the emotion Disgust, the observations suggest an F1 score of 0.93 for Case 2, which is distinguished by a remarkable balance between precision and recall. This result indicates that the model was able to identify this emotion efficiently, both in terms of avoiding false positive classifications and correctly capturing positive examples. Case 4, on the other hand, records an F1 score of 0.92, which, although lower, still suggests high performance. This result could suggest refined distinctions among the various datasets used and the complexity of the context in which the emotions are manifested.
In conclusion, the models in Cases 1–5 perform well on most emotions, with high precision and recall. Case 6, although having some good values, shows signs of weakness in identifying the emotions Fear, Sad, and Surprised.
Case 2 is the best optimized, having the best precision and good accuracy on the training set, which suggests that it could be a good reference model.
To assess whether the observed performance improvements are statistically meaningful, a Wilcoxon signed-rank test was conducted to compare accuracy and precision values across multiple runs. This non-parametric test was chosen due to its robustness in handling small sample sizes and non-normally distributed data. The results indicated no statistically significant difference between the accuracy and precision values, confirming the stability and consistency of the model’s performance. This shows that the improvements observed across different experimental conditions are not due to random variations but rather reflect the effectiveness of the proposed approach in facial emotion recognition.
Comparing the results obtained in the literature on the FER2013 dataset (Table 4 and [52]) with the results obtained in this study, we can conclude that data augmentation with the Shuffle and vertical flip functions offers the best optimization, achieving the best accuracy, namely, 92%.
Table 4.
Results from the literature.
Comparing the validation accuracy results obtained for the FER2013 dataset in the literature using complex models (Table 5) with the results obtained in this study, we can conclude that the proposed CNN model with data augmentation offers the best accuracy of 91.16%.
Table 5.
Accuracy results from the literature [58,59].
When analyzing the experimental results, beyond the overall success rates of the model, it is important to examine the cases where misclassifications occurred and their potential causes. As observed in the confusion matrices, the highest classification accuracy is consistently achieved for the Happy emotion, with predictability percentages reaching up to 96%, largely due to the high number of training samples for this category. Conversely, the Disgust emotion exhibits the lowest predictability, ranging between 86% and 89%, which can be attributed to its underrepresentation in the training set.
Another recurring challenge is the misclassification of emotions with similar facial expressions, particularly among Angry, Fear, and Sad, as evidenced by instances where Fear was confused with Sad (37 cases) and Angry was misclassified as Sad (36 cases). This suggests that the model struggles with subtle variations in facial features that differentiate these emotions, a known limitation in FER systems, especially when trained on datasets like FER2013, where intra-class variations can be significant. Additionally, while applying data augmentation and class weighting strategies improved overall predictability, certain cases—such as Sad being the least accurately classified in Case 5 (86%)—demonstrate that these techniques alone may not fully resolve the inherent similarity-induced confusion among some emotions.
A further observation is that increasing the number of images in the test set (Case 6) led to improvements in classifying Angry and Disgust, suggesting that a more balanced dataset distribution during training and testing can enhance generalization. These findings indicate that while the model effectively captures distinct emotional patterns, future improvements could explore more sophisticated augmentation techniques, feature refinement strategies, or multimodal approaches incorporating additional cues like temporal dynamics or physiological signals to further enhance recognition accuracy in challenging cases.
4.2. Testing on Completely New Data
To validate the results obtained, testing was carried out on completely new data by developing an application.
After training and testing the network, one file was created to save the model, and another file was created to save the structure with all the parameters. These will be loaded when running the application.
For face detection, the Haarcascade classifier was used. The images captured from the camera were resized to 1280 × 720 pixels so that they fit well on the laptop screen.
The detection of each face was accessed through the width and height coordinates, framing the face detected from the images taken by the webcam in real time in a rectangle. Regardless of the input image, it was converted to grayscale because the model was trained on grayscale images, thus improving the accuracy of emotion detection. From the image converted to grayscale, the region of interest was accessed, and all the face images were cropped. After cropping the frame, each face image was resized to 48 × 48 in grayscale to be sent to the trained model for facial expression recognition. The list of all emotions was directly mapped with labels: at index 0, we have the emotion Anger; at 1, Disgust; at 2, Fear; at 3, Happiness; at 4, Neutral; at 5, Sadness; and at 6, Surprise.
Five subjects were trained to reproduce the seven emotions, where each emotion was trained four times with a 5 s hold, captured using a webcam at a speed of 20 fps. A total of 2000 raw images were thus collected for each emotion. The obtained accuracies are presented in Table 6.
Table 6.
Testing on completely new data.
An example of detection is shown in Figure 12, where the emotion with the highest confidence percentage can be seen, which is displayed as the detected emotion.

Figure 12.
Application results displaying emotions (images captured and used with the subject’s consent).
For the 30 fps camera used in our study, the interval between consecutive frames is 0.033 s. The maximum processing time per frame is 0.0238 s, which remains within this interval, ensuring that no frames are skipped during real-time processing. However, the first frame experiences a processing delay of approximately 0.11 s due to the initial camera startup overhead. This delay is only present at the beginning and is eliminated in subsequent frames, allowing smooth and uninterrupted real-time execution.
5. Conclusions, Limitations, and Research Directions
Given the increasing applicability of facial expression recognition in various fields, it is necessary to develop accurate and reliable systems. This paper presented the successful development of a three-layer convolutional neural network and its implementation in a real-time application. The architecture of the neural network model is based on a gradual progression in complexity, including activation functions, subsampling, and regularization techniques. The application is capable of recognizing the seven types of emotions (Happy, Sad, Angry, Fear, Surprise, Disgust, and Neutral). The analysis of the cases presented in this paper demonstrates the complexity and variability in the performances of a CNN model depending on the training settings. The high accuracy of 92% in Case 2 was achieved by training the CNN using the Shuffle and Flip-Vertical functions in data augmentation, which, compared to the other cases, provides valuable insight into the impact of data augmentation and test set size on model generalization. However, the subtle similarities between complex emotions such as Fear, Angry, and Sad generated confusion in the classification, suggesting the need for additional techniques to improve the differentiation between them.
Therefore, the implementation of this CNN model in facial emotion recognition achieved promising results and could also contribute to the development of other applications. In the future, it is possible that integrating the CNN with other artificial intelligence-based methods can improve the performance of the application.
Although this research demonstrated the successful development of a CNN model for facial emotion recognition and its implementation in a real-time application, there are several significant limitations that need to be addressed. First, the use of the FER2013 dataset, although relevant and diverse, presents an imbalance between classes, affecting the model’s performance in recognizing minimally represented emotions, such as Disgust and Surprise. Second, the reliance on grayscale images limits the applicability of the model to real-world situations, where data are colored and may include natural variations in light and contrast. Furthermore, the testing was conducted on a limited number of subjects, which may limit the generalizability of the model to a broader culturally and demographically diverse population. Last but not least, the ethical and privacy issues associated with real-time emotion recognition remain important challenges, requiring a responsible approach in the development and implementation of AI-based systems.
To address the limitations of FER2013, particularly the biases in age, ethnicity, and pose variation, our research incorporates data augmentation techniques to enhance model generalization across diverse facial expressions. By applying flipping, rotation, and rescaling, we introduce variability that helps mitigate pose-dependent biases. Additionally, we use class weighting to compensate for imbalances in underrepresented emotions, ensuring that the model does not disproportionately favor majority classes. While FER2013 lacks demographic annotations, our approach prioritizes robust feature learning rather than overfitting to specific facial characteristics, improving adaptability across different populations. These strategies allow our model to achieve strong recognition performance despite dataset limitations, making it suitable for real-world applications.
In our research, we took careful measures to address ethical and privacy concerns while ensuring responsible use of facial emotion recognition technology. Our study is based on the publicly available FER2013 dataset, which is widely used in emotion recognition research and is assumed to have been collected with appropriate consent from the individuals involved. Additionally, all experiments conducted on unseen data were performed with the expressed consent of the subjects, who were fully informed about the nature and purpose of this study. No personally identifiable information was stored or shared, and all image data used in testing were handled in compliance with ethical research guidelines.
Despite these precautions, we recognize the broader ethical implications of facial emotion recognition, particularly regarding bias, misinterpretation, and potential misuse in real-world applications. While our model demonstrates strong performance, it is essential to ensure that such systems are used transparently and responsibly, preventing applications that could infringe on personal privacy or lead to biased decision-making. Moving forward, integrating privacy-preserving techniques, such as data anonymization and ethical AI frameworks, can help mitigate risks while maintaining the benefits of facial emotion analysis in a fair and accountable manner.
These limitations highlight future research directions to optimize performance, extend generalizability, and responsibly address ethical issues.
Future work may extend this study by incorporating AffectNet and RAF-DB to further validate the model’s generalization ability across different emotion datasets. Additionally, future enhancements could explore the integration of multimodal data, such as combining facial expressions with physiological signals (e.g., heart rate, EEG) or speech-based emotion cues, to improve recognition accuracy and robustness. Furthermore, sophisticated augmentation techniques, including GAN-based data synthesis or domain adaptation methods, could be employed to enhance model performance and address dataset limitations, aligning with current advancements in emotion recognition research.
Finally, we note several research directions based on the method presented in this paper.
Such a system can have significant applications in multiple areas:
- Public speaking training: Providing accurate, real-time emotional feedback can help speakers improve their ability to transmit messages to their audience. By recognizing the emotions expressed on the faces of a virtual audience generated in virtual reality, an immersive system can identify the audience’s level of engagement, interest, or boredom. Thus, the speaker can learn to adjust their tone, pace, or gestures to better capture attention and transmit the message in a more empathetic and effective way.
- Actor training: Actors can use such systems to intensify their ability to transmit authentic and convincing emotions. By analyzing facial expressions in real time, the system can provide detailed feedback on the authenticity of the emotions transmitted, helping actors adjust their expressions and movements to create more believable performances.
- Emotional rehabilitation: In the context of mental health, facial emotion recognition systems can be integrated into virtual reality therapies to help patients recognize and control their emotions. For example, in the case of disorders such as social anxiety or autism, such a system can become a useful therapeutic tool in developing interaction and communication skills.
- More natural human–machine interfaces: In the context of interactions with robots or virtual assistants, facial emotion recognition allows systems to interpret the user’s emotional state and respond appropriately. This contributes to a more fluid and personalized experience.
In conclusion, a CNN-based facial emotion recognition system holds immense potential across diverse domains, offering transformative solutions for real-world challenges. From improving mental health monitoring and enhancing customer experience to advancing human–robot interactions and optimizing educational outcomes, the system can provide valuable insights and facilitate adaptive responses. Its applications in security, healthcare, entertainment, automotive safety, and workforce management demonstrate its versatility and societal impact. Furthermore, the integration of emotion recognition in areas such as telemedicine, assistive technologies, and behavioral research underscores its ability to contribute to both innovation and well-being. By leveraging this technology, we can enable more empathetic, efficient, and personalized systems, addressing complex needs in an increasingly dynamic world.
Author Contributions
Conceptualization, M.L. and A.C.I.; methodology, A.C.I.; software, G.L.S.; validation, M.L., G.L.S. and A.C.I.; formal analysis, M.L.; investigation, G.L.S.; resources, G.L.S.; data curation, G.L.S.; writing—original draft preparation, G.L.S.; writing—review and editing, M.L. and A.C.I.; visualization, M.L. and A.C.I.; supervision, M.L.; project administration, A.C.I.; funding acquisition, G.L.S. All authors have read and agreed to the published version of the manuscript.
Funding
This research received no external funding.
Data Availability Statement
FER2013 dataset, available at https://kaggle.com/competitions/challenges-in-representation-learning-facial-expression-recognition-challenge (accessed on 20 December 2024).
Acknowledgments
During the preparation of this manuscript, the authors used Copilot for the purposes of language editing, drafting assistance and references formatting. The authors have reviewed and edited the output and take full responsibility for the content of this publication.
Conflicts of Interest
The authors declare no conflicts of interest.
Abbreviations
The following abbreviations are used in this manuscript:
| CNN | convolutional neural network |
| PCA | Principal Component Analysis |
| LDA | Linear Discriminant Analysis |
| CK | Cohn–Kanade database |
| CK+ | Cohn–Kanade Extended database |
| FER2013 | facial expression recognition |
| JAFFE | Japanese Female Facial Expression database |
| HOG | Histogram of Oriented Gradients |
| SVM | Support Vector Machine |
| ReLU | rectified linear unit |
References
- Darwin, C. The Expression of the Emotions in Man and Animals; John Murray: London, UK, 1872. [Google Scholar]
- Sagliano, L.; Ponari, M.; Conson, M.; Trojano, L. The interpersonal effects of emotions: The influence of facial ex-pressions on social interactions. Front. Psychol. 2022, 13, 1074216. [Google Scholar] [CrossRef] [PubMed]
- Ekman, P.; Oster, H. Facial expressions of emotion. Annu. Rev. Psychol. 1979, 30, 527–554. [Google Scholar] [CrossRef]
- Gendron, M.; Roberson, D.; Van der Vyver, J.M.; Barrett, L.F. Perceptions of emotion from facial expressions are not culturally universal: Evidence from a remote culture. Emotion 2014, 14, 251–262. [Google Scholar] [CrossRef]
- Reisenzein, R.; Studtmann, M.; Horstmann, G. Coherence between emotion and facial expression: Evidence from laboratory experiments. Emot. Rev. 2013, 5, 16–23. [Google Scholar] [CrossRef]
- Indersmitten, T.; Gur, R. Emotion processing in chimeric faces: Hemispheric asymmetries in expression and recognition of emotions. J. Neurosci. 2003, 23, 3820–3825. [Google Scholar] [CrossRef]
- Murray, E.; Krause, W.; Stafford, R.; Bono, A.; Meltzer, E.; Borod, J. Asymmetry of facial expressions of emotion. In Understanding Facial Expressions in Communication; Mandal, M., Awasthi, A., Eds.; Springer: New Delhi, India, 2014; pp. 73–99. [Google Scholar] [CrossRef]
- Nicholls, M.; Wolfgang, B.; Clode, D.; Lindell, A. The effect of left and right poses on the expression of facial emotion. Neuropsychologia 2002, 40, 1662–1665. [Google Scholar] [CrossRef]
- Belhumeur, P.N.; Hespanha, J.P.; Kriegman, D. Eigenfaces vs. Fisherfaces: Recognition using class-specific linear projection. In Proceedings of the IEEE Computer Society Conference on Computer Vision and Pattern Recognition (CVPR 1997), San Juan, PR, USA, 17–19 June 1997; pp. 711–720. [Google Scholar] [CrossRef]
- Turk, M.; Pentland, A. Eigenfaces for recognition. J. Cogn. Neurosci. 1991, 3, 71–86. [Google Scholar] [CrossRef]
- Ramadhani, A.L.; Musa, P.; Wibowo, E.P. Human face recognition application using PCA and eigenface approach. In Proceeding of the 7 Second International Conference on Informatics and Computing (ICIC), Jayapura, Indonesia, 1–3 November 2017; pp. 1–5. [Google Scholar] [CrossRef]
- Lu, J.; Plataniotis, K.N.; Venetsanopoulos, A.N. Face recognition using LDA-based algorithms. IEEE Trans. Neural Netw. 2003, 14, 195–200. [Google Scholar] [CrossRef]
- Lecun, Y.; Bottou, L.; Bengio, Y.; Haffner, P. Gradient-based learning applied to document recognition. Proc. IEEE 1998, 86, 2278–2324. [Google Scholar] [CrossRef]
- Kanade, T.; Cohn, J.F.; Tian, Y. Comprehensive database for facial expression analysis. In Proceedings of the 4th IEEE International Conference on Automatic Face and Gesture Recognition (FG 2000), Grenoble, France, 28–30 March 2000. [Google Scholar] [CrossRef]
- Lucey, P.; Cohn, J.F.; Kanade, T.; Saragih, J.; Ambadar, Z.; Matthews, I. The extended Cohn-Kanade dataset (CK+): A complete dataset for action unit and emotion-specific expression. In Proceedings of the IEEE Computer Society Conference on Computer Vision and Pattern Recognition Workshops (CVPRW 2010), San Francisco, CA, USA, 13–18 June 2010. [Google Scholar] [CrossRef]
- Agostinelli, F.; Anderson, M.R.; Lee, H. Adaptive multi-column deep neural networks with application to robust image denoising. Adv. Neural Inf. Process. Syst. 2013, 26, 327. [Google Scholar]
- Lyons, M.; Akamatsu, S.; Kamachi, M.; Gyoba, J. Coding facial expressions with Gabor wavelets. In Proceedings of the 3rd IEEE International Conference on Automatic Face and Gesture Recognition (FG 1998), Nara, Japan, 14–16 April 1998. [Google Scholar] [CrossRef]
- Li, S.; Deng, W. Deep facial expression recognition: A survey. IEEE Trans. Affect. Comput. 2022, 13, 1195–1215. [Google Scholar] [CrossRef]
- Supta, S.R.; Sahriar, M.R.; Rashed, M.G.; Das, D.; Yasmin, R. An effective facial expression recognition system. In Proceedings of the 2020 IEEE International Women in Engineering (WIE) Conference on Electrical and Computer Engineering (WIECON-ECE 2020), Dhaka, Bangladesh, 26–27 December 2020; pp. 66–69. [Google Scholar] [CrossRef]
- Shi, W.; Jiang, M. Fuzzy wavelet network with feature fusion and LM algorithm for facial emotion recognition. In Proceedings of the 2018 IEEE International Conference of Safety Produce Informatization (IICSPI 2018), Chongqing, China, 10–12 December 2018; pp. 582–586. [Google Scholar] [CrossRef]
- Ramalingam, S.; Garzia, F. Facial expression recognition using transfer learning. In Proceedings of the International Carnahan Conference on Security Technology (CCST 2018), Montreal, QC, Canada, 22–25 October 2018; pp. 1–5. [Google Scholar] [CrossRef]
- Raja Sekaran, S.A.P.C.; Lee, P.; Lim, K.M. Facial emotion recognition using transfer learning of AlexNet. In Proceedings of the 2021 9th International Conference on Information and Communication Technology (ICoICT 2021), Yogyakarta, Indonesia, 3–5 August 2021; pp. 170–174. [Google Scholar] [CrossRef]
- Abdulsattar, N.S.; Hussain, M.N. Facial expression recognition using transfer learning and fine-tuning strategies: A comparative study. In Proceedings of the 2nd 2022 International Conference on Computer Science and Software Engineering (CSASE 2022), Baghdad, Iraq, 26–27 March 2022; pp. 101–106. [Google Scholar] [CrossRef]
- Sajjanhar, A.; Wu, Z.; Wen, Q. Deep learning models for facial expression recognition. In Proceedings of the 2018 International Conference on Digital Image Computing: Techniques and Applications (DICTA 2018), Canberra, Australia, 10–13 December 2018; pp. 1–6. [Google Scholar] [CrossRef]
- Meena, G.; Mohbey, K.K.; Khan, M.Z.; Kumar, S. Identifying emotions from facial expressions using a deep convolutional neural network-based approach. Multimed. Tools Appl. 2024, 83, 15711–15732. [Google Scholar] [CrossRef]
- Manalu, H.V.; Rifai, A.P. Detection of human emotions through facial expressions using hybrid convolutional neural network-recurrent neural network algorithm. Intell. Syst. Appl. 2024, 21, 200339. [Google Scholar] [CrossRef]
- Bilotti, U.; Bisogni, C.; De Marsico, M.; Tramonte, S. Multimodal Emotion Recognition via Convolutional Neural Networks: Comparison of different strategies on two multimodal datasets. Eng. Appl. Artif. Intell. 2024, 130, 107708. [Google Scholar] [CrossRef]
- Goodfellow, I.J.; Erhan, D.; Luc Carrier, P.; Courville, A.; Mirza, M.; Hamner, B.; Cukierski, W.; Tang, Y.; Thaler, D.; Lee, D.H.; et al. Challenges in representation learning: A report on three machine learning contests. Neural Netw. 2015, 64, 59–63. [Google Scholar] [CrossRef]
- Bapat, M.M.; Patil, C.H.; Mali, S.M. Database Development and Recognition of Facial Expression using Deep Learning. Int. J. Comput. 2024, 23, 606–617. [Google Scholar] [CrossRef]
- Giannopoulos, P.; Perikos, I.; Hatzilygeroudis, I. Deep Learning Approaches for Facial Emotion Recognition: A Case Study on FER-2013. In Advances in Hybridization of Intelligent Methods. Smart Innovation, Systems and Technologies; Hatzilygeroudis, I., Palade, V., Eds.; Springer: Cham, Switzerland, 2018; Volume 85. [Google Scholar] [CrossRef]
- Kaggle. FER2013 Dataset. Available online: https://kaggle.com/competitions/challenges-in-representation-learning-facial-expression-recognition-challenge (accessed on 20 December 2024).
- Kaggle. Face Expression Recognition Dataset. Available online: https://www.kaggle.com/datasets/jonathanoheix/face-expression-recognition-dataset/data (accessed on 20 December 2024).
- Verma, G.; Verma, H. Hybrid-deep learning model for emotion recognition using facial expressions. Rev. Socionetwork Strateg. 2020, 14, 171–180. [Google Scholar] [CrossRef]
- Saha, S.A. Comprehensive Guide to Convolutional Neural Networks—The ELI5 Way. Towards Data Science, 15 December 2018. Available online: https://ise.ncsu.edu/wp-content/uploads/sites/9/2022/08/A-Comprehensive-Guide-to-Convolutional-Neural-Networks-%E2%80%94-the-ELI5-way-_-by-Sumit-Saha-_-Towards-Data-Science.pdf (accessed on 20 December 2024).
- Rackauckas, C.; Ma, Y.; Martensen, J.; Warner, C.; Edelman, A. Universal differential equations for scientific machine learning. arXiv 2020, arXiv:2001.04385. [Google Scholar] [CrossRef]
- Viola, P.; Jones, M.J. Robust real-time face detection. Int. J. Comput. Vis. 2004, 57, 137–154. [Google Scholar] [CrossRef]
- Farfade, S.S.; Saberian, M.J.; Li, L.J. Multi-view face detection using deep convolutional neural networks. In Proceedings of the 5th ACM International Conference on Multimedia Retrieval (ICMR 2015), Shanghai, China, 23–26 June 2015; ACM: New York, NY, USA, 2015; pp. 643–650. [Google Scholar] [CrossRef]
- Tomasi, C.; Manduchi, R. Bilateral filtering for gray and color images. In Proceedings of the 6th IEEE International Conference on Computer Vision (ICCV 1998), Bombay, India, 4–7 January 1998; pp. 839–846. [Google Scholar] [CrossRef]
- Lindenbaum, M.; Fischer, M.; Bruckstein, A. On Gabor’s contribution to image enhancement. Pattern Recognit. 1994, 27, 1–8. [Google Scholar] [CrossRef]
- Pizer, S.M.; Amburn, E.P.; Austin, J.D.; Cromartie, R.; Geselowitz, A.; Greer, T.; Ter Haar Romeny, B.; Zimmerman, J.B.; Zuiderveld, K. Adaptive histogram equalization and its variations. Comput. Vis. Graph. Image Process. 1987, 39, 355–368. [Google Scholar] [CrossRef]
- Hawkins, D.M. The problem of overfitting. J. Chem. Inf. Comput. Sci. 2004, 44, 1–12. [Google Scholar] [CrossRef] [PubMed]
- Wu, Z. Image data augmentation techniques based on deep learning: A survey. Math. Biosci. Eng. 2024, 21, 6190–6224. [Google Scholar] [CrossRef]
- Gupta, S. Facial emotion recognition in real-time and static images. In Proceedings of the 2nd International Conference on Inventive Systems and Control (ICISC 2018), Coimbatore, India, 19–20 January 2018. [Google Scholar] [CrossRef]
- Ojala, T.; Pietikainen, M.; Maenpaa, T. Multiresolution gray-scale and rotation invariant texture classification with local binary patterns. IEEE Trans. Pattern Anal. Mach. Intell. 2002, 24, 971–987. [Google Scholar] [CrossRef]
- Anthwal, S.; Ganotra, D. An optical flow-based approach for facial expression recognition. In Proceedings of the 2019 International Conference on Power Electronics, Control and Automation (ICPECA 2019), Noida, India, 16–18 November 2019; pp. 1–5. [Google Scholar] [CrossRef]
- Jolliffe, I. Principal Component Analysis; Springer: Berlin, Germany, 2011. [Google Scholar]
- Goodfellow, I.; Bengio, Y.; Courville, A. Deep Learning; MIT Press: Cambridge, MA, USA, 2016. [Google Scholar]
- Vujovic, Z.D. Classification Model Evaluation Metrics. Int. J. Adv. Comput. Sci. Appl. 2021, 12, 599–606. [Google Scholar] [CrossRef]
- Lever, J.; Krzywinski, M.; Altman, N. Classification evaluation. Nat. Methods 2016, 13, 603–604. [Google Scholar] [CrossRef]
- Sulaiman, M.N. A Review on Evaluation Metrics for Data Classification Evaluations. Int. J. Data Min. Knowl. Manag. Process 2015, 5, 1–11. [Google Scholar] [CrossRef]
- Kulatilleke, G.K.; Samarakoon, S. Empirical study of Machine Learning Classifier Evaluation Metrics behavior in Massively Imbalanced and Noisy data. arXiv 2022, arXiv:2208.11904. [Google Scholar] [CrossRef]
- Kumar, R.; Hussain, S.I. A Review of the Deep Convolutional Neural Networks for the Analysis of Facial Expressions. J. Innov. Technol. 2024, 6, 41–49. [Google Scholar] [CrossRef]
- Pramerdorfer, C.; Kampel, M. Facial expression recognition using convolutional neural networks: State of the art. arXiv 2016, arXiv:1612.02903. [Google Scholar] [CrossRef]
- Mollahosseini, A.; Chan, D.; Mahoor, M.H. Going deeper in facial expression recognition using deep neural networks. In Proceedings of the 2017 IEEE Winter Conference on Applications of Computer Vision (WACV 2017), Santa Rosa, CA, USA, 24–31 March 2017. [Google Scholar] [CrossRef]
- Minaee, S.; Minaei, M.; Abdolrashidi, A. Deep-Emotion: Facial Expression Recognition Using Attentional Convolutional Network. Sensors 2021, 21, 3046. [Google Scholar] [CrossRef] [PubMed]
- Ghadekar, P.; Gupta, A.K.; Datta, J.; Singh, G.; Anand, D.S.; Oswal, P.; Sharma, D.; Khare, S. Facial Expression Recognition Based on Deep Learning-Deep Convolutional Neural Network. In Proceedings of the 2022 IEEE 7th International Conference on Recent Advances and Innovations in Engineering (ICRAIE), Mangalore, India, 1–3 December 2022; pp. 93–98. [Google Scholar] [CrossRef]
- Khan, A.R. Facial Emotion Recognition Using Conventional Machine Learning and Deep Learning Methods: Current Achievements. Anal. Remain. Chall. Inf. 2022, 13, 268. [Google Scholar] [CrossRef]
- Christou, N.; Kanojiya, N. Human facial expression recognition with convolutional neural networks. In Proceedings of the 2019 Springer International Conference, Singapore, 22–24 February 2019; pp. 539–545. [Google Scholar] [CrossRef]
- Punuri, S.B.; Kuanar, S.K.; Kolhar, M.; Mishra, T.K.; Alameen, A.; Mohapatra, H.; Mishra, S.R. Efficient Net-XGBoost: An Implementation for Facial Emotion Recognition Using Transfer Learning. Mathematics 2023, 11, 776. [Google Scholar] [CrossRef]
Disclaimer/Publisher’s Note: The statements, opinions and data contained in all publications are solely those of the individual author(s) and contributor(s) and not of MDPI and/or the editor(s). MDPI and/or the editor(s) disclaim responsibility for any injury to people or property resulting from any ideas, methods, instructions or products referred to in the content. |
© 2025 by the authors. Licensee MDPI, Basel, Switzerland. This article is an open access article distributed under the terms and conditions of the Creative Commons Attribution (CC BY) license (https://creativecommons.org/licenses/by/4.0/).