
Investigation into Enhancing Ultrasonic Cleaning Efficiency Through Symmetrical Transducer Configuration


Abstract
1. Introduction
2. Materials and Methods
2.1. Ultrasonic Cleaning
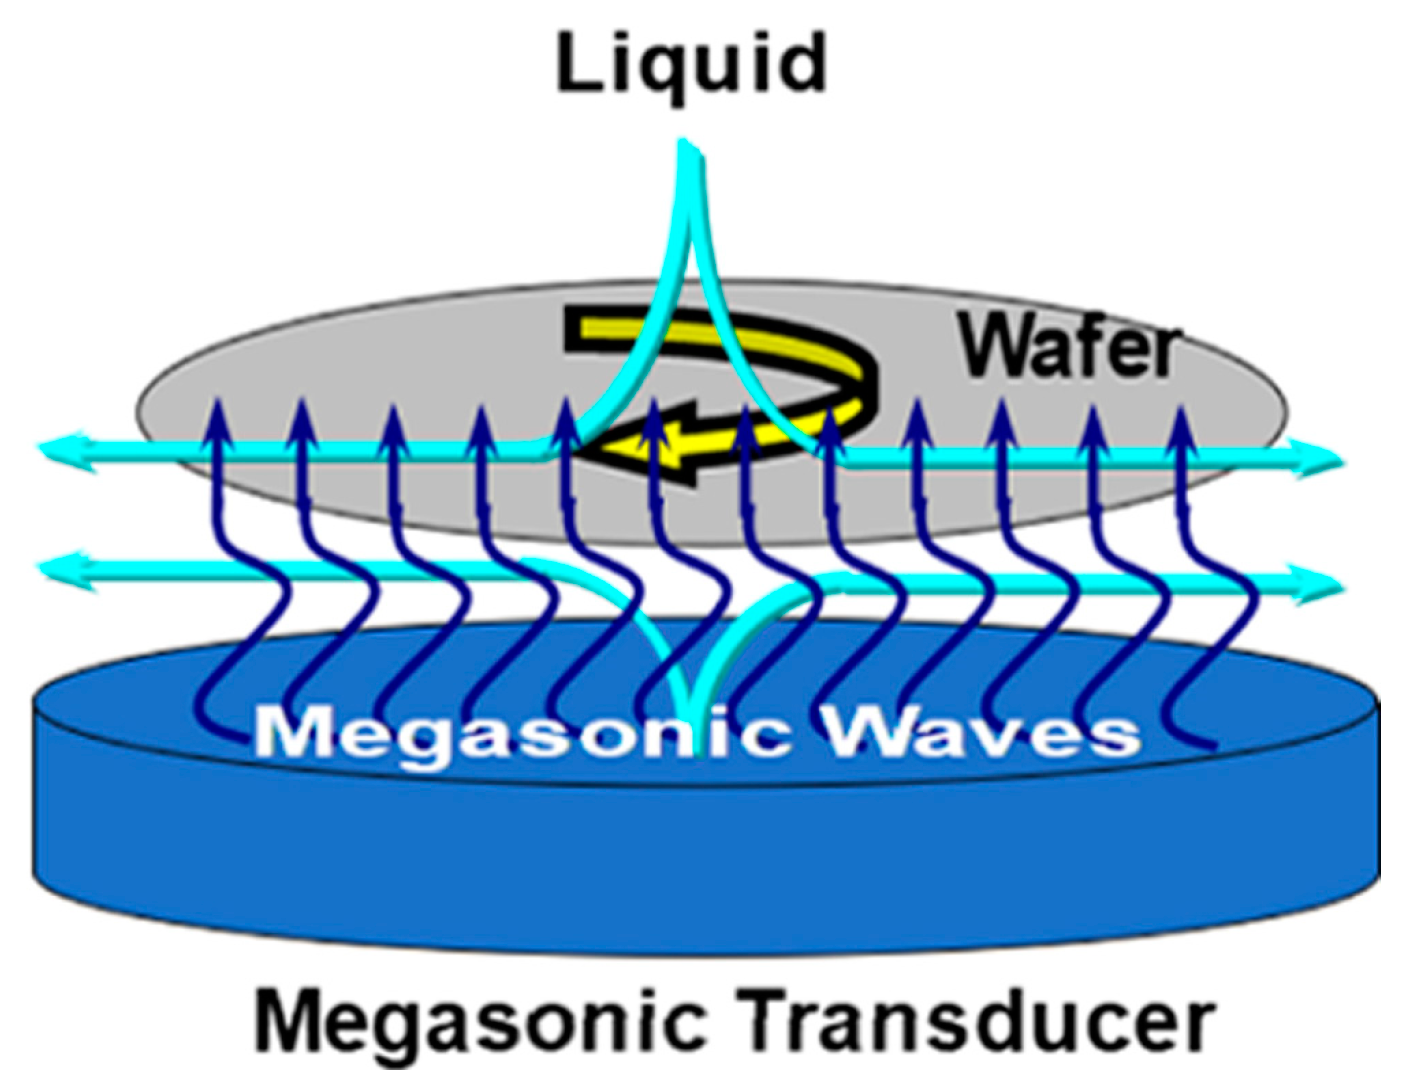
2.2. Megasonic Cleaning
3. Results
3.1. Ultrasonic Cleaning
3.2. Megasonic Cleaning
4. Discussion
5. Conclusions
Author Contributions
Funding
Data Availability Statement
Acknowledgments
Conflicts of Interest
References
- Geng, S. Distribution and Experimental Research of Multi-Vibration Source Ultrasonic Cleaning Energy Field. Master’s Dissertation, Tianjin University of Science and Technology, Tianjin, China, 2021. [Google Scholar]
- Salo, S.; Wirtanen, G. Ultrasonic cleaning applications in dairies: Case studies on cheese moulds and milk transportation crates. Br. Food J. 2007, 109, 31–42. [Google Scholar] [CrossRef]
- Sarasua Miranda, J.A.; Ruiz-Rubio, L.; Aranzabe Basterrechea, E.; Vilas-Vilela, J.L. Non-Immersion Ultrasonic Cleaning: An Efficient Green Process for Large Surfaces with Low Water Consumption. Processes 2021, 9, 585. [Google Scholar] [CrossRef]
- Yusof, N.S.M.; Babgi, B.; Aksu, A.; Madhavan, J.; Ashokkumar, M. Physical and chemical effects of acoustic cavitation in selected ultrasonic cleaning applications. Ultrason. Sonochem. 2016, 29, 568–576. [Google Scholar] [CrossRef]
- Worradechaudom, W.; Chaiaiad, C.; Thongsri, J. Development of a Small Ultrasonic Cleaning Bath based on Harmonic Response Analysis. In Proceedings of the International Technical Conference on Circuits/Systems, Computers, and Communications (ITC-CSCC), Okinawa, Japan, 2–5 July 2024; pp. 1–5. [Google Scholar] [CrossRef]
- Yuan, F.; Zhao, X.; Wu, Z.H.; Ding, Y.; Yang, Q. Washing performance of microbubbles on porous media. J. Water Process Eng. 2024, 58, 104761. [Google Scholar] [CrossRef]
- Tian, M.; Liu, H.; Cui, J.; Weng, Y.; Wang, X.; Feng, E.; Zhang, W.; Cao, C.; Wen, J.; Huang, G.; et al. Mechanism of highly efficient oil removal from spent hydrodesulfurization catalysts by ultrasound-assisted surfactant cleaning methods. J. Hazard. Mater. 2024, 472, 134514. [Google Scholar] [CrossRef] [PubMed]
- Kuchinskiy, M.; Lyubimova, T.; Rybkin, K.; Sadovnikova, A.; Galishevskiy, V. Investigation of Cavitation in NaCl Solutions in a Sonochemical Reactor Using the Foil Test Method. Fluid Dyn. Mater. Process. 2024, 20, 1093–1102. [Google Scholar] [CrossRef]
- Muthukumaran, S.; Yang, K.; Seuren, A.; Kentish, S.; Ashokkumar, M.; Stevens, G.; Grieser, F. The use of ultrasonic cleaning for ultrafiltration membranes in the dairy industry. Sep. Purif. Technol. 2004, 39, 99–107. [Google Scholar] [CrossRef]
- Korolev, A.V.; Korolev, A.A.; Bolkunov, V.V.; Vasin, A.N. Ultrasonic cleaning of bearing components. Russ. Eng. Res. 2011, 31, 85–87. [Google Scholar] [CrossRef]
- Zhao, F.; Yan, Q.; Cheng, D. Numerical study on the desorption processes of oil droplets inside oil-contaminated sand under cavitation micro-jets. Ultrason. Sonochem. 2021, 78, 105745. [Google Scholar] [CrossRef]
- Bogdan, N. Observations of water cavitation intensity under practical ultrasonic cleaning conditions. Ultrason. Sonochem. 2007, 14, 13–18. [Google Scholar] [CrossRef]
- Kim, H.; Lee, Y.; Lim, E. Dual-Frequency Megasonic Waveguide for Nano-Pattern Cleaning. IEEE Trans. Semicond. Manuf. 2015, 28, 521–527. [Google Scholar] [CrossRef]
- Mondal, J.; Lakkaraju, R.; Ghosh, P.; Ashokkumar, M. Acoustic cavitation-induced shear: A mini-review. Biophys Rev 2021, 13, 1229–1243. [Google Scholar] [CrossRef] [PubMed]
- Gale, G.W.; Busnaina, A.A. Roles of cavitation and acoustic streaming in megasonic cleaning. Part. Sci. Technol. 2007, 17, 229–238. [Google Scholar] [CrossRef]
- Kuehn, T.H.; Kittelson, D.B.; Wu, Y.; Gouk, R. Particle removal from semiconductor wafers by megasonic cleaning. J. Aerosol Sci. 1996, 27, S427–S428. [Google Scholar] [CrossRef]
- Barbagini, F.; Janssens, T.; Bearda, T.; Armini, S.; Van Hoeymissen, J.; Mertens, P.; Fransaer, J. Particle removal from Si substrates in organic solvents using megasonic energy. ECS Trans. 2007, 11, 101–108. [Google Scholar] [CrossRef]
- Leong, T.; Collis, J.; Manasseh, R.; Ooi, A.; Novell, A.; Bouakaz, A.; Ashokkumar, M.; Kentish, S. The role of surfactant headgroup, chain length, and cavitation microstreaming on the growth of bubbles by rectified diffusion. J. Phys. Chem. C 2011, 115, 24310–24316. [Google Scholar] [CrossRef]
- Camerotto, E.; Brems, S.; Hauptmann, M.; Pacco, A.; Struyf, H.; Mertens, P.W.; De Gendt, S. Influence of surface tension on cavitation noise spectra and particle removal efficiency in high frequency ultrasound fields. J. Appl. Phys. 2012, 112, 114322. [Google Scholar] [CrossRef]
- Bakhtari, K.; Guldiken, R.O.; Makaram, P.; Busnaina, A.A. Experimental and numerical investigation of nanoparticle removal using acoustic streaming and the effect of time. J. Electrochem. Soc. 2006, 153, G846–G850. [Google Scholar] [CrossRef]
- Doinikov, A.A. Translational motion of a spherical bubble in an acoustic standing wave of high intensity. Phys. Fluids 2002, 14, 1420–1425. [Google Scholar] [CrossRef]
- Olim, M.A. Theoretical evaluation of megasonic cleaning for submicron particles. J. Electrochem. Soc. 1997, 144, 3657–3659. [Google Scholar] [CrossRef]
- Kumari, S.; Keswani, M.; Singh, S.; Beck, M.; Liebscher, E.; Raghavan, S. Enhanced megasonic processing of wafers in MegPie® using carbonated ammonium hydroxide solutions. Microelectron. Eng. 2014, 114, 148–153. [Google Scholar] [CrossRef]
- Kim, T.-G.; Wostyn, K.L.; Mertens, P.; Busnaina, A.A.; Park, J.-G. Quantitative Measurement of Pattern Collapse and Particle Removal Force. ECS Trans. 2007, 11, 123. [Google Scholar] [CrossRef]
- Chu, C.L.; Lu, T.Y.; Fuh, Y.K. The suitability of ultrasonic and megasonic cleaning of nanoscale patterns in ammonia hydroxide solutions for particle removal and feature damage. Semicond. Sci. Technol. 2020, 35, 045001. [Google Scholar] [CrossRef]
- Kim, W.; Kim, T.-H.; Choi, J.; Kim, H.-Y. Mechanism of particle removal by megasonic waves. Appl. Phys. Lett. 2009, 94, 081908. [Google Scholar] [CrossRef]
- Kim, W.; Park, K.; Oh, J.; Choi, J.; Kim, H.-Y. Visualization and minimization of disruptive bubble behavior in ultrasonic field. Ultrasonics 2010, 50, 798–802. [Google Scholar] [CrossRef]
- Sahoo, B.N.; Han, S.Y.; Kim, H.-T.; Ando, K.; Kim, T.-G.; Kang, B.-K.; Klipp, A.; Yerriboina, N.P.; Park, J.-G. Chemically controlled megasonic cleaning of patterned structures using solutions with dissolved gas and surfactant. Ultrason. Sonochem. 2022, 82, 105859. [Google Scholar] [CrossRef]
- Worapol, T.; Jatuporn, T. Development of an industrial ultrasonic cleaning tank based on harmonic response analysis. Ultrasonics 2019, 91, 68–76. [Google Scholar] [CrossRef]
- Wei, L.; Liu, S.; Dong, F. Mechanism study of micro-jet generation induced by acoustic cavitation. J. Hydrodyn. 2025. [Google Scholar] [CrossRef]
- Wu, H.; Jin, Y.; Li, Y.; Zheng, H.; Lai, X.; Ma, J.; Ohl, C.-D.; Yu, H.; Li, D. Exploring viscosity influence mechanisms on coating removal: Insights from single cavitation bubble behaviours in low-frequency ultrasonic settings. Ultrason. Sonochem. 2024, 104, 106810. [Google Scholar] [CrossRef]
- Zhang, L.; Lu, X.; Busnaina, A.A. Non-contact Post-CMP megasonic cleaning of cobalt wafers. Mater. Sci. Semicond. Process. 2023, 156, 107278. [Google Scholar] [CrossRef]


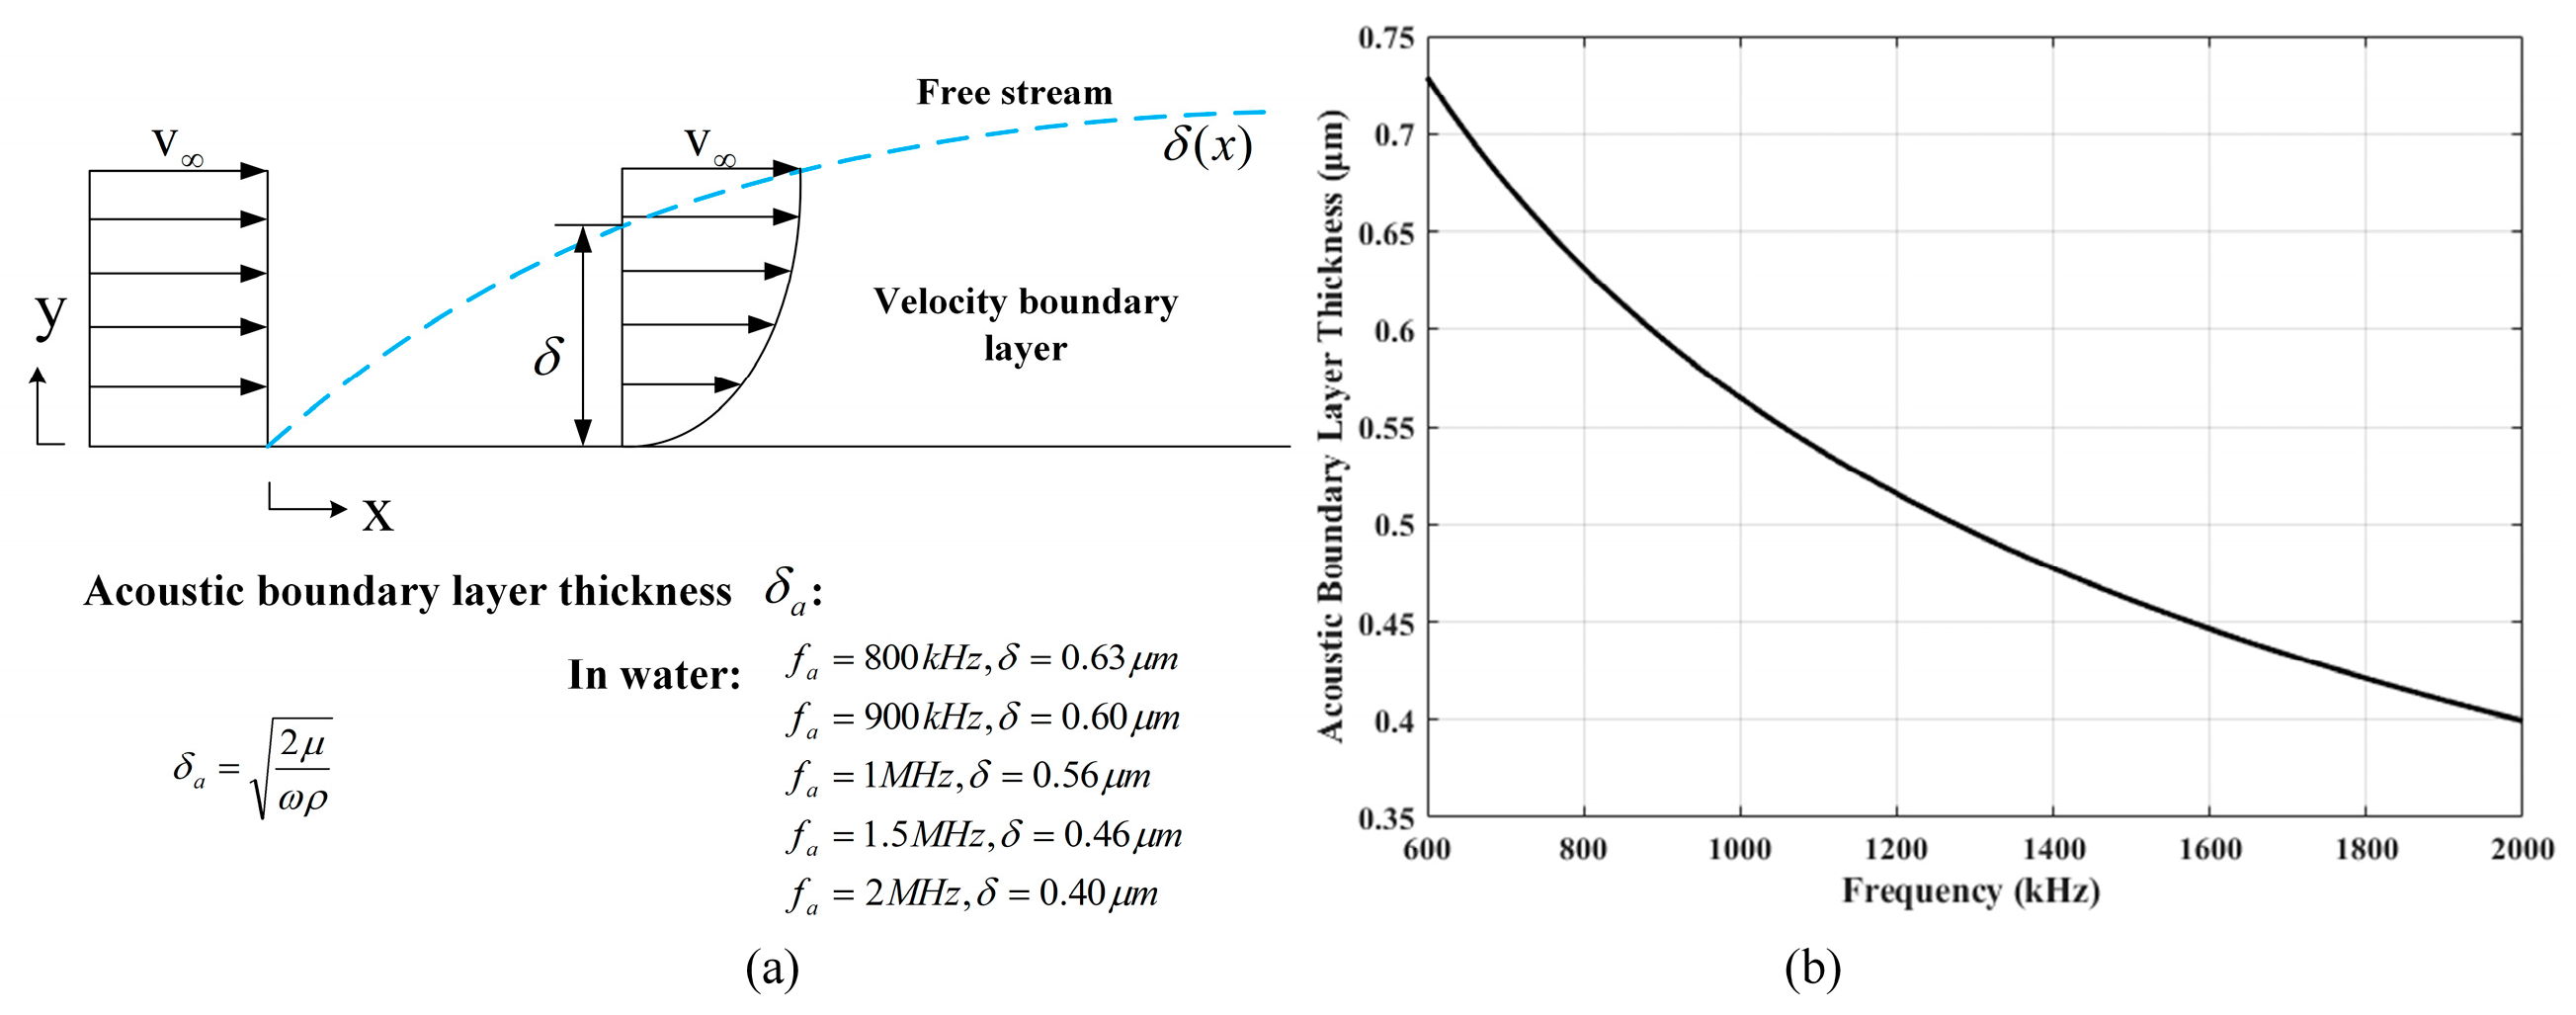
| Frequency (K Hz) | Boundary Layer Thickness (μm)—Water | In Relation to Particle Size (μm) |
|---|---|---|
| 25 | 3.57 | >5 |
| 40 | 2.82 | 25 |
| 120 | 1.63 | 0.53 |
| 400 | 0.89 | 0.20.8 |
| 950 | 0.57 | 0.10.3 |
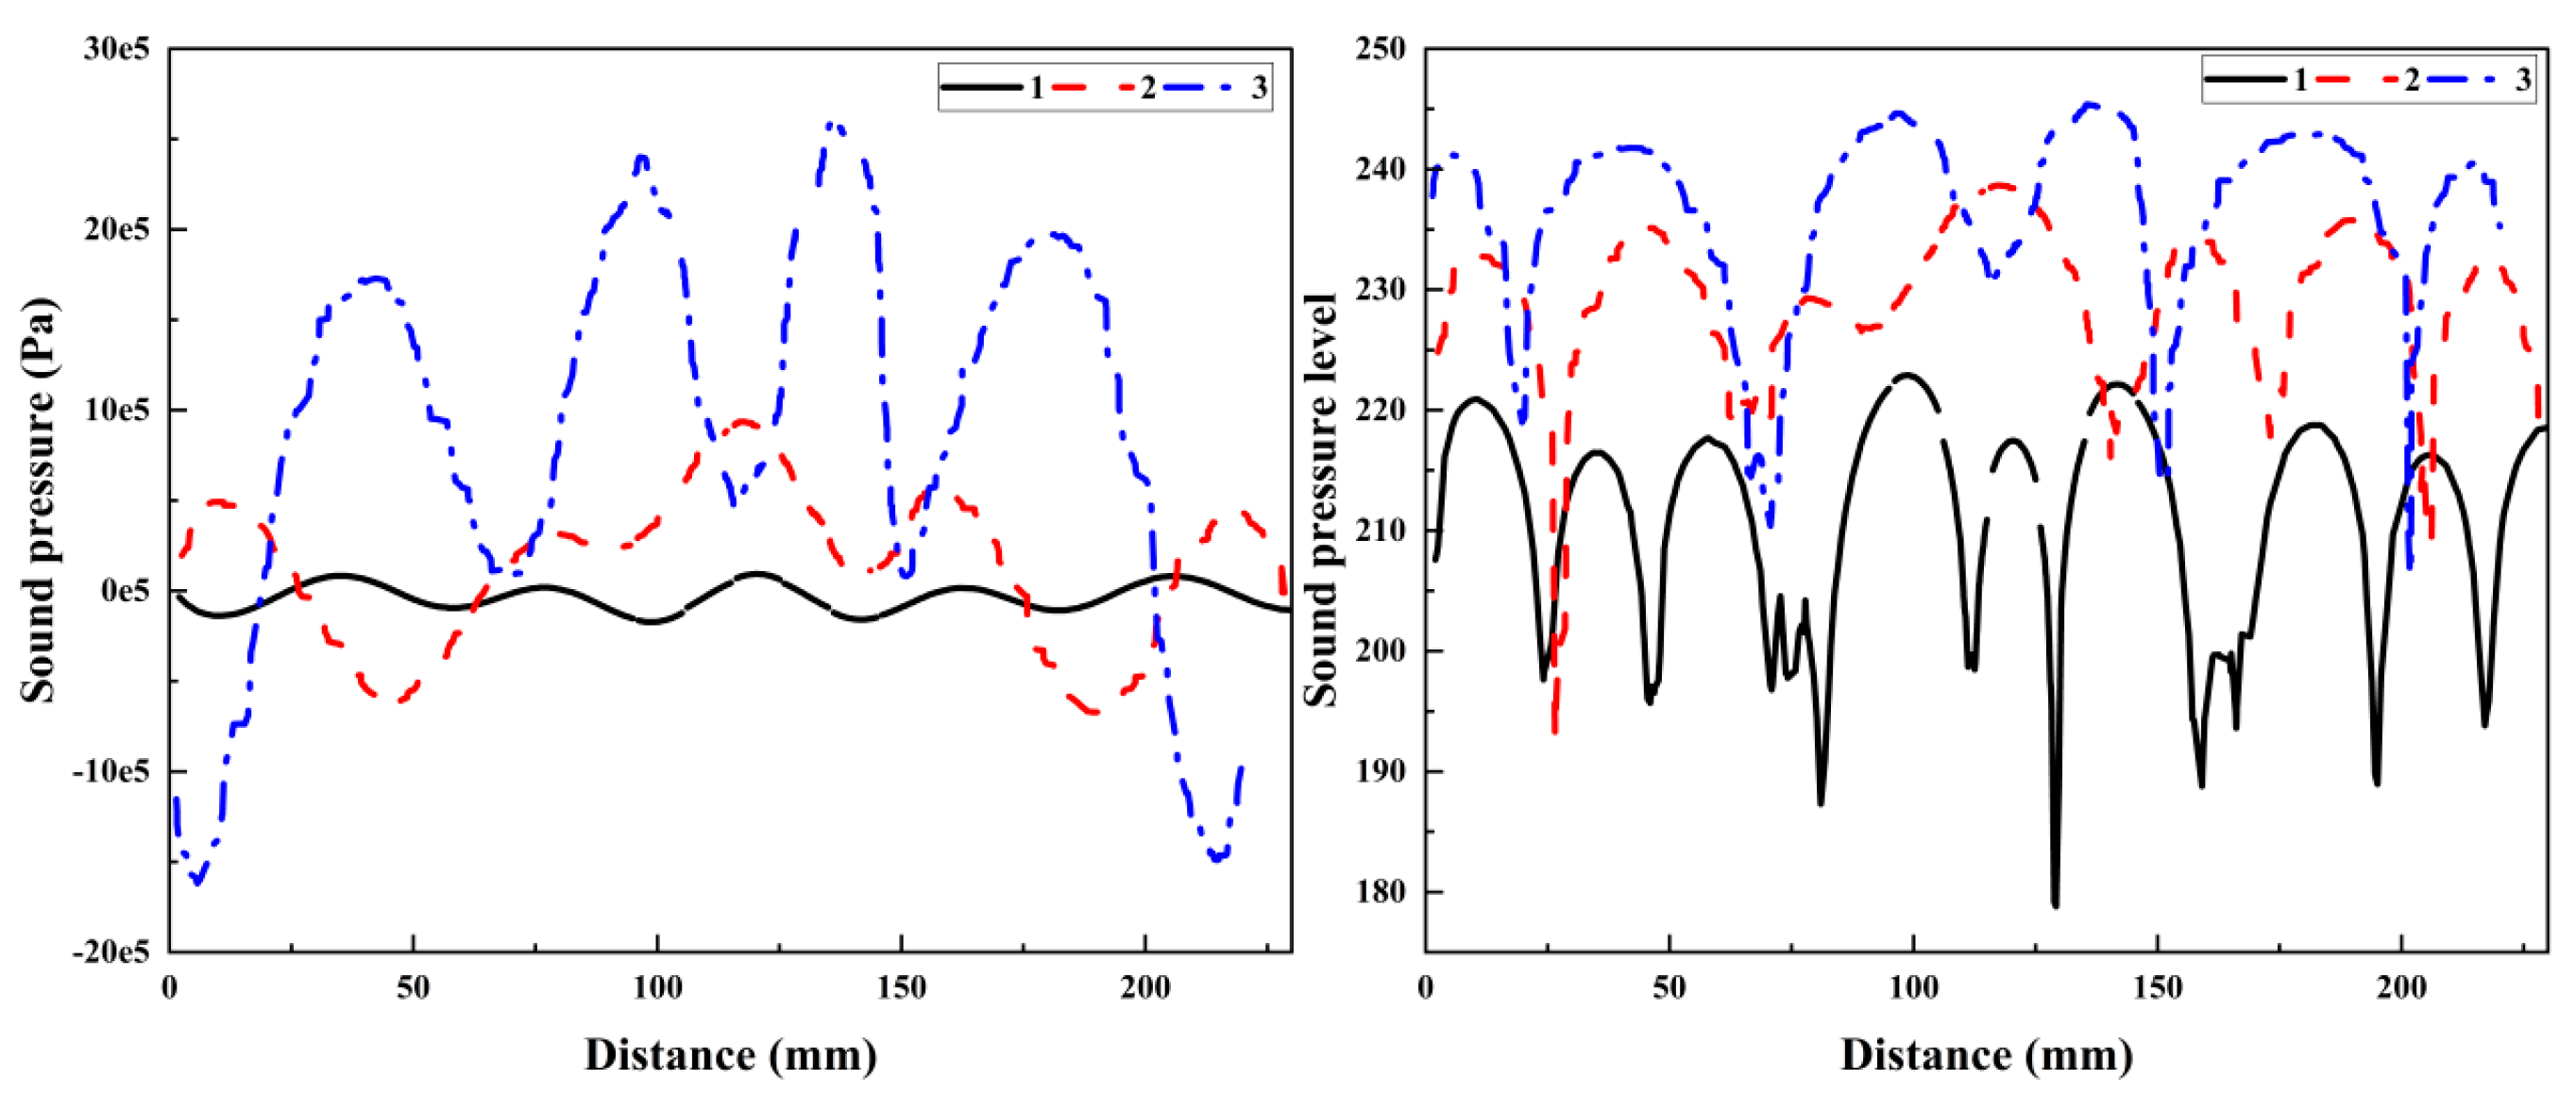
| Maximum Sound Pressure Level | Growth Rate | |
|---|---|---|
| Model 1 | 222.7 | / |
| Model 2 | 238.6 | ↑ 7.14% |
| Model 3 | 245.3 | ↑ 10.15% |
| Sound Pressure Value | |
|---|---|
| Model a | 4734 Pa |
| Model b | 248,869 Pa |
| Model c | 110,525 Pa |
| Model d | 131,103 Pa |
Disclaimer/Publisher’s Note: The statements, opinions and data contained in all publications are solely those of the individual author(s) and contributor(s) and not of MDPI and/or the editor(s). MDPI and/or the editor(s) disclaim responsibility for any injury to people or property resulting from any ideas, methods, instructions or products referred to in the content. |
© 2025 by the authors. Licensee MDPI, Basel, Switzerland. This article is an open access article distributed under the terms and conditions of the Creative Commons Attribution (CC BY) license (https://creativecommons.org/licenses/by/4.0/).
Share and Cite
Wei, L.; Liu, S.; Dong, F. Investigation into Enhancing Ultrasonic Cleaning Efficiency Through Symmetrical Transducer Configuration. Symmetry 2025, 17, 348. https://doi.org/10.3390/sym17030348
Wei L, Liu S, Dong F. Investigation into Enhancing Ultrasonic Cleaning Efficiency Through Symmetrical Transducer Configuration. Symmetry. 2025; 17(3):348. https://doi.org/10.3390/sym17030348
Chicago/Turabian StyleWei, Lei, Sheng Liu, and Fang Dong. 2025. "Investigation into Enhancing Ultrasonic Cleaning Efficiency Through Symmetrical Transducer Configuration" Symmetry 17, no. 3: 348. https://doi.org/10.3390/sym17030348
APA StyleWei, L., Liu, S., & Dong, F. (2025). Investigation into Enhancing Ultrasonic Cleaning Efficiency Through Symmetrical Transducer Configuration. Symmetry, 17(3), 348. https://doi.org/10.3390/sym17030348