Article

Symmetry Study on Damage Inversion of Wharf Pile Foundation in Three Gorges Reservoir Area Under Ship Impact

1
School of Aeronautics and Astronautics, Shanghai Jiao Tong University, Shanghai 200240, China
2
China Railway Changjiang Transport Design Group Co., Ltd., Chongqing 401220, China
3
School of Intelligent Construction, Chongqing College of Architecture and Technology, Chongqing 401300, China
4
School of Intelligent Technology and Engineering, Chongqing University of Science and Technology, Chongqing 401331, China
*
Author to whom correspondence should be addressed.
Symmetry 2025, 17(2), 215; https://doi.org/10.3390/sym17020215
Submission received: 29 November 2024 / Revised: 20 January 2025 / Accepted: 24 January 2025 / Published: 31 January 2025

Abstract

:
Periodic change in reservoir water level will have a significant impact on berthing position, and the impact caused by irregular operation during berthing will cause damage to wharf pile foundations. However, most of the existing monitoring methods adopt irregular methods, so it is difficult to accurately identify and analyze the damage causes. Taking a high-piled wharf in the Three Gorges Reservoir area as an example, the uncertainty of reservoir water level change is quantitatively analyzed. By establishing a simplified parametric wharf calculation model, the data set of an inversion model of pile of a high-piled wharf under ship impact is obtained, and the inversion analysis of pile damage of a high-piled wharf under ship pile is carried out based on the artificial neural network model. The results show that the inversion model can accurately and efficiently identify the intensity of ship impact, and a low water level is better than a high water level in the identification of impact position. In this paper, the behavior of wharf structure before and after damage is analyzed symmetrically under the action of damage inducement. In summary, the inversion analysis method can basically meet the requirements of inversion identification of pile foundation damage of a high-pile wharf in a backwater fluctuation area under ship impact.

1. Introduction

As show in the Figure 1, the fluctuation of water level in inland river reservoir ports is closely related to factors such as dispatching and upstream inflow, and the fluctuation of water level is larger than that in a plain port. Taking the Three Gorges Reservoir as an example, the dispatching water level varies by 30 m, and the maximum drop between flood level and low water level can reach more than 35 m. Different from other waters, the research on the symmetry of damage inducement inversion in the Three Gorges reservoir area is mainly aimed at the analysis of the symmetry results of pile foundation in different positions during the response process under the impact of ships.
The berthing position and impact force affected by water flow in the berthing process of operating ships in the port area are closely related to the change in reservoir water level. Huang Qiujie [1] systematically simulated the movement law of water flow and sediment in the reach from Changshou to Luoqi and summarized the variation law of water level in the harbor basin. Zhao Tianhui [2] studied the prediction method of a high-piled wharf under ship impact by using a three-dimensional finite element analysis model. Liu Siqi et al. [3], in combination with time-varying reliability theory, carried out a dynamic analysis on the ship impact force of a high-piled wharf. Liu Xiaoxi et al. [4] applied the limit probability theory to analyze the load effect and carried out the failure probability and reliability index analysis of the horizontal bearing capacity of a high-piled wharf. Wang Jianchao et al. [5] used numerical analysis to analyze and calculate the high-piled wharf structure under ship impact.
In the research of pile foundation damage caused by ship impact, Ye Binbin [6] carried out the experimental study of barge impact on a single pile foundation model, explored the dynamic response and vulnerable area of a single pile foundation structure under impact load, and further studied the dynamic response characteristics of a pile foundation structure under the impact of an inland barge on a high-pile cap group pile foundation system by numerical simulation. Zhu Ruihu et al. [7] conducted a study on the dynamic response of piles with different bent positions through impact load tests and put forward a reinforcement scheme.
There is no relevant report on the inversion of pile foundation damage of a high-piled wharf in a fluctuating backwater area. In this paper, based on the hydrological statistical data of the Three Gorges Reservoir area, the uncertainty of water level variation in the waters where the wharf is located is quantitatively analyzed, and the parametric calculation model of the inland river overhead wharf is established. Based on the artificial neural network model, the inversion calculation of pile foundation damage of the high-piled wharf under the action of a ship pile foundation is carried out. The results show that this method has a good recognition effect on the strength and position of a ship pile foundation, which provides a certain reference for optimizing wharf design.

2. Uncertainty and Quantification of Ship Berthing

The uncertainty of ship berthing includes tonnage, size, berthing speed, berthing position, etc. In this paper, we focus on the magnitude and position of the berthing force of a wharf pile foundation.

2.1. Quantification of Ship Tonnage Uncertainty

The probability distribution of deadweight tons of ships is mostly a multimodal distribution [8], and the commonly used multimodal distribution fitting models are the mixed Weibull [9] and the Gaussian mixture model (GMM) [10]. Taking GMM as an example, the single Gaussian probability density function can be expressed as follows [11]:
g x , u , σ = 1 2 π σ 2 e x p x u 2 2 σ 2
Taking the monthly statistical data of container transport vessels from 1 January to 31 December 2020 at Chongqing Orchard and Cuntan Container Terminals in the Three Gorges Reservoir area as samples [12], according to the iterative method based on the Gaussian mixture model, the probability density function is fitted, and the results are shown in Table 1.
It can be seen from the statistical results that the main types of container ships currently sailing in the Chongqing section of the Three Gorges Reservoir area are 3000 tons and 5000 tons, accounting for 44.28% and 23.09%, respectively, and the proportion of ships above 6000 tons is the smallest, only 6.81%. Considering that the damage cause determined in this study is that the structure bears the load under nonstandard operation conditions such as “barbaric berthing”, the calculation benchmark in the calculation of ship berthing load is determined to be 6000 tons.

2.2. Quantification of Ship Impact Position Uncertainty

Taking the water level observation data of Cuntan Hydrological Station in the Yangtze River from 1 January 2016 to 31 December 2020 as a sample, the statistical analysis of reservoir water level changes was carried out [13], and the five-year average water level was fitted by a polynomial to determine the characteristic water level calculated by structural analysis. The results are shown in Figure 2.
The deterministic coefficient of fitting is R2 = 0.8047, which shows that the polynomial fitting method can better fit the annual water level changes in the Three Gorges Reservoir area. The water level fitting polynomial can be obtained as follows:
y = 8 e 11 D 4 2 e 6 D 3 + 0.0012 D 2 0.2081 D + 175.3
According to the analysis results, it is determined that the three representative water levels calculated by structural analysis are 145 m (low), 160 m (medium), and 175 m (high), respectively, which serve as the action points of unfavorable incentives such as ship berthing and bank slope sliding.

3. Establishment of Sample Data Set for Damage Inversion

For the neural network model, the input of the model plays a vital role in the prediction results of the model. When the number of input samples is small, it will cause the sample model to be under-fitted. The model can make a good prediction for the given data set, but it is not good for the new data set, which is obviously unfavorable for the identification of damage incentives. In order to get a good prediction result, a large number of data samples need to be collected.
The model is parameterized, and the solid element model is optimized into a beam element model. The finite element program is called by the Python program to carry out parametric calculation and data extraction of the model, and the stress data of pile groups are preprocessed and dimension-reduced.

3.1. Establishment of Parametric Model

The parametric model adopts beam theory, and this model adopts the Timoshenko beam theory to model. Assuming that the action of the bank slope is a horizontal thrust, the pile foundation is horizontally loaded under the action of the bank slope, so the elastic foundation beam method can be considered to simulate the pile-soil constraint of the beam element model. The riprap layer and foundation rock are assumed to be elastic bodies, and the pile is regarded as a beam on an elastic foundation. The model is shown in Figure 3.
In order to distinguish different components in the subsequent calculation process, we numbered the load-bearing structure of the wharf: 1–11. The magnitude and longi-tudinal position of ship impact are applied according to the values determined above, and the specific position is shown in Figure 4.

3.2. Data Collection and Sample Set Construction

The established beam element model db file is set as a callable model, the parameters under ship impact are extracted by random sampling, the parameters are loaded into a solution file (the solution file is an ANSYS command flow file, which contains commands for calling the finite element model, commands for all loads, commands for post-processing to extract stress, and macro files for exporting data), and the MANSYS module is called via subprocess to load the call model.
The solution file is loaded and calls the finite element model for calculation, collects data, and exports it. In order to meet the calculation requirements, 10,000 working condition data are randomly selected as samples.
Because the stress data of pile groups have different stress values and too large of a span and the neural network is very sensitive to the data set, the obtained data are normalized, so that all the data fall within the interval of [0, 1].
The first two characteristics of each group of samples are taken as the horizontal axis and the vertical axis to draw the scatter diagram, as shown in Figure 5, which shows the original scatter diagram and normalized scatter diagram of pile foundation stress under ship collision.
After the pre-processing of pile group stress data, the data can be directly loaded into the inversion model for training.
However, direct training may result in too long of a training time for the model and flooding of dimensions due to the large sample size of the task, so the principal component analysis method is used to reduce the dimensions of the stress sample data, and the initial principal component number is adjusted according to the recognition effect of the inversion model. The result of dimension reduction is shown in Figure 6.
The features obtained after normalization and dimension reduction of stress data are counted as sample features x, the number of rows of x is the number of samples, the number of columns is the number of features, the damage inducement action parameter y corresponding to the counted samples is the target vector, the number of rows of y is the number of samples, the number of columns is 3, y is expressed as [type number, position number, action intensity value], and the one-to-one correspondence between x and y is saved in matrix form [X, y], which is input into the inversion model as a data set for training.

4. Establishment of Damage Inducement Inversion Model

In this paper, the inversion model of wharf damage inducement is built based on the Python language [14]. The main tools used are numpy library and sklearn library. numpy library is a scientific computing library of Python, which provides the function of matrix operation. Sklearn library is a third-party library for Python machine learning, which provides a simple integrated tool for machine learning. Our team has carried out relevant physical model tests and simulated the point where the ship collided. The test results have high reference value for the confirmation of input points in finite element calculation [15,16,17,18,19].
The modeling steps are as follows:
(1)
Collect stress characteristic data of finite element model pile groups under different working conditions.
(2)
Fuse and reconstruct the stress sample data; calculate the range, mean, variance, and discrete coefficient of the extracted stress features of each pile; and use the calculated results as a supplement to the sample features to construct a sample data set D, which contains features x and corresponding labels y, where X ∈ Rm × n, X ∈ Rm × q, m is the number of samples, and n is the number of features.
(3)
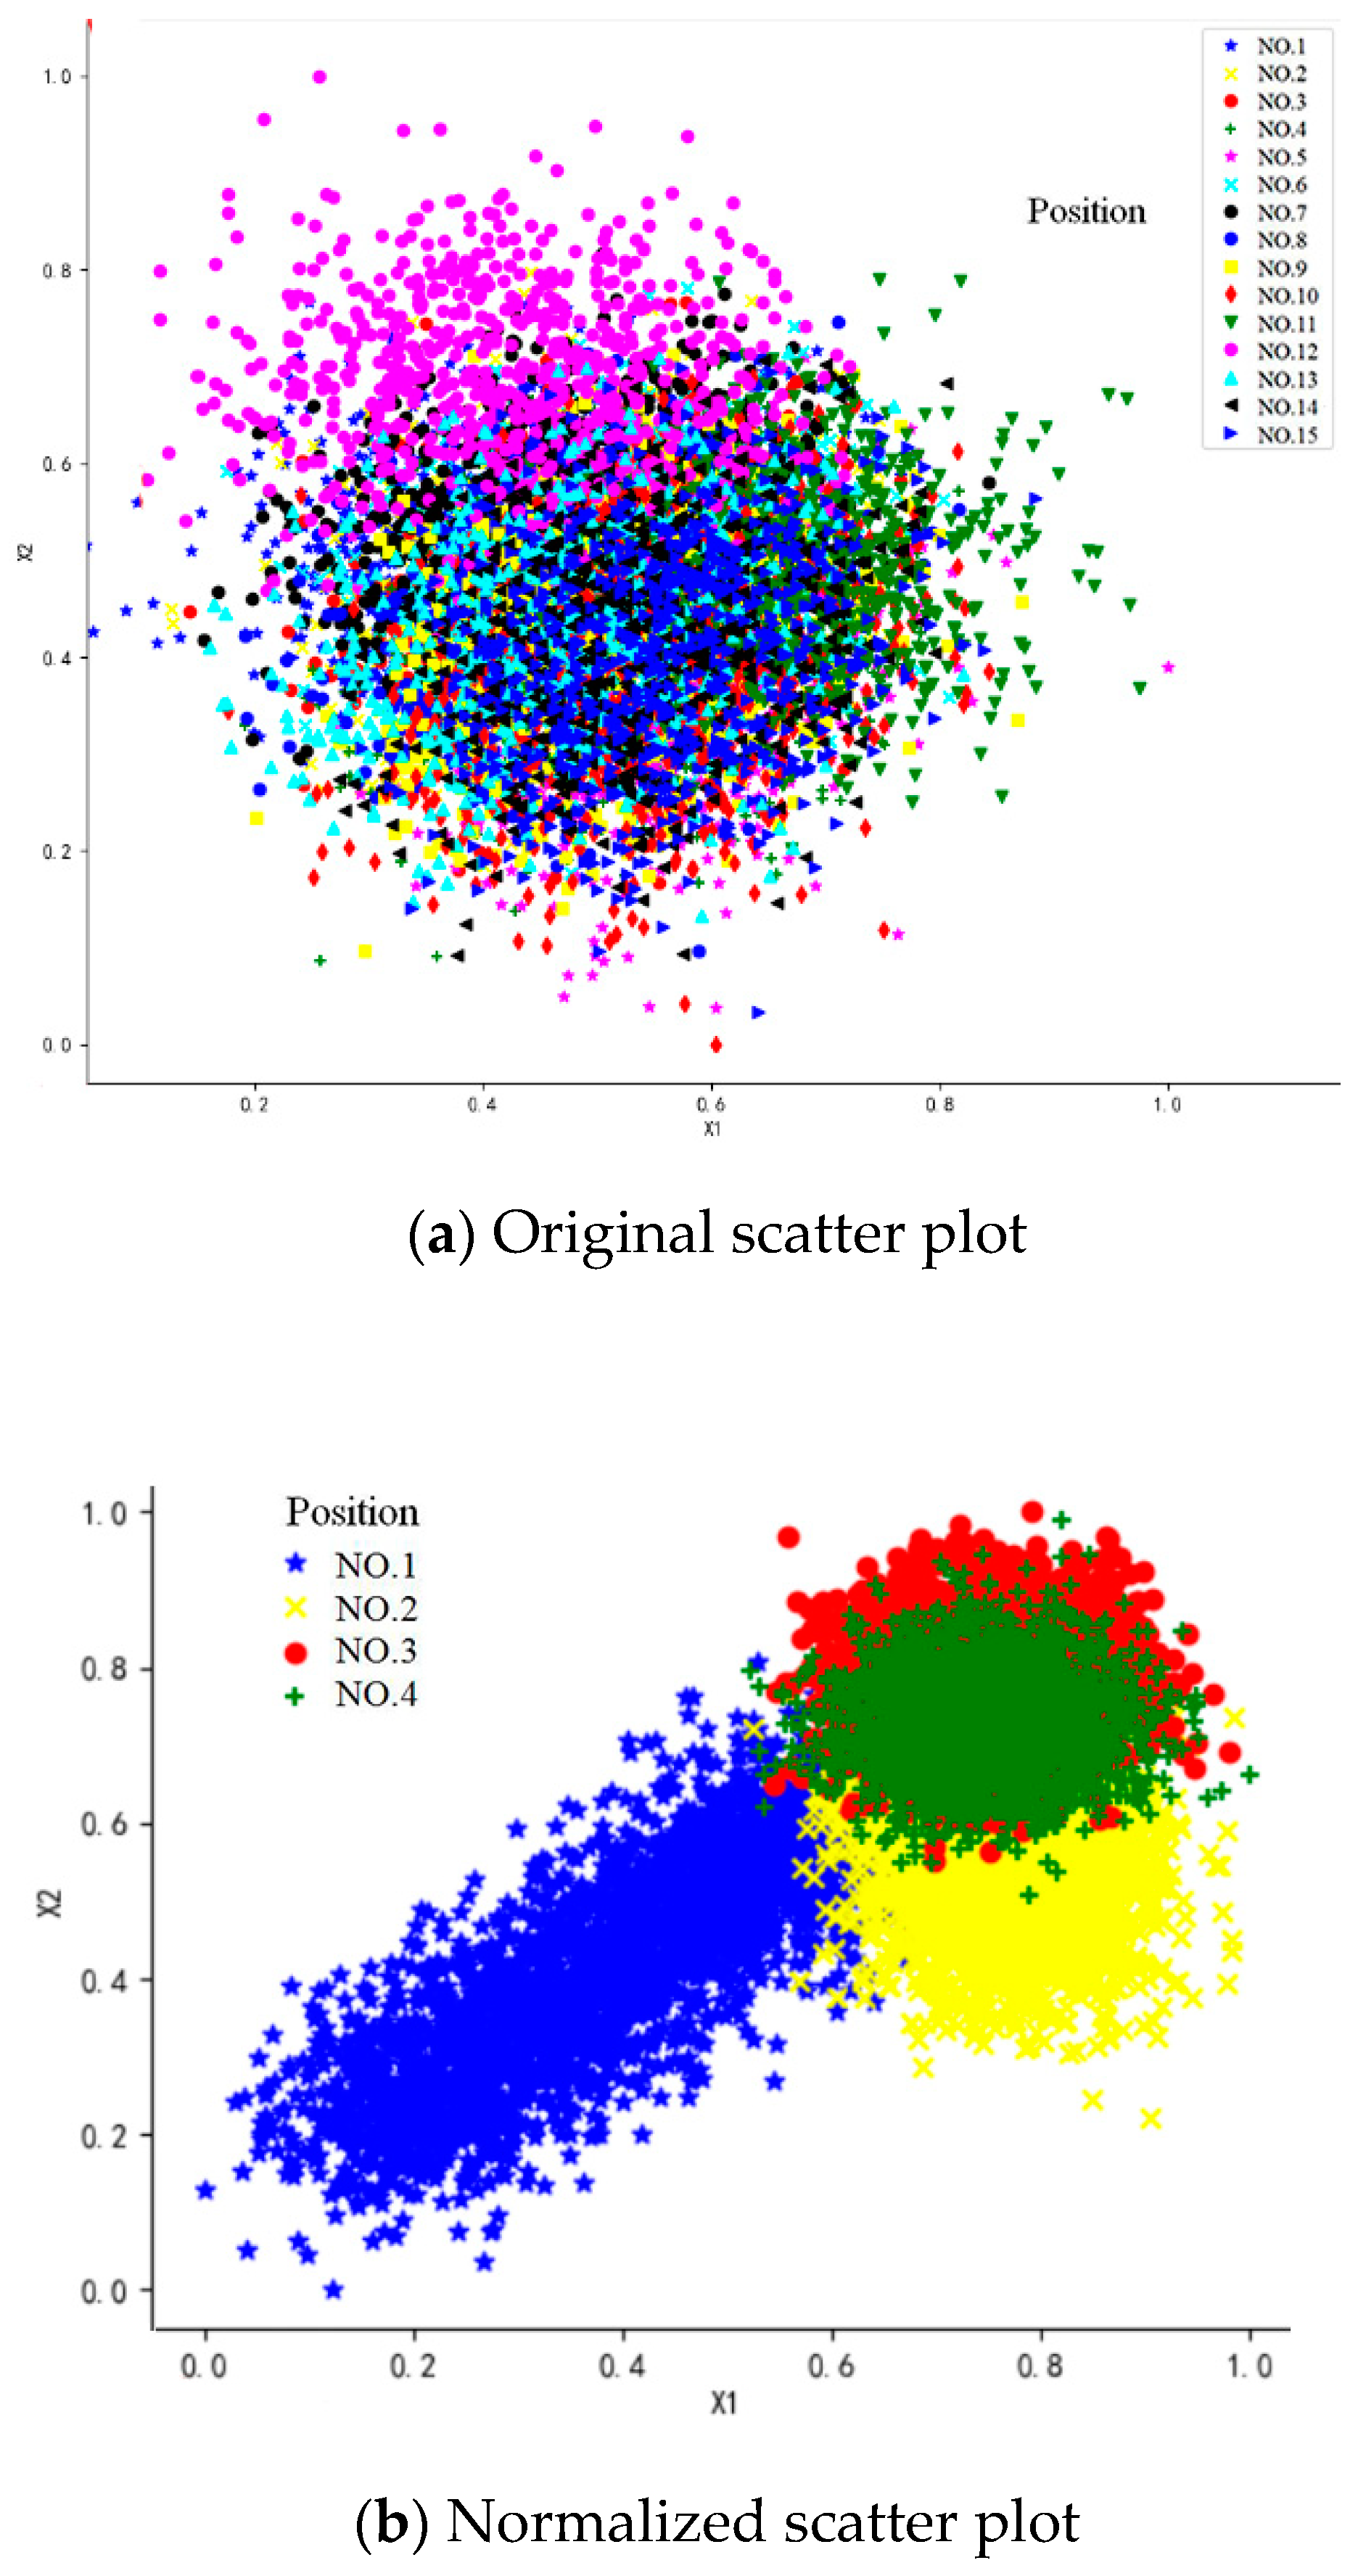
Information fusion is carried out on the sample data set by the normalization method, and the first principal components, x_PCA ∈ RM × a, are extracted.
(4)
The data set is randomly divided into a training set S and a test set T according to a ratio of 3:1 by adopting a set-aside method.
(5)
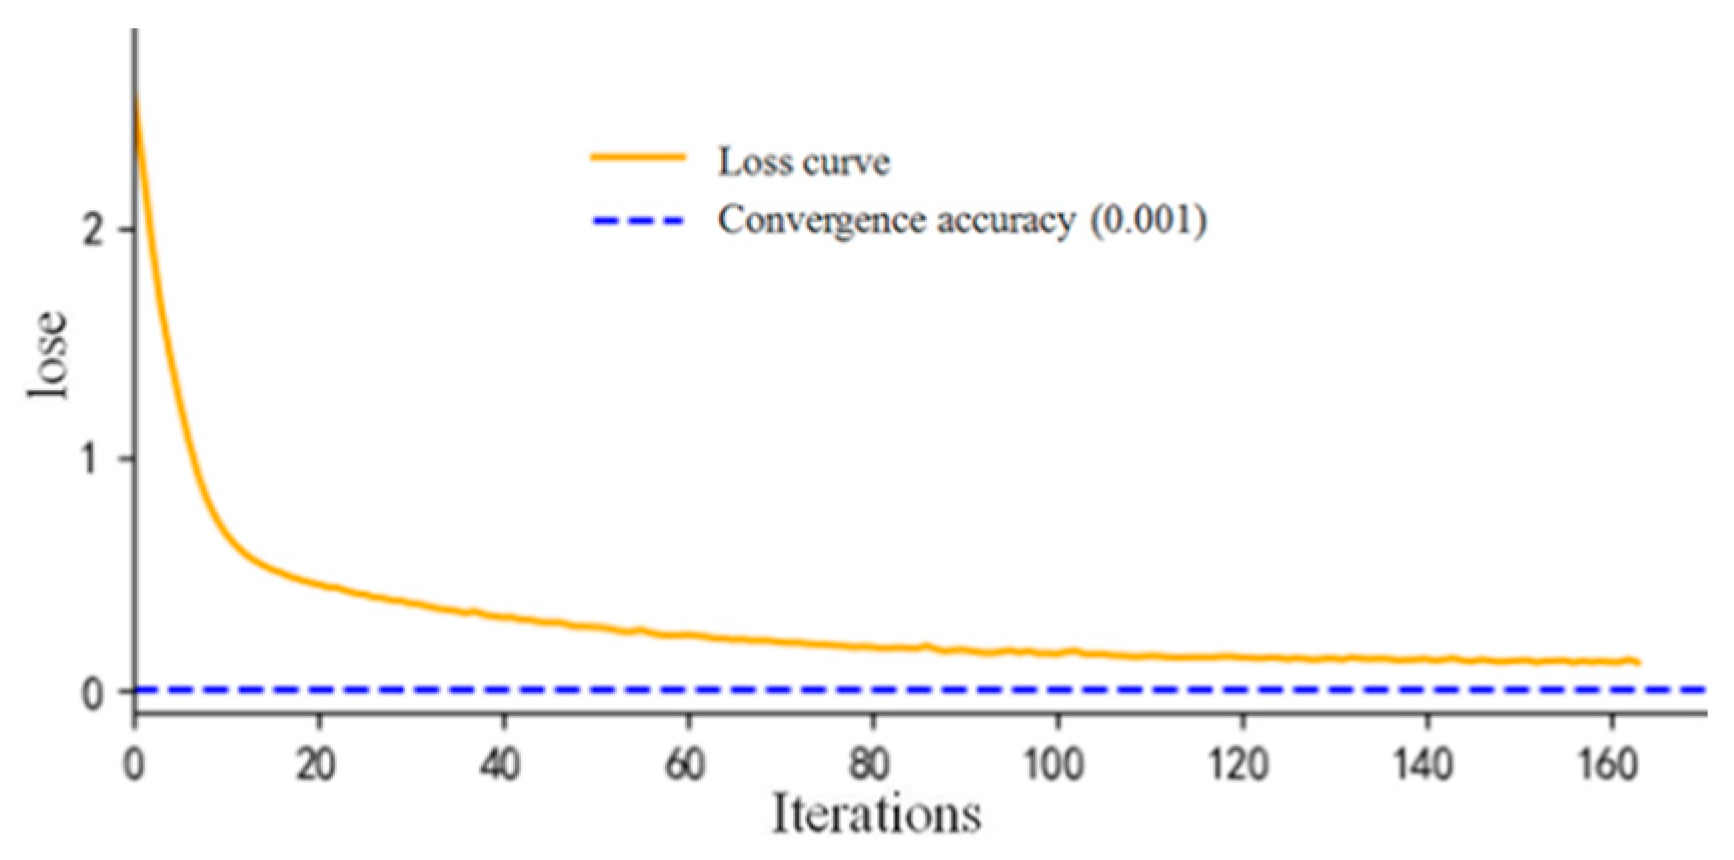
Construct the neural network full connection model ANN with three hidden layers. The model optimizer adopts adam algorithm, the activation function adopts {“identity”, “logistic”, “tanh”, “relu”}, the damage function of classification learner in the output layer adopts cross entropy loss, the loss function of regression learner adopts the mean square error function, and the range of penalty factor α is set (0.0001–10). Set the maximum iteration number and model convergence accuracy, set k-fold cross-validation, split the training set s and load it into the ANN model for self-adaptive training, train the classification problem and regression problem, respectively, and cross-validate the training to obtain the model score to evaluate the performance of the model. The performance metrics mainly adopt precision accuracy and average absolute error MAE, and the low score means the model is unreliable, so the next step of optimization and parameter adjustment is carried out. Parameter optimization is carried out through the Gridsearch toolkit, and the parameters searched include the optimal parameters of the model, such as the number of hidden layers of neural network, the number of hidden layer nodes, and penalty factors.
(6)
After training and verifying the training set S, load the test set T into the model to further evaluate the generalization ability of the model.

5. Inversion Analysis of Damage Inducement

5.1. Artificial Neural Network Model Training

The sample data set is allocated according to the ratio of 75% of the training samples and 25% of the test samples. The location label of ship collision action is loaded into the classification learner for training, and the intensity label of ship collision action is loaded into the regression learner for training.
The grid search method is used to search for the optimal parameters, and the above key parameters are searched. The classification learner uses the precision index, and the regression learner uses the R2 index. The neural network model is verified by cross-validation. According to the set maximum iteration times and convergence error, each neural network model reaches the automatic stop of the convergence error model, and it is considered that the internal weight of the neural network model is optimal at this time. The optimized parameters of the neural network inversion model of ship impact obtained by grid search are shown in Table 2:

5.2. Damage Inversion Analysis Results

(1)
Ship impact location identification
Location recognition is a classification problem, and the classification learner uses cross entropy loss as the model loss index. It can be seen from Figure 7 that when the neural network model is iterated 160 times, the model converges.
In order to test the generalization ability of the model at each action position of injury inducement, the trained model is verified on the training set and the test set at different positions, and the specific indexes are shown in Table 3.
The accuracy in the table represents the correctness of the action position recognition result, and the closer it is to 1, the better it represents the result. F1 is based on the harmonic average of sample recall rate and precision rate, and the closer to 1, the better the result. Hamming loss is the distance between the predicted value and the true value of the sample, and the closer it is to 0, the smaller the result error.
It can be seen from Table 3 that the position recognition accuracy of the training set is mostly above 0.94, and the recognition accuracy of the test samples is also above 0.9, which indicates that the neural network model has strong generalization ability for ship collision and can correctly identify the position of ship collision inducement.
(2)
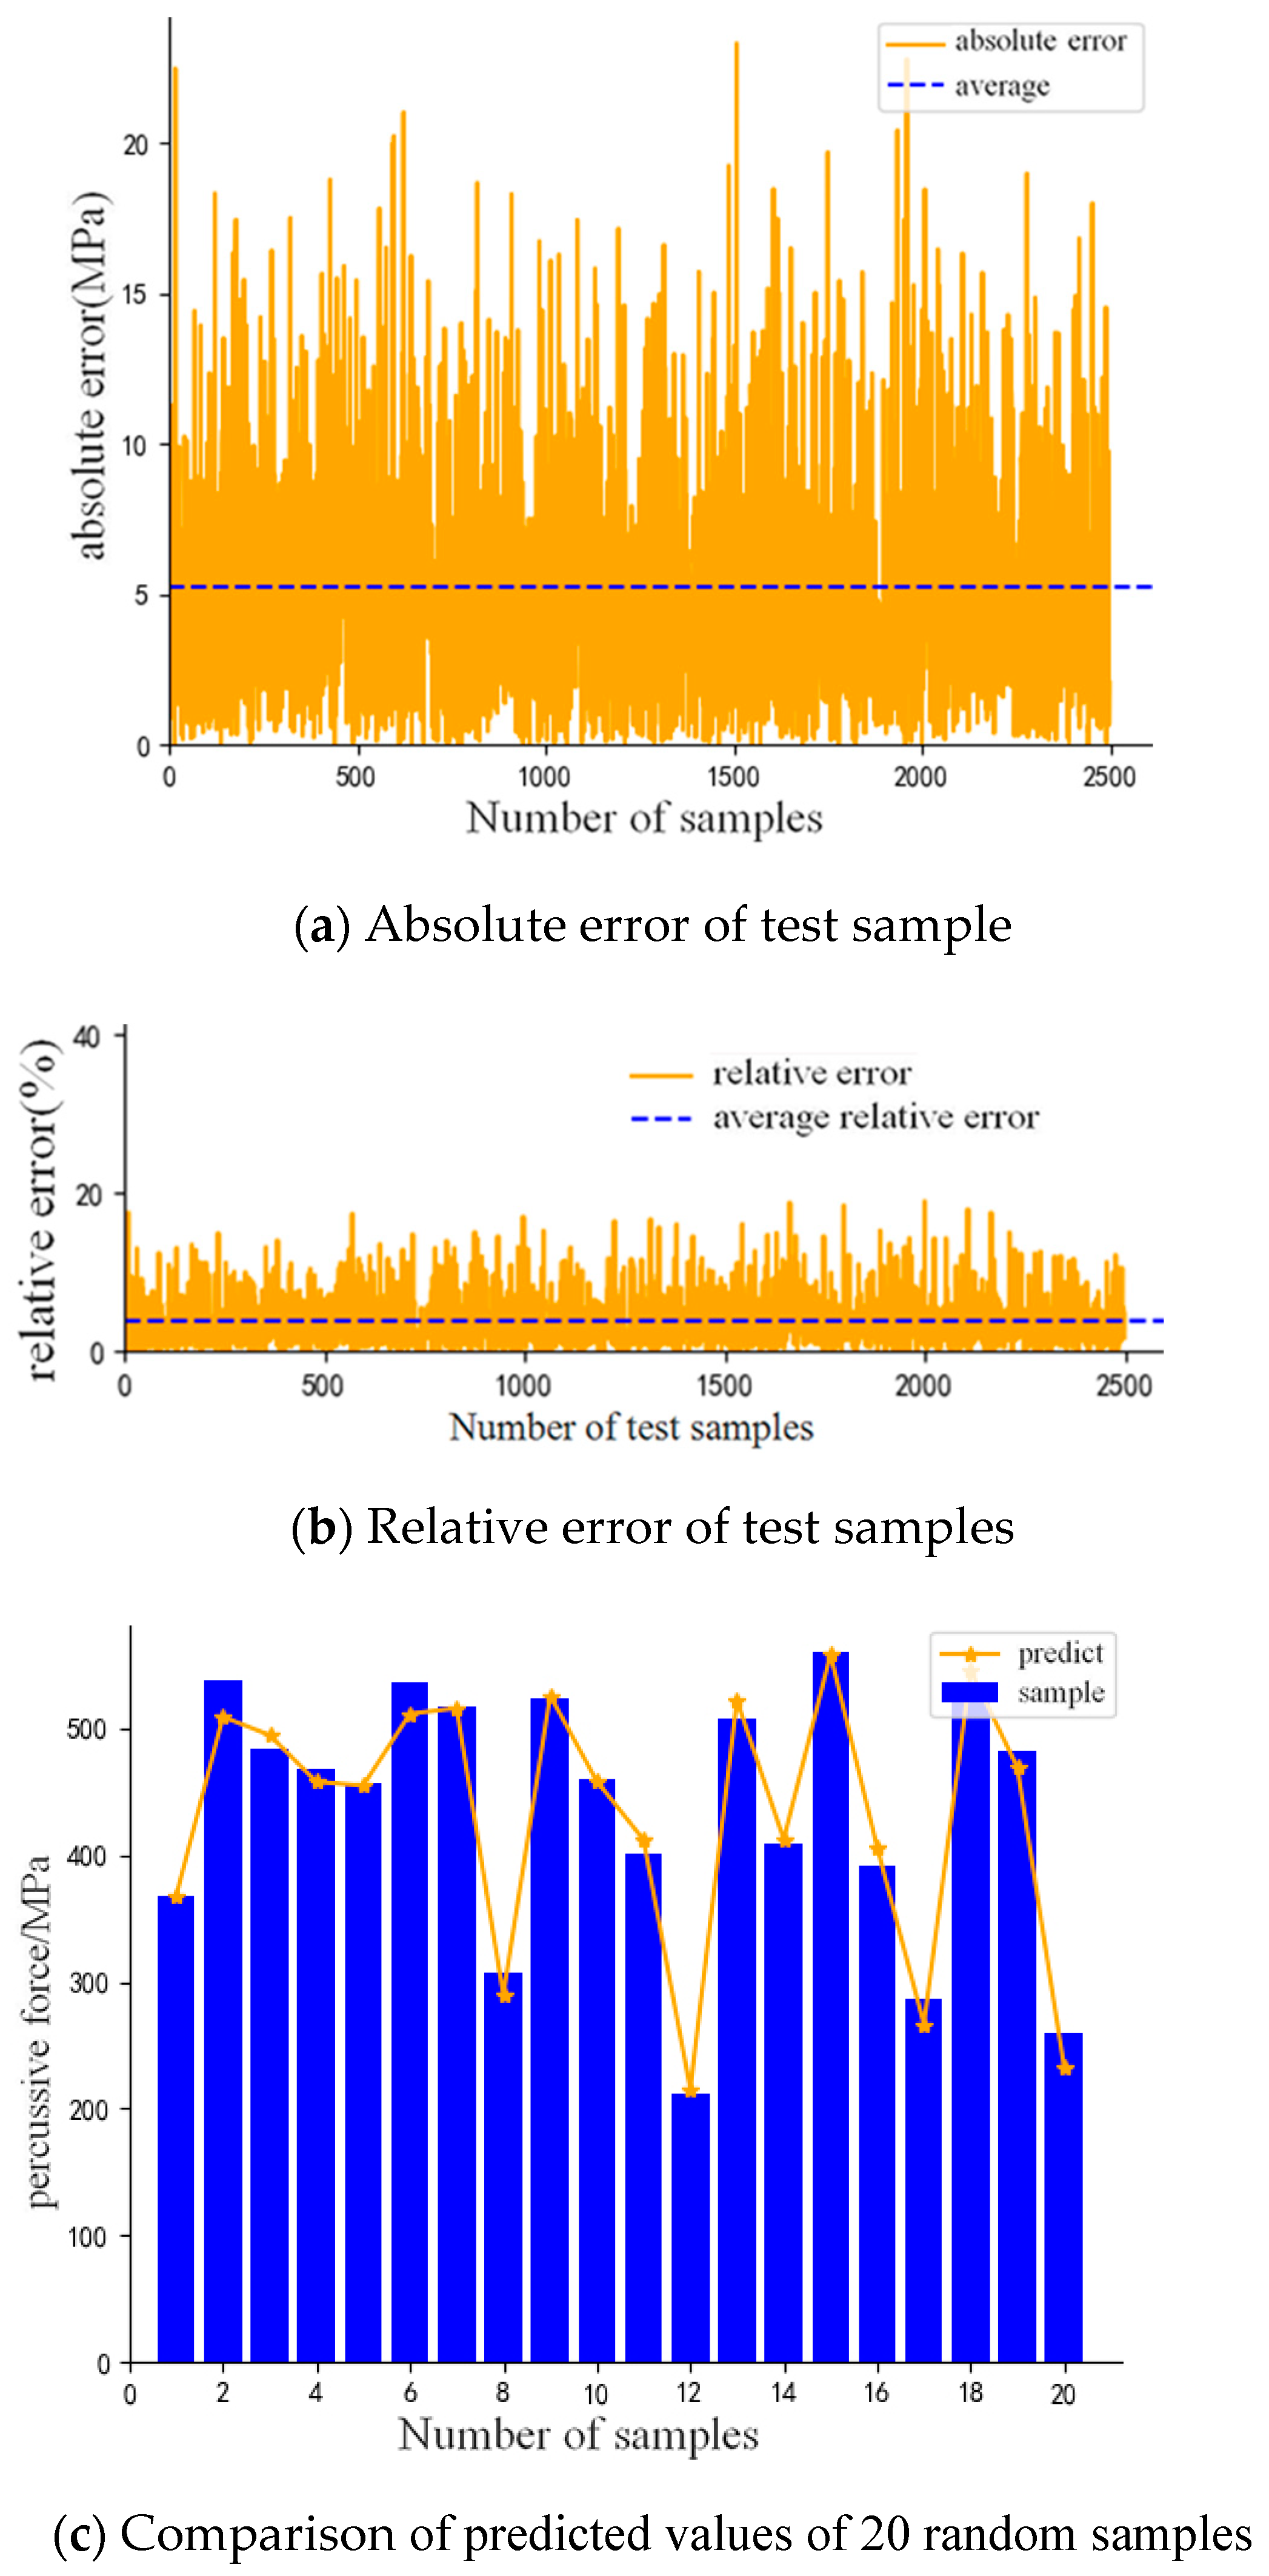
Identification of ship impact strength
The identification of ship impact strength is a regression problem, and the regression learner uses variance as the model loss index. As can be seen from Figure 8, when the neural network model is iterated 500 times, the loss error reaches about 0.001, at which time the model can be basically judged to converge.
The results of the training set and the test set of ship impact damage inducement are counted by position, and the performance index Table 4 of the model is obtained.
R2 in Table 4 represents the fitting degree of the model to strength identification, and the closer it is to 1, the better it represents the model. MSE is the mean square error, which represents the expectation of the square error between the predicted value and the true value of intensity identification. The closer it is to 0, the higher the accuracy is. MAE is the mean absolute error, which reflects the actual situation of intensity prediction error.
The minimum value of the goodness-of-fit index R2 of training set and test set is 0.989, the mean square deviation is 30–70 kN, and the average absolute error is 3–7 kN, which is relatively small compared with the value of ship impact force. For comparison, the absolute error curve and relative error curve of test set are drawn, and 20 predicted samples are randomly selected for comparison with the set value, as shown in Figure 9.
It can be seen from Figure 9 that some samples in the test set have large errors, reaching about 20 kN, most of which are within 10 kN, and the average relative error is about 3%. The performance of the model is relatively excellent and can meet the demand of inversion analysis of the inducement of ship impact damage.

6. Conclusions

Based on the wharf pile foundation in the high fill area of the Three Gorges Reservoir area, this paper carries out the back analysis of the damage inducement under the action of ship pile foundation, establishes the relevant data analysis model, and obtains a structural analysis conclusion suitable for similar engineering environments:
(1)
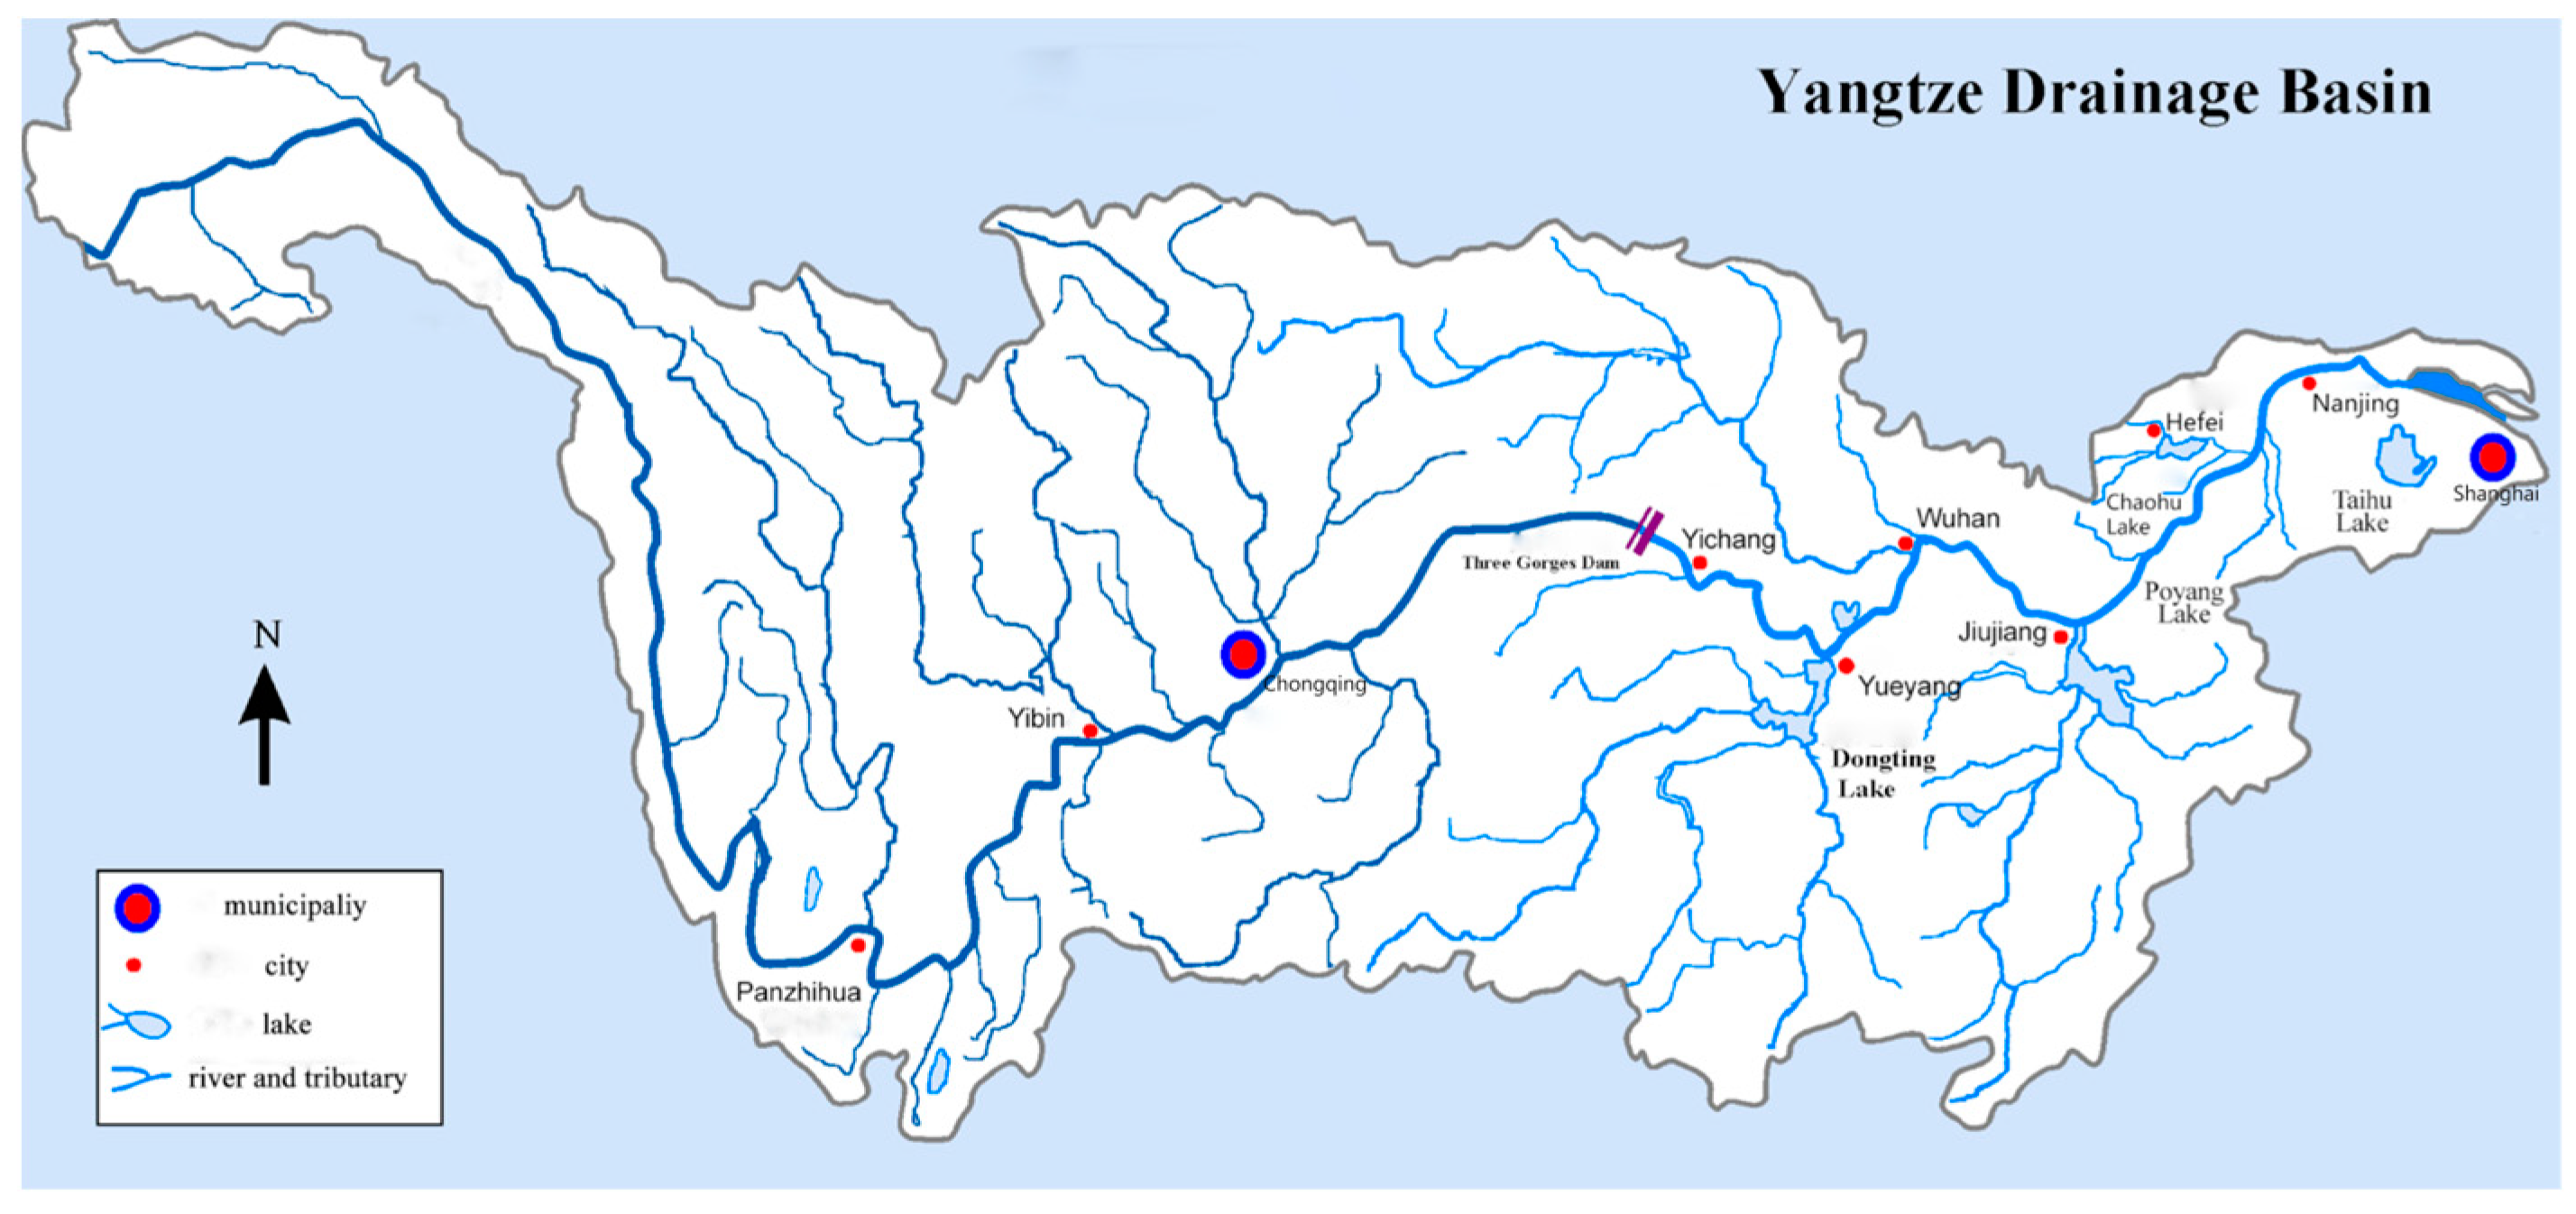
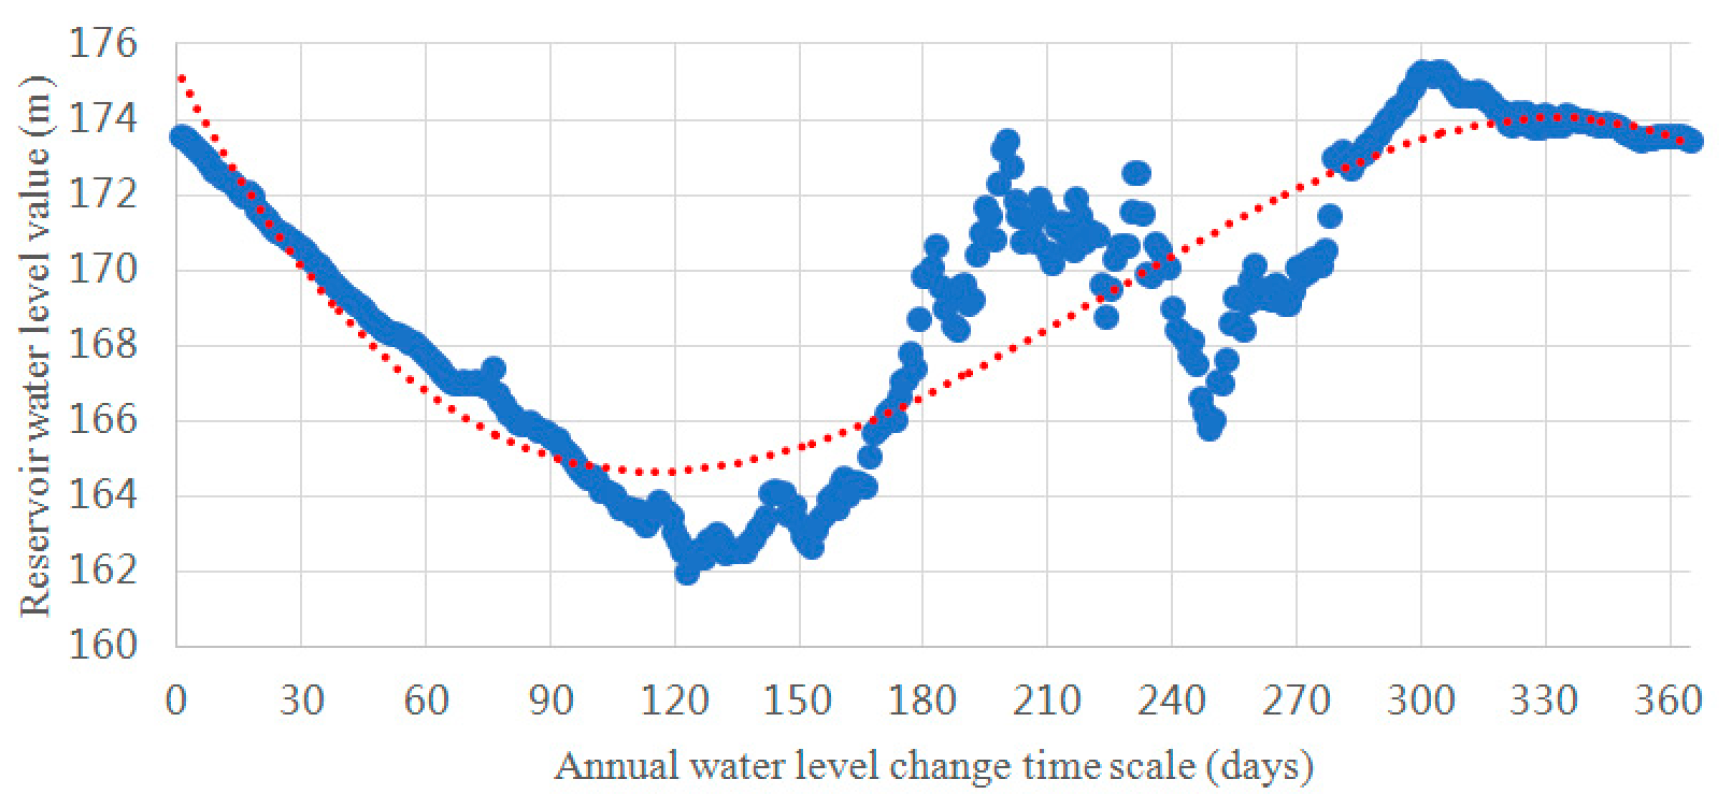
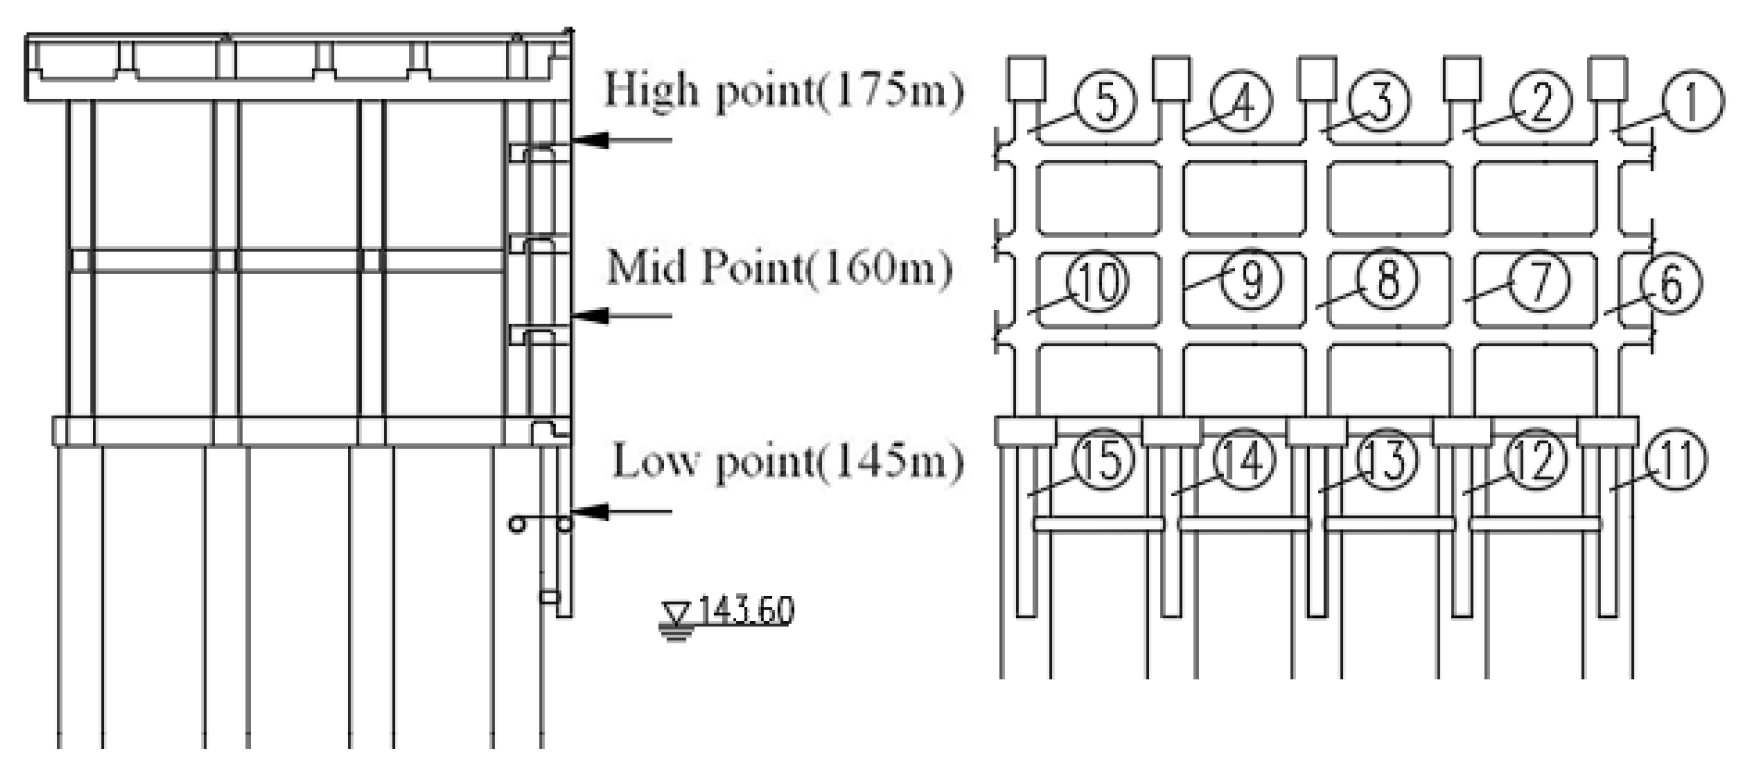
Based on the statistical data of ships operating in the Three Gorges Reservoir area and water level, through the quantitative analysis of uncertainty, using probability density function and polynomial fitting method, the analysis parameters of ship impact damage incentives in the fluctuating backwater area in the Three Gorges Reservoir area are obtained, which are 6000 tons in size and 145 m, 160 m, and 175 m in position.
(2)
The optimal parameters of the neural network model are searched by a grid search, the scores of the evaluation indexes of the model are cross-verified, and the inducement of ship collision damage is analyzed. After analysis, the location recognition accuracy of ship collision is 0.94, and the average absolute error of size recognition is 5.5 kN. The inversion model has a very good generalization ability for ship collision injury inducement samples.
(3)
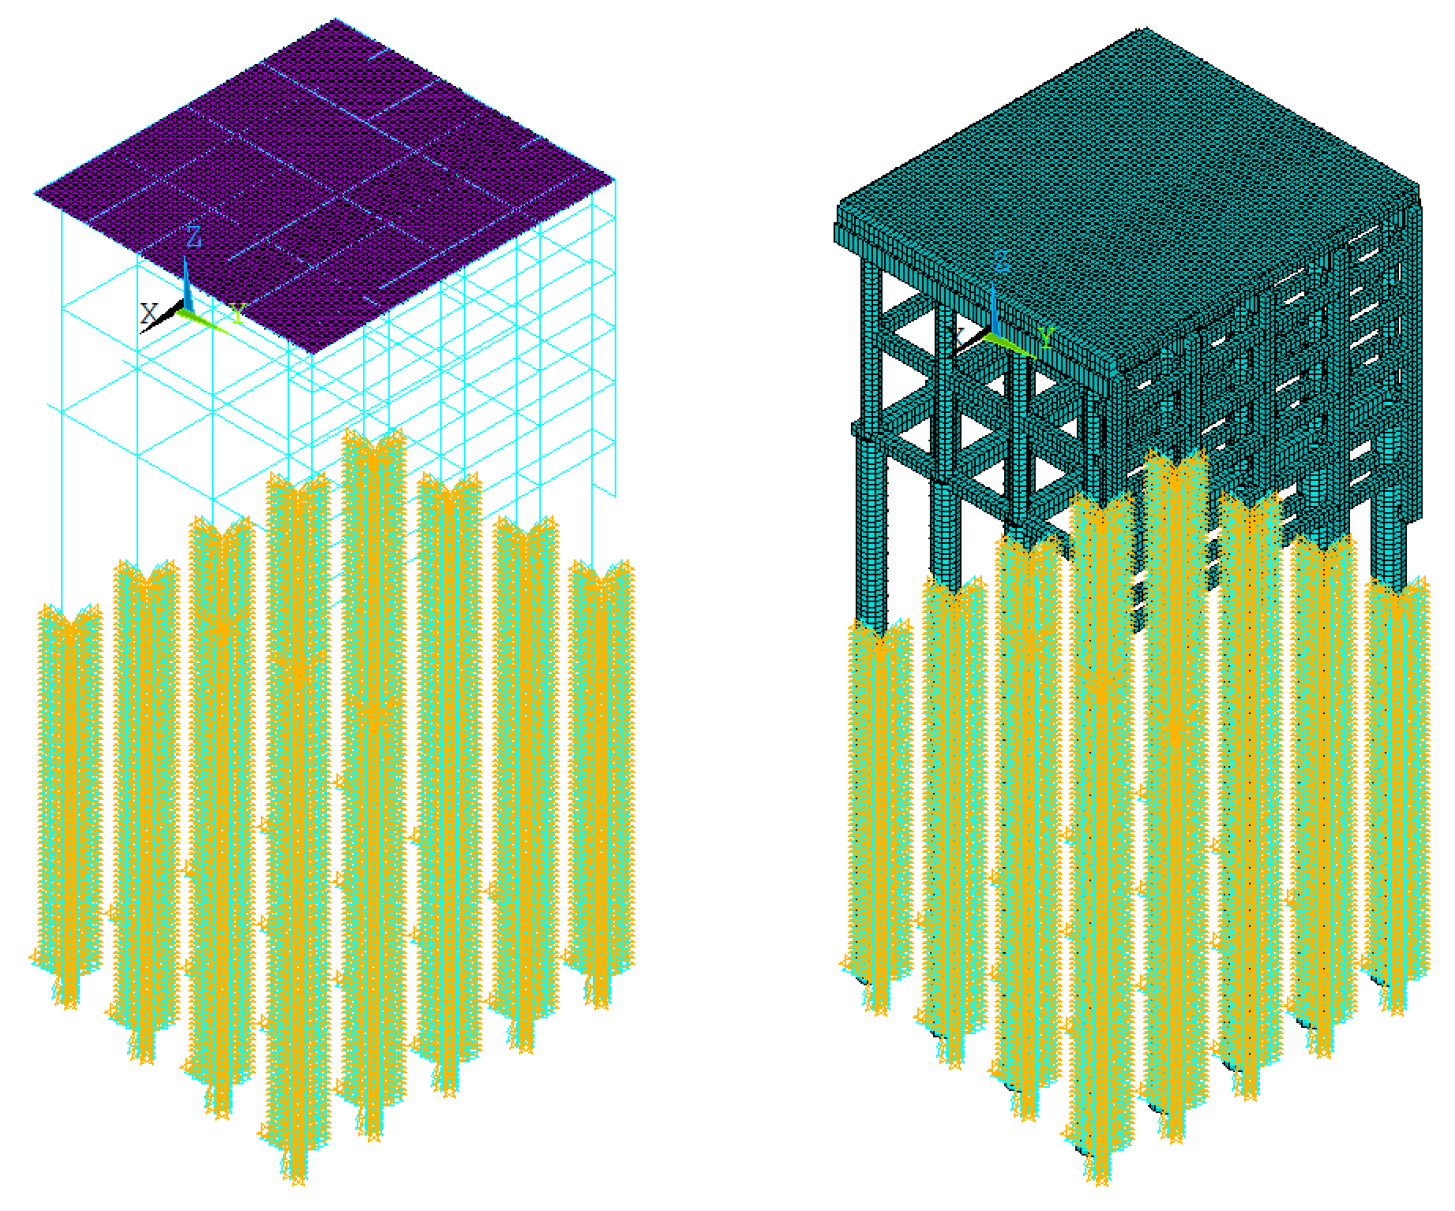
The finite element simplified analysis model is established, and the MANSYS module is called by Python’s subprocess module for analysis, which proves the feasibility of batch calculation of pile foundation stress in the complex structure of the overhead vertical high-pile wharf. By comparing the stress characteristics with the solid element model, the calculation results of the simplified analysis model are verified to be correct, so that the sample space for inversion analysis can be obtained by using the simplified model calculation results.
(4)
After analysis, compared with the strength and position of the ship’s pile foundation, the pile foundation of the inland river overhead high-pile wharf is more sensitive to the strength and the position of the pile foundation at low water level. Therefore, in the process of wharf pile foundation design and health inspection, attention should be paid to the structural state under the conditions of large tonnage and low water level.
In recent years, the Laboratory of Complex Systems and Computational Intelligence of Taiyuan University of Science and Technology [20,21,22,23,24,25,26,27,28,29] has done a lot of research on data storage and modeling methods and has obtained a series of research results, among which the new modeling technology mentioned provides reference data for better solving the problem of damage inducement inversion model in this paper. In the follow-up research, we will further optimize the modeling method and deepen the related research of this paper.

Author Contributions

Conceptualization, L.Z. and Q.W.; methodology, L.Z.; software, Q.W. and J.L. (Jie Li); validation, L.Z., Q.W., J.L. (Jia Liu) and J.L. (Jie Li); formal analysis, L.Z. and J.L. (Jie Li); investigation, Q.W.; resources, J.L. (Jia Liu); data curation, L.Z. and J.L. (Jie Li); writing—original draft preparation, L.Z. and J.L. (Jia Liu); writing—review and editing, Q.W.; visualization, J.L. (Jia Liu); supervision, Q.W.; project administration, J.L. (Jia Liu) and J.L. (Jie Li); funding acquisition, L.Z. All authors have read and agreed to the published version of the manuscript.

Funding

This research was funded by [The Science and Technology Research Program of Chongqing Mu-nicipal Education Commission] grant number [KJZD-K202305201] And [The Chongqing Trans-portation Science and Technology Project] grant number [CQJT-ZCXM2023-12] And [The Science and Technology Project of East China Survey and Design Institute of China Power Engineering Corporation] grant number [HDEC-KJ-2022-CQ01].

Data Availability Statement

Data are contained within the article.

Conflicts of Interest

Author Zuo Liangdong was employed by the company Shanghai Jiao Tong University, China Railway Changjiang Transport Design Group Co., LTD and Chongqing College of Architecture and Technology. The authors declare that this study received funding from 1. The Science and Technology Research Program of Chongqing Municipal Education Commission (NO: KJZD-K202305201); 2. Chongqing Transportation Science and Technology Project (NO: CQJT-ZCXM2023-12); 3. Science and Technology Project of East China Survey and Design Institute of China Power Engineering Corporation (NO: HDEC-KJ-2022-CQ01). The funder was not involved in the study design, collection, analysis, interpretation of data, the writing of this article or the decision to submit it for publication.

References

  1. Huang, Q. Numerical Simulation Study on Siltation Characteristics of Fluctuating Backwater Area Basin in Three Gorges Project; Chongqing Jiaotong University: Chongqing, China, 2020; pp. 11–15. [Google Scholar]
  2. Zhao, T. Study on Damage Prediction of High-Piled Wharf Under Ship Impact Force; Tianjin University: Tianjin, China, 2018; pp. 131–135. [Google Scholar]
  3. Liu, S.; Zheng, Y.; Zhu, P. Damage diagnosis and reliability research of high-piled wharf structure under ship impact load. Port Sci. Technol. 2016, 5, 57–62. [Google Scholar]
  4. Liu, X.; Zhang, Y. Safety assessment of high-piled wharf under ship impact force. Waterw. Eng. 2016, 4, 17–22. [Google Scholar]
  5. Wang, J.; Gong, J.; Zhang, Y. Statistical Analysis of Ship Impact Forces on Light Wharf Structures. China Ocean. Eng. 2010, 3, 146–151. [Google Scholar]
  6. Ye, B. Study on Pile Foundation Damage Behavior of Continuous Beam Bridge with High Pile Caps Under Barge Impact; Chongqing Jiaotong University: Chongqing, China, 2020; pp. 31–35. [Google Scholar]
  7. Zhu, R. Research on damage identification of high-piled wharf based on dynamic test. In Proceedings of the 19th China Offshore Engineering Symposium (Part Two), Chongqing, China, 11–13 October 2019; pp. 1150–1156. [Google Scholar]
  8. Qin, F. Analysis of multimodal distribution probability model of vehicle load for reliability evaluation of highway bridges. Traffic World 2016, 401, 50–51. [Google Scholar]
  9. Tian, W.; Wan, H.; Wu, Y.; Meng, B.; Zhu, X. Study on the statistical law of ship collision accidents in Jiangsu section of Yangtze River trunk line. J. Beibu Gulf Univ. 2019, 34, 8–13. [Google Scholar]
  10. Cai, D.; Duan, X.; Gao, H. Detection and tracking of water sports ships. Comput. Math. Eng. 2017, 7, 1313–1317. [Google Scholar]
  11. Zhu, Z. Expectation Maximization (EM) algorithm and its application in Gaussian mixture model. Mod. Electron. Technol. 2003, 24, 88–90. [Google Scholar]
  12. 2020 Port Operation Ship Information Monthly Report (January–December); Chongqing Port Logistics Group: Chongqing, China, 2020.
  13. Yangtze River Water Level Information Report (2016–2020); Hydrological Bureau of Upper Yangtze River: Chongqing, China, 2020.
  14. Liu, P. Python programming in LabVIEW and TestStand. Comput. Times 2020, 18, 54–58. [Google Scholar]
  15. Ayer, J.E.B.; Lämmle, L.; Mincato, R.L.; Donadio, C.; Avramidis, P.; Pereira, S.Y. Three-dimensional model and environmental fragility in the Guarani Aquifer system, SE-Brazil. Groundw. Sustain. Dev. 2024, 26, 101285. [Google Scholar] [CrossRef]
  16. Zuo, L.; Cao, S.; Zhou, S.; Wu, J. Inversion of damage inducement of wharf pile foundation under heaped load based on parametric model. SN Appl. Sci. 2022, 4, 69. [Google Scholar] [CrossRef]
  17. Zuo, L.; Shiliang, Z.; Cao, S.; Wu, J. Inversion of damage inducement of overhead vertical wharf based on parametric model. Waterw. Eng. 2022, 2, 61–67. [Google Scholar]
  18. Zuo, L.; Shiliang, Z.; Quan, J. Analysis of factors affecting the stress of wharf pile foundation in reinforced high fill area. Waterw. Eng. 2022, 5, 170–177. [Google Scholar]
  19. Shiliang, Z.; Chunru, K.; Fan, W. Prediction Model of Ship Impact Force on Overhead Vertical Wharf Based on Support Vector Machine. Waterw. Eng. 2023, 8, 21–27+126. [Google Scholar]
  20. Cai, X.; Ji, C.; Zhao, T. A Constrained Many-Objective Mobile Crowd Sensing Task Allocation Method Considering Latent Workers. IEEE Internet Things J. 2024, 12, 4065–4077. [Google Scholar] [CrossRef]
  21. Cai, J.; Chen, B.; Wen, J.; Cui, Z.; Chen, J.; Zhang, W. A joint vehicular device scheduling and uncertain resource management scheme for Federated Learning in Internet of Vehicles. Inf. Sci. 2025, 690, 121552. [Google Scholar] [CrossRef]
  22. Wen, J.; Cui, Z.; Zhang, H.; Chen, J. A Many-objective Joint Device Selection and Aggregation Scheme for Federated Learning in IoV. ACM Trans. Sens. Netw. 2024; in press. [Google Scholar] [CrossRef]
  23. Cui, Z.; Qu, C.; Zhang, Z.; Jin, Y.; Cai, J.; Zhang, W.; Chen, J. An adaptive interval many-objective evolutionary algorithm with information entropy dominance. Swarm Evol. Comput. 2024, 91, 101749. [Google Scholar] [CrossRef]
  24. Zhao, T.; Wu, L.; Cui, Z.; Qin, A.K. An adaptive strategy based multi-population multi-objective optimization algorithm. Inf. Sci. 2025, 686, 120913. [Google Scholar] [CrossRef]
  25. Cai, X.; Zhang, Y.; Li, M.; Wu, L.; Zhang, W.; Chen, J. Dynamic deadline constrained multi-objective workflow scheduling in multi-cloud environments. Expert Syst. Appl. 2024, 258, 125168. [Google Scholar] [CrossRef]
  26. Cui, Z.; Wu, Y.; Zhao, T.; Zhang, W.; Chen, J. A two-stage accelerated search strategy for large-scale multi-objective evolutionary algorithm. Inf. Sci. 2025, 686, 121347. [Google Scholar] [CrossRef]
  27. Qin, J.; Pei, D.; Guo, Q.; Cai, X.; Xie, L.; Zhang, W. Intersection-union dual-stream cross-attention Lova-SwinUnet for skin cancer hair segmentation and image repair. Comput. Biol. Med. 2024, 180, 108931. [Google Scholar] [CrossRef]
  28. Zhao, B.; Cui, Z.; Yang, J.; Cai, X.; Cai, J.; Chen, J. A multi-task evolutionary algorithm for solving the problem of transfer targets. Inf. Sci. 2024, 681, 121214. [Google Scholar] [CrossRef]
  29. Cui, Z.; Shi, Z.; Li, Q.; Zhao, T.; Zhang, W.; Chen, J. Cooperative interference to achieve interval many-objective evolutionary algorithm for association privacy secure computing migration. Expert Syst. Appl. 2024, 255, 124662. [Google Scholar] [CrossRef]
Figure 1. Three Gorges Reservoir area.
Symmetry 17 00215 g001
Figure 2. Fitting curve of average daily water level from 2016 to 2020.
Symmetry 17 00215 g002
Figure 3. Parametric dock model.
Symmetry 17 00215 g003
Figure 4. Distribution of ship impact points.
Symmetry 17 00215 g004
Figure 5. Stress scatter diagrams of pile foundation under ship impact.
Symmetry 17 00215 g005
Figure 6. Scatter diagram of dimension reduction treatment of pile stress under ship impact.
Symmetry 17 00215 g006
Figure 7. Loss curve of classification learner.
Symmetry 17 00215 g007
Figure 8. Loss curve of regression learner.
Symmetry 17 00215 g008
Figure 9. Comparative analysis of settlement results.
Symmetry 17 00215 g009
Table 1. Fitting of probability density function of ship tonnage.
Statistical ObjectGaussian ComponentWeightAverage ValueStandard Deviation
Ship tonnage10.1915.982.55
20.23312.557.25
30.4561.980.89
40.00950.1511.21
Table 2. Optimal parameters of artificial neural network model.
ParameterParameter
Classification LearnerRegression Learner
OptimizerAdamAdam
Hidden layer22
Number of hidden layer nodes[50, 30][100, 50]
Activate functionReluIdentity
Convergence error0.0010.001
Penalty factor0.010.2
Maximum number of iterations500500
Table 3. Identification results of ship impact position.
LocationTraining Data SetTest Data Set
Sample NumberPrecisionF1Hamming LossSample NumberPrecisionF1Hamming Loss
15260.950.9490.0491690.8990.8880.1
24930.9370.9330.0631660.9030.9010.096
34970.9740.9980.0261630.9750.9750.024
45340.9490.950.0511590.9050.910.0943
54730.8580.8320.1411650.80.8150.211
65130.9880.9870.0121600.9690.9520.0312
74990.9520.9490.0481770.9490.9480.0508
84800.8850.8820.1141580.8290.8310.17
94870.9440.940.0551760.9370.9250.0625
104780.9710.9690.0291660.9570.9550.032
115220.9980.9890.0011670.9980.9860.001
125300.9990.9890.011790.9690.9710.0287
135070.9990.9950.0111790.980.9850.015
144660.9890.98501570.9710.9790.0215
154950.990.9950.021590.9820.9850.0122
total75000.9420.9420.05725000.9430.9410.0576
Table 4. Identification results of ship impact strength.
LocationTraining Data SetTest Data Set
Sample NumberR2MSEMAESample NumberR2MSEMAE
15260.997 33.476 4.601 1690.997 37.917 5.016
24930.996 46.082 5.394 1660.996 43.113 5.132
34970.997 40.894 5.006 1630.997 39.684 5.019
45340.997 41.190 5.240 1590.996 43.729 5.351
54730.996 51.385 5.789 1650.995 66.184 6.395
65130.997 39.907 4.901 1600.997 38.344 4.964
74990.997 40.407 5.077 1770.996 56.719 5.907
84800.996 47.118 5.448 1580.996 44.238 5.165
94870.996 53.087 5.900 1760.996 49.533 5.739
104780.994 71.079 6.999 1660.994 76.648 7.475
115220.997 35.147 4.738 1670.998 34.737 4.732
125300.997 43.386 5.276 1790.996 54.646 6.054
135070.997 39.084 5.051 1790.996 46.148 5.428
144660.997 38.028 4.971 1570.997 39.069 5.063
154950.997 39.171 5.022 1590.997 43.802 5.331
total75000.99243.963 5.294 25000.996 47.781 5.527
Disclaimer/Publisher’s Note: The statements, opinions and data contained in all publications are solely those of the individual author(s) and contributor(s) and not of MDPI and/or the editor(s). MDPI and/or the editor(s) disclaim responsibility for any injury to people or property resulting from any ideas, methods, instructions or products referred to in the content.

