You are currently viewing a new version of our website. To view the old version click .
Symmetry
  • Article
  • Open Access

13 November 2025

A Novel Cooperative Game Approach for Microgrid Integrated with Data Centers in Distribution Power Networks

,
,
,
,
,
and
State Key Laboratory of Smart Power Distribution Equipment and System, Tianjin University, Tianjin 300072, China
*
Authors to whom correspondence should be addressed.
This article belongs to the Section Engineering and Materials

Abstract

With the accelerating digital transformation of modern society, numerous data center (DC) agents are connected to the distribution power networks (DPNs) via microgrid and engaging in fierce market competition. To address the asymmetric operational risks faced by each data center agent, particularly those arising from market volatility and equipment failures, a novel cooperative game-theoretic approach is proposed in this paper. Firstly, a cooperative operation framework for the microgrid-integrated data centers (MDCs) system is established from two dimensions: joint task allocation across MDCs on the computing side and energy sharing among MDCs on the power side. Moreover, an optimal operating model for MDCs is established, which integrates the task allocation model that takes into account the task processing capacity of MDCs. Then, a cooperative operation model for the MDCs system based on Nash game theory is developed, and a joint solution framework for task allocation and the cooperative operation model is designed. Finally, the proposed cooperative game-theoretic approach is validated in a test system. The results show that the proposed approach ensures the reliable operation of the DPN while avoiding asymmetric operation risks among MDCs. It enhances the stability and security of distributed data processing. Furthermore, the Nash game-theoretic model achieves a symmetric distribution of profits and risks across MDCs, eliminating individual biases and maximizing the overall benefits of the cooperative alliance.

1. Introduction

As the pivotal cornerstone of the digital economy era, data centers (DCs) are assuming an increasingly important role [,,]. Generally, DCs are integrated into the power distribution network via microgrids, with their operation and maintenance managed by specialized agents []. With the rapid development of generative artificial intelligence (AI), a large number of market agents have invested in massive DCs of different scales []. However, these DCs often operate independently, lacking effective coordination mechanisms to respond to market fluctuations or equipment failures, which compromises computational service reliability and reduces operational economic efficiency []. Furthermore, to address the aforementioned issues, numerous scholars have conducted research in the following two aspects: one is building granular mathematical models of DCs, enhancing the precision of their scheduling under different operating conditions; the other is to establish collaborative operation mechanisms among multiple data centers, ensuring optimal allocation of limited resources.
The accurate modeling of DCs is regarded as a prerequisite for improving their operational economy and the reliability of computing services []. A large amount of existing research has focused on minimizing the overall operational energy consumption of the DC system. Specifically, these studies aim to unravel the energy interaction mechanisms among IT equipment, cooling systems, and power supply networks by developing dynamic models of energy consumption. Leveraging such models, corresponding energy efficiency optimization strategies are subsequently proposed. By using the reinforcement learning algorithm, an efficient optimization approach for the DC cooling system was developed in [], which reduces cooling energy consumption and mitigates the risk of temperature violations. To better capture the future trends in energy consumption of Information Technology (IT) servers within DCs, a systematic review of power consumption models for DC servers was conducted in []. In addition, to develop a composite energy consumption model for DCs, the researchers in [] integrated server operations, cooling systems, and adaptive thermal control mechanisms. To exploit the potential multi-energy coupling flexibility of data centers, the DC in [,] is innovatively modeled as an energy prosumer. Through the deployment of a waste heat recovery system, the joint operation between the DC and the integrated electricity-heat energy system is enabled. Although previous research has established precise energy consumption models, a mathematical model for data center operators to participate in market competition has not yet been developed. This gap limits the in-depth exploration of regulatory capabilities and economic benefits in energy sharing and flexible workload scheduling.
In the context of DCs’ collaborative optimization, most studies focus on coordinating the scheduling of DCs and the energy system by leveraging the spatio-temporal flexibility of tasks. Reference [] proposed that geographically distributed DC clusters participate in the power balancing market as non-wire alternative resources, replacing traditional transmission network expansion plans to alleviate grid congestion and peak load pressure. To achieve cross-regional complementary use and real-time absorption of renewable energy, a multi-DC carbon management mechanism based on spatiotemporal task migration was introduced in []. Refs. [,] developed a collaborative response framework between multiple DCs and a hydrogen storage system, which helps prevent local grid overloads and enhances the utilization rate of renewable energy. A non-cooperative game model among multiple data center operators was developed in []. The results indicate that competition among these operators can safeguard the interests of service subscribers. Reference [] addressed grid frequency fluctuation management by optimizing workload scheduling and the charging-discharging strategies of uninterruptible power supplies (UPS) in cloud DCs. While these studies explore the flexibility of multi-DCs as load-side resources from various perspectives, the importance of in-depth cooperation among them has not been sufficiently emphasized. Specifically, the development of a localized cooperative operational framework for DCs remains understudied. In particular, the integration of a joint computing and power scheduling mechanism has not yet been embedded into such a cooperative framework. Consequently, the potential for reducing operational costs and enhancing mutual backup reliability remains largely untapped.
In view of this, this paper focuses on the optimization problem of collaborative operation in the MDC system. Its core idea is to formulate an optimization strategy that can reasonably balance computing task processing and the operational economy of the MDC system. Based on this, this paper designs a collaborative operation optimization framework for the MDC system from the perspectives of computing power and electricity. It integrates task allocation and scheduling mechanisms to obtain the optimal task processing scheme. This paper also constructs an optimization model based on Nash game theory to symmetrize the interaction relationship between operators of MDCs. Table 1 compares the proposed approach with the current status of existing studies related to data centers, so as to highlight its contributions. The contributions of this research are summarized as follows:
Table 1. Comparative analysis of this study with relevant references.
(1)
A task allocation and scheduling mechanism is proposed and integrated into the optimization model of the MDC system to achieve load balancing of servers in each MDC on a spatiotemporal scale. In particular, the proposed task allocation and scheduling mechanism actively considers the server operation status and the economy of processing tasks in each data center, which effectively reduces the task processing cost and taps the standby potential of servers among data centers.
(2)
For the MDCs system with task allocation and scheduling mechanisms and energy sharing, an optimization model based on game theory and a solution framework is proposed. Specifically, the Nash bargaining game model is used to describe the interaction relationship between operators of MDCs. In addition, the solution framework integrates the greedy algorithm and the distributed alternating direction method of multipliers (ADMM) to obtain the optimal task processing scheme and the Nash bargaining solution (NBS) of the game model.
The structure of this paper is arranged as follows: Section 2 expounds the overall framework of the cooperative optimization problem; the optimal operation model of the MDC is introduced in Section 3; Section 4 proposes an interactive distributed solution framework for the Nash bargaining game model through the greedy algorithm and the distributed ADMM algorithm; Section 5 conducts numerical analysis and verification. Finally, Section 6 summarizes the whole paper.

2. The Cooperative Operation Framework of the MDCs System

This section elaborates in detail on the cooperative operation architecture of the MDCs system from the following three aspects: the operation modes of the MDCs system, the operational architecture inside each MDC, and the cooperative operation mechanism of the MDCs system.

2.1. The MDCs System Operation Mode Considering Task Allocation and Scheduling

The MDC system studied in this paper is connected to the distribution network and communication network through a common coupling point. The networked MDCs system is illustrated in Figure 1. We assume that cross-center cooperation agreements have been signed between MDCs, clarifying profit distribution and risk-sharing mechanisms, and enabling the upload of non-critical data to the scheduling platform. Therefore, the MDCs system in this study has functions in two dimensions, as follows.
Figure 1. The MDC’s system operation mode.
Joint task allocation across MDCs on the computing side: Local tasks are assumed to be allocated through a centralized scheduling platform (CSP), which optimally distributes the tasks by taking into account the task-bearing capacities of each MDC.
Energy sharing among MDCs on the power side: Energy or power is assumed to be shared between different MDCs through distribution lines.
In addition, the core function inside each MDC is to provide more flexible and efficient power support for the data center through the microgrid, while the load characteristics of the data center can also participate in the optimal scheduling of the microgrid. The operational architecture inside each MDC is illustrated in Figure 2, which primarily includes the task processing model, IT devices, and supporting infrastructure of the data center, and the power supply model.
Figure 2. The operational architecture inside each MDC.
Specifically, tasks are divided into two types: delay-sensitive tasks and delay-tolerant tasks. For delay-sensitive tasks, their execution time is usually restricted to a short time range, typically a few seconds. In contrast, delay-tolerant tasks have relatively flexible deadlines, which can be appropriately delayed and rescheduled to other time periods, with the user compensated, should this be included in such cases []. The IT devices of DCs are the primary power-consuming devices. This study focuses primarily on the optimal task scheduling scheme. Therefore, the power consumption of supporting infrastructure is presented in the form of empirical constants. The power supply model of each MDC consists of three components: generators, an energy storage system (ESS), and power purchased from the DPN. The generators mentioned in this paper include micro gas turbine (MT) and renewable energy sources (RES).

2.2. The Cooperative Operational Mechanism of the MDCs System

The implementation of the cooperative operation mechanism for MDCs mainly depends on two key aspects: the ability of tasks to instantaneously shift loads independently of the power grid [] and the energy sharing mechanism among MDCs. Specifically, the functionality of this mechanism is illustrated in Figure 3.
Figure 3. The cooperative operational mechanism of MDCs.
Normal operating state: The cooperative relationship among MDCs is formulated by the Nash bargaining game model, facilitating optimal decision-making for task scheduling and maximizing MDCs’ alliance benefits. By processing tasks from local users alongside those assigned by external agents, each data center enhances the overall operational efficiency of the system through collaborative task scheduling and energy-sharing strategies.
Abnormal operating state: The proposed task allocation model can dynamically respond by reallocating tasks based on the task-carrying capacity of each MDC. This approach effectively activates the complementary backup potential among MDCs, preventing task discarding and ensuring the stable operation of the system.

3. Optimal Operation Model of MDCs Considering Task Allocation and Scheduling

In this section, the local computing task allocation, scheduling constraints of servers and tasks, the objective function, and constraints for the optimal operation model of MDC are modeled.

3.1. Local Tasks Allocation Considering the Processing Capacity of MDCs

The purpose of the task allocation model is to assign the task k arriving at time t to MDC i. To achieve this goal, decision variables, constraints and undertaking capacity metrics are formulated in this section.

3.1.1. Constraints on the Decision Variable

Constraints (1)–(4) ensure the feasibility and rationality of task allocation. First, each task must be assigned to exactly one MDC within its designated time slot. Constraint (1) ensures that tasks are neither omitted nor repeatedly allocated. Second, the total load of an MDC in any time slot must not exceed its number of servers to prevent overload, as formulated in (2). The decision variable xi,j,t is a binary variable that can only take the value of 0 or 1. Constraint (3) indicates whether a task is allocated. Additionally, tasks can only be allocated within their designated time slots, and allocation variables for non-designated time slots must be 0, as formulated in Equation (4).
i I x i , k , t = 1 , k K
k K L k x i , k , t S i , t , i I , t T
x i , k , t = { 0 , 1 } , i I , k K , t T
x i , k , t = 0 , i I , k K , t t k
where xi,j,t is the core decision variable of the model, which indicates whether task k is assigned to MDC i at time tk. Lk is the number of servers required to complete task k, reflecting the capability of servers to process the task. Si,t is the maximum number of servers that can activate at time slot t.

3.1.2. The Task Processing Capacity Metrics of MDC

The task processing capacity of each MDC is quantified by evaluation metrics, which are established from three aspects: server utilization, time-of-use electricity pricing, and renewable energy output, as shown in Equations (5)–(7).
The server utilization score is formulated in Equation (5), which reflects the load balancing degree of MDC i during time slot t. The lower the utilization, the higher the score. The relative score of the electricity price, as formulated in Equation (6), reflects the economic efficiency of the time-of-use electricity price for MDC i during the time slot t. The lower the time-of-use electricity price, the higher the score. The renewable energy proportion score, as formulated in Equation (7), reflects the utilization level of renewable energy by MDC i during time slot i. The higher the proportion, the higher the score.
U i , t = 1 k K L k x i , k , t S i , t
P i , t = 1 P i , t m i n i D ( P i , t ) m a x i D ( P i , t ) m i n i D ( P i , t )
R i , t = min ( 1 , R i , t E i , t )
where Lk represents the number of servers required to complete task; Si,t represents the number of active servers in MDC i during time slot t; Pi,t represents the time-of-use electricity price of MDC i during time slot t; Ri,t represents the renewable energy generation of MDC i during time slot t; The total energy consumption is denoted as Ei,t = εSi,t, which ε is the energy consumption coefficient per unit time for a single server.

3.2. Delay-Tolerant Task Scheduling Model of MDC

The tasks processed by MDC i are wi,cloud(t) (issued by cloud servers) and wi,local(t) (from local users), respectively. Therefore, for MDC i, we define the total amount of tasks arriving at time t as Equation (8).
W i ( t ) = w i , c l o u d ( t ) + w i , l o c a l ( t )
The tasks of MDC can be divided into delay-tolerant tasks and delay-sensitive tasks. Delay-sensitive tasks need to be processed immediately. In contrast, delay-tolerant tasks usually have flexible deadlines for completion and can be postponed for a specific period of time to be executed. In addition, when the tasks reach the processing limit of the server, MDC is allowed to temporarily suspend the exceeding tasks and wait for the retry queue to process them. Thus, the actual tasks of MDC i at time t can be calculated as follows:
W i ( t ) = w i , d t ( t ) + w i , d s ( t ) + w i , s u s ( t )
Different types of delay-tolerant tasks have different delay constraints. In this paper, their average delay is taken, denoted as DT. The scheduling characteristics of delay-tolerant tasks are shown in Equation (10).
w i , d t ( t ) = a = 0 D T w i , d t ( t + a ) a D T
To realize the scheduling characteristics of delay-tolerant tasks, the specific modeling method is as follows: first, we transform the delay-tolerant tasks wi,ds to be processed into a diagonal matrix, as depicted in Equation (11). Second, we introduce matrix X to capture task scheduling details: specifically, a row vector denotes scheduling time slots, while a column vector denotes original time slots. Accordingly, summing the elements of the row vector in Equation (12) yields the delay-tolerant tasks processed in time slot t after scheduling, whereas summing the elements of the column vector in Equation (13) yields those processed in time slot t before scheduling. Equation (14) specifies that x is non-negative, with the tasks scheduled in a single time slot not exceeding the upper limit. To avoid server overload, the total processing capacity in each scheduling time slot must not exceed the predefined upper limit, as shown in Equation (15).
W 24 × 24 = d i a g ( w i , d t )
t 1 T X t 1 , t 2 = d t 2 , t 2 { 1 , 2 , , 24 }
w i d t ( t ) = t 1 24 x t 1 , 1 , t 1 24 x t 1 , 2 , , t 1 24 x t 1 , 24
0 X t 1 , t 2 U t 1 , t 2 , t 1 , t 2 { 1 , 2 , , 24 }
t 2 T X t 1 , t 2 A t 1 , t 2 M , t 2 { 1 , 2 , , 24 }
In Equation (16), the number of active servers at time t is determined by the number of tasks and the computing rate of the servers μi.
N i ( t ) = w i , d t ( t ) + w i , d s ( t ) + w i , s u s ( t ) μ i
0 N i ( t ) N i , max
where Ni,max is the maximum number of servers started.
The total power load of the data center operation is formulated in Equations (18) and (19), which includes the minimum power consumption required to keep the servers running during idle time, the increase in power consumption due to processing tasks, and the baseline power consumption of other data center infrastructure (such as cooling, lighting, etc.).
P i , s e r ( t ) = P i , i d l e N i ( t ) + W i ( t ) ( P i , p e a k P i , i d l e ) / μ i
P i , D C ( t ) = P U E i P i , s e r ( t ) + P i , a d d ( t )
where PUEi is the energy efficiency metric of DC i, Pi,peak and Pi,idle are the power consumption of the servers in MDC i during idle and peak conditions, respectively.

3.3. Objective Function for the Optimal Operation of MDC

The objective of each MDC is to minimize the total cost within the scheduling cycle, as shown in Equation (20).
C i , M D C = m i n t = 1 T ( ω d e l C i t a s k ( t ) + C i O M ( t ) + C i o p e ( t ) )
where C i t a s k (t) is the task scheduling cost of MDC i. ωdel is the weight coefficient, which aims to balance the electricity cost and the task delay cost, C i O M (t), C i o p e (t) are the maintenance cost and operational cost on the power side of MDC i at time slot t, which can be calculated by Equations (21)–(23):
The task scheduling cost in Equation (20) is calculated by Equation (21),
C i t a s k ( t ) = C i d e l ( t ) + C i s u s ( t )
C i d e l ( t ) = a = 0 D T ( μ d e l w i , d t ( t + a ) )
C i s u s ( t ) = μ s u s w i , s u s ( t )
where C i d e l (t) is the task delay cost, which includes the compensation cost of delay-tolerant tasks and the computing delay cost of all tasks. C i s u s (t) is the compensation cost incurred when a task is suspended. fi is the task processing rate of a server in the MDC i.
The maintenance cost in Equation (20) is calculated by Equation (24),
C i O M ( t ) = C i , s e r O M ( t ) + C i , M T O M ( t ) + C i , e s s O M ( t )
C i , s e r O M ( t ) = α s e r O M P i , s e r ( t )
C i , M T O M ( t ) = α M T O M P i , M T ( t )
C i , e s s O M ( t ) = α e s s O M ( P i , c h ( t ) + P i , d i s ( t ) )
where C i , s e r O M (t), C i , M T O M (t), C i , e s s O M (t) are the maintenance costs of the MDC i server, MT, and ESS, respectively. α s e r O M , α M T O M , α e s s O M are the corresponding maintenance cost coefficients, respectively.
The operational cost in Equation (20) is calculated by Equation (28),
C i o p e = C i , g r i d o p e ( t ) + C i , f u e l o p e ( t ) + C i , n e t o p e ( t )
C i , g r i d o p e ( t ) = μ i , b u y ( t ) P i , b u y ( t ) μ i , s e l l ( t ) P i , s e l l ( t )
C i , f u e l o p e = α i , M T P i , M T ( t ) + β i , M T
C i , n e t o p e = i , j Ω M D C , i j α n e t D i j P i j ( t ) 2
where C i , g r i d o p e , C i , f u e l o p e , and C i , n e t o p e are the electricity purchasing and selling cost, fuel cost, and cost of using the power grid during energy sharing of MDC i. Dij is the electrical distance between MDC i and MDC j. Pij(t) is the shared power between MDC i and MDC j at time slot t.

3.4. The Constraints for the Optimal Operation of MDC

3.4.1. Distributed Energy Resources Operating of MDC

The relevant constraints on Distributed Energy Resources operation in each MDC are formulated as Equations (32)–(40):
0 P i , WT ( t ) P i , WT , max
0 P i , PV ( t ) P i , PV , max
0 P i , MT ( t ) P i , MT , max
0 P i , c h ( t ) u i , e s s ( t ) P i , c h , max
0 P i , d i s ( t ) v i , e s s ( t ) P i , d i s , max
0 u i , e s s ( t ) + v i , e s s ( t ) 1
E i ( t + 1 ) = E i ( t ) + η i , c h P i , c h ( t ) P i , d i s ( t ) / η i , d i s
E i , e s s , min E i , e s s ( t ) E i , e s s , max
E i , e s s ( T ) = E i , e s s ( 0 )
where Ei(t) is the energy stored in the ESS of MDC i at time slot t.

3.4.2. Network Constraints

The high-quality power supply for data centers and energy sharing among MDCs highly depend on the distribution network. Therefore, the optimization scheme for the MDC system must satisfy the constraints of the distribution network. However, since the distribution network is managed by the DPN operator, its operational data and constraints are difficult to obtain and integrate directly into the optimization modeling of the MDC system. To this end, an optimized inspection mechanism is proposed in this paper, which is employed to assess and confirm the compliance of the optimization results with the distribution network constraints in the cooperative operation model of the MDC system []. Specifically, the considerations for network constraints are described next.
First, the computing resource scheduling plan is determined by the data center agent based on the current computing resource requirements, and the power consumption under this plan is reported to the MDC operator. Then, an energy sharing plan is formulated by the MDC operator based on the power demands reported by each data center agent, and power operation simulations are conducted to generate corresponding simulation results. Subsequently, the DPN operator receives the power operation simulation results sent by the MDC operator and checks whether the power flow exceeds the transmission capacity of the lines. Suppose an overload of power lines is detected. In that case, the DPN operator will provide the line transmission capacity as a constraint, which the MDC operator will incorporate into consideration in the next round of the optimization process to formulate a new energy distribution and scheduling plan.
The power flow carrying capacity of line l in the distribution network can be expressed as follows:
P l , min n N η n , l P n ( t ) P l , max , l L
where n is the serial number of the distribution network nodes. l is the serial number of the distribution network lines. Pn(t) is the injected power of node n at time slot t. ηn,l is the power allocation coefficient, representing the proportion of the injected power at node n that can be allocated to line l, which is determined by the topological structure and parameters of the distribution network. Pl,min and Pl,max represent the upper and lower limits of the carrying capacity of line l. In addition, for the distribution network nodes connected to the MDC, the node injection power can be defined as Equation (42):
P n ( t ) = i Ω M D C ( P i , s e l l ( t ) P i , b u y ( t ) + j Ω M D C , i j P i j ( t ) )
where ΩMDC represents the set of MDCs connected to the distribution network. Pn,load(t) is the power consumption at node n during period t.
For the distribution network nodes not connected to the MDC, the node injection power can be defined as Equation (43).
P n ( t ) = P n , load ( t )

3.4.3. Power Balance Among MDCs

Each independent MDC is treated as a single-bus system connected to the distribution network, and its internal network structure is not considered in []. Therefore, the active power balance of MDC i can be expressed in the form of a single bus:
P i , b u y ( t ) + P i , WT ( t ) + P i , PV ( t ) + P i , MT ( t ) + P i , d i s ( t ) = P i , D C ( t ) + P i , s e l l ( t ) + P i , c h ( t ) + P i , l o a d ( t ) + j Ω M D C , i j P i j ( t )
The left-hand side of the equation represents the total available power generation of MDC i at time slot t, while the right-hand side corresponds to the total power consumption at time slot t; All energy sharing of MDC i at time t conducted through node n can be summarized as shown in Equation (42) and is subject to the constraint of Equation (41). Therefore, power balance among MDCs Equation (45) can be rewritten as follows:
P i , WT ( t ) + P i , PV ( t ) + P i , MT ( t ) + P i , d i s ( t ) = P i , D C ( t ) + P i , c h ( t ) + P i , l o a d ( t ) + P n ( t )

4. Nash Bargaining Game Model and Interactive Distributed Solution Framework

4.1. Solution Process

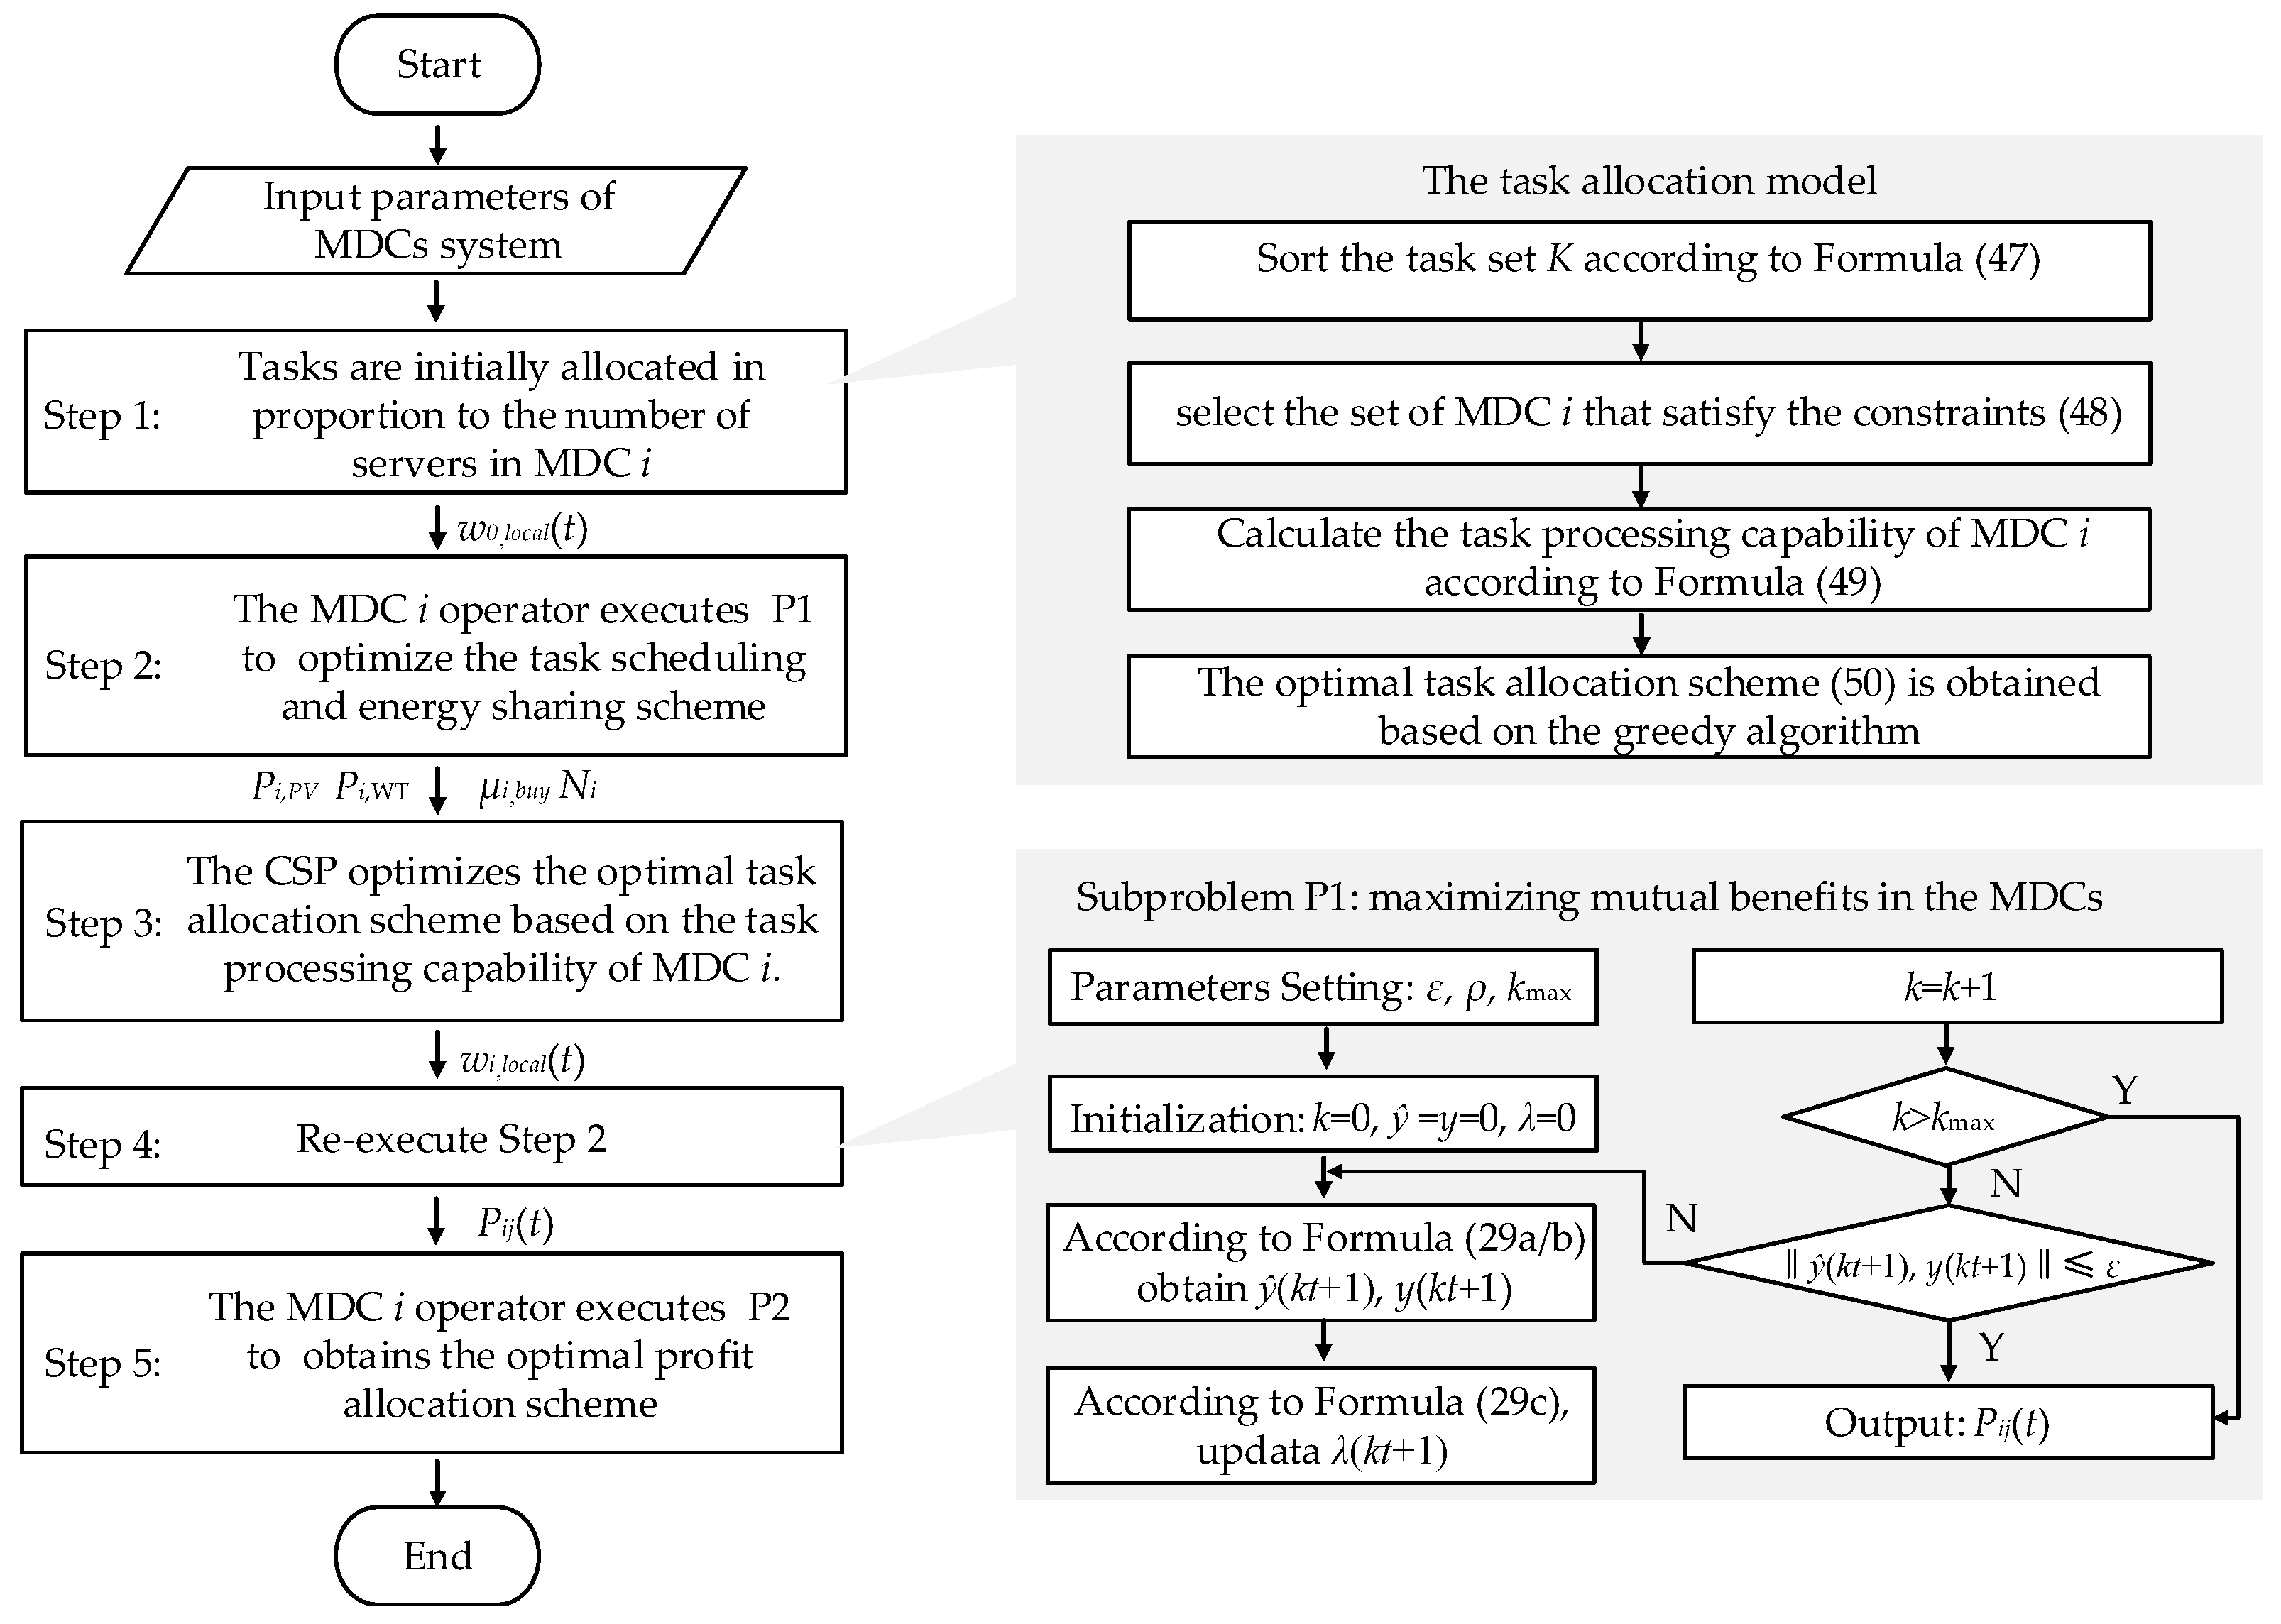
An interactive model solution framework that combines the ADMM and the greedy algorithm is proposed in this section. The solving flowchart is shown in Figure 4. The solution process is described as follows:
Figure 4. The solving flowchart.
After the initialization, the first task is to assign the local computational tasks to each MDC, which corresponds to the solution of the task allocation model in the first stage. Each MDC uploads the required data center to the scheduling platform, and the tasks are allocated to each MDC based on a greedy algorithm. Once the MDC receives the local computational tasks, the second stage, which involves the Nash bargaining game model, is initiated. The game model is divided into two sub-problems [,]: P1, which focuses on maximizing social welfare, and P2, which deals with alliance profit distribution. In the k-th iteration of P1, each MDC performs local optimization to determine the optimal task scheduling and energy sharing schemes. P2 determines a fair profit distribution scheme based on the contribution ratio of each MDC to the energy sharing scheme, and then calculates the total operational cost for each MDC. Finally, it is necessary to check whether the game has reached an equilibrium state. If equilibrium has not been reached, the next iteration will begin.
If no MDC can increase its profit by adjusting its strategy, the game is considered to be in equilibrium, as formulated in Equation (46).
S i = arg max C i S i , S k , k Ω M D C , i k
where Si is the game strategy of MDC i. Ci denotes the objective functions of MDC i. Sk is the optimal response of MDC i when the other MDCs give the strategy.

4.2. Solution of the Task Allocation Model

In this section, the greedy algorithm is employed to solve the task allocation model, in order to adapt to scenarios such as data center task allocation that require quick decision-making. The greedy algorithm is guided by local optimality, selecting the best solution at each step based on the current context []. In the task allocation problem, at each step, for each task, the data center with the highest overall compatibility is selected for allocation in order to optimize the overall objective. The steps for solving are as follows:
First, sort the task set K in ascending order based on the execution time slot tk, ensuring that tasks with earlier execution times are prioritized for processing.
K s o r t e d = { k ( 1 ) , k ( 2 ) , , k ( m ) } ,   t k ( 1 ) t k ( 2 ) t k ( m )
where k(n) is the m-th task after sorting, and its corresponding execution time slot tk is arranged in non-decreasing order.
For each task k, iterate through all data centers and select the set of MDCs that satisfy the constraints Equation (48).
D k = { i Ω M D C k K L k x i , k , t k , + L k S i , k }
For each candidate data center, we consider its task processing capacity, and three key metrics are established: server utilization, time-of-use electricity pricing, and the proportion of renewable energy. The overall score is calculated through a weighted sum of these metrics.
S C a l l o ( i ) = ω 1 U i ( t ) + ω 2 P i ( t ) + ω 3 R i ( t )
Finally, based on Equation (49), select the MDC with the highest overall score from the Dk, and allocate task k to that.
a s s i g n [ j ] = arg max i Ω M D C S C a l l o ( i )
The task allocation model, considering the data center’s task processing capacity, is solved by Algorithm 1.
Algorithm 1. Task allocation algorithm
Input: The set of tasks to be assigned, the number of active servers, the time-of-use electricity prices, and the renewable energy output.
Output: The MDC to which the task is assigned.
Initial Step: Initialize the task allocation result (where −1 indicates not yet assigned)
Step 1: Sort the task K in chronological order.
Step 2: For each k(m), select the candidate Dk that satisfies the capacity constraints:
k K L k x i , k , t + L k S i , t k
Step 3: Calculate the overall score for each MDC based on Formulas (5)–(7).
Step 4: Update the task allocation k(m) to the MDC with the highest score, and update the current tasks of the MDC i.
Step 5: Return the allocation results for all tasks.

4.3. Solution of the Nash Bargaining Game Model

4.3.1. Establishment of the Nash Bargaining Game Model

This paper aims to construct a collaborative operation framework for MDCs to integrate workload scheduling and energy sharing among them, further enhancing the fault tolerance and operational economy of DCs. However, to maintain the cooperative alliance of MDCs, the greatest challenge to be addressed is the interest conflicts among different entities. Fortunately, the Nash bargaining game theory enables these self-interested entities to negotiate and reach mutually beneficial agreements. Meanwhile, it has been systematically proven in the literature [,] that the Nash bargaining game theory is a fair solution, which satisfies four axioms of Pareto optimality, symmetry theorem, irrelevance of linear transformations, and independence of irrelevant alternatives. Therefore, a cooperative game model based on Nash bargaining is adopted in this study to simulate the interactions and achieve a win–win situation among MDCs.
According to the standard mathematical form of the Nash bargaining game problem, the coalitional game model for the MDCs system in this paper can be expressed as follows:
F = max i Ω M D C C i , M D C 0 C i , M D C s . t . ( 8 ) ( 19 ) , ( 32 ) ( 45 ) C i , M D C C i , M D C 0 , i Ω M D C
where ΩMDC is the total number of subjects participating in the negotiation. Ci,MDC is the payoff of agent i in the NBS. C i , M D C 0 is the bargaining breakdown point, which is the payoff before participating in cooperative negotiation.
Obviously, model Equation (51) is a non-convex nonlinear optimization problem that solvers cannot directly solve. Therefore, referring to [], this paper converts Equation (51) into two independent convex optimization subproblems through certain equivalent transformations.
Subproblem P1: maximizing mutual benefits in the MDCs. For multiple stakeholders, solving the problem of maximizing mutual benefits is equivalent to minimizing costs. Briefly, the model for P1 can be described as follows:
F P 1 = min i Ω M D C C i , M D C s . t . ( 8 ) ( 19 ) , ( 32 ) ( 45 )
Subproblem P2: payoff allocation. By converting model (19) into logarithmic form, the complete model for P2 is then formulated as follows.
F P 2 = max i Ω M D C ln ( C i , M D C 0 C i , M D C ) s . t . ( 8 ) ( 19 ) , ( 32 ) ( 45 ) C i , M D C C i , M D C 0 , i Ω M D C

4.3.2. Solution of the Nash Bargaining Game Model Based on ADMM

Each MDC typically operates as an independent entity, and there are practical difficulties in sharing its personal information. Therefore, a distributed algorithm based on the ADMM to solve the sub-problem P1 is proposed in this section. For clarity, the sub-problem (51) is formulated in the following compact form.
F P 1 = min x , y f ( x , y ) s . t . ( 8 ) ( 19 ) , ( 32 ) ( 45 )
where x is the decision variable vector associated with MDC i, and x = {Ni(t), Pi,DC(t), Pi,WT(t), Pi,PV(t), Pi,MT(t), Pi,dis(t), Pi,ch(t), Pi,sell(t), Pi,buy(t)}. y is the coupling variable vector between MDC i and j, and y = {Pij(t)}. To achieve a distributed solution, an auxiliary variable is introduced as formulated in Equation (55).
y ^ = y ( λ )
where λ is the dual variable of the consensus constraint Equation (55), and problem (51) can be equivalently rewritten as
F P 1 = min x , y f ( x , y ) s . t . ( 8 ) ( 19 ) , ( 32 ) ( 45 ) y ^ = y
Further, the augmented Lagrangian function of the (56) is defined as follows.
L ( y , y ^ , μ ) = f ( x , y ) + ρ 2 y ^ y 2 2 + λ T ( y ^ y )
where ρ is the penalty parameter, which satisfies ρ > 0.
By leveraging the ADMM decomposition technique, Equation (56) can be decomposed into subproblems for MDC i.
L M D C ( y , y ^ , μ ) = C i , M D C + ρ 2 y ^ y 2 2 + λ T ( y ^ y )
Then, the overall update steps are given as follows, and iterate until convergence.
(1)
Upon receiving the latest updated λ(kt) and y(kt), MDC i updates ŷ(kt + 1) as Equation (59) and sends it to MDC y.
y ^ ( k t + 1 ) = arg min y ^ L M D C i ( y ( k t ) , y ^ , λ ( k t ) )
(2)
Upon receiving the latest updated ŷ(kt + 1), MDC j updates y(kt + 1) as Equation (60).
y ( k t + 1 ) = arg min y L M D C j ( y , y ^ ( k t + 1 ) , λ ( k t ) )
(3)
According to the latest updated ŷ(kt + 1) and y(kt + 1), update λ(kt + 1) as Equation (61).
λ ( k t + 1 ) = λ ( k t ) + ρ 1 y ^ ( k t + 1 ) y ( k t + 1 )
Specifically, the ADMM-based distributed solution algorithm for solving (51) is summarized in Algorithm 2. Due to the convexity properties of (56), the convergence of Algorithm 1 can always be guaranteed.
For the payoff allocation sub-problem 2 (e.g., problem (53)), its solution process is similar to that of problem (52). Due to space limitations, the content described above is not presented here, and the specific solution steps can be referred to in [,].
During the iterative solution process, the operation strategy obtained by each MDC operator will be sent to the DPN operator for power flow overload detection. Suppose an overload is detected in the power lines. In that case, the corresponding line capacity constraints will be added in the next round of optimization in accordance with the method described in Section 3, until all power lines meet the capacity limit requirements.
Algorithm 2: ADMM-Based Distributed Algorithm
Input: The set of pending tasks, data center equipment parameters, predicted output of renewable energy, dispatchable generator parameters, and time-of-use electricity price.
Output: The optimal Task Scheduling Scheme, The optimal Output Power of Dispatchable Devices, Output power of each MDC.
Initial Step: Set the maximum number of iterations, convergence accuracy, and penalty factor, with the iteration count kt = 0; initialize the Lagrange multipliers.
Repeat: At kt-th iteration.
Step 1: For MDC i, given ρ1, y(kt), λ(kt).
solve problem (56), and obtain ŷ(kt + 1)
Step 2: For MDC j, given ρ, ŷ(kt + 1), λ(kt),
solve problem (56), and obtain y(kt + 1).
Step 3: Update the dual variables using Equation (61).
Until: The iterative convergence condition is satisfied, i.e., y ^ ( k t + 1 ) y ( k t + 1 ) ε or k = kmax.

5. Results

In this section, we present a numerical test to examine the performance of the integrated computational task allocation and cooperative operation of local MDCs, as well as the solution framework based on ADMM and greedy algorithm.

5.1. Test System

Figure 5 shows the topology of the test system, in which three MDCs are assumed to be deployed at nodes 16, 22, and 33, respectively, with each MDC equipped with PV/WT, MT, and ESS. Note that the three DCs in this test system are, respectively, from different DC companies and are responsible for processing computing tasks from front-end servers and local users.
Figure 5. Topology of the test system.
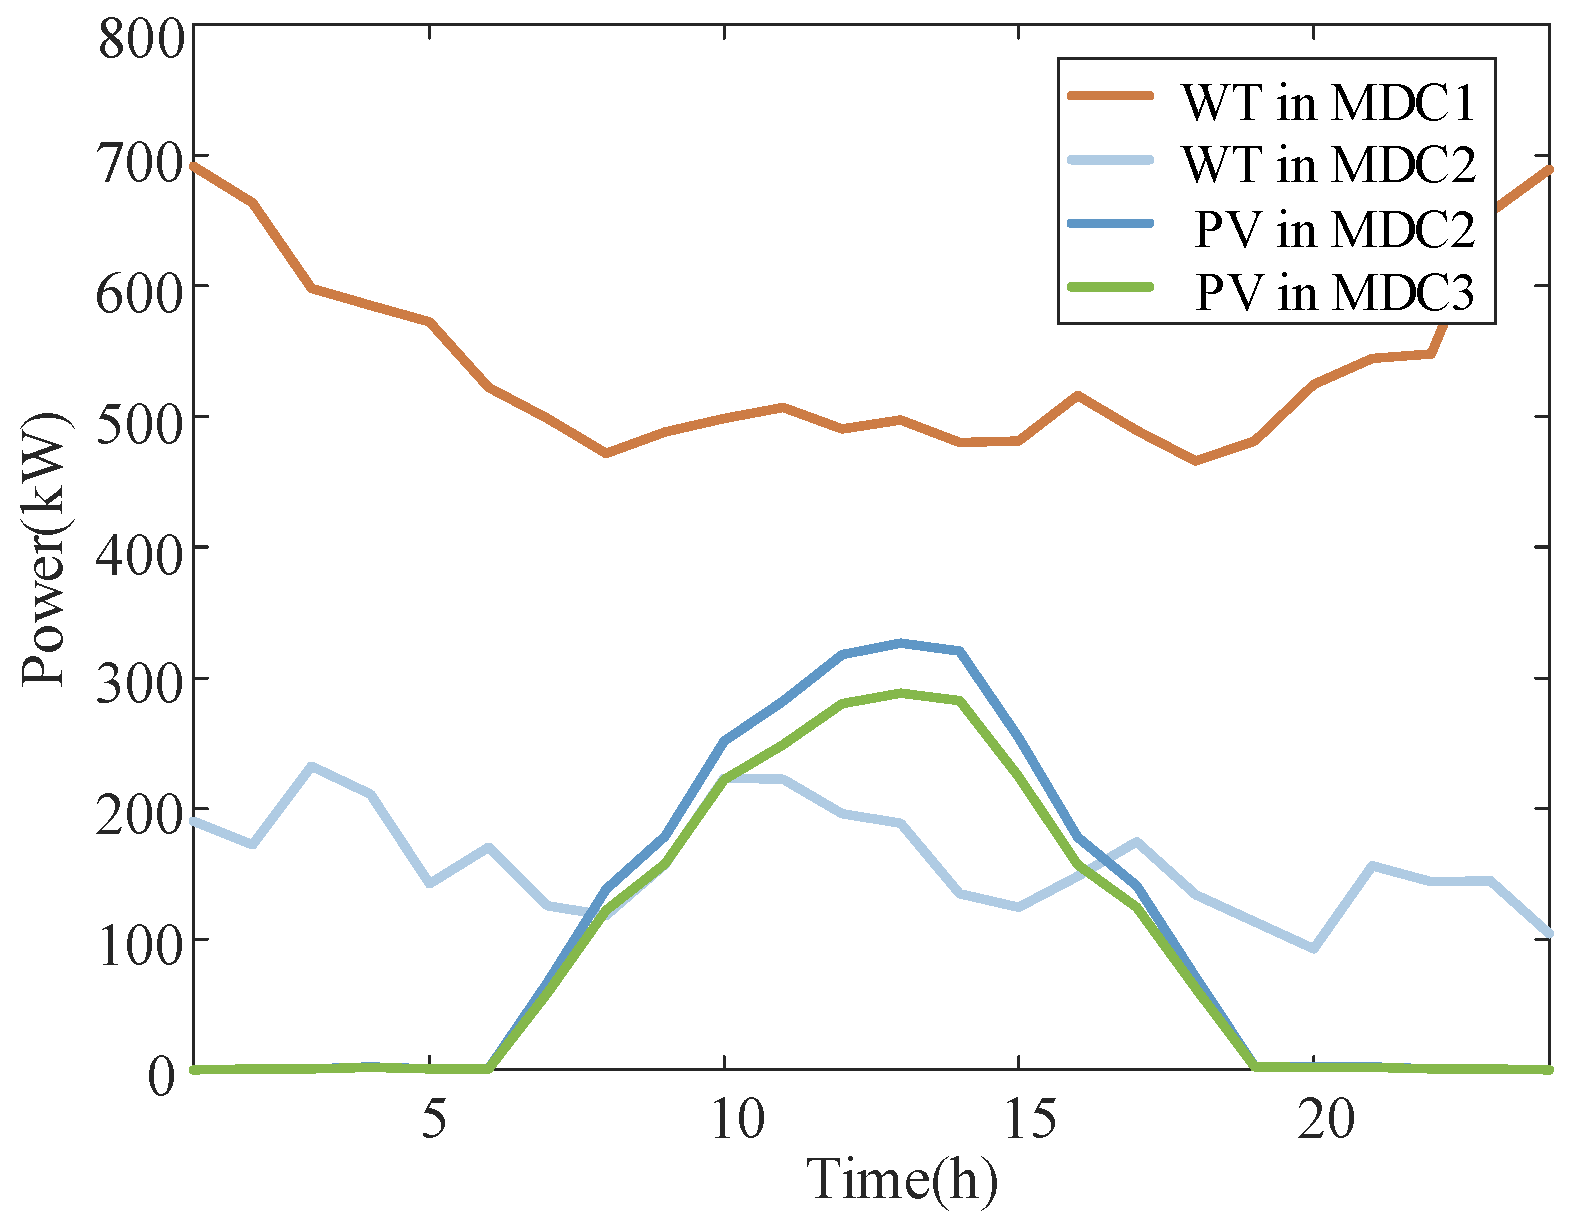
Figure 6 shows the output power of RES in MDCs, and Table 2 shows the Time-of-Use electricity pricing of MDC i. The computing tasks from front-end servers and local sources are taken from [,], respectively. The parameter settings of the data centers refer to [,], while those of other microgrid equipment and algorithm parameters refer to []. The numbers of servers in MDC1, MDC2, and MDC3 are 6000, 4000, and 3000, respectively. The values of ρ, ε and ωi,dt are set to 10 × e−2, 10 × e−3 and 0.05.
Figure 6. The output power of RES in MDCs.
Table 2. Time-of-Use electricity pricing of MDC i.

5.2. Case Introduction

Four case studies are implemented in this paper to test the proposed model and solution framework.
CASE 1: MDCs do not participate in the cooperative alliance.
CASE 2: MDCs participate in the cooperative alliance on the computing power side, but not on the power side.
CASE 3: MDCs participate in the cooperative alliance on the power side, but not on the computing power side.
CASE 4: MDCs form a cooperative alliance on both the power and computing power sides.
When MDCs do not participate in the cooperative alliance on the computing power side, computational tasks are pre-allocated to each MDC in proportion to their server counts. When MDCs are not part of the cooperative alliance on the power side, they can only engage in electricity transactions with the up-level grid. CASE 4, the method proposed in this paper, takes into account the operational status of each MDC during task allocation. Under this scenario, MDCs can share electricity and distribute profits based on their respective contributions. In other words, it entails participation in the cooperative alliance on both the computing power and power sides.

5.3. Comparative Analysis of Optimization Results

The operational costs of the three MDCs under different cases are shown in Table 3. The following conclusions can be drawn from the obtained results.
Table 3. Cost of MDCs CASE 1–4 (UINT: k$).
Refraining from participating in cooperative alliances on both the computing power side and the power side (CASE 1) is the most expensive choice for MDC operators compared with other cases. Specifically, in CASE 1, MDC operators are required to handle tasks originating from local regions independently and have to purchase electricity from the main grid to offset their internal power deficit. This results in the highest operating cost, reaching $98.012 k. Conversely, upon participating in cooperative alliances, the total operating costs of MDC operators are reduced by $2382–$9234 (2.43–9.43%) compared to CASE 1. This seems rational, since integrating computing task allocation and energy sharing can improve the utilization rate of renewable energy within MDCs and reduce reliance on traditional energy sources.
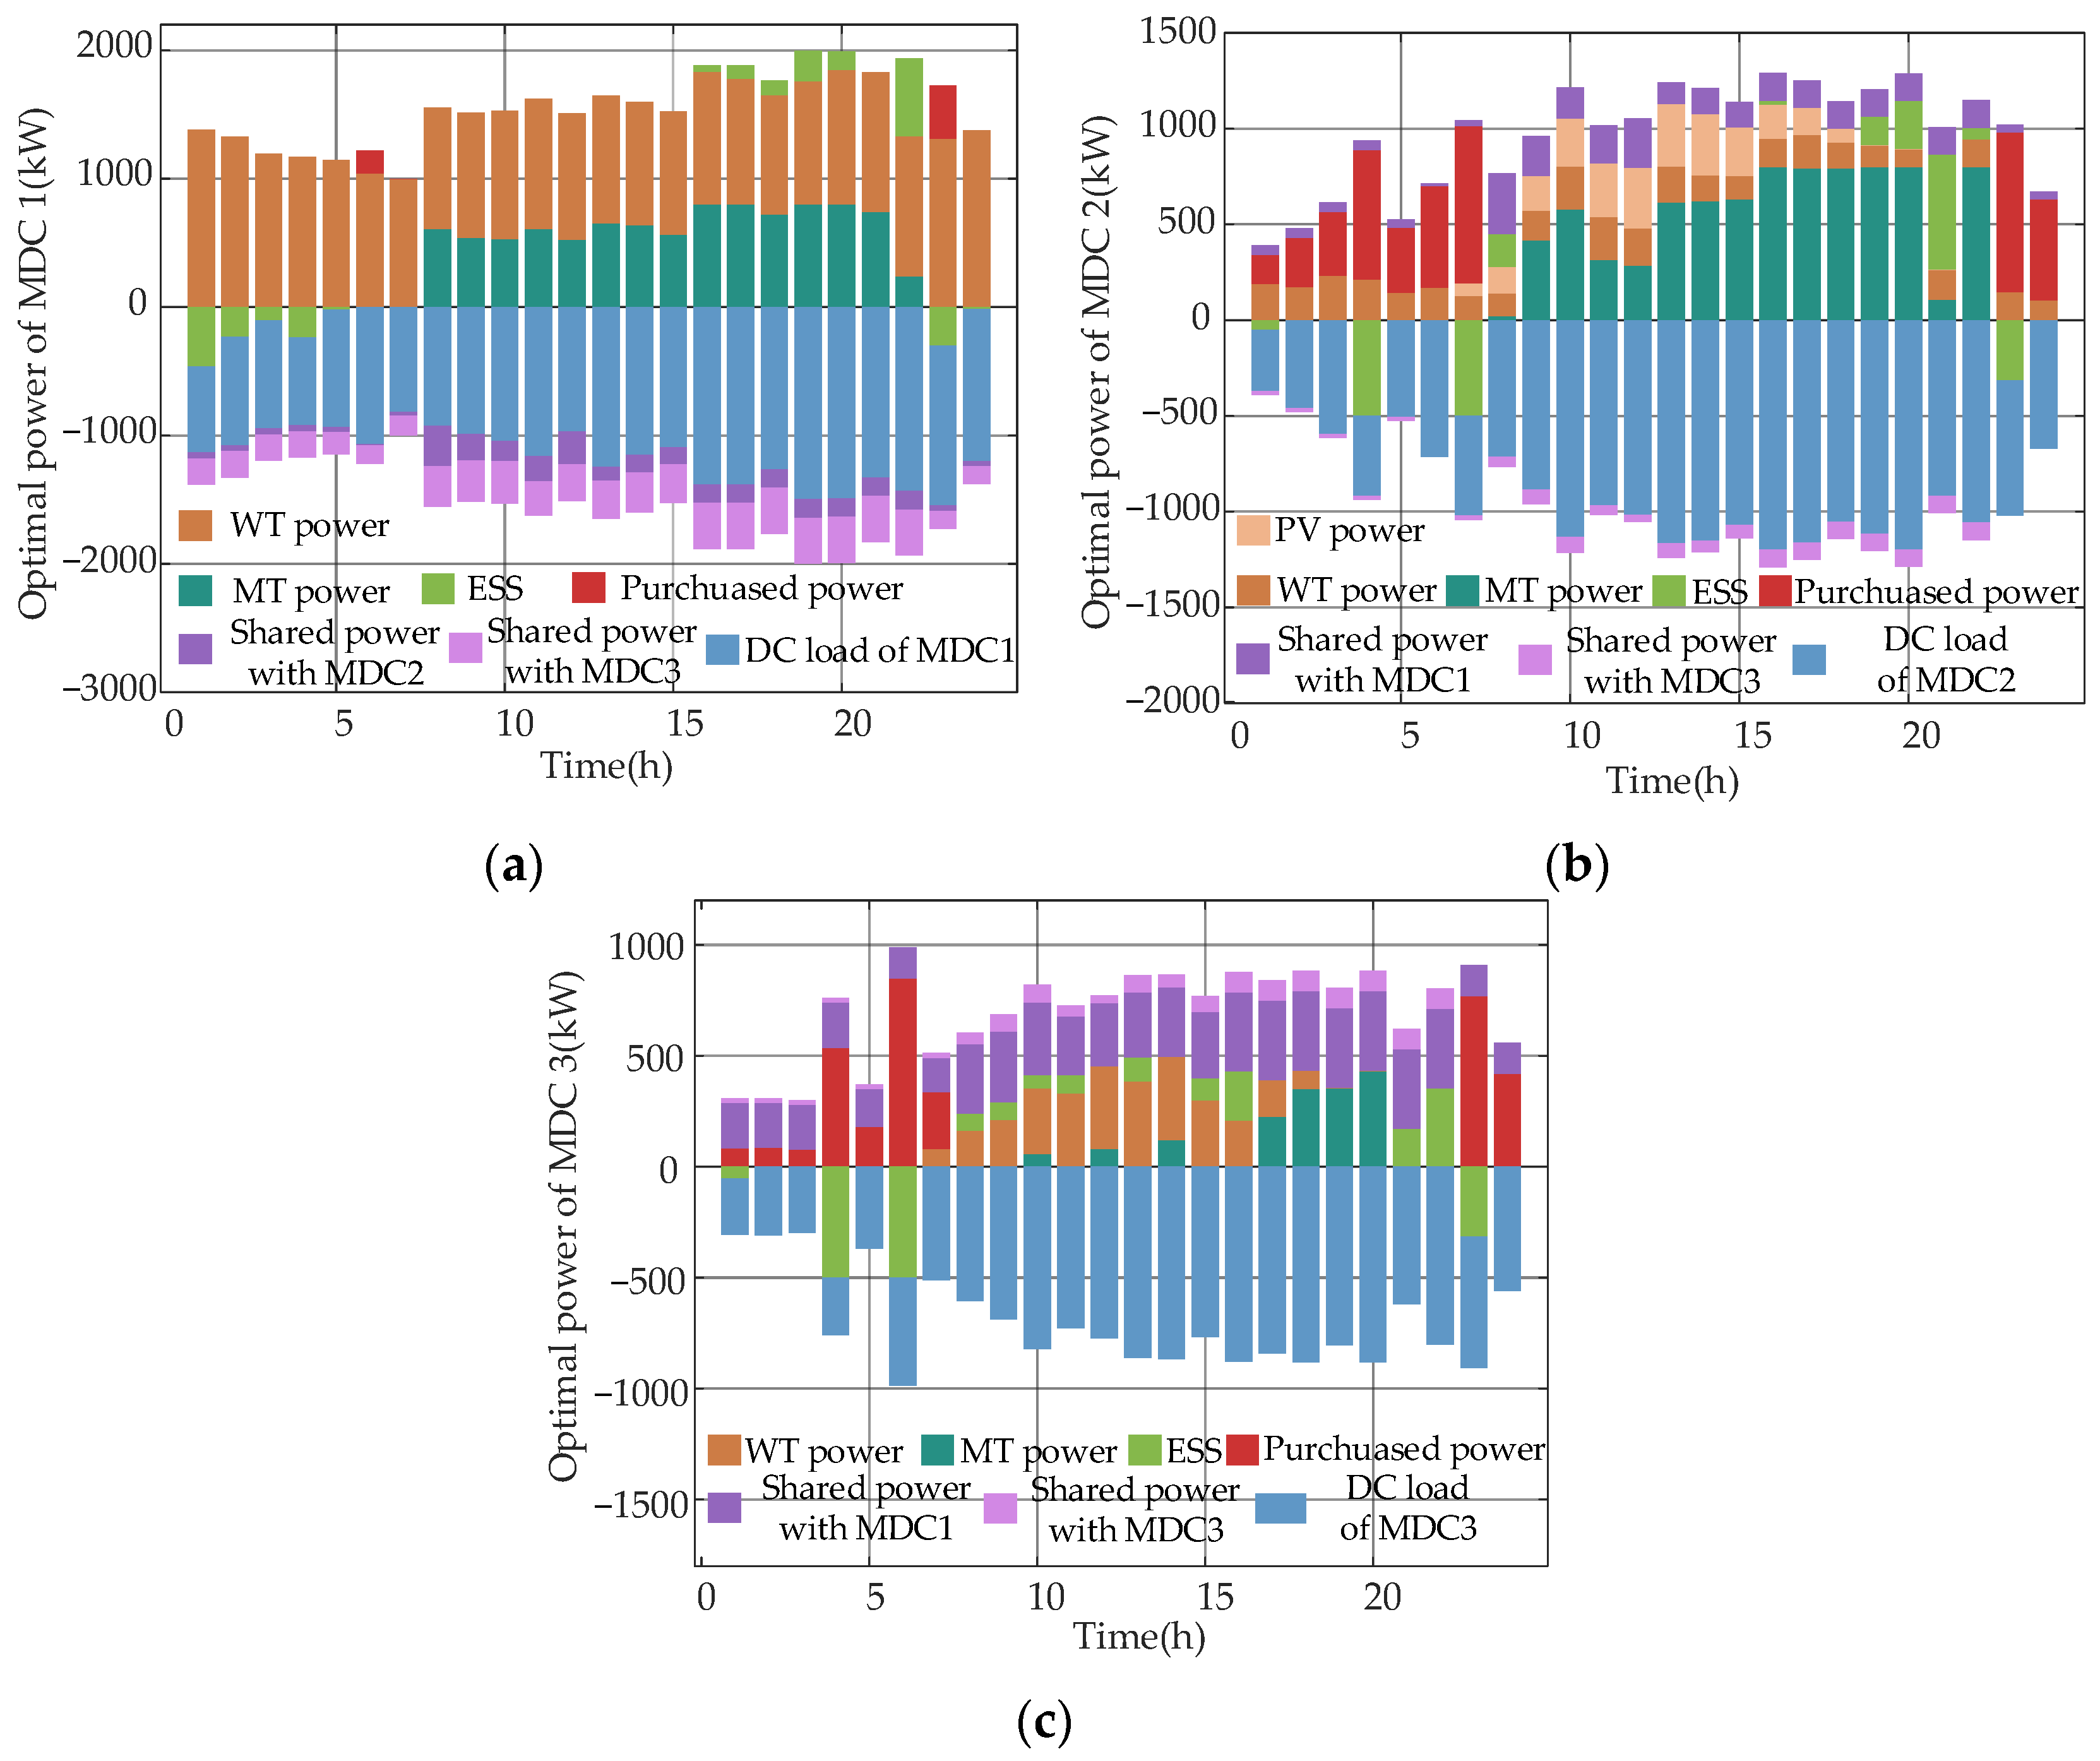
Additionally, the optimal operation strategies of MDCs are compared to illustrate the impact of computing task scheduling and energy sharing mechanisms on system optimization results. Figure 7 presents the daily operational data of MDCs based on CASE 4. Note that for power supply equipment (including electricity purchased from the up-level grid, PV, WT, and MT), a positive optimized power value indicates that the equipment is supplying electricity to the MG; for energy storage devices, a positive optimized power value signifies discharge to the MDC and vice versa for charging state; for workload and energy sharing among MDCs, a positive value indicates outward migration of loads and vice versa for inward migration of loads. Based on the above agreements, we can observe from Figure 7 that the source–load matching relationship is closely related to the matching relationship between workloads and renewable energy output. When renewable energy output is sufficient, the power surplus is primarily balanced through an energy storage system and energy supply to other MDCs. Conversely, when renewable energy output is less than the workload, the resulting power gap is mainly offset by the up-level grid, MT, and energy received from other MDCs. Specifically, the collaborative operation method proposed in this study plays a critical role in addressing mismatch issues among MDCs. The first is the task allocation and scheduling mechanism through spatiotemporal optimization; here, workloads are transferred to regions and time periods with high renewable energy output, thus alleviating the mismatch between workloads and renewable energy output. The second is energy sharing among MDCs, which can reduce reliance on the up-level grid and further achieve large-scale balanced regulation of the mismatch. In conclusion, the collaborative engagement of the computing power side and the power side in the MDCs’ cooperative alliance plays an important role in achieving source–load matching.
Figure 7. The operation results in CASE 4. (a) Operation result of MDC1; (b) operation result of MDC2; (c) operation result of MDC3.

5.4. Benefits for Integrating Task Allocation and Scheduling in the Cooperative Operation Model of MDCs System

The Proportions of Computing Tasks Allocated to Different MDCs: Different MDC architectures (e.g., renewable energy and server configurations) and operational models (cooperative and independent) have an impact on the allocation and scheduling of computing tasks. Figure 8 illustrates the allocation and scheduling of computing tasks for MDC1–3 under Case 3–4.
Figure 8. Allocation and dispatch of deferrable tasks for MDC in (a) CASE3 and (b) CASE 4.
The proportions of computing tasks allocated to different MDCs vary. In Case 3, the MDCs do not participate in the cooperative alliance on the computing power side, and the number of servers dominates the allocation of computing tasks. Specifically, MDC1–3 undertake 41.67%, 33.33%, and 25.00% of the computing tasks, respectively. In CASE 4, the architectures of different MDCs are comprehensively considered in the allocation of computing tasks. Among them, benefiting from the higher renewable energy output of MDC1, the proportion of deferrable tasks allocated to this region has increased to 58.99%. Meanwhile, the proportions of computing tasks undertaken by MDC1 and MDC2 have decreased to 27.74% and 13.27%, respectively.
Specifically, some deferrable tasks are postponed for processing to avoid purchasing electricity from the up-level grid during periods of high time-of-use electricity prices (e.g., 0:00–1:00, 6:00–10:00, and 16:00–20:00 in Figure 8b).
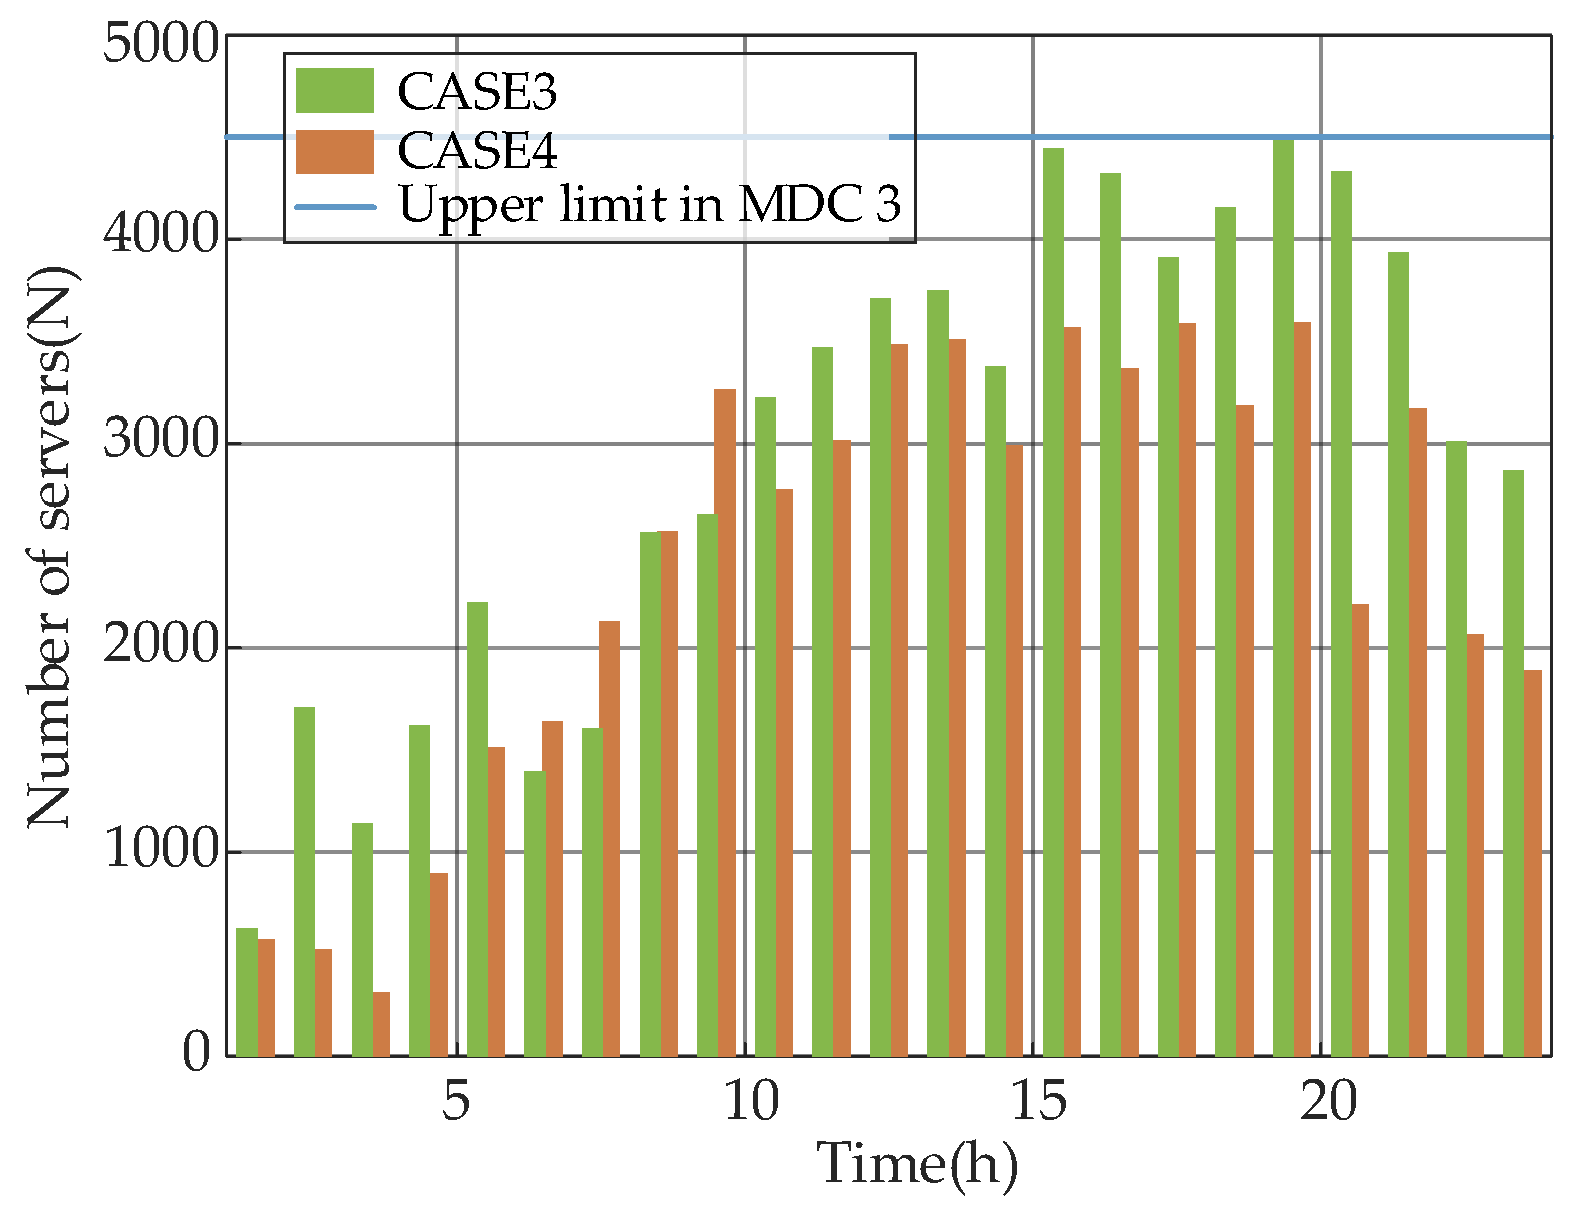
Number of Activated Devices in Each Time Period: When MDCs participate in a cooperative alliance on the computing power side, servers across different data centers can serve as mutual backups, thereby reducing the risk of server overload. Figure 9 illustrates the number of devices activated at each moment for MDC3 under CASE 3 and CASE 4.
Figure 9. Comparison of the number of active servers in MDC3 between CASE 3 and CASE 4.
In CASE 3, where computing tasks are pre-allocated to MDC3 based on the proportion of servers and MDC3 does not participate in the MDCs’ cooperative alliance, servers face the risk of exceeding the load threshold during task processing (e.g., 15:00–16:00 and 19:00–20:00). In contrast, under CASE 4, where servers across multiple data centers function as mutual backups—the risk of servers exceeding the load threshold is noticeably mitigated, as clearly observed from the orange bars in Figure 9.
Amount of Purchased Electricity with the Upper-level Power Grid and Associated Cost: Further, the impact of the task allocation and scheduling mechanism on the electricity bills of the MDCs system is examined. Based on the results presented in Table 4, the following conclusion can be drawn: Integrating the task allocation and scheduling mechanism into the cooperative operation model of MDCs (CASE 4) leads to a significant reduction in electricity bills from the up-level grid. This reduction is achieved by selecting the most suitable MDC and time period for task processing, according to the task-handling capacity of each MDC. For example, in CASE 4, the most significant number of tasks is processed by MDC 1 during the time period 5–6. This period is chosen due to its low electricity prices and high renewable energy generation. In contrast, a relatively low task volume is assigned to MDC 2 and MDC 3. As a result, the surplus renewable energy available at these MDCs can be shared with MDC 1, further reducing its electricity bills.
Table 4. Amount of purchased electricity with the upper-level power grid and associated cost.
The Backup Capacity of Servers Among MDCs: To verify the effectiveness of the proposed cooperative game model and solution framework, we further examined the operational performance of data centers under extreme working conditions. The following calculation example is set:
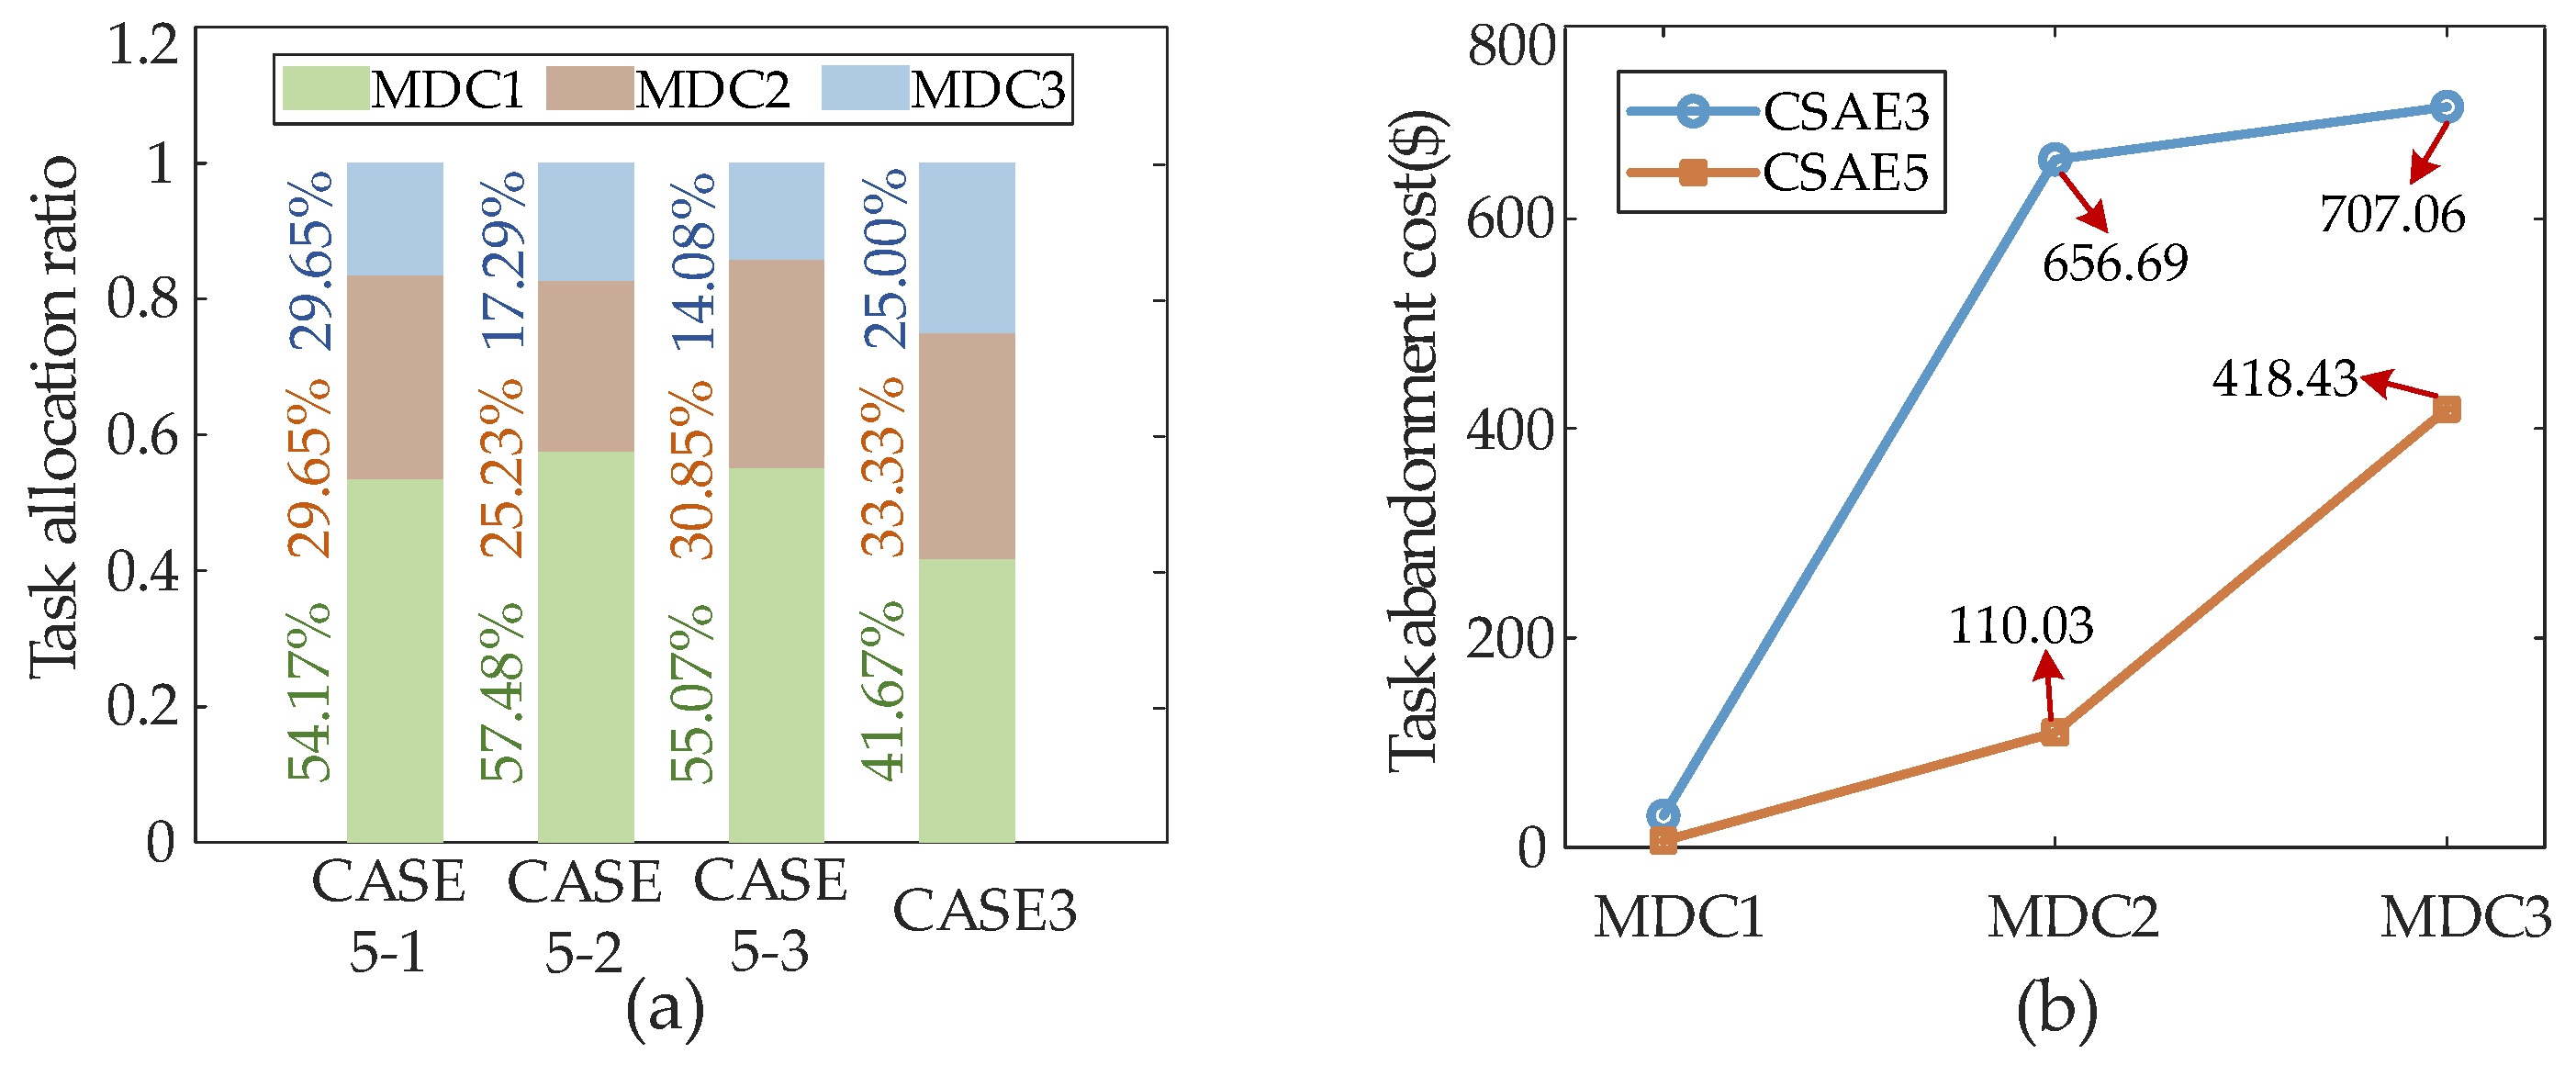
CASE 5: It is assumed that a failure occurs in the internal data center servers of the MDC, or that they experience a network attack during operation. The operational performance of each data center is assessed under the condition of a 30% reduction in the number of servers.
For Figure 10a, the bars on the horizontal axis represent the proportion of tasks allocated to each MDC in CASE 3 and CASE 5. This is under the condition that the number of servers in each MDC is reduced by 30%, respectively. In CASE 3, the task allocation mechanism is not integrated into the cooperative operation model of the MDC system. Task allocation is based on the proportion of servers in each MDC. As a result, MDC 2 and MDC 3, with fewer servers, face the risk of exceeding the threshold. The compensation costs arising from task abandonment are borne by MDC 2 and MDC 3, as shown in Figure 10b.
Figure 10. Variations in computing task allocation (a) and the total task discarding compensation cost (b) under the extreme scenario where each MDC reduces its servers by 30%, respectively.
In CASE 5, the allocation mechanism is integrated into the cooperative operation model of the MDCs system, allowing for the task-carrying capacity of each MDC to be considered. This enables adjustments in task allocation, utilizes the complementary backup potential among servers across MDCs, reduces the number of abandoned tasks, and improves the reliability of the MDC’s system in task processing. Specifically, the proportion of tasks handled by MDCs with a reduced number of servers becomes smaller, with the remaining tasks allocated to the other MDCs. For example, in the CASE 5-1 bar of Figure 10a, compared to the task allocation during regular operation (as shown in Figure 8b), MDC 1 sees a 4.28% decrease, while MDC 2 and MDC 3 experience increases of 1.91% and 2.37%, respectively. Meanwhile, compared to CASE 3, the compensation cost for abandoned tasks in CASE 5 decreases significantly, with MDC 2 and MDC 3 experiencing reductions of 83.25% and 40.82%, respectively, as shown in Figure 10b.
Consideration of Network Constraints: As described in Section 3, an optimized verification mechanism is adopted to ensure that the obtained optimization results satisfy the operational constraints of the DPN. Taking the 7:00–8:00 time period as an example, Figure 11 presents the corresponding power flow calculation results. It can be observed that the power flow of each transmission line remains within the capacity limits. This confirms that, when network constraints are incorporated, the operational simulation results produced by MDC i are feasible.
Figure 11. Mainly power distribution at time slot 7:00–8:00.

5.5. Sensitivity Analysis of the Impact of Renewable Energy Intermittency

Two typical low-penetration scenarios are set up to analyze the system performance when the output of renewable energy is low:
CASE 6-1: The output of PV and WT in MDC 2 is 30% of their normal values, respectively.
CASE 6-2: The PV power in MDC 3 is out of operation.
We analyzed the impact of low renewable energy penetration on the operation results of the MDCs system from both the computing power and electric power sides.
(1)
The impact of low renewable energy penetration on task allocation in the computing side.
It can be seen from Table 5 that when the output of renewable energy decreases, the proportion of tasks allocated to the corresponding MDC also decreases. This is because the output of renewable energy in each MDC is taken into account by the task allocation model in this paper.
Table 5. The proportion of tasks allocated to each MDC in CASE 6-1 and CASE 6-2.
(2)
The impact of low renewable energy penetration on the optimal operation results of MDCs on the power side.
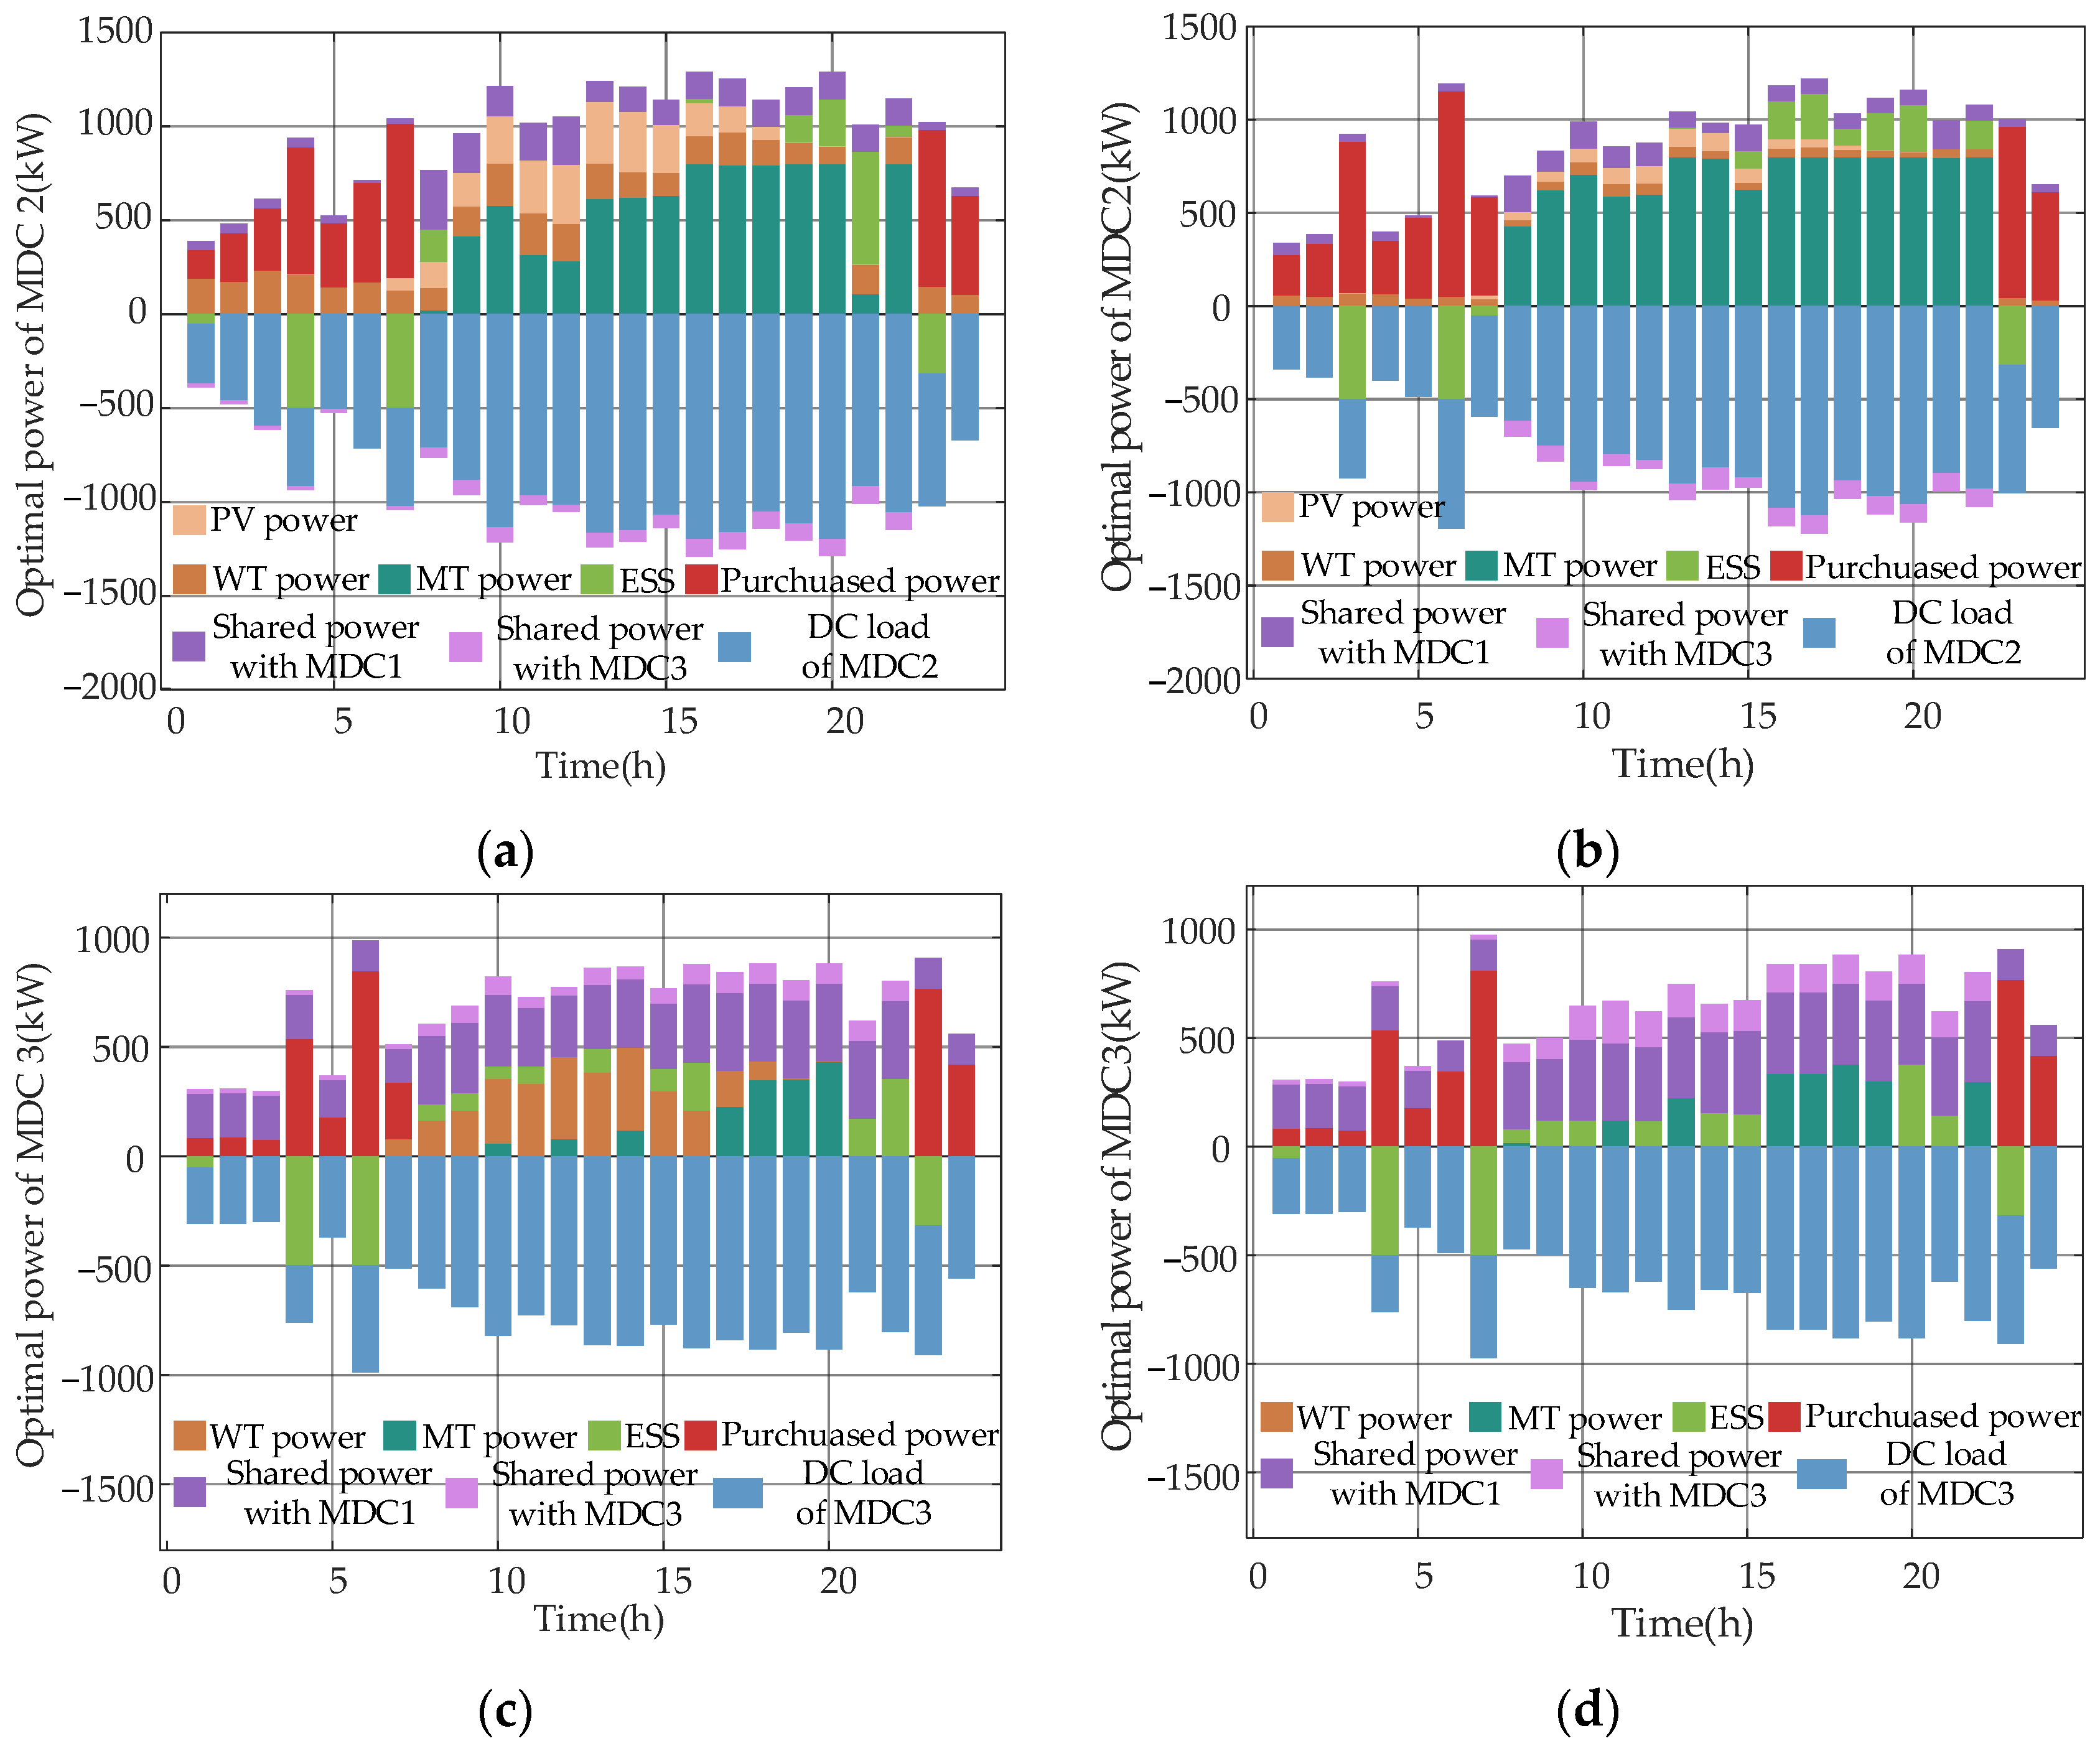
It can be concluded from Table 6 that the lower the penetration rate of renewable energy, the higher the total operating cost of the MDC system. Specifically, the deficit in reduced renewable energy output is compensated by other power sources (e.g., the MT in Figure 12b and the energy sharing among other MDCs in Figure 12d). This undoubtedly increases the operating cost of each MDC, leading to a rise in the total operating cost. Note that when the power deficit in MDC 3 is relatively large, other MDCs can actively make up for this deficit through energy sharing. This also verifies from a side perspective that the proposed cooperative operation method can improve the fault tolerance of the MDC system.
Table 6. Cost of MDCs in CASE 4, CASE 6-1 and CASE 6-2 (UINT: k$).
Figure 12. The operation results of the MDCs system. (a) MDC 2 in CASE 4; (b) MDC 2 in CASE 6-1; (c) MDC 3 in CASE 4; (d) MDC 3 in CASE 6-2.

5.6. Scalability Analysis

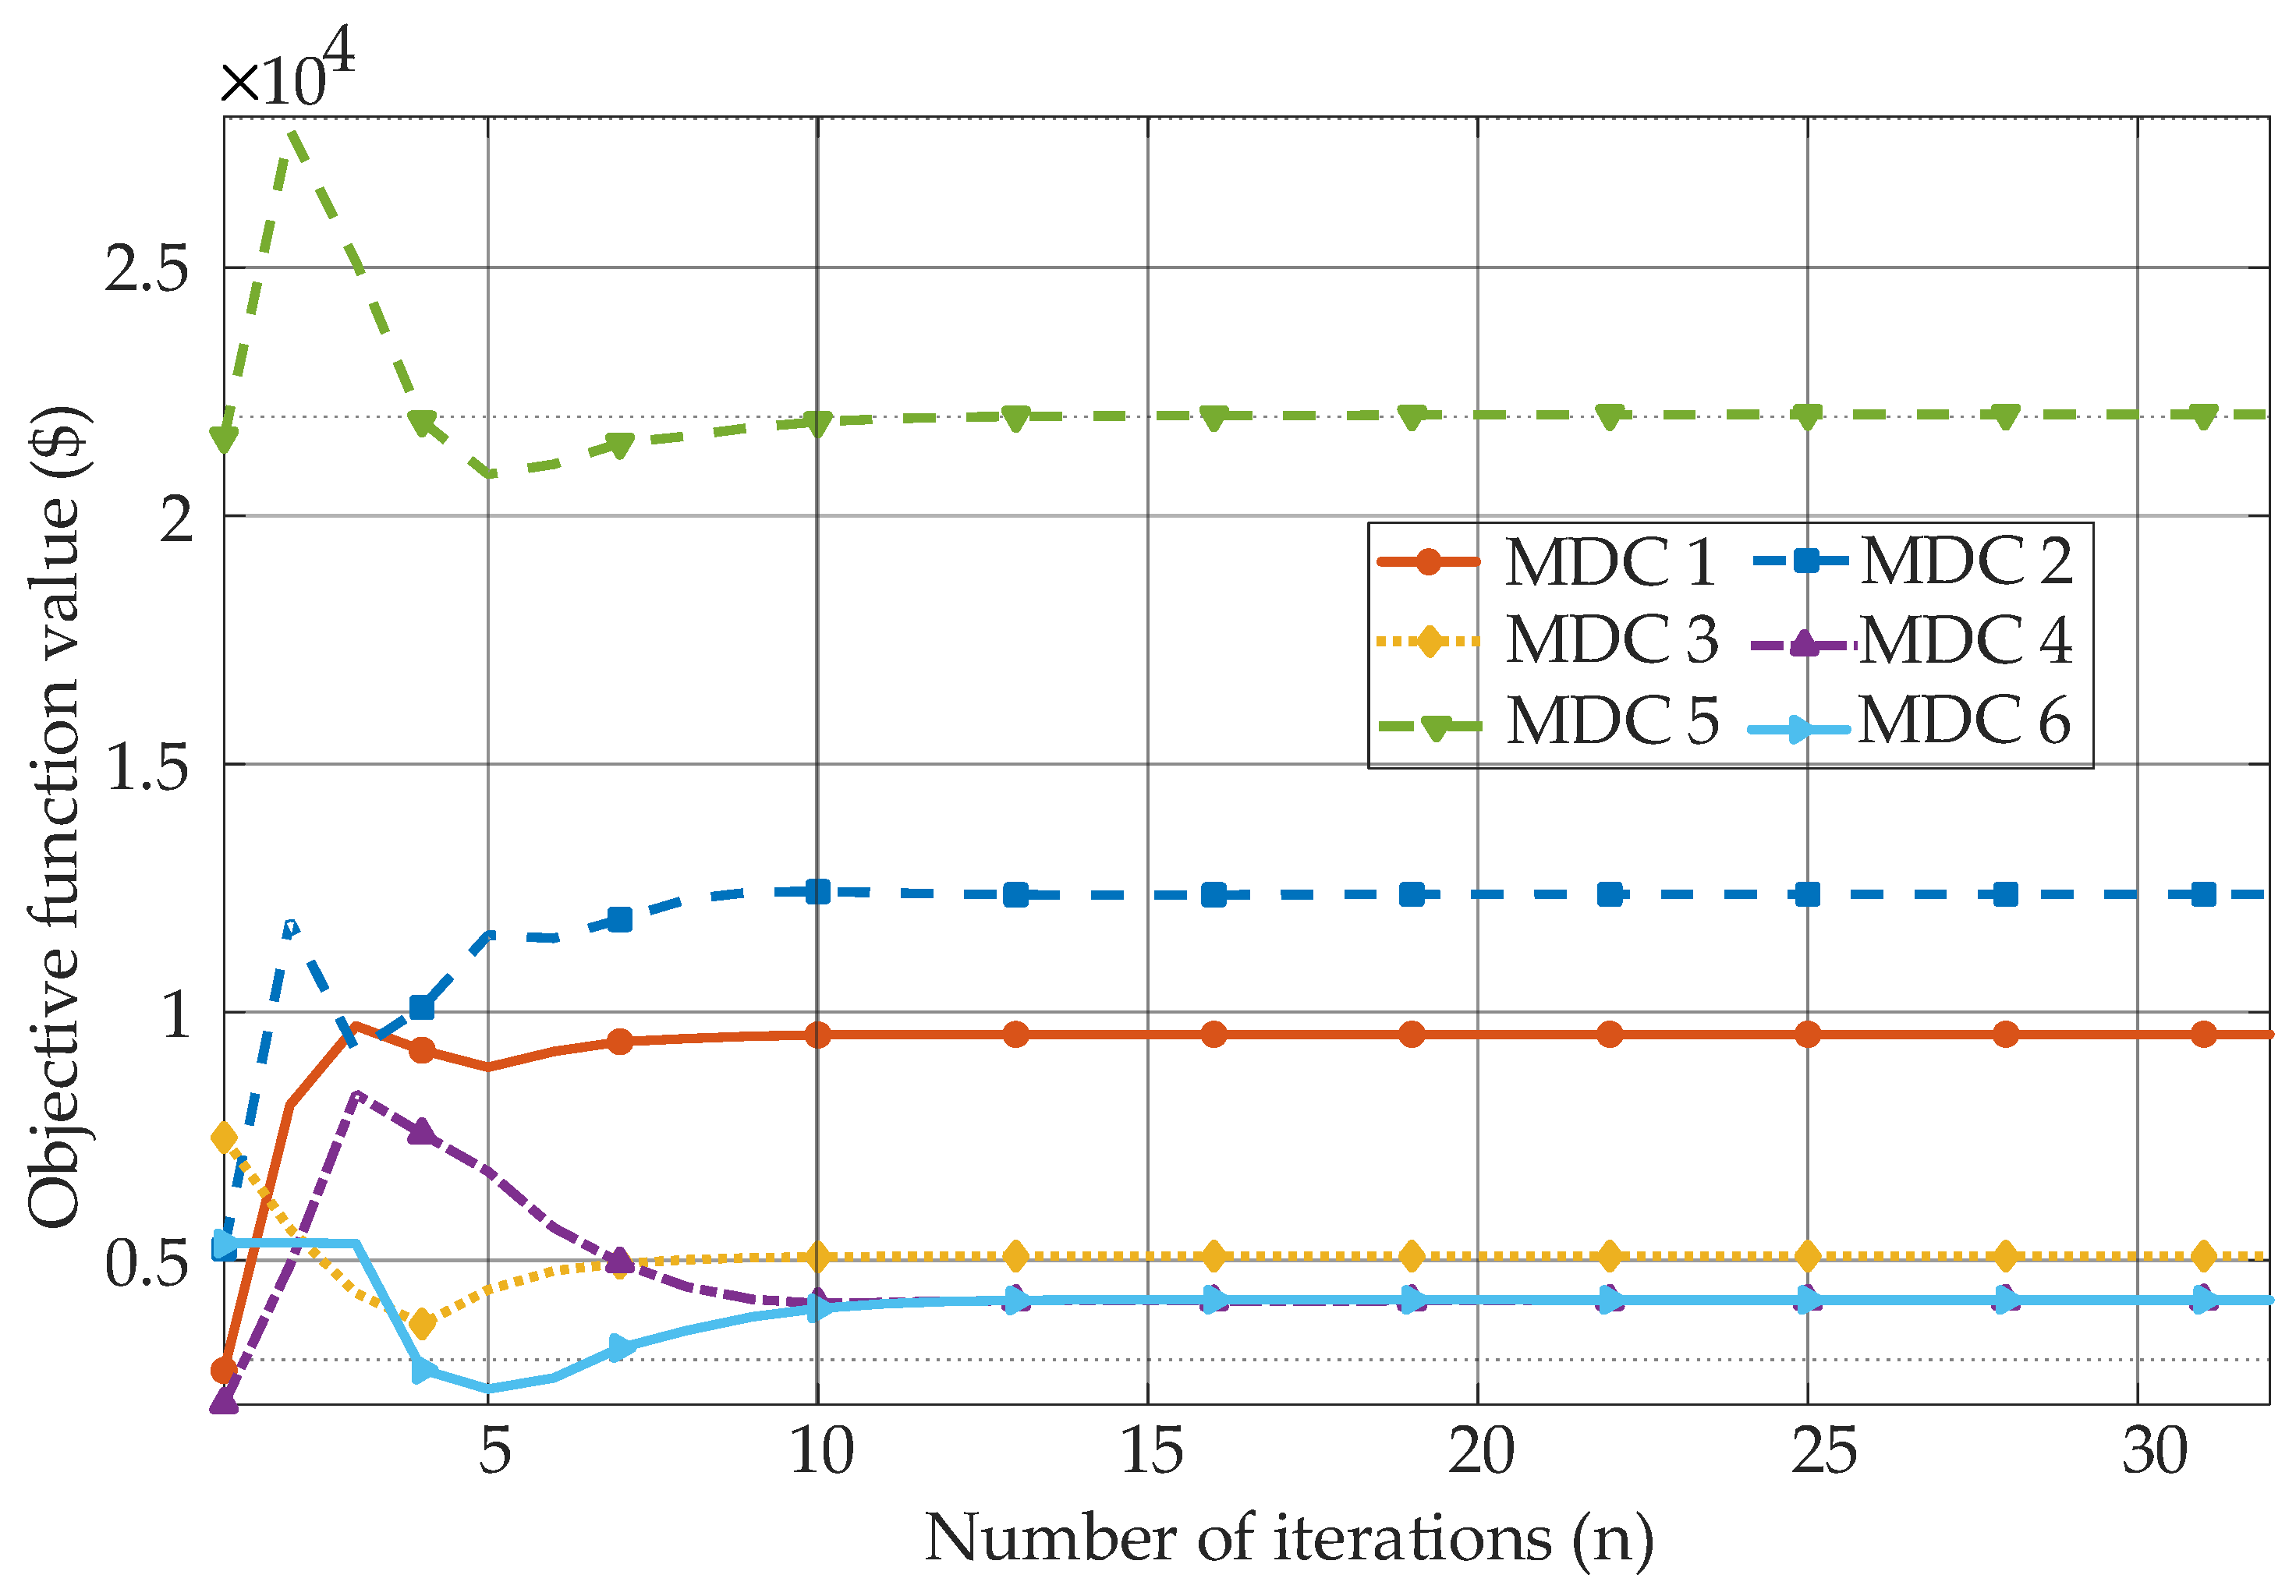
To verify the scalability of the algorithm, we expanded the 3 MDCs in the original case to 6, constructing a larger-scale MDC system for simulation testing. We recorded the computation time, number of iterations, and convergence status of each MDC under the 6-MDC scenario, with details shown in Table 7 and Figure 13:
Table 7. The computational performance of the proposed algorithm.
Figure 13. Convergence status of the MDCs system.

6. Conclusions

In this paper, a novel cooperative game-theoretic approach is proposed for the MDCs system, which integrates task allocation and scheduling mechanisms. This approach aims to obtain the optimal task processing scheme and the optimal operation strategy for each MDC. Through comprehensive case studies, we can draw the following conclusions:
(1)
The proposed task allocation and scheduling mechanism enables load balancing of MDCs across both spatial and temporal dimensions, with the overall cost of task processing effectively reduced. Meanwhile, the backup capacity of servers among MDCs is leveraged, which enhances the stability of the system and addresses the asymmetric operational risks among MDCs.
(2)
Compared with other cases, significant economic benefits are achieved by the Nash game-theoretic model for the MDCs system, which integrates task allocation, scheduling, and energy sharing. Specifically, operating costs are reduced by up to 9.48%. Additionally, the optimal task processing strategy is generated, and the demand for electricity from the up-level grid is lowered.
Note that in this study, we assume that all MDC operators act as fully rational decision-makers, whereas in practice, bounded rationality often prevails, and the corresponding decision-making mechanisms merit further investigation. Moreover, the current model does not account for uncertainties such as the stochastic nature of computing tasks and renewable energy generation. Future research will focus on developing robust optimization methods that incorporate these uncertainties, as well as exploring distributed decision-making mechanisms under bounded rationality, to improve the practicality and robustness of the proposed framework.

Author Contributions

Conceptualization, X.Z. and T.L.; methodology, X.Z. and T.L.; software, X.Z. and S.T.; validation, X.Z.; formal analysis, Y.J. and H.J.; investigation, X.Z. and Y.J.; resources, Q.X., Y.M. and H.J.; data curation, X.Z. and S.T.; writing—original draft preparation, X.Z.; writing—review and editing, T.L. and Y.J.; visualization, X.Z.; supervision, T.L. and Q.X.; project administration, Y.M. and H.J.; funding acquisition, Q.X., Y.J. and H.J. All authors have read and agreed to the published version of the manuscript.

Funding

This work was supported by the National Key R&D Program of China (2023YFB2407300); This work was supported by the National Natural Science Foundation of China (No. 52477117, 52407135, U24B6008); Tianjin Natural Science Foundation Diversified Investment Key Program (No. 22JCZDJC00710).

Data Availability Statement

The original contributions presented in this study are included in the article. Further inquiries can be directed to the corresponding authors.

Conflicts of Interest

The authors declare no conflicts of interest.

Nomenclature

The following nomenclature are used in this manuscript:
Abbreviation
DCdata center
DPNdistribution power networks
MDCmicrogrid-integrated data centers
ITInformation Technology
ADMMalternating direction method of multipliers
NBSNash bargaining solution
ESSenergy storage system
MTmicro gas turbine
Indexes and Sets
iMDC index
tTime index
kTasks index
lLine index
ndistribution power network nodes index
MDCSet of MDCs
NSet of distribution power network nodes index
LSet of lines
Parameters
Ci,MDCThe objective of MDC i
C i O M (t), C i o p e (t)The maintenance cost and operational cost on the power side of MDC i at time slot t, respectively
μdel, μsusThe compensation cost coefficients for tasks being processed with delay and being suspended, respectively
μi,buy, μi,sellthe time-of-use electricity prices for purchasing and selling, respectively
αi,MT, βi,MTThe cost coefficients of the MT
Pi,WT,max, Pi,WT,max, Pi,MT,maxThe upper limits of the output power of the PV, WT, and MT in MDC i, respectively
Pi,dis,max, Pi,ch,maxThe upper limits of the charging and discharging power, respectively
ηi,ch, ηi,disThe charge and discharge efficiency
Ei,ess,max, Ei,ess,minThe upper and lower limits of energy stored
Pij,min, Pij,maxThe upper and lower limits of energy sharing between MDC i and j
Variables
Ni(t)distribution power networks
Pi,ser(t)The power consumption of the server in MDC i at time t
Pi,DC(t)The power consumption of the data center in MDC i at time t
Pi,WT(t), Pi,PV(t), Pi,MT(t)The output power of the PV, WT, and MT in the MDC i at time slot t, respectively
Pi,ch(t), Pi,dis(t)The charging and discharging powers of the ESS in MDC i at time slot t
Pij(t)The shared power between MDC i and MDC j at time slot t
Pi,sell(t), Pi,buy(t)The electricity purchased from and sold to the distribution power network operator by the MDC i at time slot t

References

  1. Xiao, Q.; Li, T.X.; Jia, H.J.; Mu, Y.F.; Jin, Y.; Qiao, J.; Blaabjerg, F.; Guerrero, J.M.; Pu, T. Electrical circuit analogy-based maximum latency calculation method of internet data centers in power-communication network. IEEE Trans. Smart Grid 2025, 16, 449–452. [Google Scholar] [CrossRef]
  2. Sun, Y.M.; Ding, Z.H.; Yan, Y.J.; Wang, Z.Y.; Dehghanian, P.; Lee, W. Privacy-preserving energy sharing among cloud service providers via collaborative job scheduling. IEEE Trans. Smart Grid 2025, 16, 1168–1180. [Google Scholar] [CrossRef]
  3. Xiao, Q.; Yu, H.L.; Jin, Y.; Jia, H.J.; Mu, Y.F.; Zhu, J.B.; Liu, H.Q.; Teodorescu, R.; Blaabjerg, F. Adaptive virtual inertia emulation and control scheme of cascaded multilevel converters to maximize its frequency support ability. IEEE Trans. Ind. Electron. 2025. early access. [Google Scholar]
  4. Wang, P.; Cao, Y.J.; Ding, Z.H.; Tang, H.; Wang, X.Y.; Cheng, M. Stochastic programming for cost optimization in geographically distributed internet data centers. CSEE J. Power Energy Syst. 2022, 8, 1215–1232. [Google Scholar]
  5. Yu, L.; Jiang, T.; Zou, Y.L. Distributed real-time energy management in data center microgrids. IEEE Trans. Smart Grid 2018, 9, 3748–3762. [Google Scholar] [CrossRef]
  6. Zhou, S.B.; Zhou, M.; Wu, Z.Y.; Wang, Y.Y.; Li, G.Y. Energy-aware coordinated operation strategy of geographically distributed data centers. Int. J. Electr. Power Energy Syst. 2024, 159, 110032. [Google Scholar] [CrossRef]
  7. Chen, M.; Gao, C.W.; Song, M.; Chen, S.S.; Li, D.Z.; Liu, Q. Internet data centers participating in demand response: A comprehensive review. Renew. Sustain. Energy Rev. 2020, 117, 109466. [Google Scholar] [CrossRef]
  8. Wan, J.X.; Duan, Y.D.; Gui, X.; Liu, C.Y.; Li, L.X.; Ma, Z.Q. Safecool: Safe and energy-efficient cooling management in data centers with model-based reinforcement learning. IEEE Trans. Emerg. Top. Comput. Intell. 2023, 7, 1621–1635. [Google Scholar] [CrossRef]
  9. Jin, C.Q.; Bai, X.L.; Yang, C.; Mao, W.X.; Xu, X. A review of power consumption models of servers in data centers. Appl. Energy 2020, 265, 114806. [Google Scholar] [CrossRef]
  10. Hu, Y.Y.; Yang, J.; Ruan, X.L.; Chen, Y.L.; Li, C.J.; Zhang, Z.H.; Zhang, W. Green optimization for micro data centers: Task scheduling for a combined energy consumption strategy. Appl. Energy 2025, 393, 126031. [Google Scholar] [CrossRef]
  11. Yin, X.H.; Ye, C.J.; Ding, Y.; Song, Y.H. Exploiting internet data centers as energy prosumers in integrated electricity-heat system. IEEE Trans. Smart Grid 2023, 14, 167–182. [Google Scholar] [CrossRef]
  12. Yin, X.H.; Ye, C.J.; Ding, Y.; Song, Y.H.; Wang, L. Combined heat and power dispatch against cold waves utilizing responsive internet data centers. IEEE Trans. Sustain. Energy 2024, 15, 819–834. [Google Scholar] [CrossRef]
  13. Cao, Y.J.; Cao, F.; Wang, Y.J.; Wang, J.X.; Wu, L.; Ding, Z.H. Managing data center cluster as non-wire alternative: A case in balancing market. Appl. Energy 2024, 360, 122769. [Google Scholar] [CrossRef]
  14. Yang, T.; Jiang, H.; Hou, Y.C.; Geng, Y.N. Carbon management of multi-datacenter based on spatio-temporal task migration. IEEE Trans. Cloud Comput. 2023, 11, 1078–1090. [Google Scholar] [CrossRef]
  15. Long, X.X.; Li, Y.Z.; Li, Y.; Ge, L.J.; Gooi, H.B.; Chung, C.Y.; Zeng, Z.G. Collaborative response of data center coupled with hydrogen storage system for renewable energy absorption. IEEE Trans. Sustain. Energy 2024, 15, 986–1000. [Google Scholar] [CrossRef]
  16. Bian, Y.F.; Xie, L.R.; Ma, L.; Zhang, H.G. A novel two-stage energy sharing method for data center cluster considering ‘Carbon-Green Certificate’ coupling mechanism. Energy 2024, 313, 133991. [Google Scholar] [CrossRef]
  17. Zhang, H.Q.; Xiao, Y.; Bu, S.R.; Yu, F.R.; Niyato, D.; Han, Z. Distributed resource allocation for data center networks: A hierarchical game approach. IEEE Trans. Cloud Comput. 2020, 8, 778–789. [Google Scholar] [CrossRef]
  18. Kaur, K.; Garg, S.; Kumar, N.; Aujla, G.S.; Choo, K.R.; Obaidat, M.S. An adaptive grid frequency support mechanism for energy management in cloud data centers. IEEE Syst. J. 2020, 14, 1195–1205. [Google Scholar] [CrossRef]
  19. Ye, G.S.; Gao, F.; Fang, J.Y.; Zhang, Q. Joint workload scheduling in geo-distributed data centers considering UPS power losses. IEEE Trans. Ind. Appl. 2023, 59, 612–626. [Google Scholar] [CrossRef]
  20. Wang, L.L.; Zhu, Z.; Jiang, C.W.; Li, Z. Bi-level robust optimization for distribution system with multiple microgrids considering uncertainty distribution locational marginal price. IEEE Trans. Smart Grid 2021, 12, 1104–1117. [Google Scholar] [CrossRef]
  21. Chen, L.D.; Liu, N.; Wang, J.H. Peer-to-peer energy sharing in distribution networks with multiple sharing regions. IEEE Trans. Ind. Inform. 2020, 16, 6760–6771. [Google Scholar] [CrossRef]
  22. Tian, S.; Xiao, Q.; Li, T.X.; Jin, Y.; Mu, Y.F.; Jia, H.J.; Li, W.; Teodorescu, R.; Guerrero, J.M. An Optimization Strategy for EV-Integrated Microgrids Considering Peer-to-Peer Transactions. Sustainability 2024, 16, 8955. [Google Scholar] [CrossRef]
  23. Ji, H.R.; Zheng, Y.X.; Yu, H.; Zhao, J.L.; Song, G.Y.; Wu, J.Z.; Li, P. Asymmetric bargaining-based SOP planning considering peer-to-peer electricity trading. IEEE Trans. Smart Grid 2025, 16, 942–956. [Google Scholar] [CrossRef]
  24. Lin, C.R.; Hu, B.; Shao, C.Z.; Xie, K.G.; Peng, J.C. Computation offloading for cloud-edge collaborative virtual power plant frequency regulation service. IEEE Trans. Smart Grid 2024, 15, 5232–5244. [Google Scholar] [CrossRef]
  25. Jia, Y.B.; Wan, C.; Cui, W.K.; Song, Y.H.; Ju, P. Peer-to-peer energy trading using prediction intervals of renewable energy generation. IEEE Trans. Smart Grid 2023, 14, 1454–1465. [Google Scholar] [CrossRef]
  26. Fan, S.L.; Ai, Q.; Piao, L.J. Bargaining-based cooperative energy trading for distribution company and demand response. Appl. Energy 2018, 226, 133991. [Google Scholar] [CrossRef]
  27. Yuan, Z.P.; Li, P.; Li, Z.L.; Xia, J. A fully distributed privacy-preserving energy management system for networked microgrid cluster based on homomorphic encryption. IEEE Trans. Smart Grid 2024, 15, 1735–1748. [Google Scholar] [CrossRef]
  28. Li, Y.Z.; Long, X.X.; Zhou, C.J.; Yang, K.; Zhao, Y.; Zeng, Z.G. Coordinated operations of highly renewable power systems and distributed data centers. Sci. Sin. Technol. 2023, 54, 119–135. [Google Scholar] [CrossRef]
  29. Yan, D.X.; Chow, M.Y.; Chen, Y. Low-carbon operation of data centers with joint workload sharing and carbon allowance trading. IEEE Trans. Cloud Comput. 2024, 12, 750–761. [Google Scholar] [CrossRef]
  30. Jin, T.Y.; Bai, L.Q.; Yan, M.Y.; Chen, X.Y. Unlocking spatio-temporal flexibility of data centers in multiple regional peer-to-peer energy transaction markets. IEEE Trans. Power Syst. 2025, 40, 3914–3927. [Google Scholar] [CrossRef]
  31. Han, J.P.; Fang, Y.C.; Li, Y.W.; Du, E.S.; Zhang, N. Optimal planning of multi-microgrid system with shared energy storage based on capacity leasing and energy sharing. IEEE Trans. Smart Grid 2025, 16, 16–31. [Google Scholar] [CrossRef]
Disclaimer/Publisher’s Note: The statements, opinions and data contained in all publications are solely those of the individual author(s) and contributor(s) and not of MDPI and/or the editor(s). MDPI and/or the editor(s) disclaim responsibility for any injury to people or property resulting from any ideas, methods, instructions or products referred to in the content.

Article Metrics

Citations

Article Access Statistics

Multiple requests from the same IP address are counted as one view.