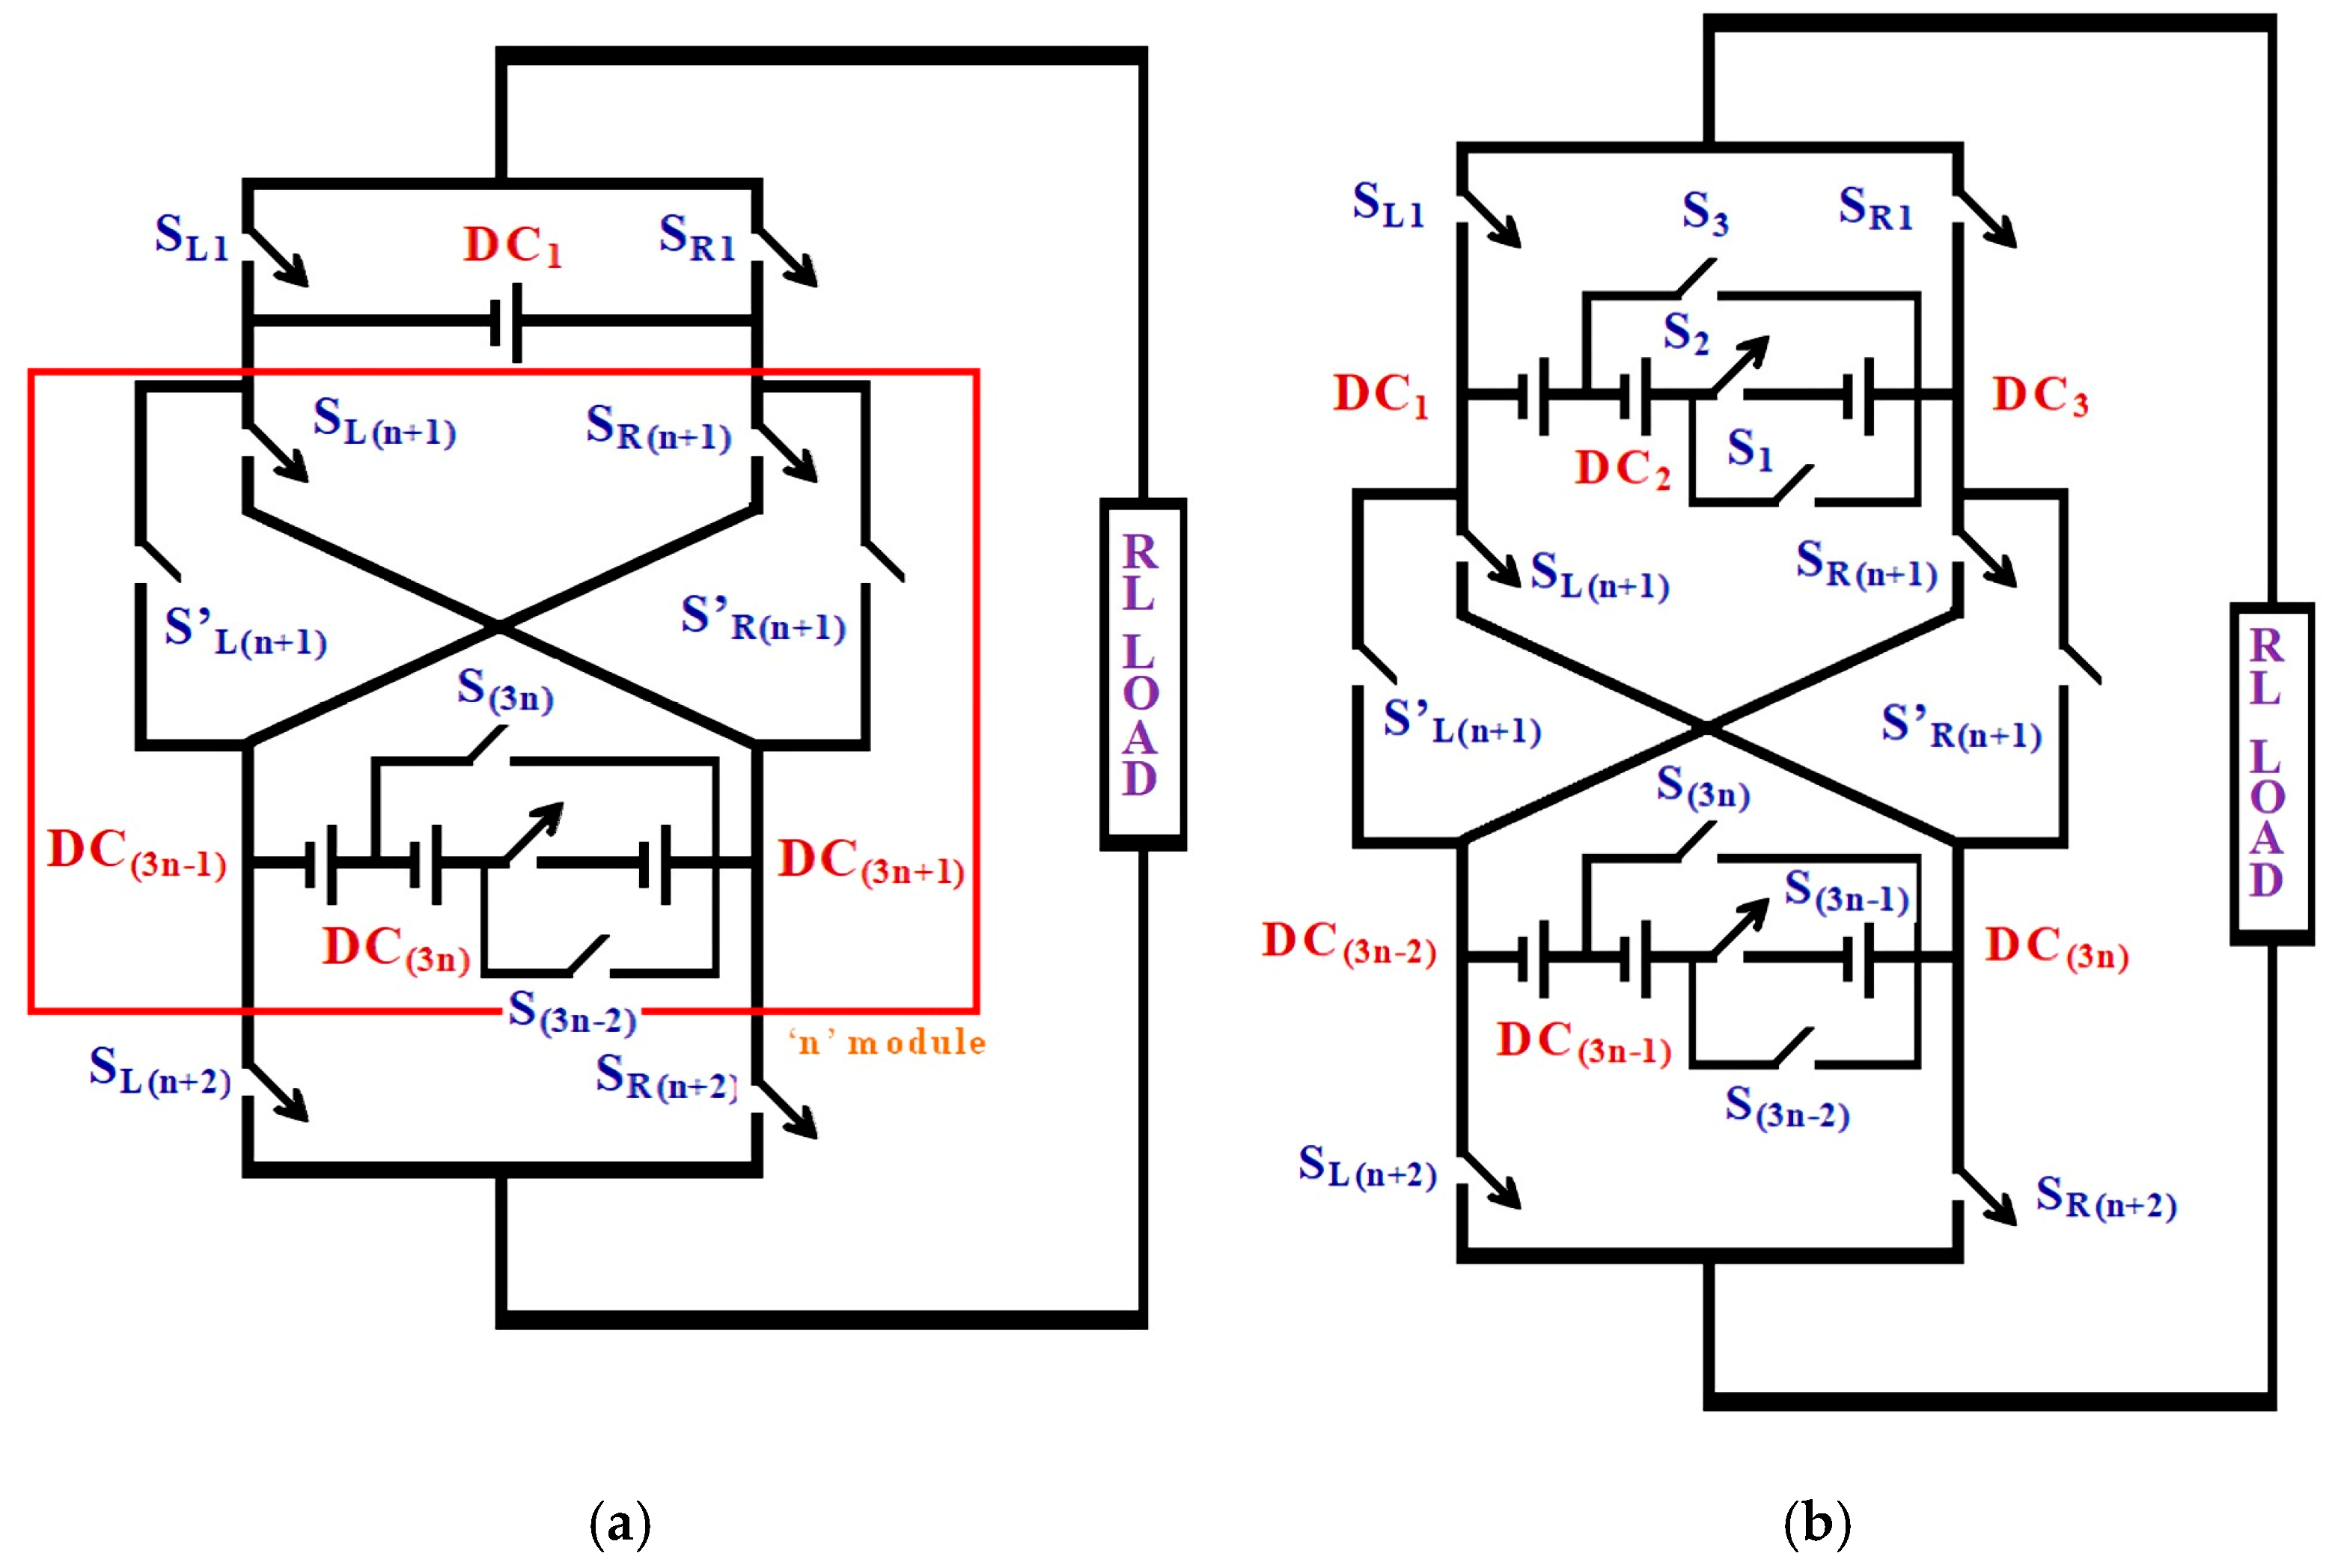
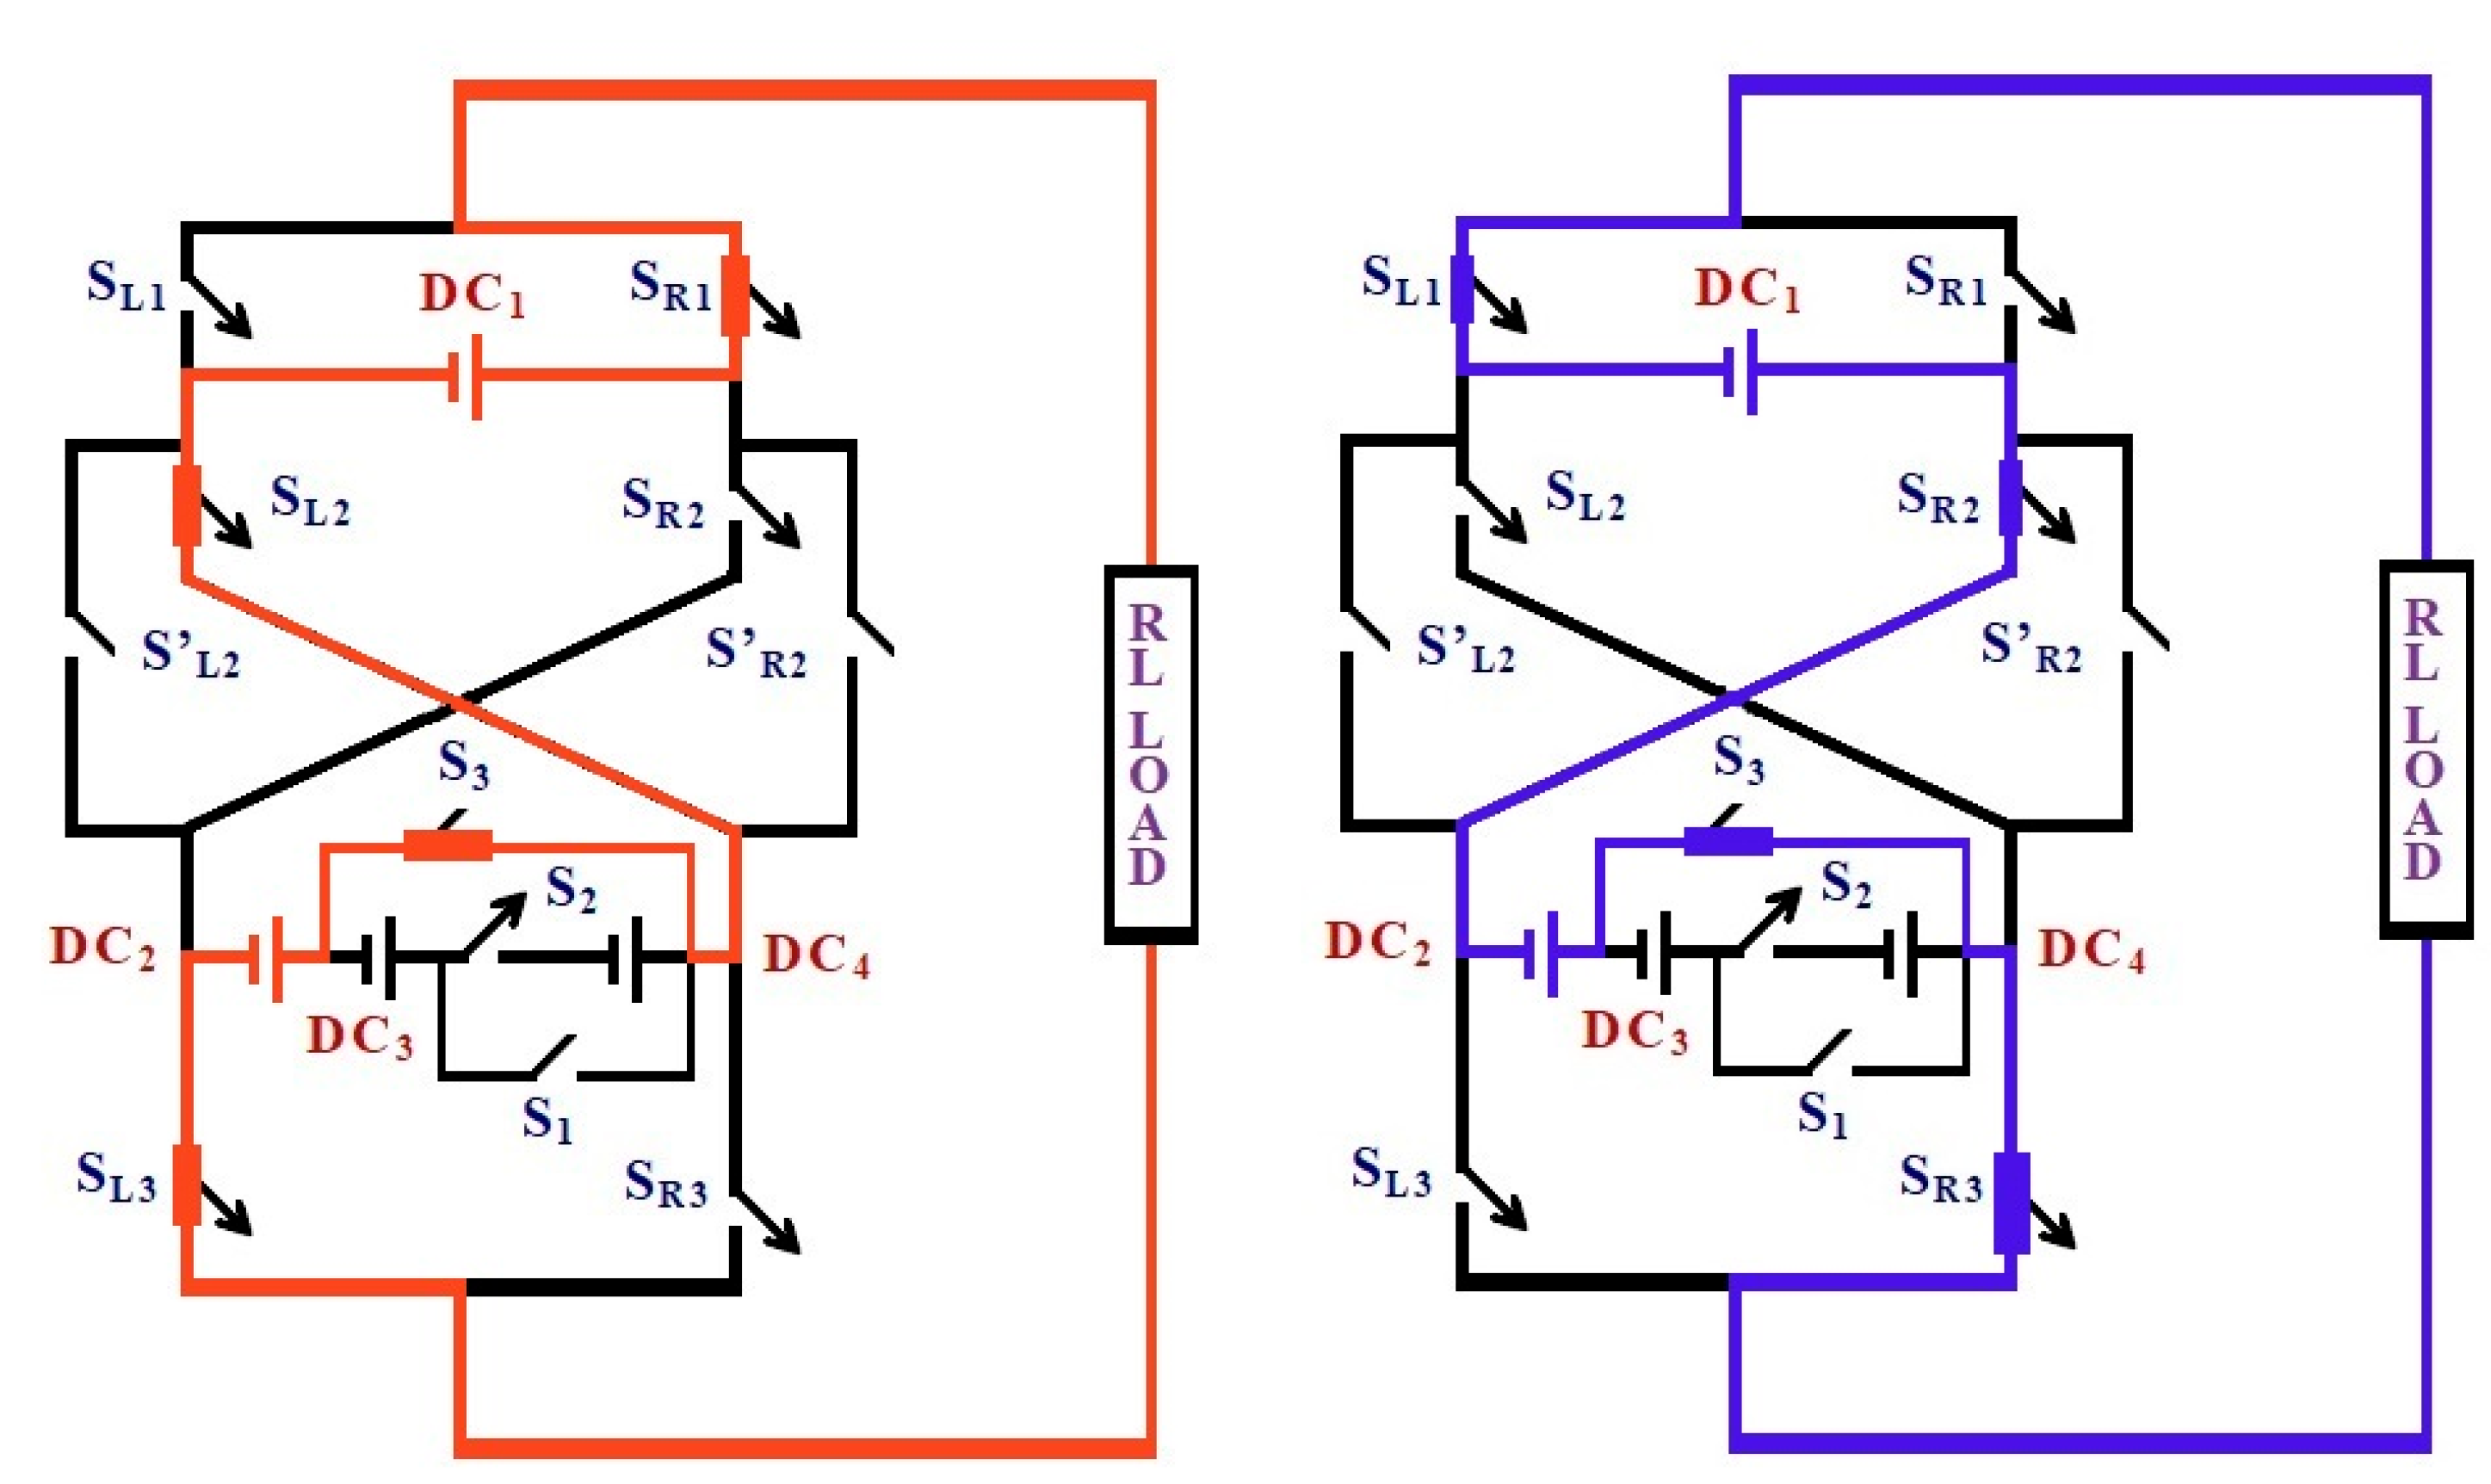
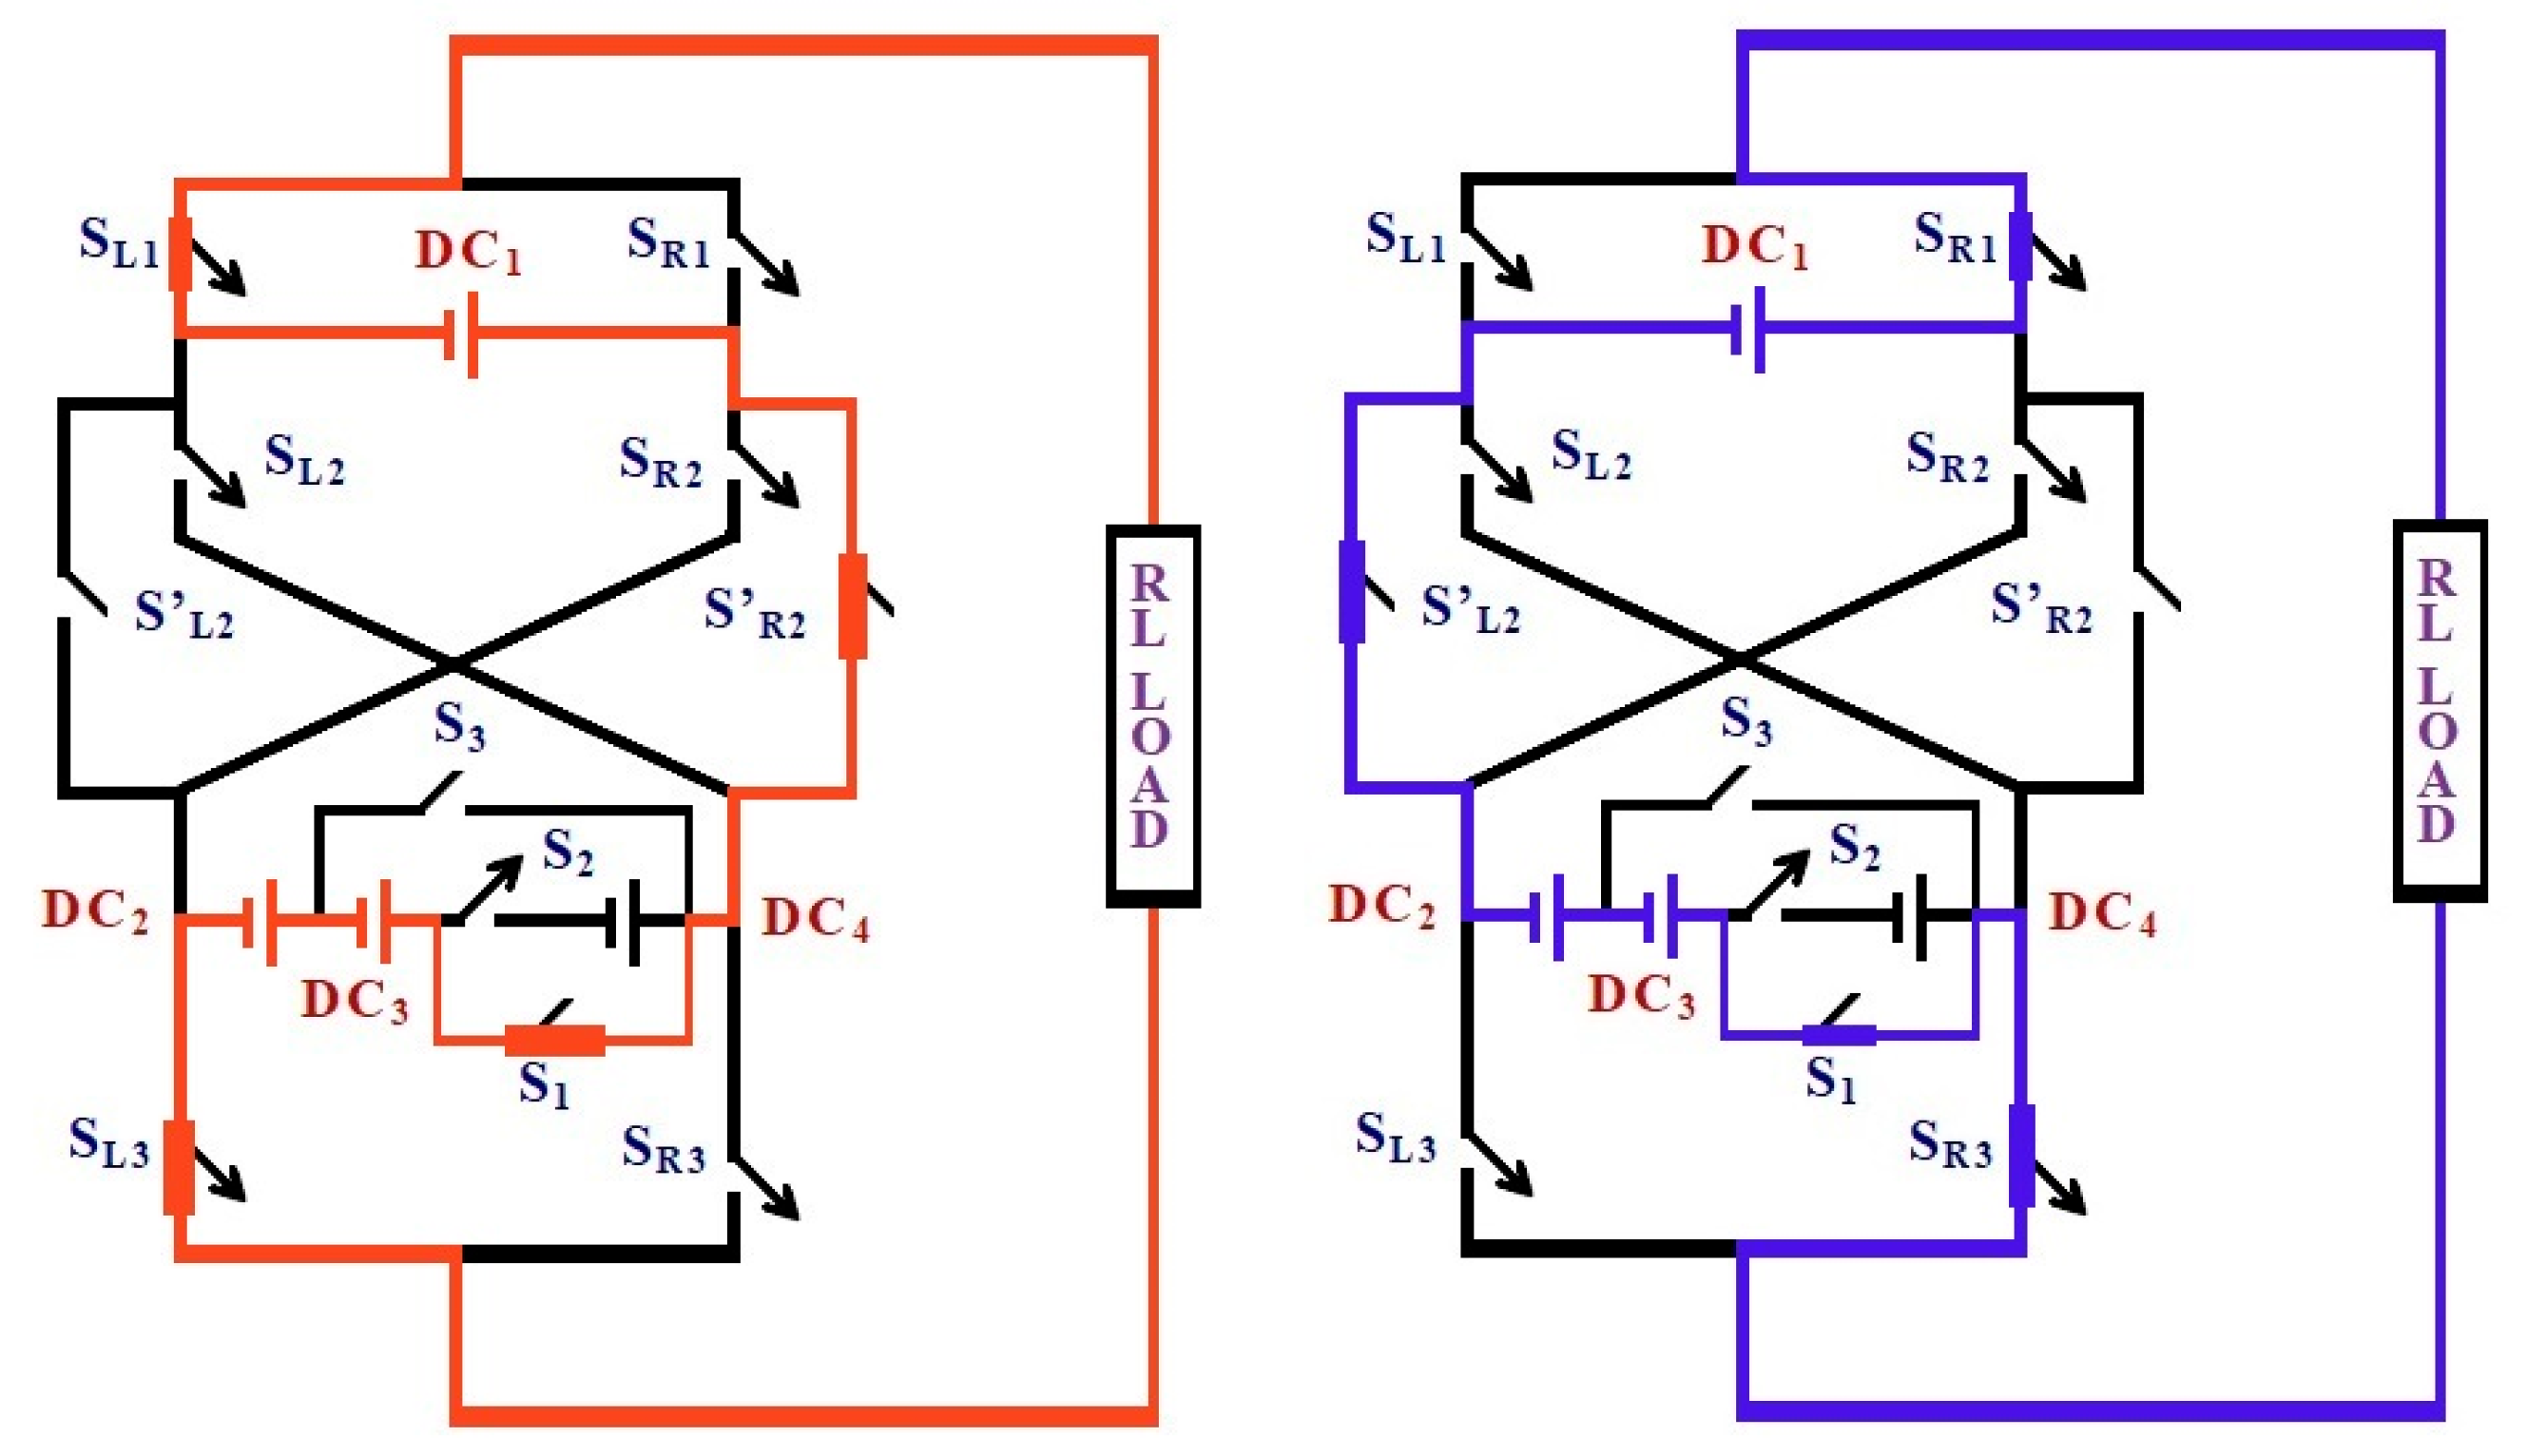
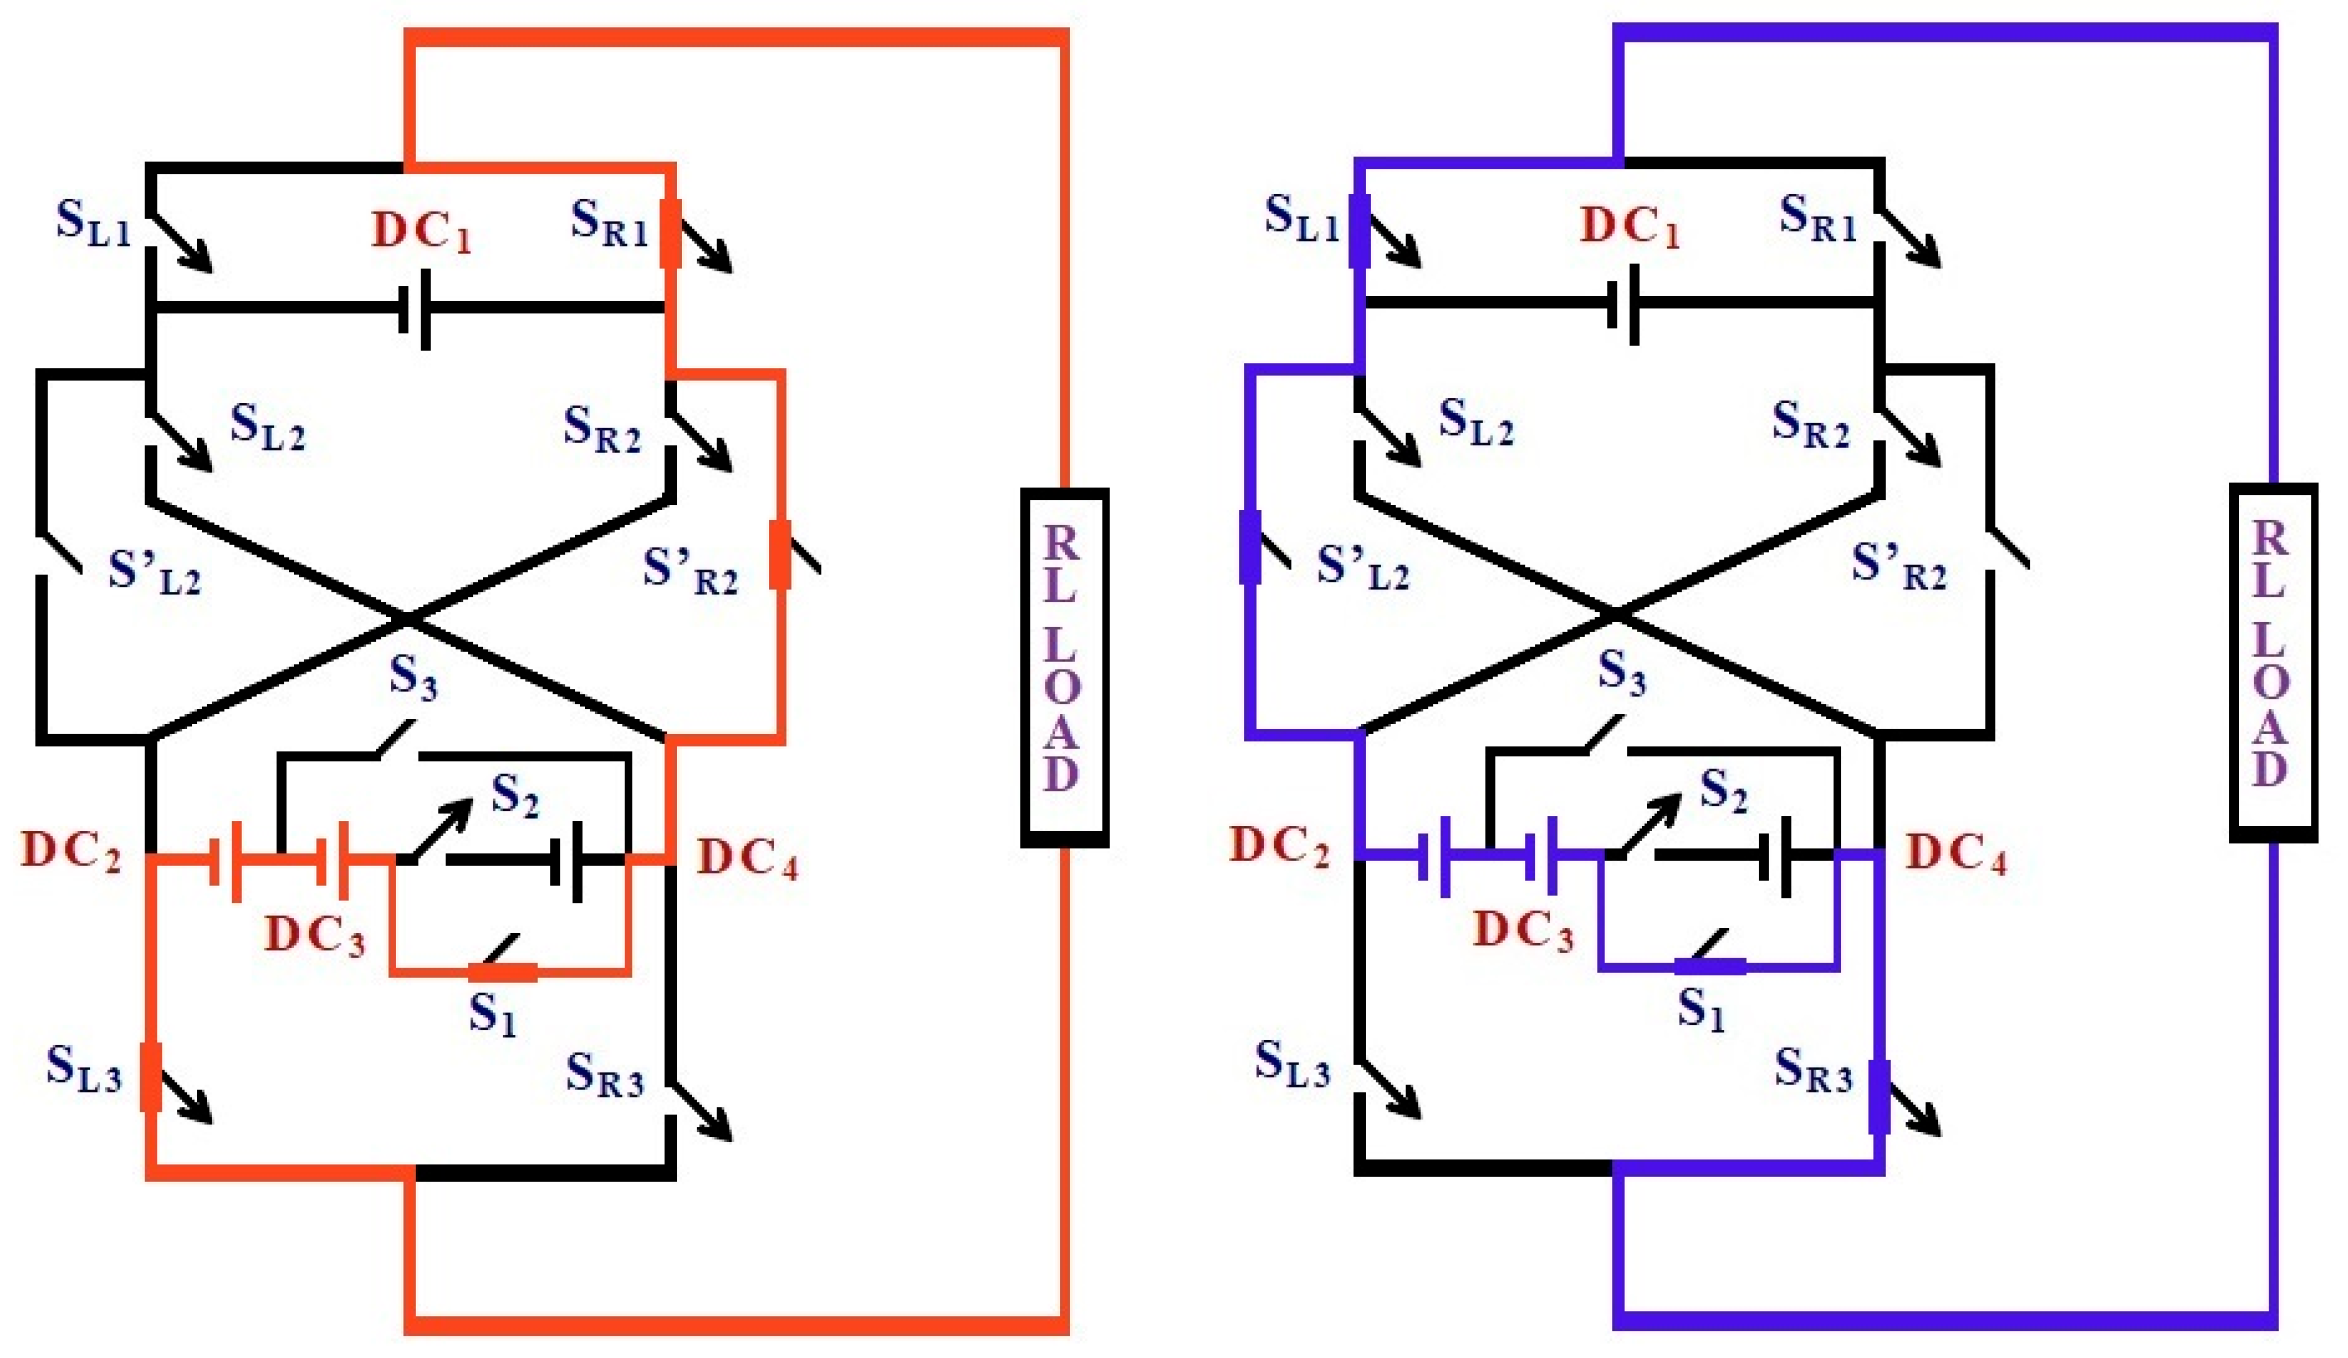
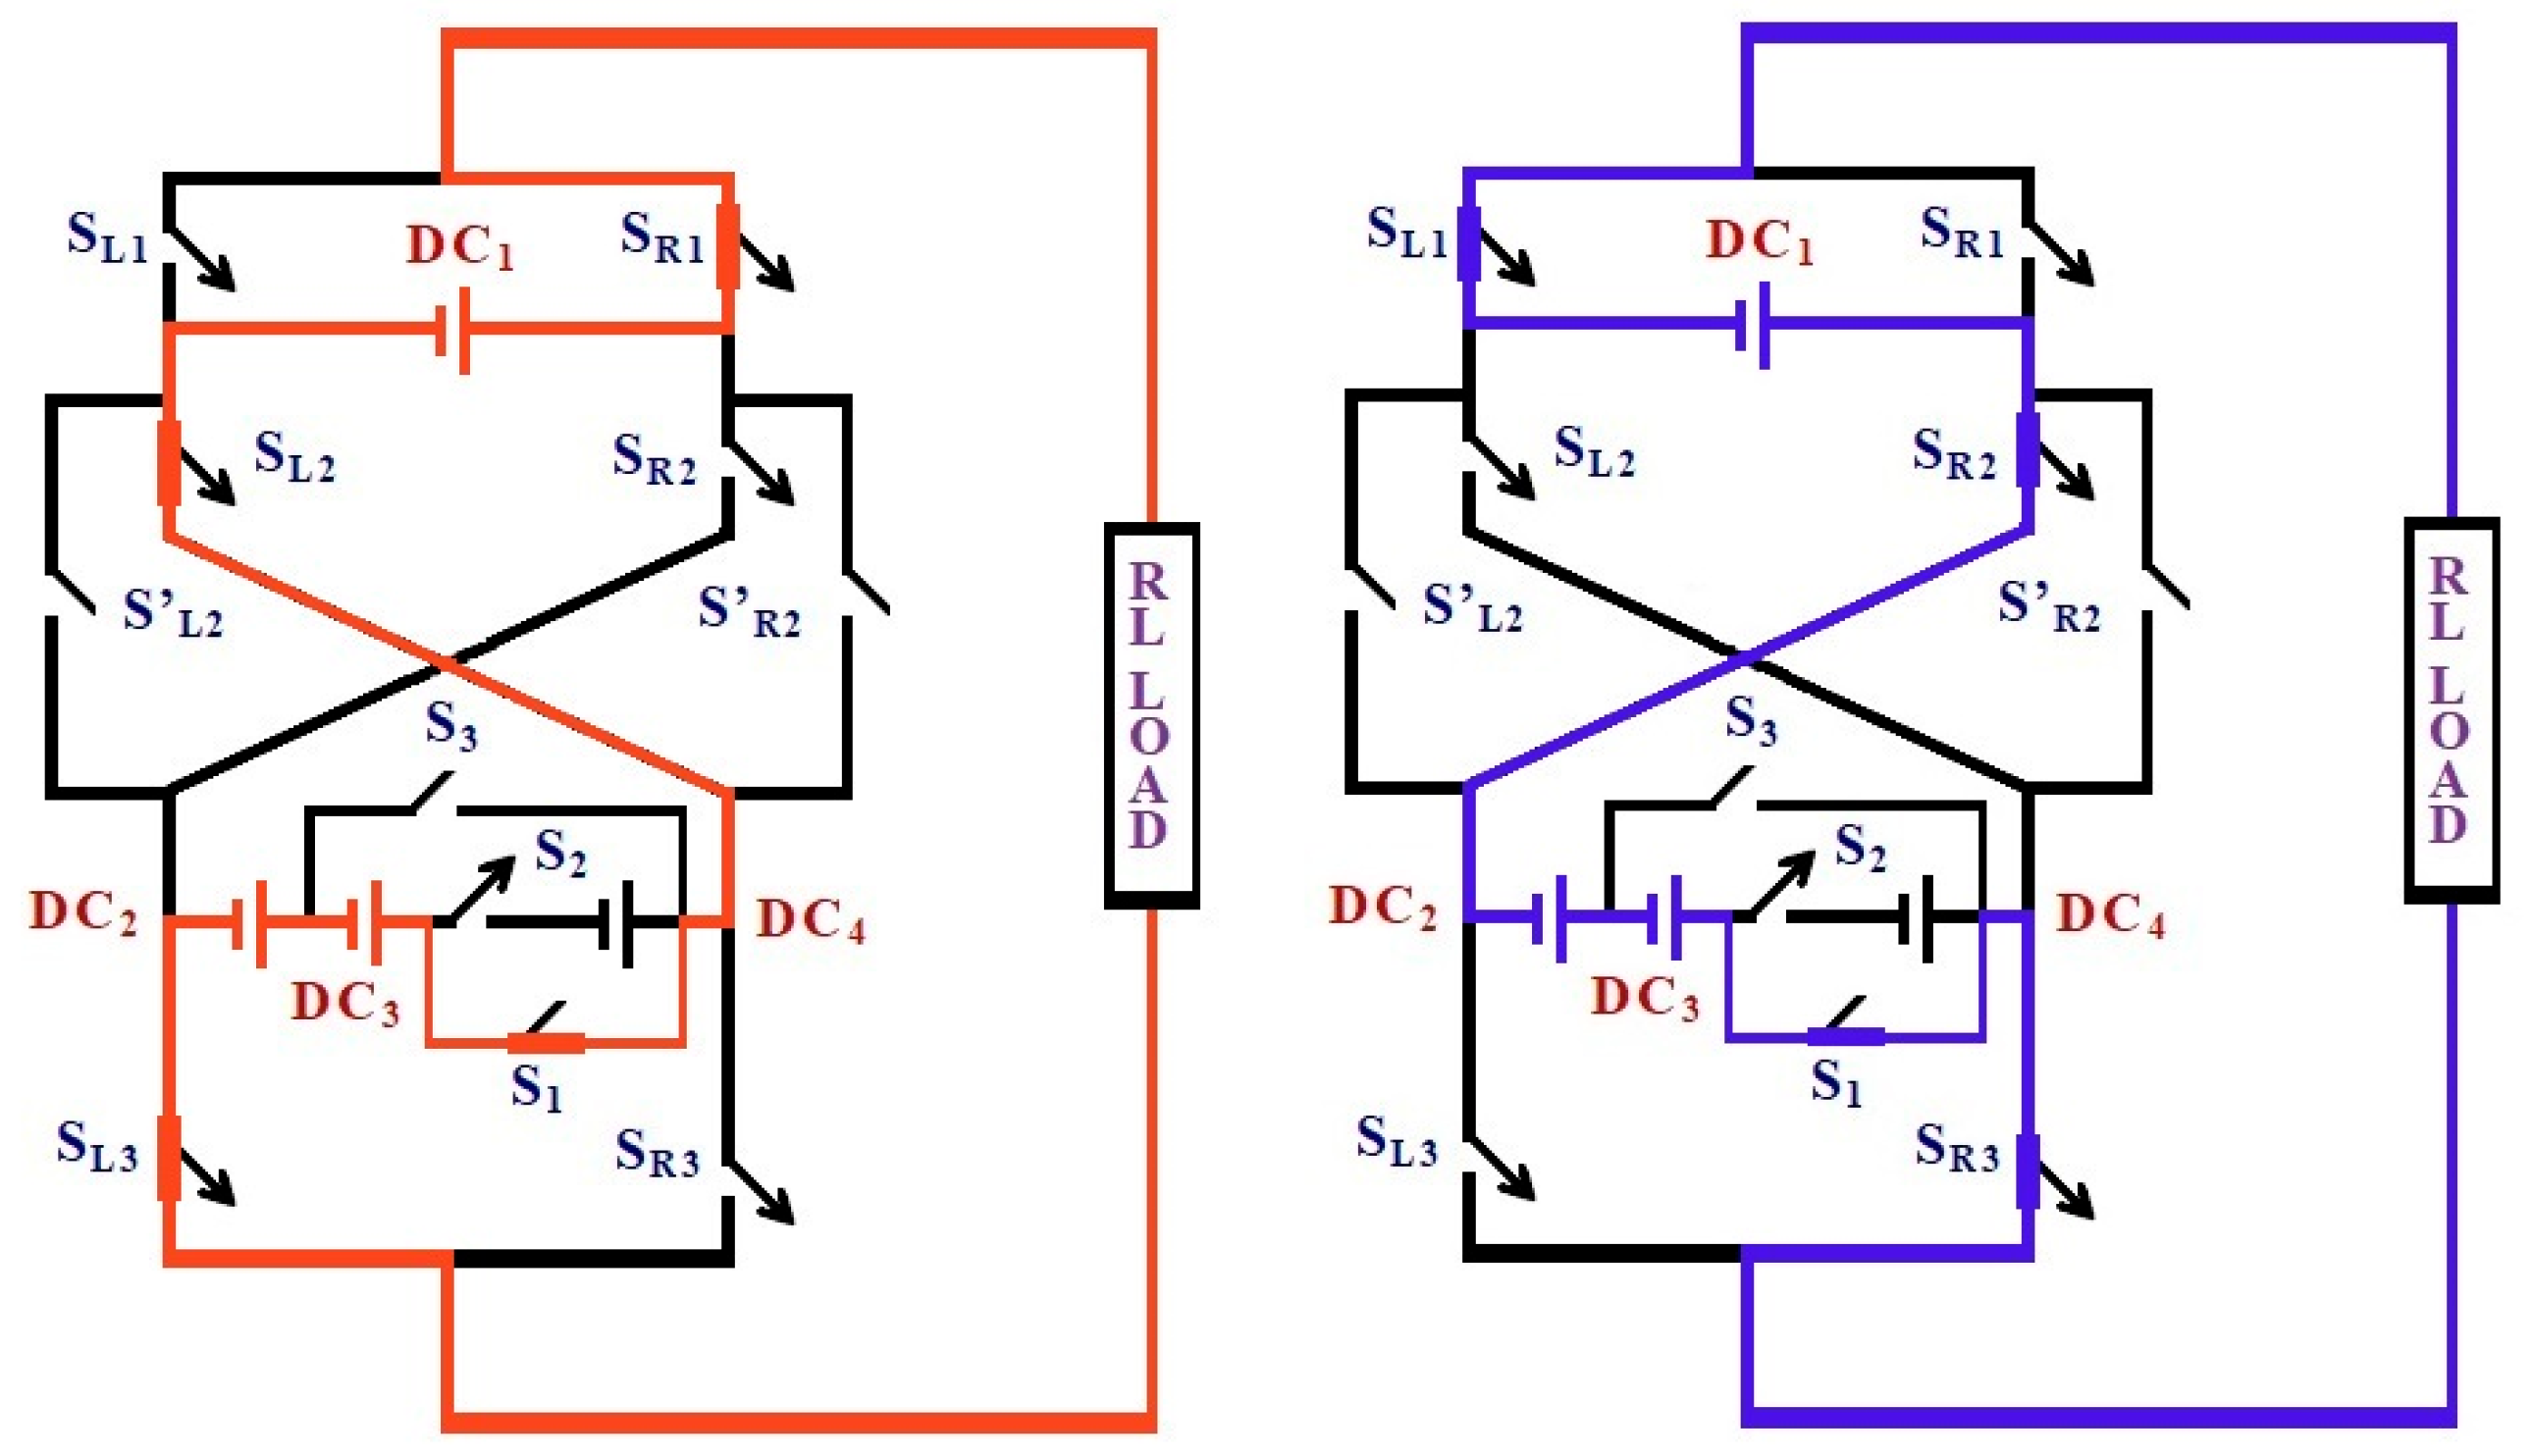
Figure 1.
(a,b) Overall circuit configuration of the proposed triple-source reduced-component-count (RCC) multilevel inverter (MLI). Three isolated DC sources (DC1, DC2, and DC3) are connected through a cross-linked bridge structure using unidirectional and bidirectional switches to generate multiple output voltage levels with a reduced component count.
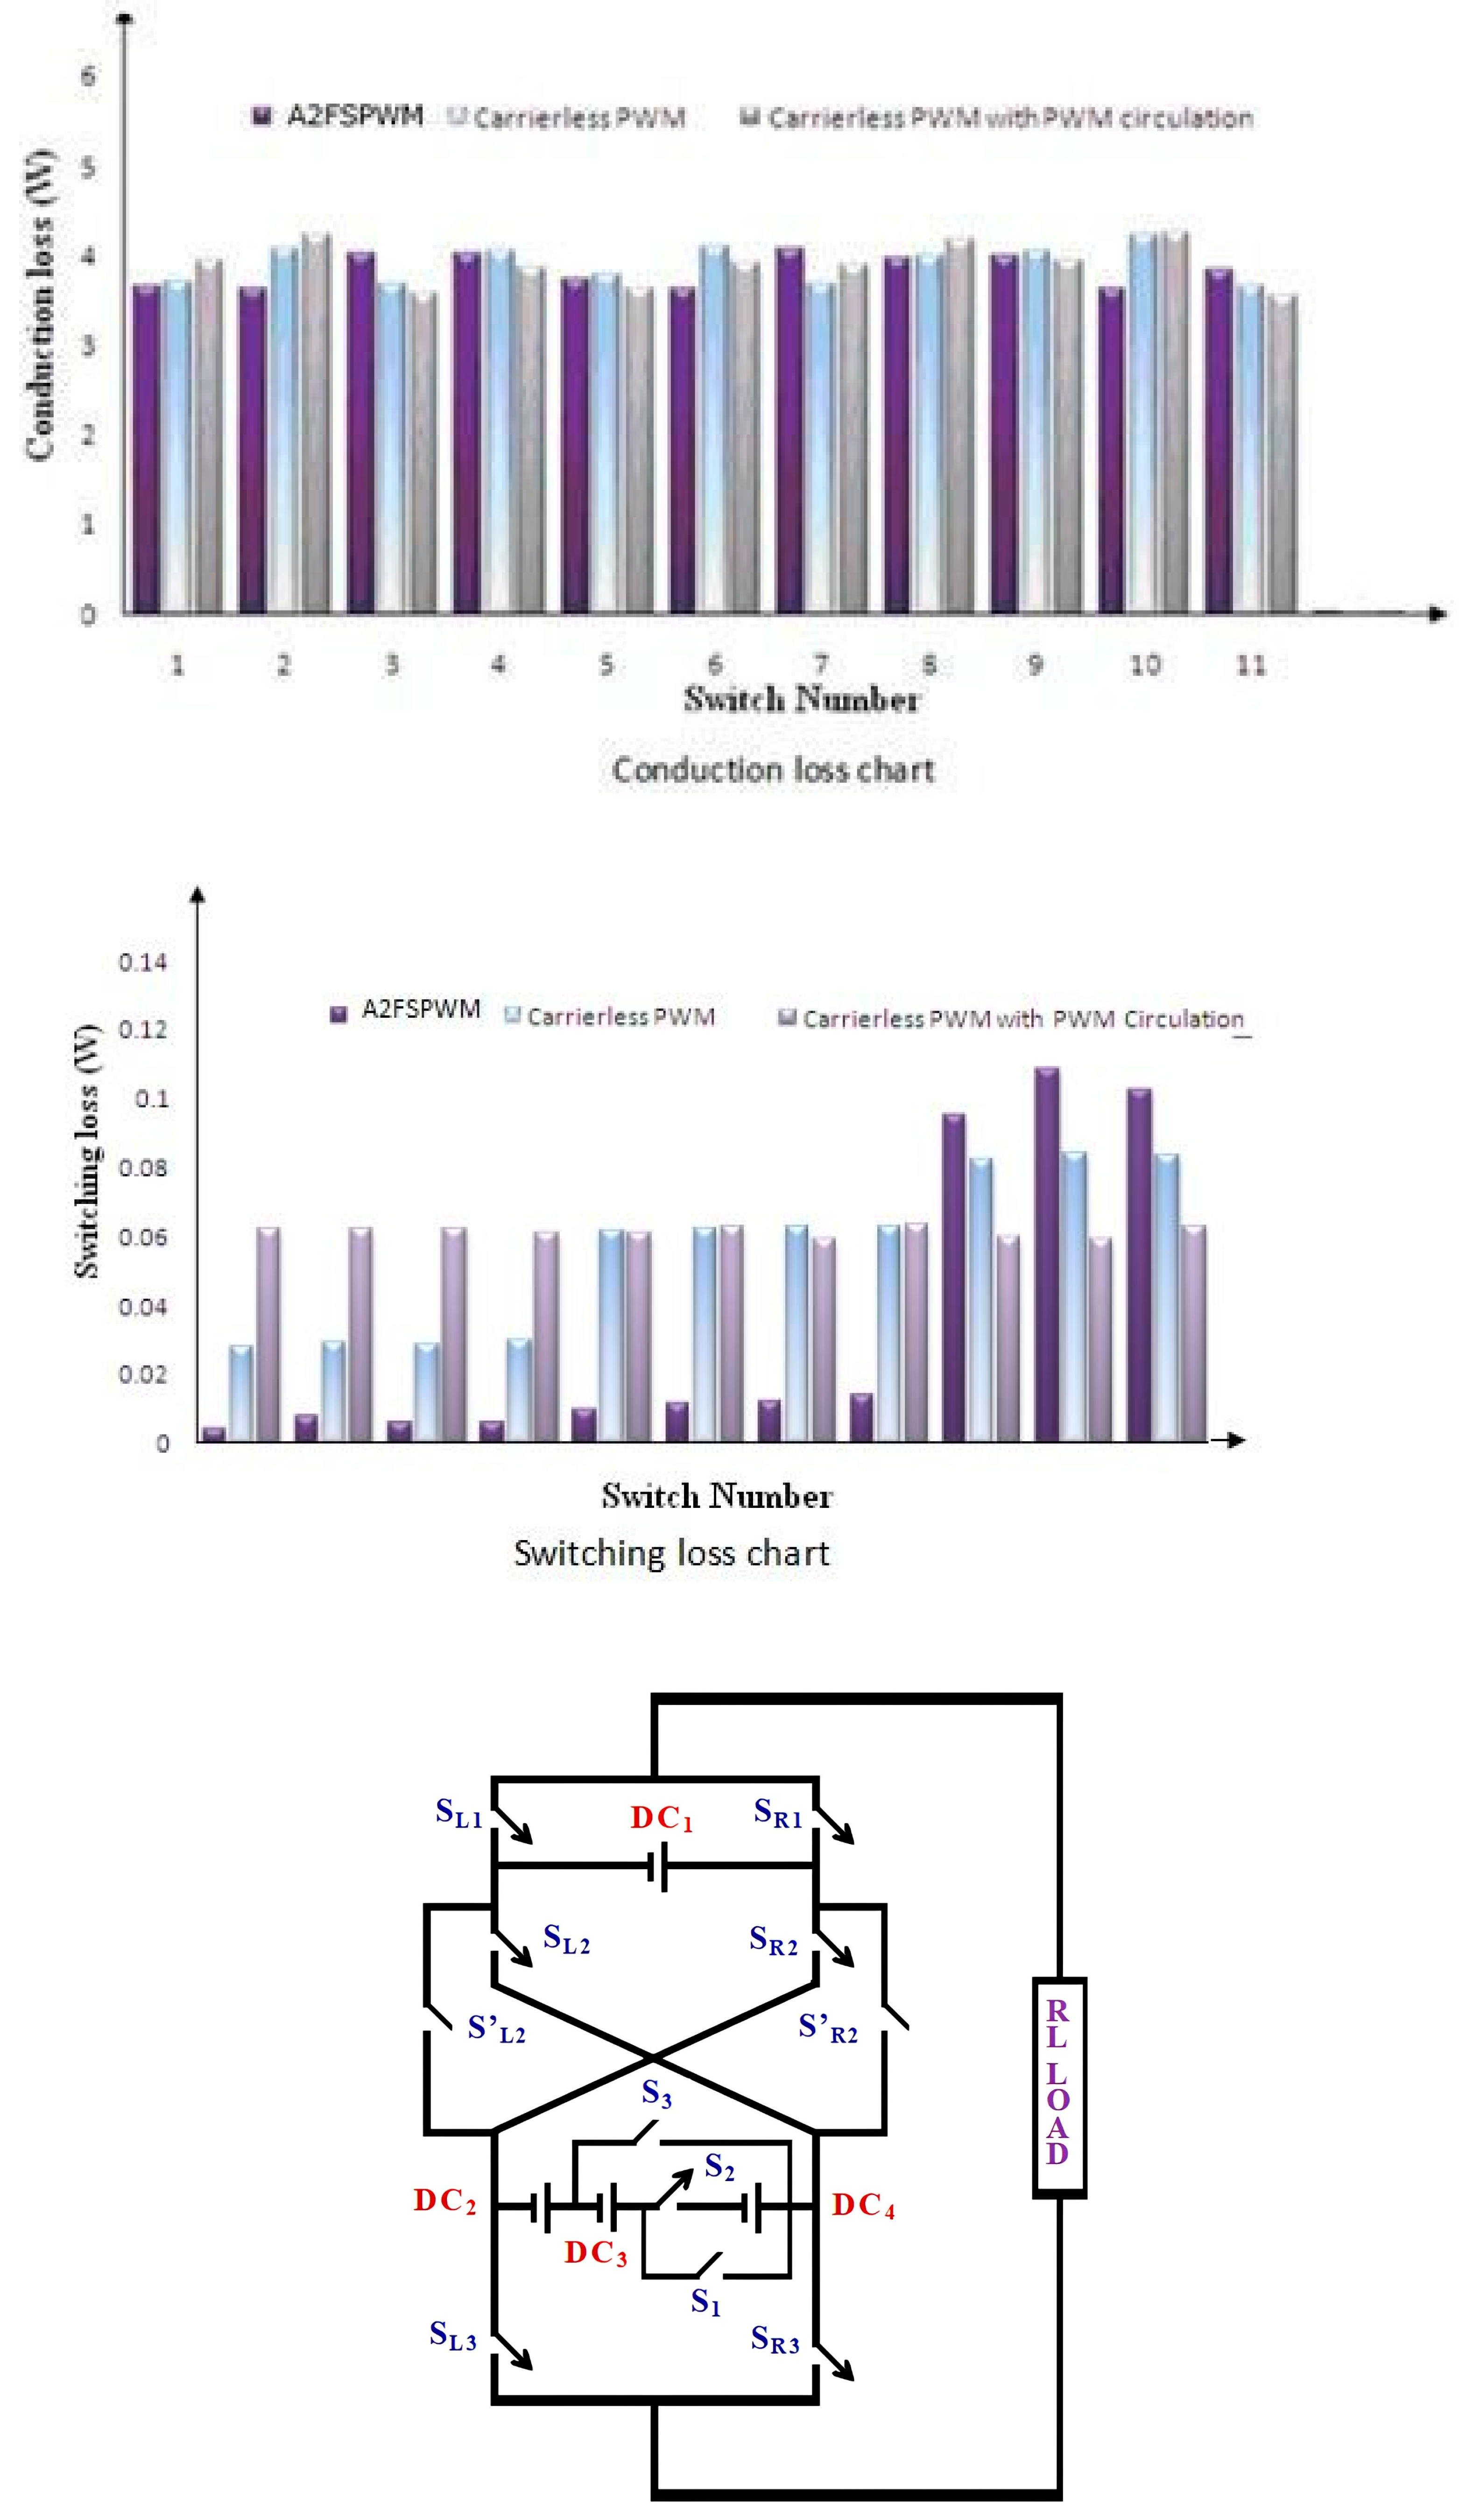
Figure 2.
Circuit diagram of the proposed 21-level RCC-MLI using three DC sources and cross-connected switches for voltage synthesis.
Figure 2.
Circuit diagram of the proposed 21-level RCC-MLI using three DC sources and cross-connected switches for voltage synthesis.
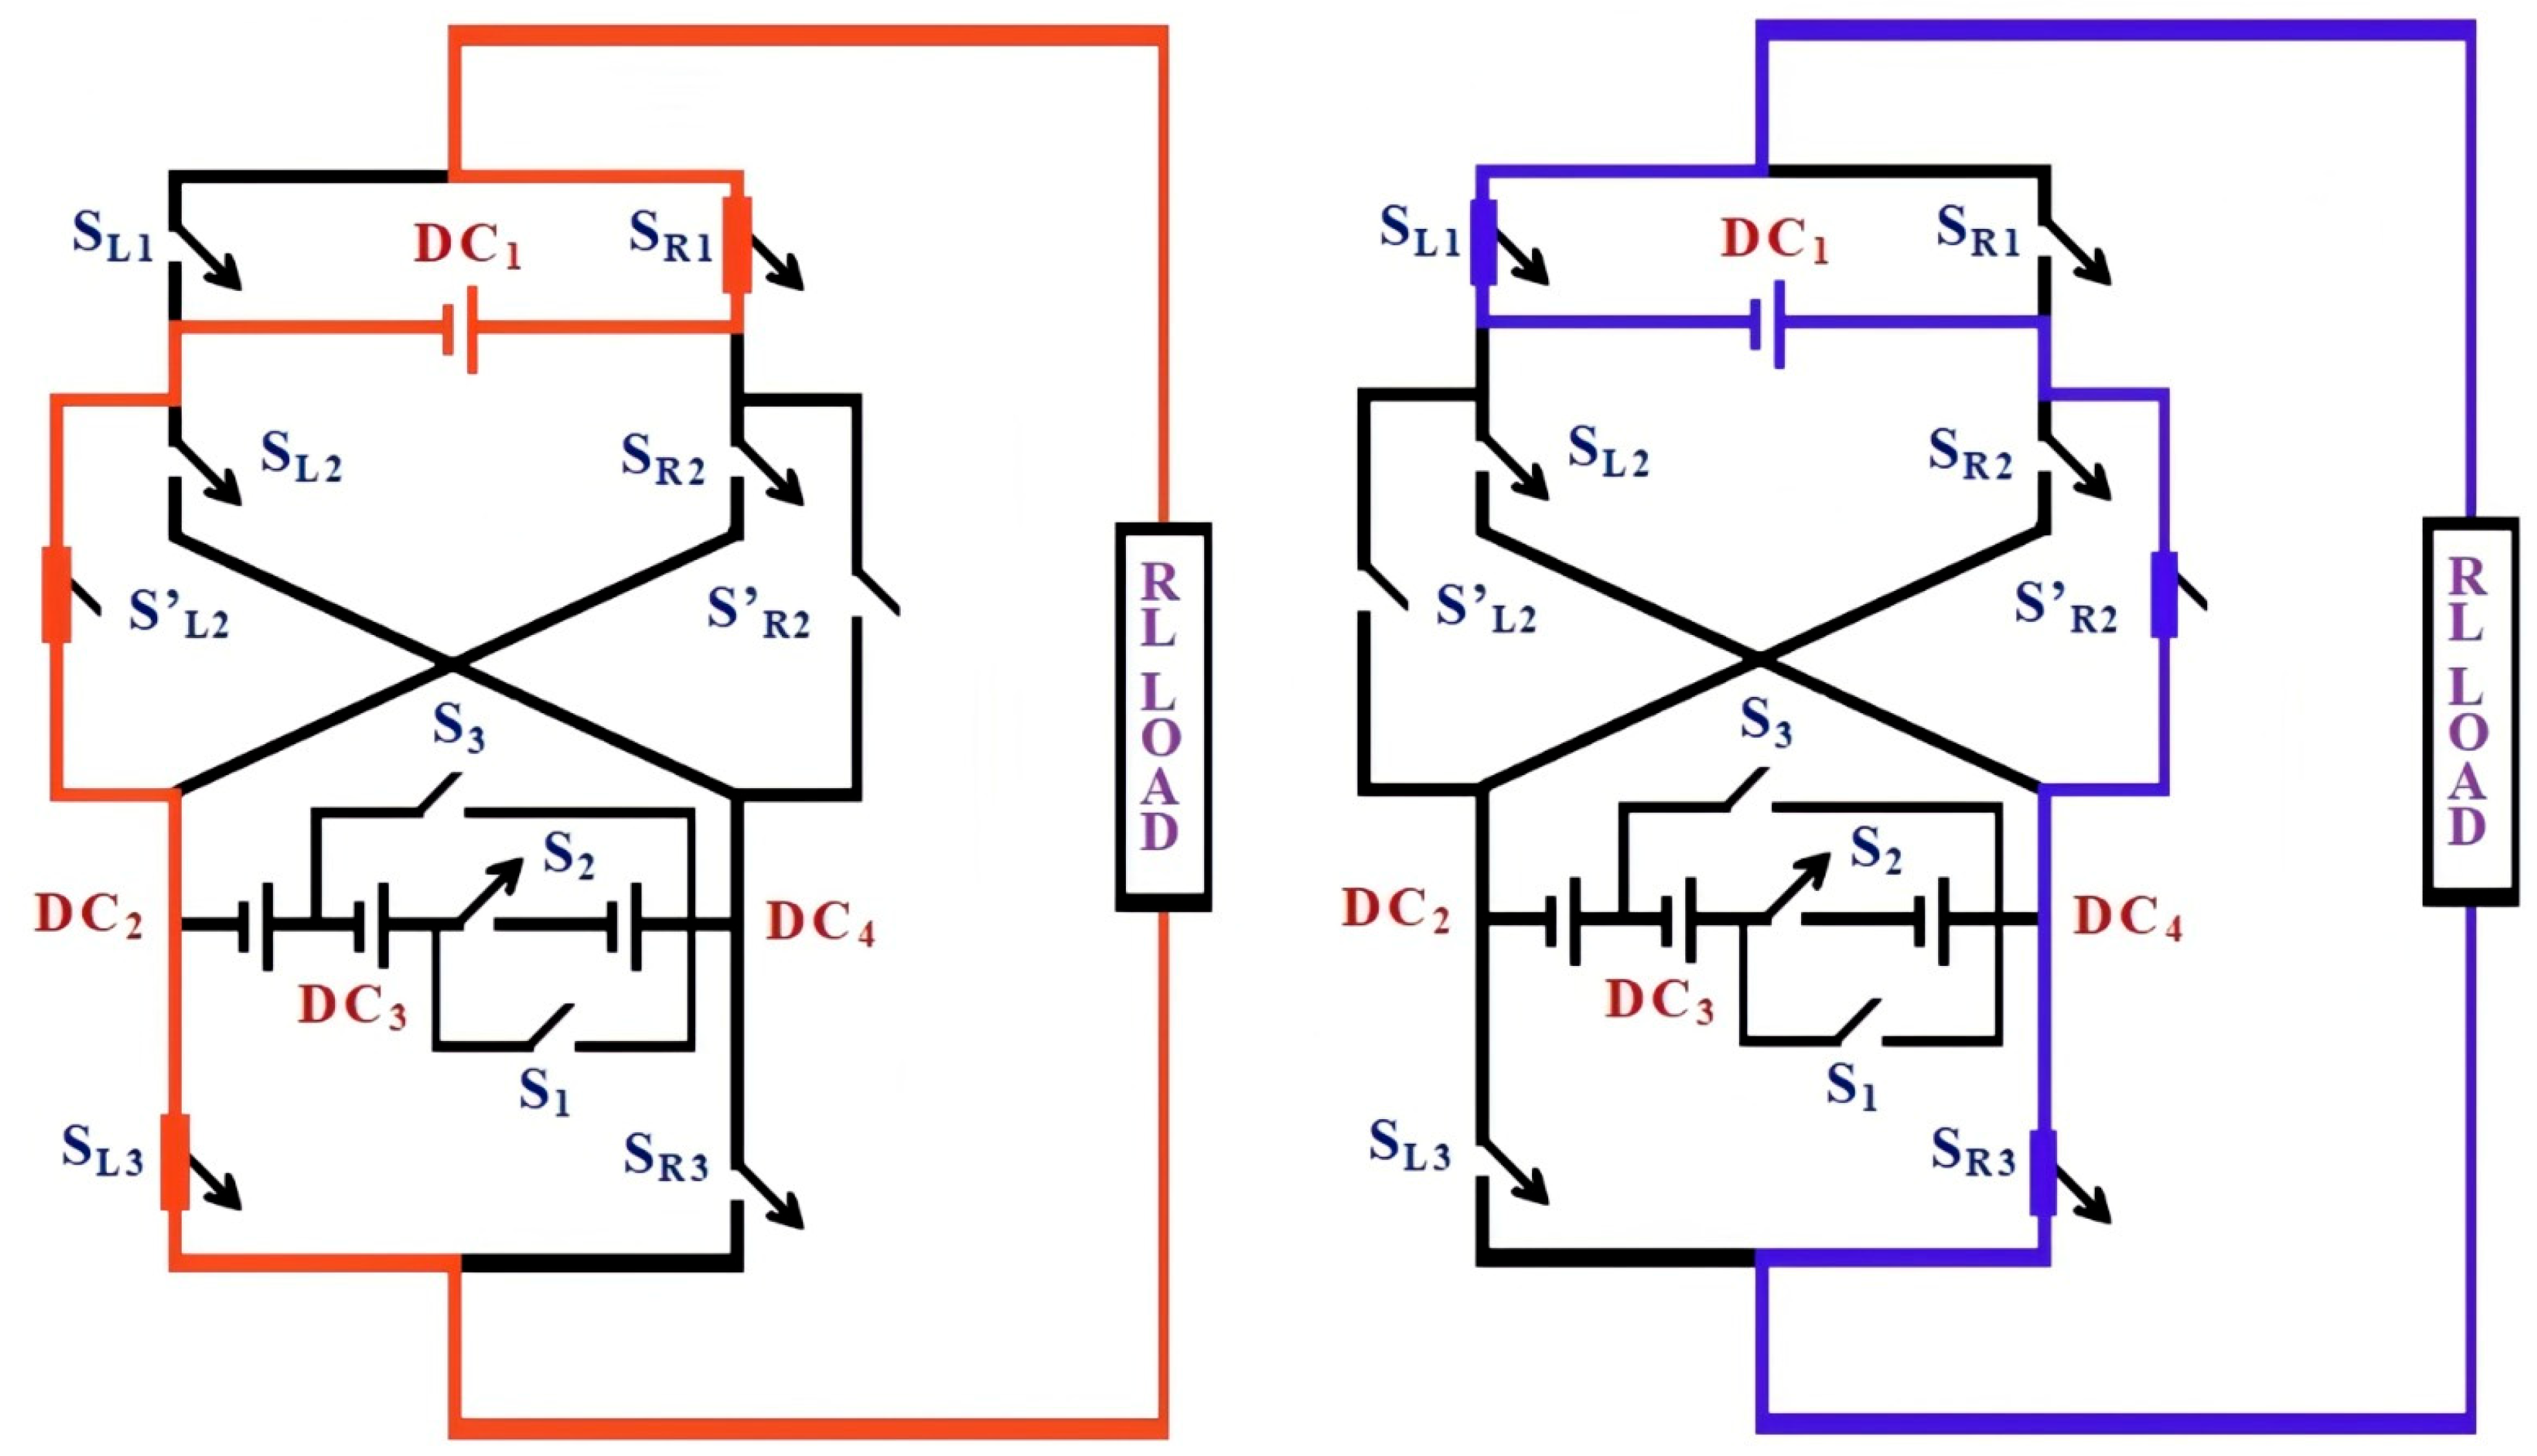
Figure 3.
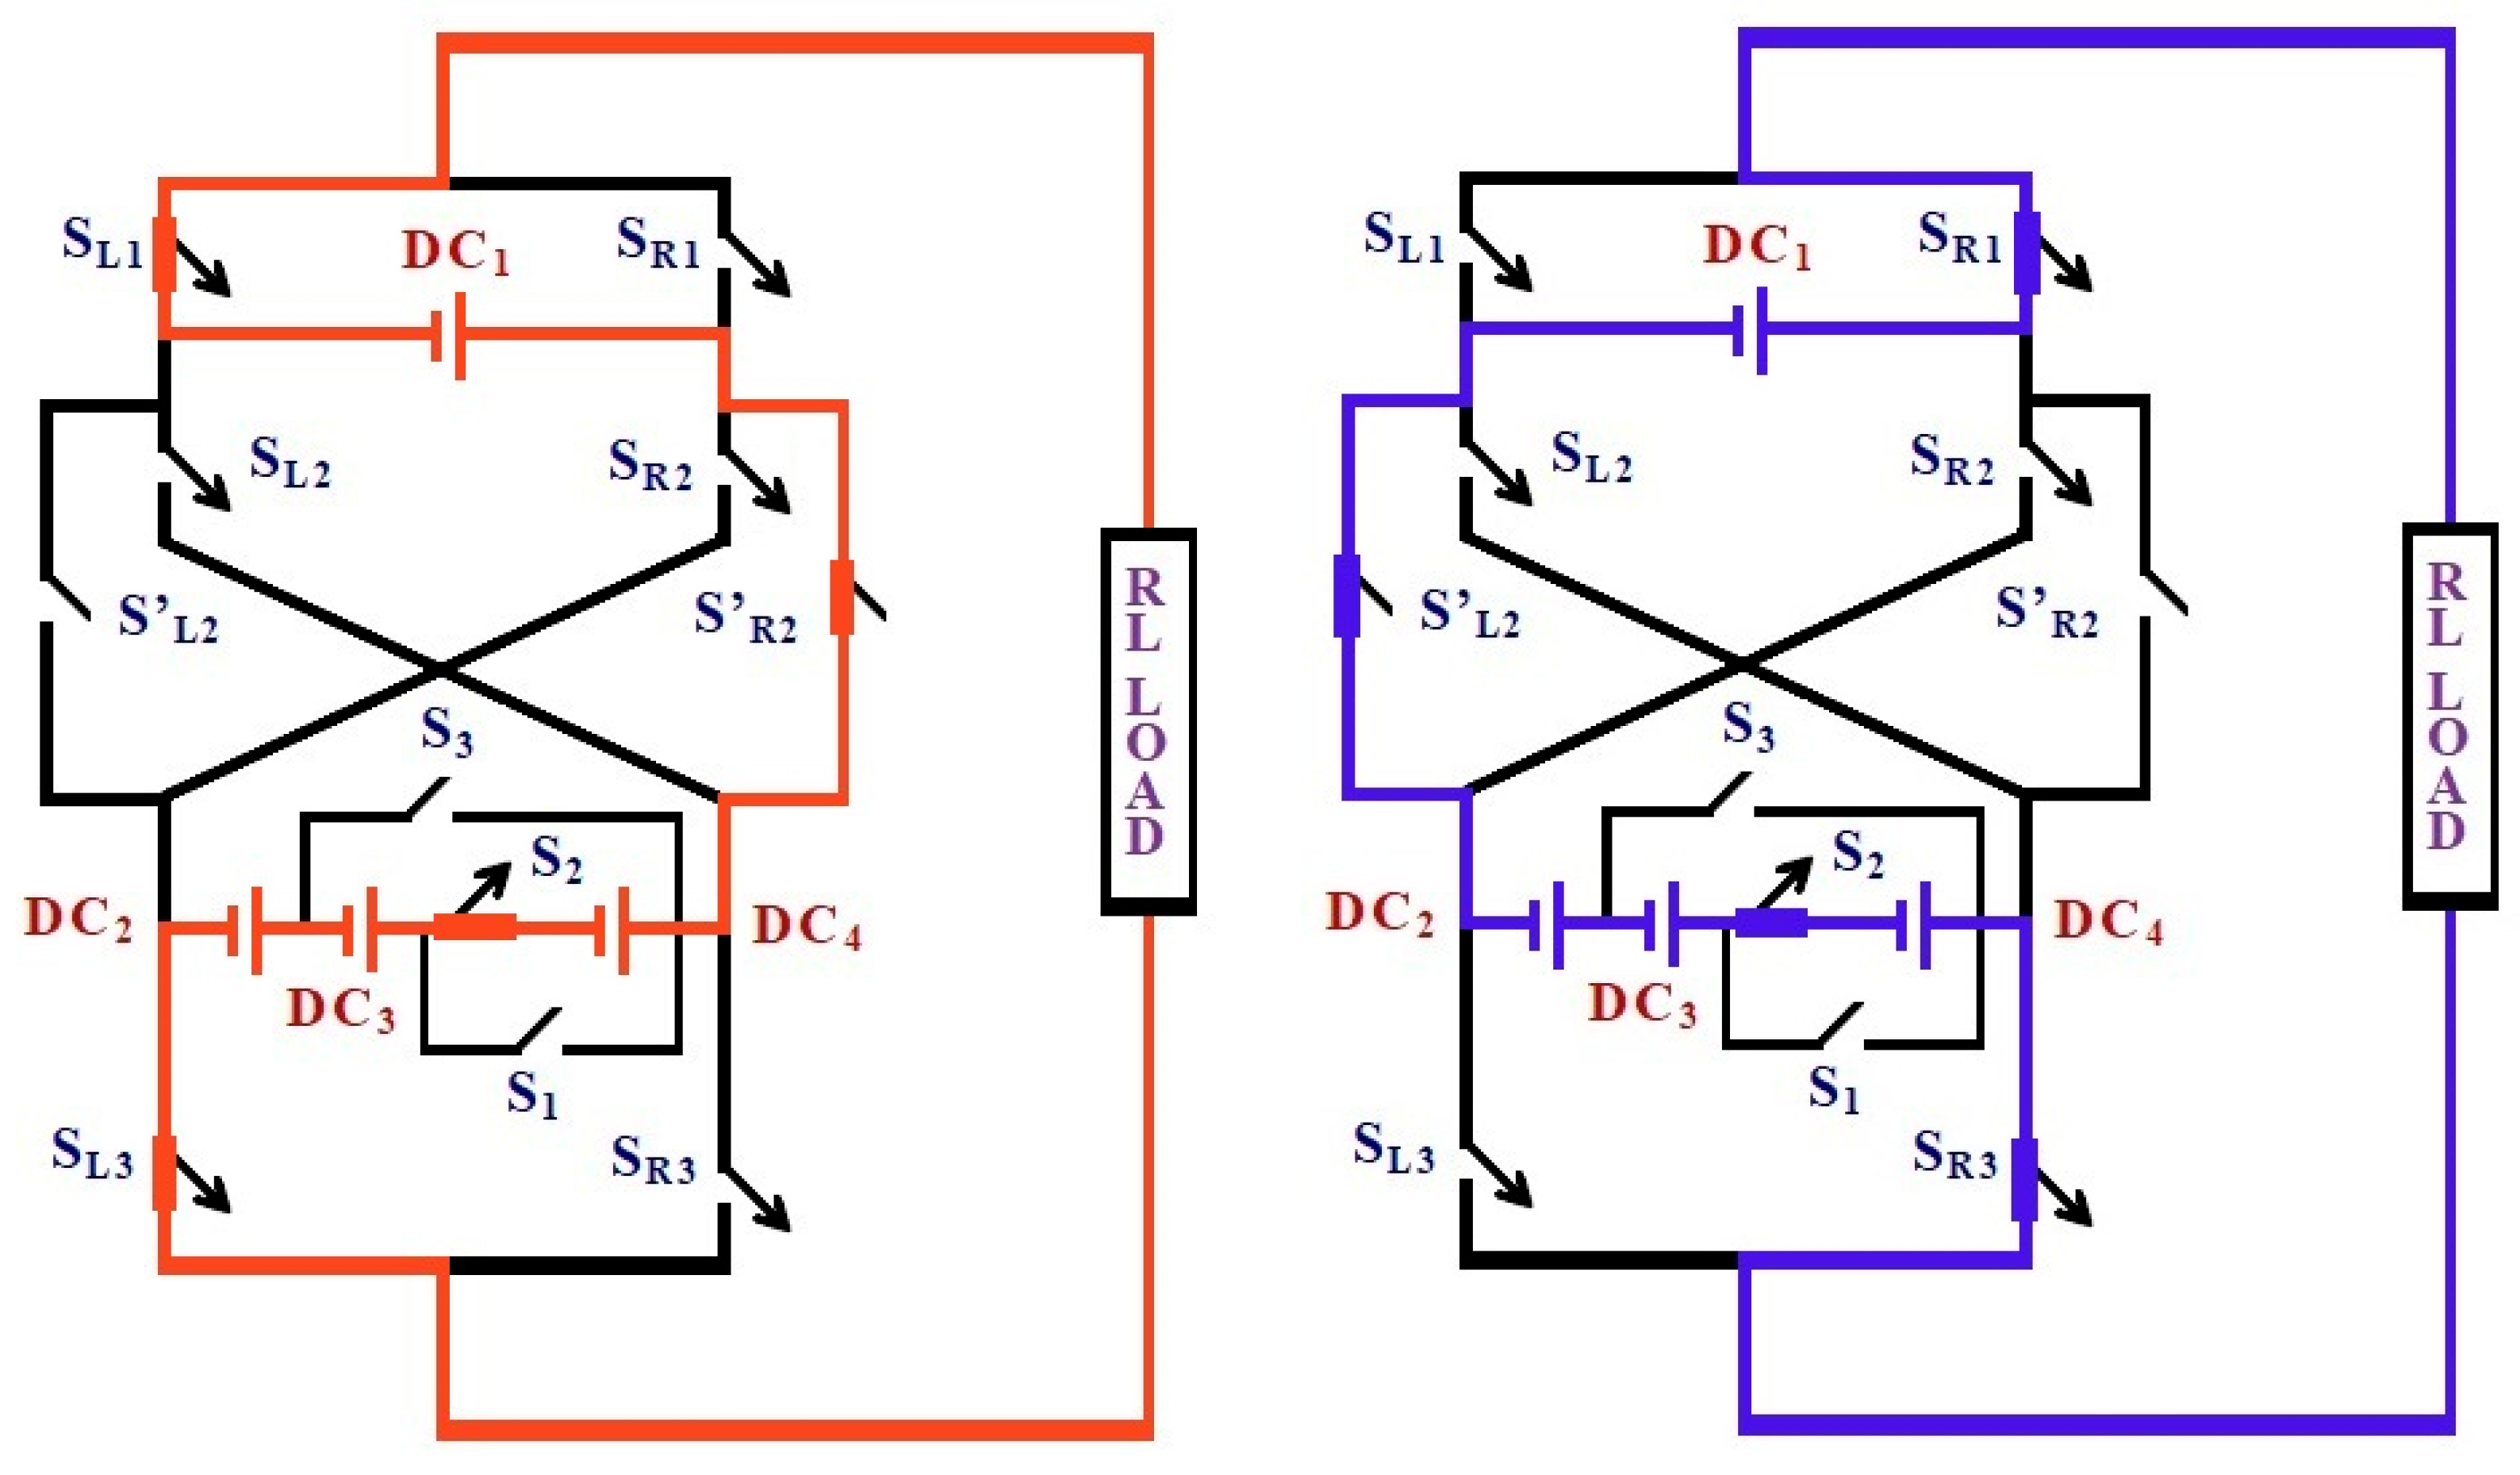
Switching state for the output voltage level ± DC1. Current conduction path for output level +VDC1. Switches SR1, S′L2, and SL3 are turned ON, establishing the current flow through DC1 and the load. The remaining switches are OFF, ensuring minimal conduction loss. Red color flow (left diagram) denotes the current conduction path for the positive output voltage level (+VDC1). Blue color flow (right diagram) denotes the current conduction path for the negative output voltage level (−VDC1).
Figure 4.
Switching state for the output voltage level ± (DC2−DC1) and the conduction path for the output level + VDC2 − VDC1. Switches SR1, S′L2, SR3, and S3 are ON, connecting DC2 to the load while isolating DC1. This configuration produces an intermediate positive voltage level. Red color flow (left diagram) denotes the current conduction path for the positive output voltage level (+VDC1). Blue color flow (right diagram) denotes the current conduction path for the negative output voltage level (−VDC1).
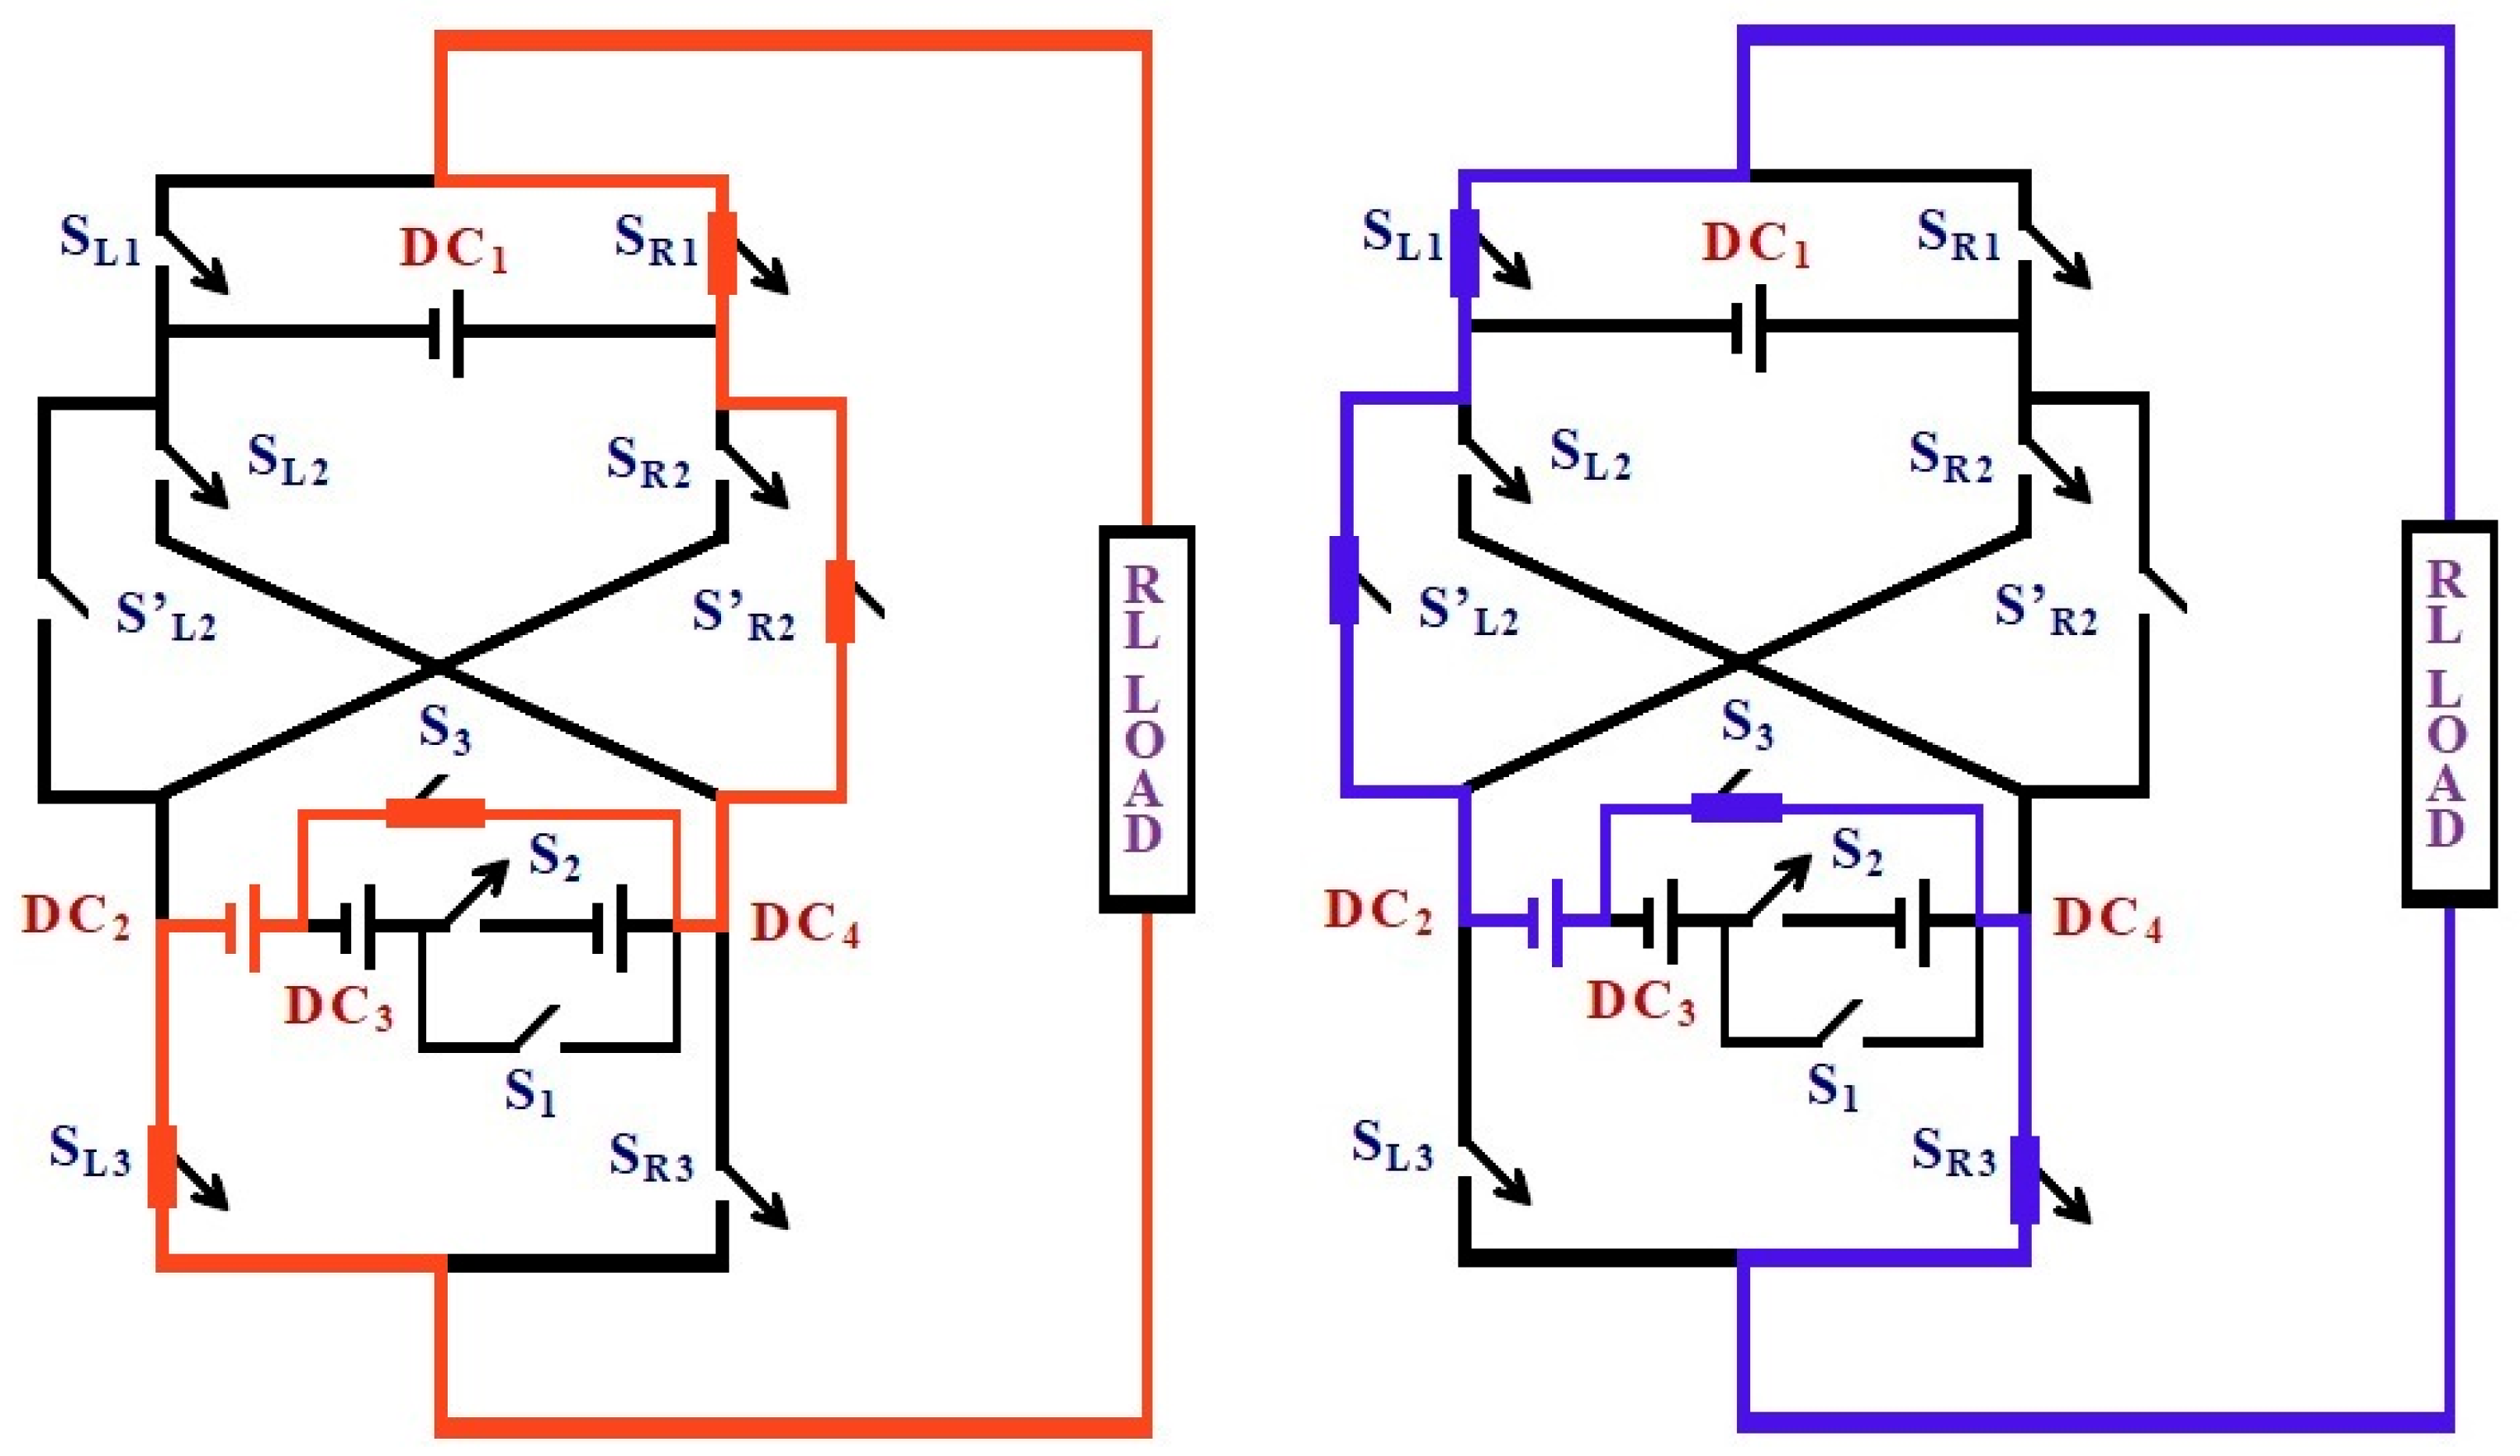
Figure 5.
Switching state for the output voltage level ± DC2. In this mode, switches SR1, SR2′, SL3, and S1 conduct to synthesize an additive voltage of +VDC2 + VDC3 − VDC1 across the load. Red color flow (left diagram) denotes the current conduction path for the positive output voltage level (+VDC1). Blue color flow (right diagram) denotes the current conduction path for the negative output voltage level (−VDC1).
Figure 6.
Switching state for the output voltage level ± (DC2 + DC1). Current conduction path for maximum output level +VDC1 + VDC2 + VDC3. Switches SR1, S′R2, SR3, and S1 are ON, providing the full positive peak voltage. This state represents the highest energy conversion point. Red color flow (left diagram) denotes the current conduction path for the positive output voltage level (+VDC1). Blue color flow (right diagram) denotes the current conduction path for the negative output voltage level (−VDC1).
Figure 7.
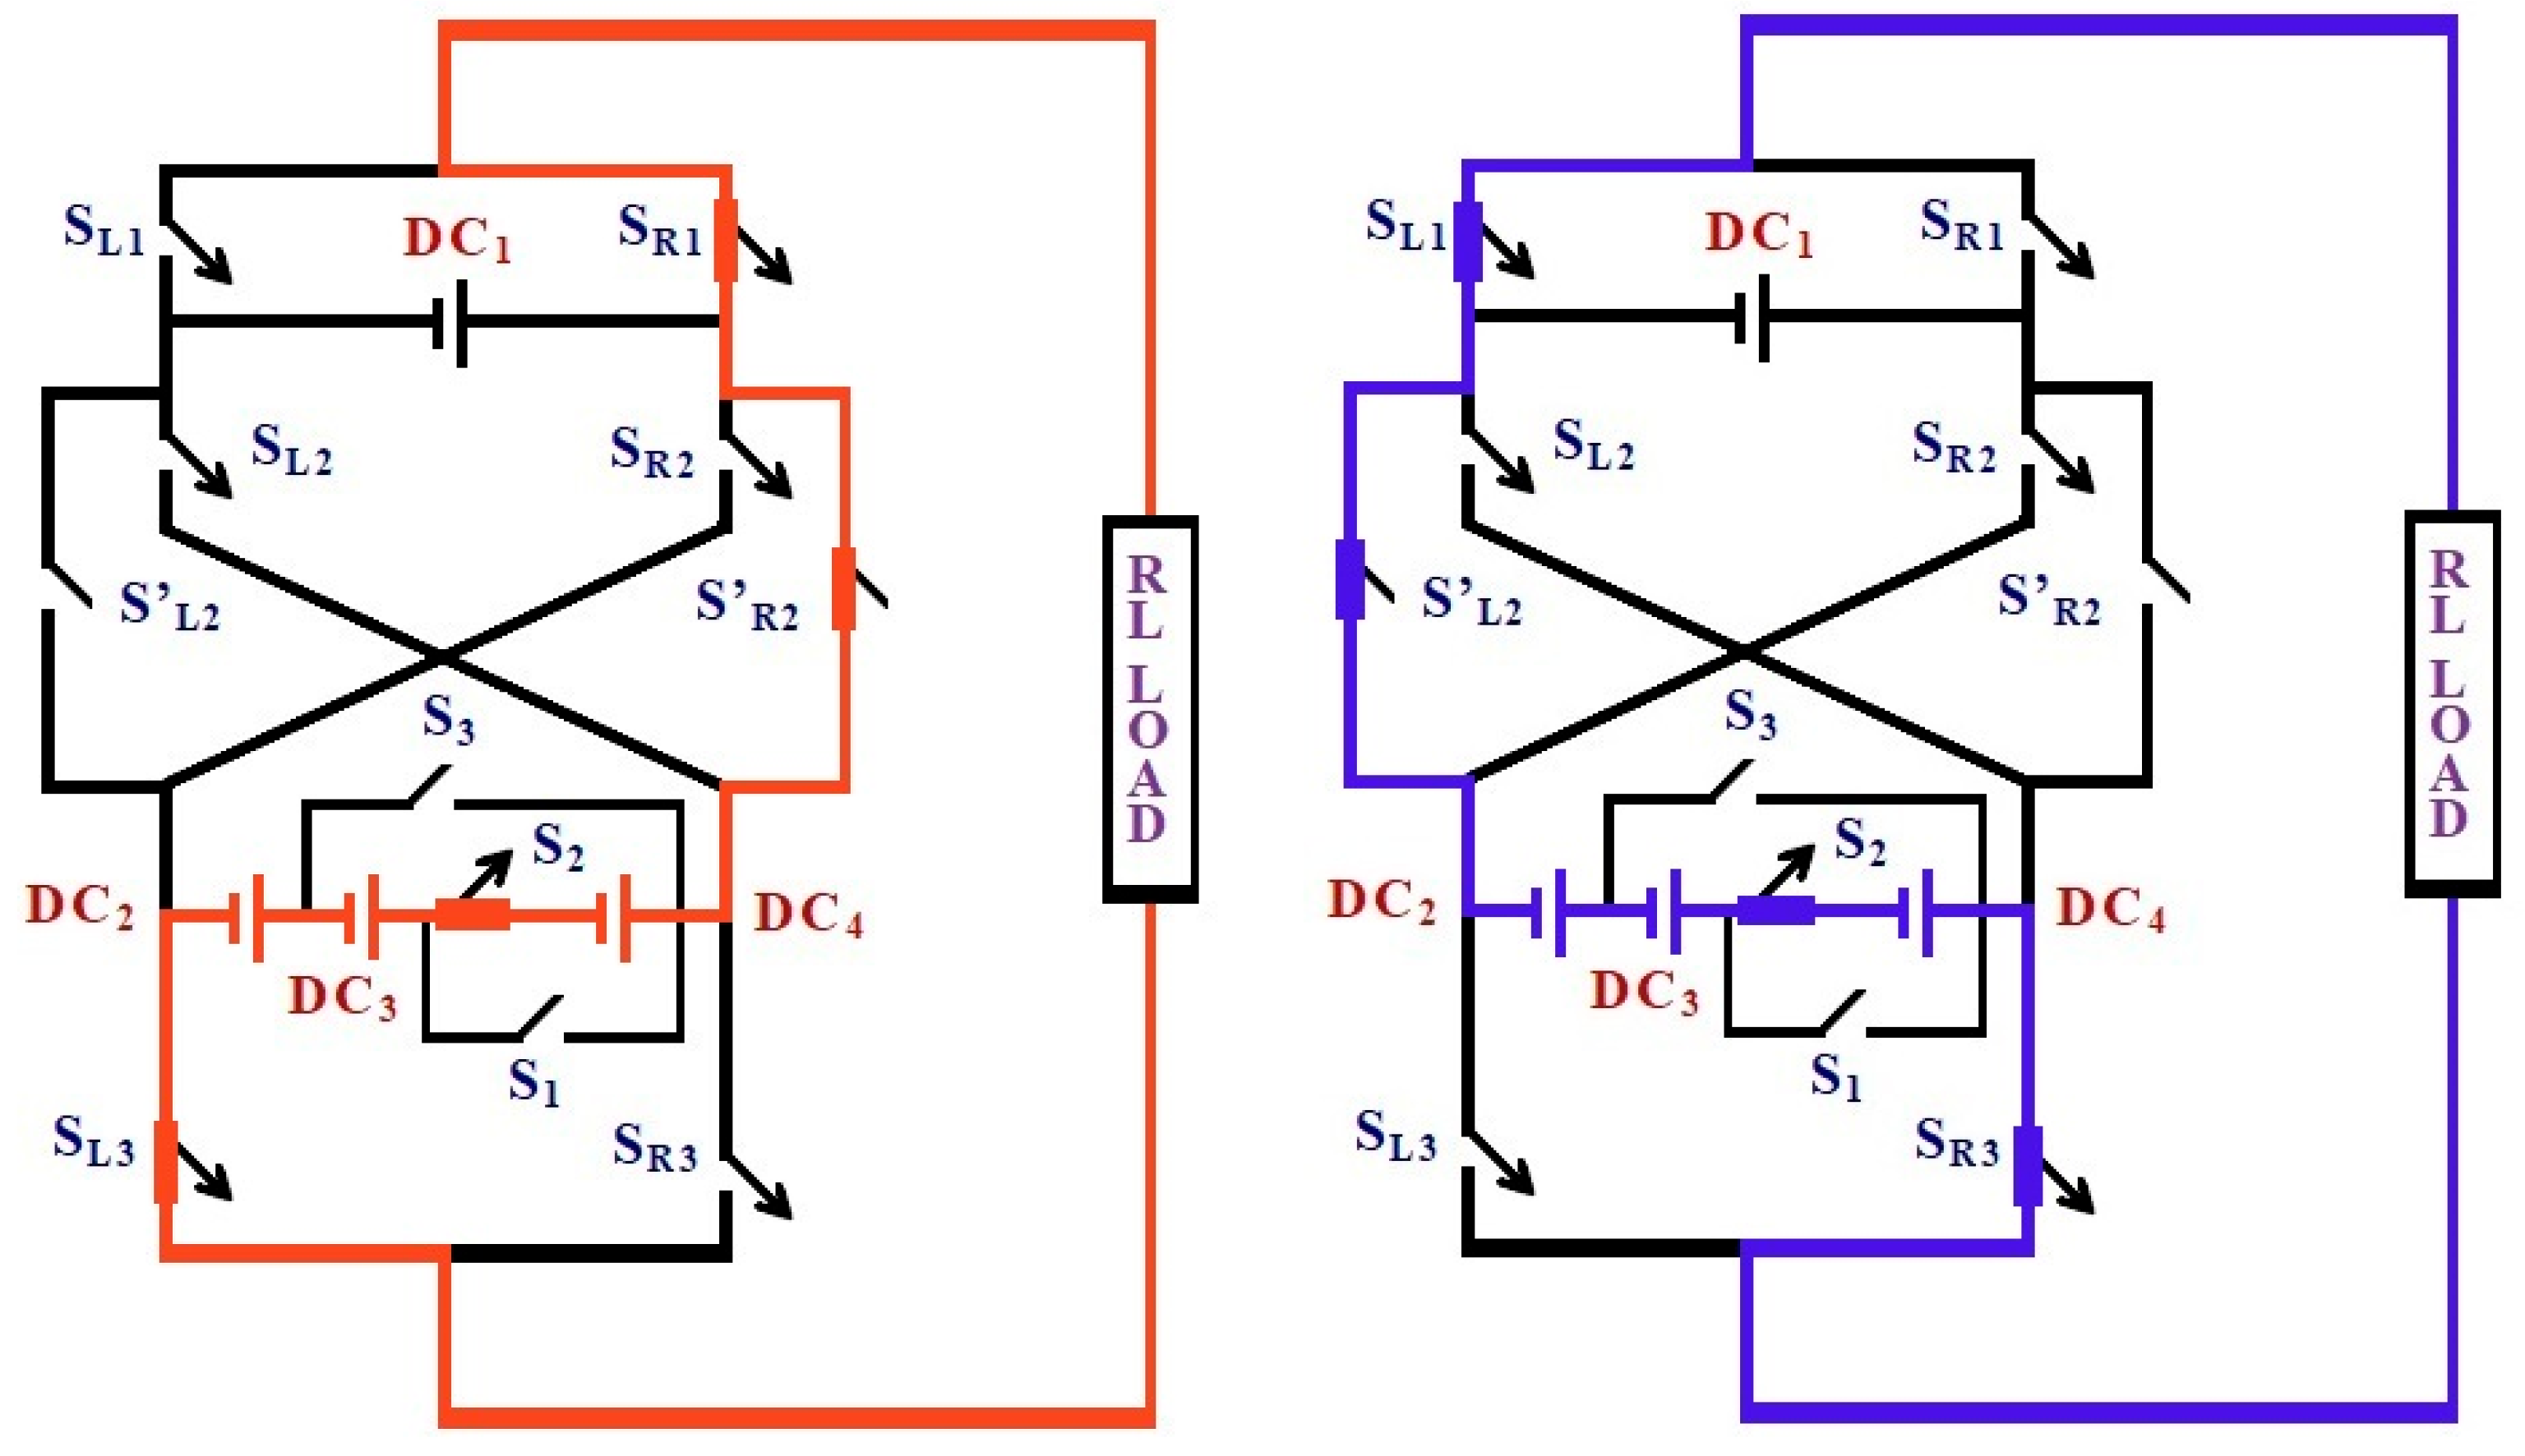
Switching state for the output voltage level ± (DC2 + DC3 − DC1). Conduction path for zero (neutral)-voltage level. The complementary leg switches S′L and S′R operate simultaneously, forming a short-circuited current loop within the inverter, maintaining load current continuity without producing an output voltage. Red color flow (left diagram) denotes the current conduction path for the positive output voltage level (+VDC1). Blue color flow (right diagram) denotes the current conduction path for the negative output voltage level (−VDC1).
Figure 8.
Switching state for the output voltage level ± (DC2 + DC3) and current conduction path for the negative voltage level −VDC1. The corresponding lower-leg switches SL1, S′R2, and SR3 are ON. The load current flows in the reverse direction through DC1 and anti-parallel diodes, ensuring a symmetrical negative output. Red color flow (left diagram) denotes the current conduction path for the positive output voltage level (+VDC1). Blue color flow (right diagram) denotes the current conduction path for the negative output voltage level (−VDC1).
Figure 9.
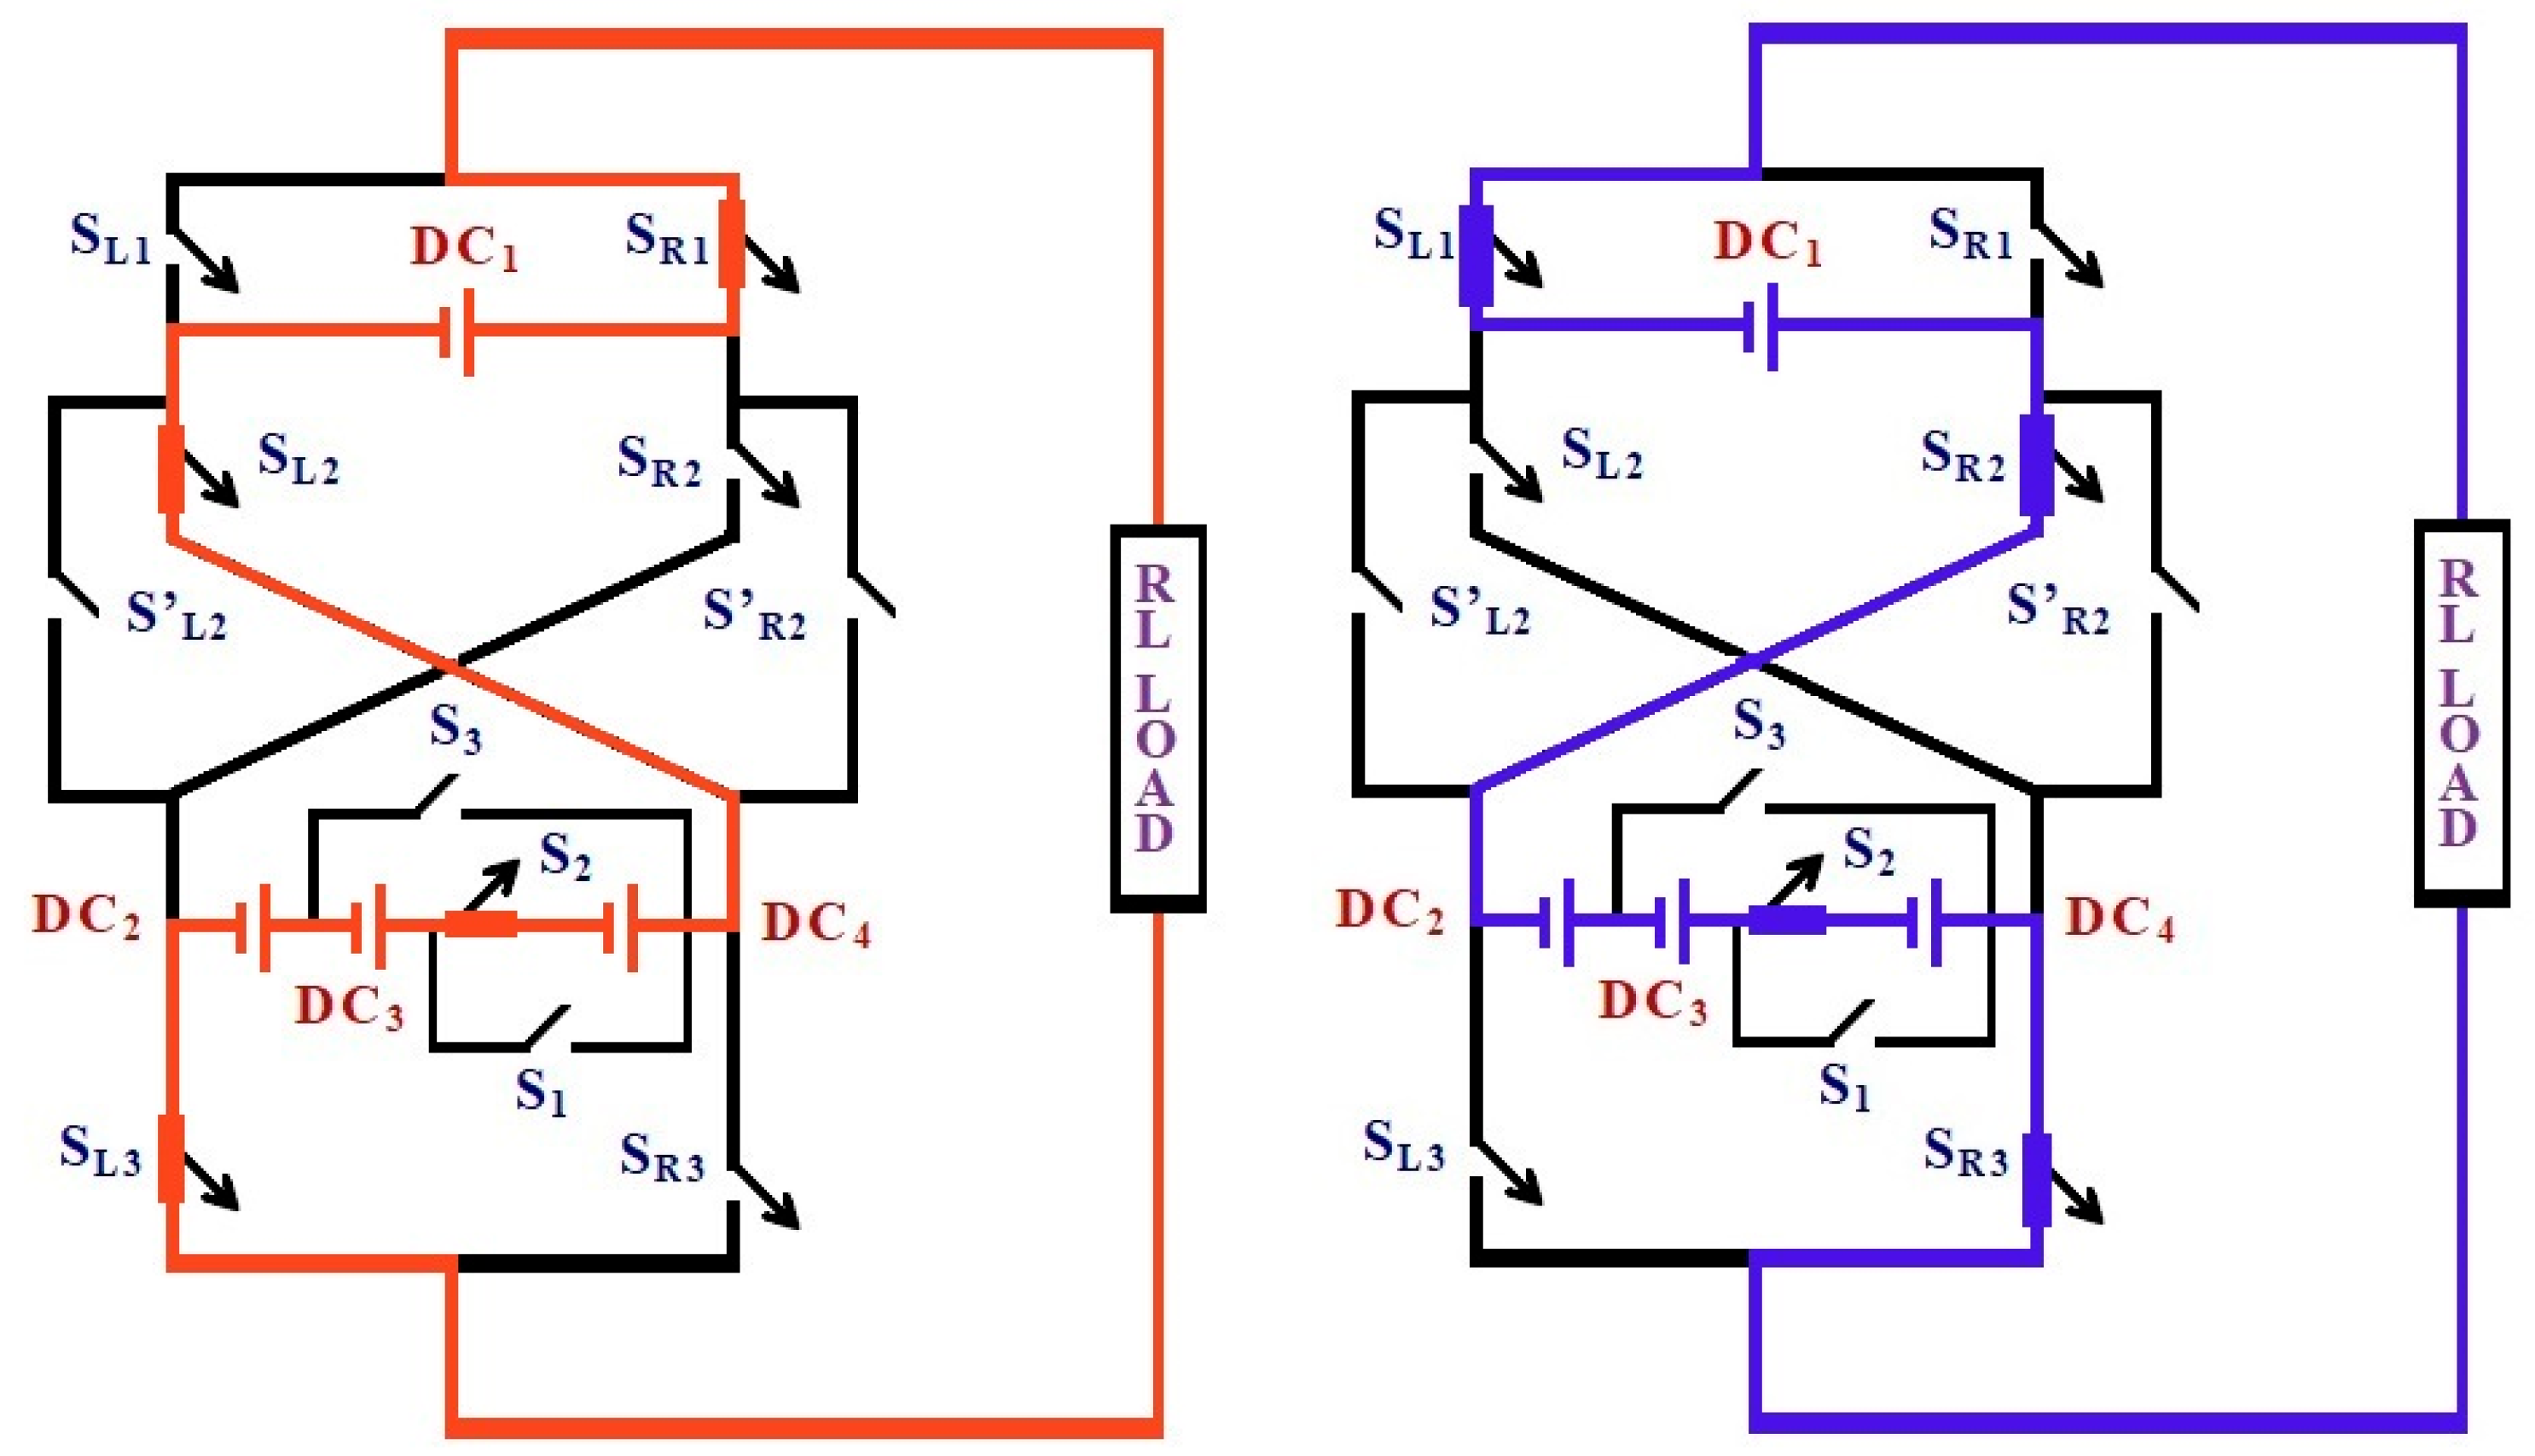
Switching state for the output voltage level ± (DC2 + DC3 + DC1) and conduction path for negative intermediate level −(VDC2 − VDC1). Switches SL1, S′R2, SL3, and S3 are ON, connecting DC2 in reverse polarity relative to the load. Red color flow (left diagram) denotes the current conduction path for the positive output voltage level (+VDC1). Blue color flow (right diagram) denotes the current conduction path for the negative output voltage level (−VDC1).
Figure 10.
Switching state for the output voltage level ± (DC2 + DC3 + DC4 − DC1) and conduction path for −(VDC2 + VDC3 − VDC1). Switches SL1, S′L2, SR3, and S1 conduct, producing the additive negative level across the load. Red color flow (left diagram) denotes the current conduction path for the positive output voltage level (+VDC1). Blue color flow (right diagram) denotes the current conduction path for the negative output voltage level (−VDC1).
Figure 11.
Switching state for the output voltage level ± (DC2 + DC3 + DC4) and switching configuration for the maximum negative level −(VDC1 + VDC2 + VDC3). Switches SL1, S′L2, SL3, and S1 are ON. This represents the mirror image of the highest positive level. Red color flow (left diagram) denotes the current conduction path for the positive output voltage level (+VDC1). Blue color flow (right diagram) denotes the current conduction path for the negative output voltage level (−VDC1).
Figure 12.
Switching state for the output voltage level ± (DC2+ DC3+ DC4+ DC1) and generalized switching sequence diagram summarizing all conduction states of the proposed RCC-MLI for one fundamental cycle. The figure highlights symmetry between positive and negative half-cycles and the reduced number of active switches per step (only four at any time). Red color flow (left diagram) denotes the current conduction path for the positive output voltage level (+VDC1). Blue color flow (right diagram) denotes the current conduction path for the negative output voltage level (−VDC1).
Figure 13.
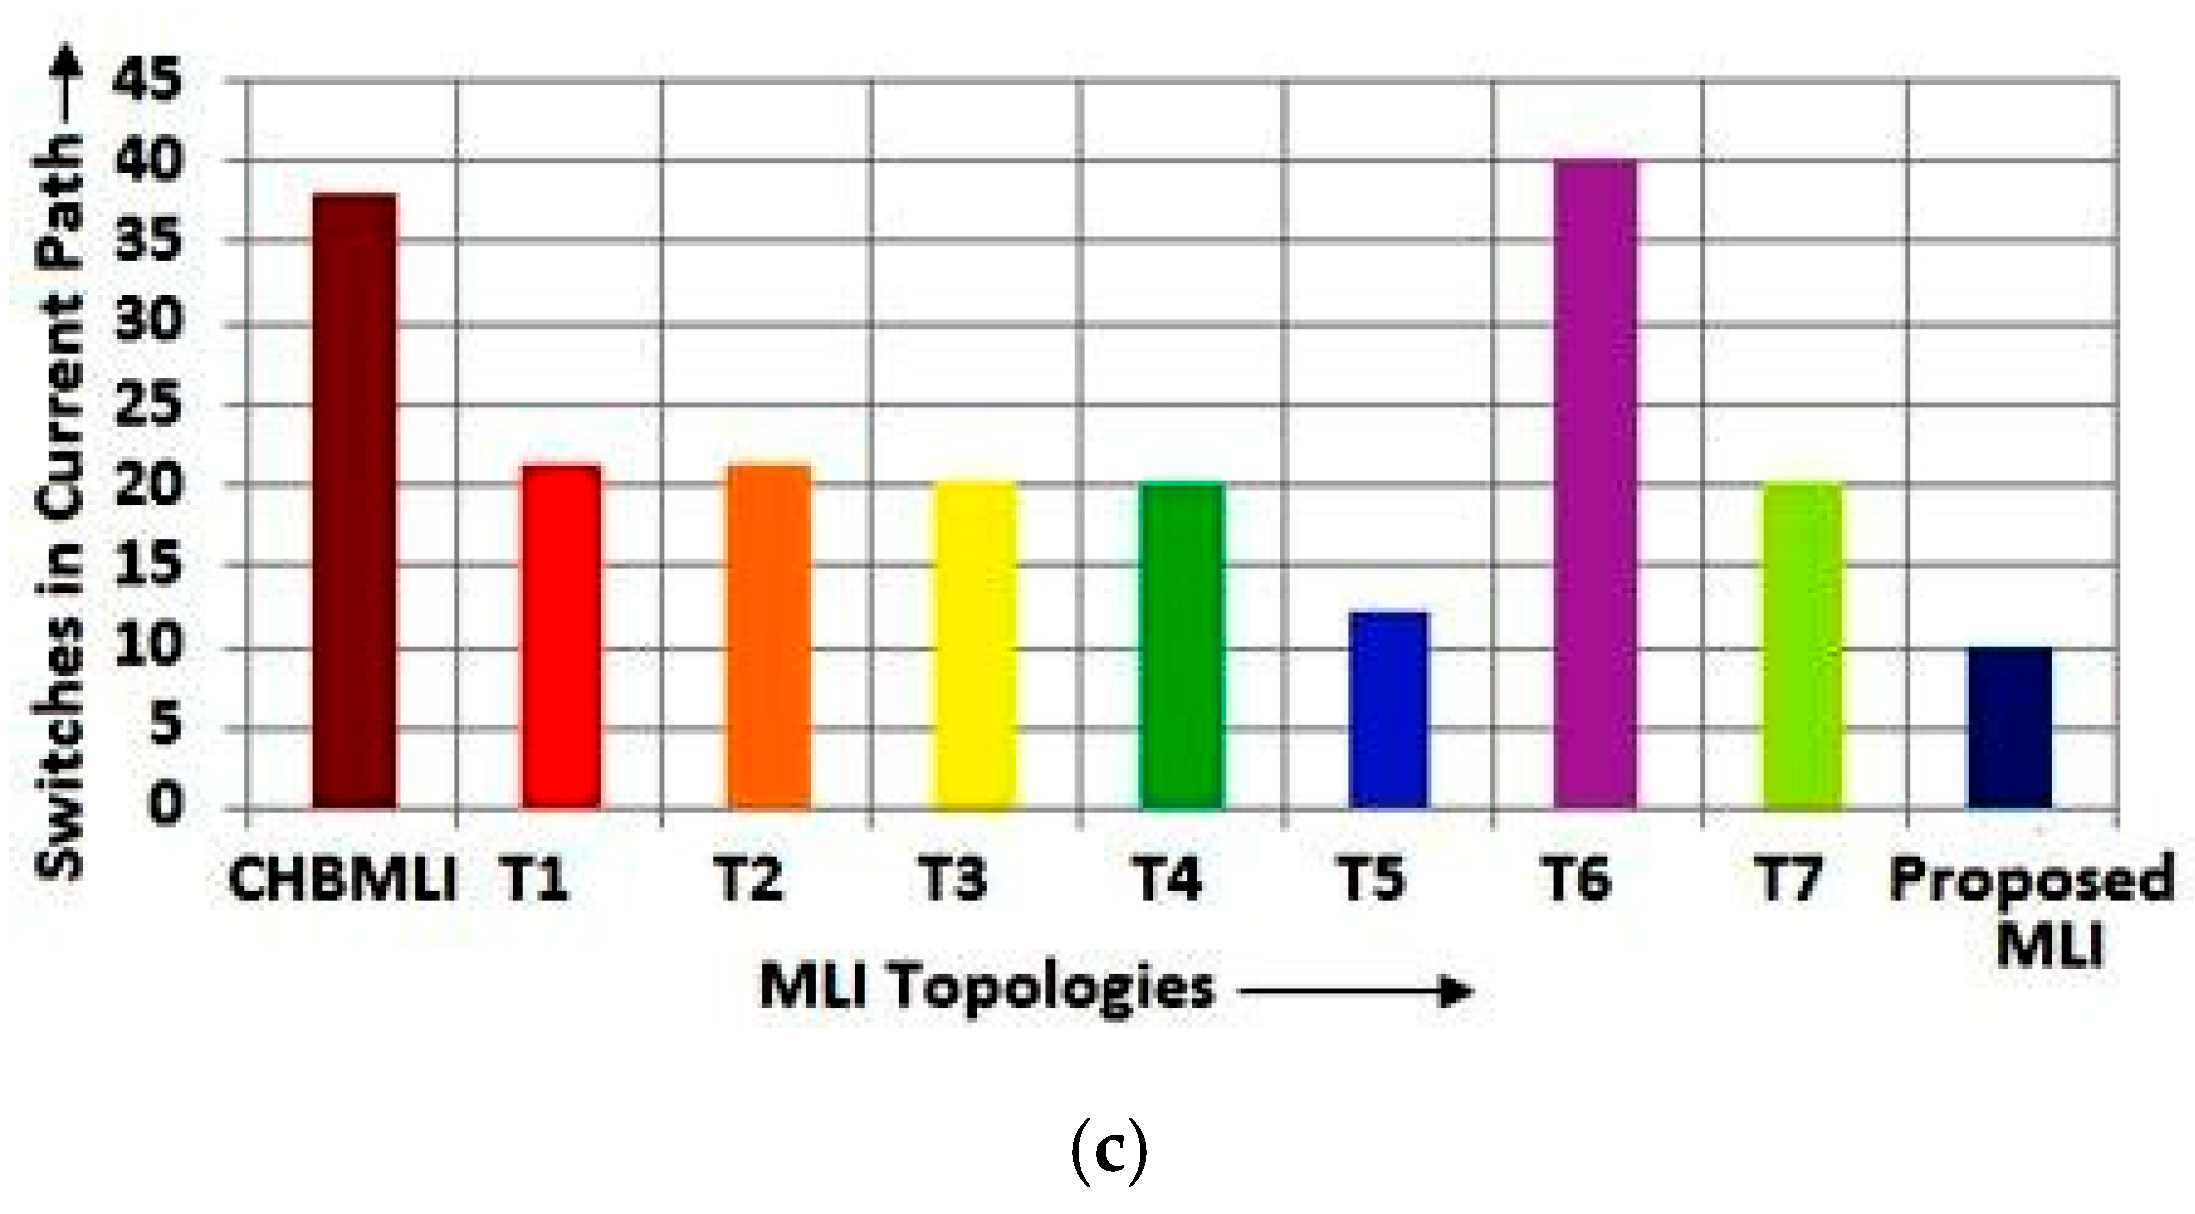
Comparison chart in terms of (a) switches, (b) gate drivers, and (c) current-conducting switches for a 75-level inverter.
Figure 13.
Comparison chart in terms of (a) switches, (b) gate drivers, and (c) current-conducting switches for a 75-level inverter.
Figure 14.
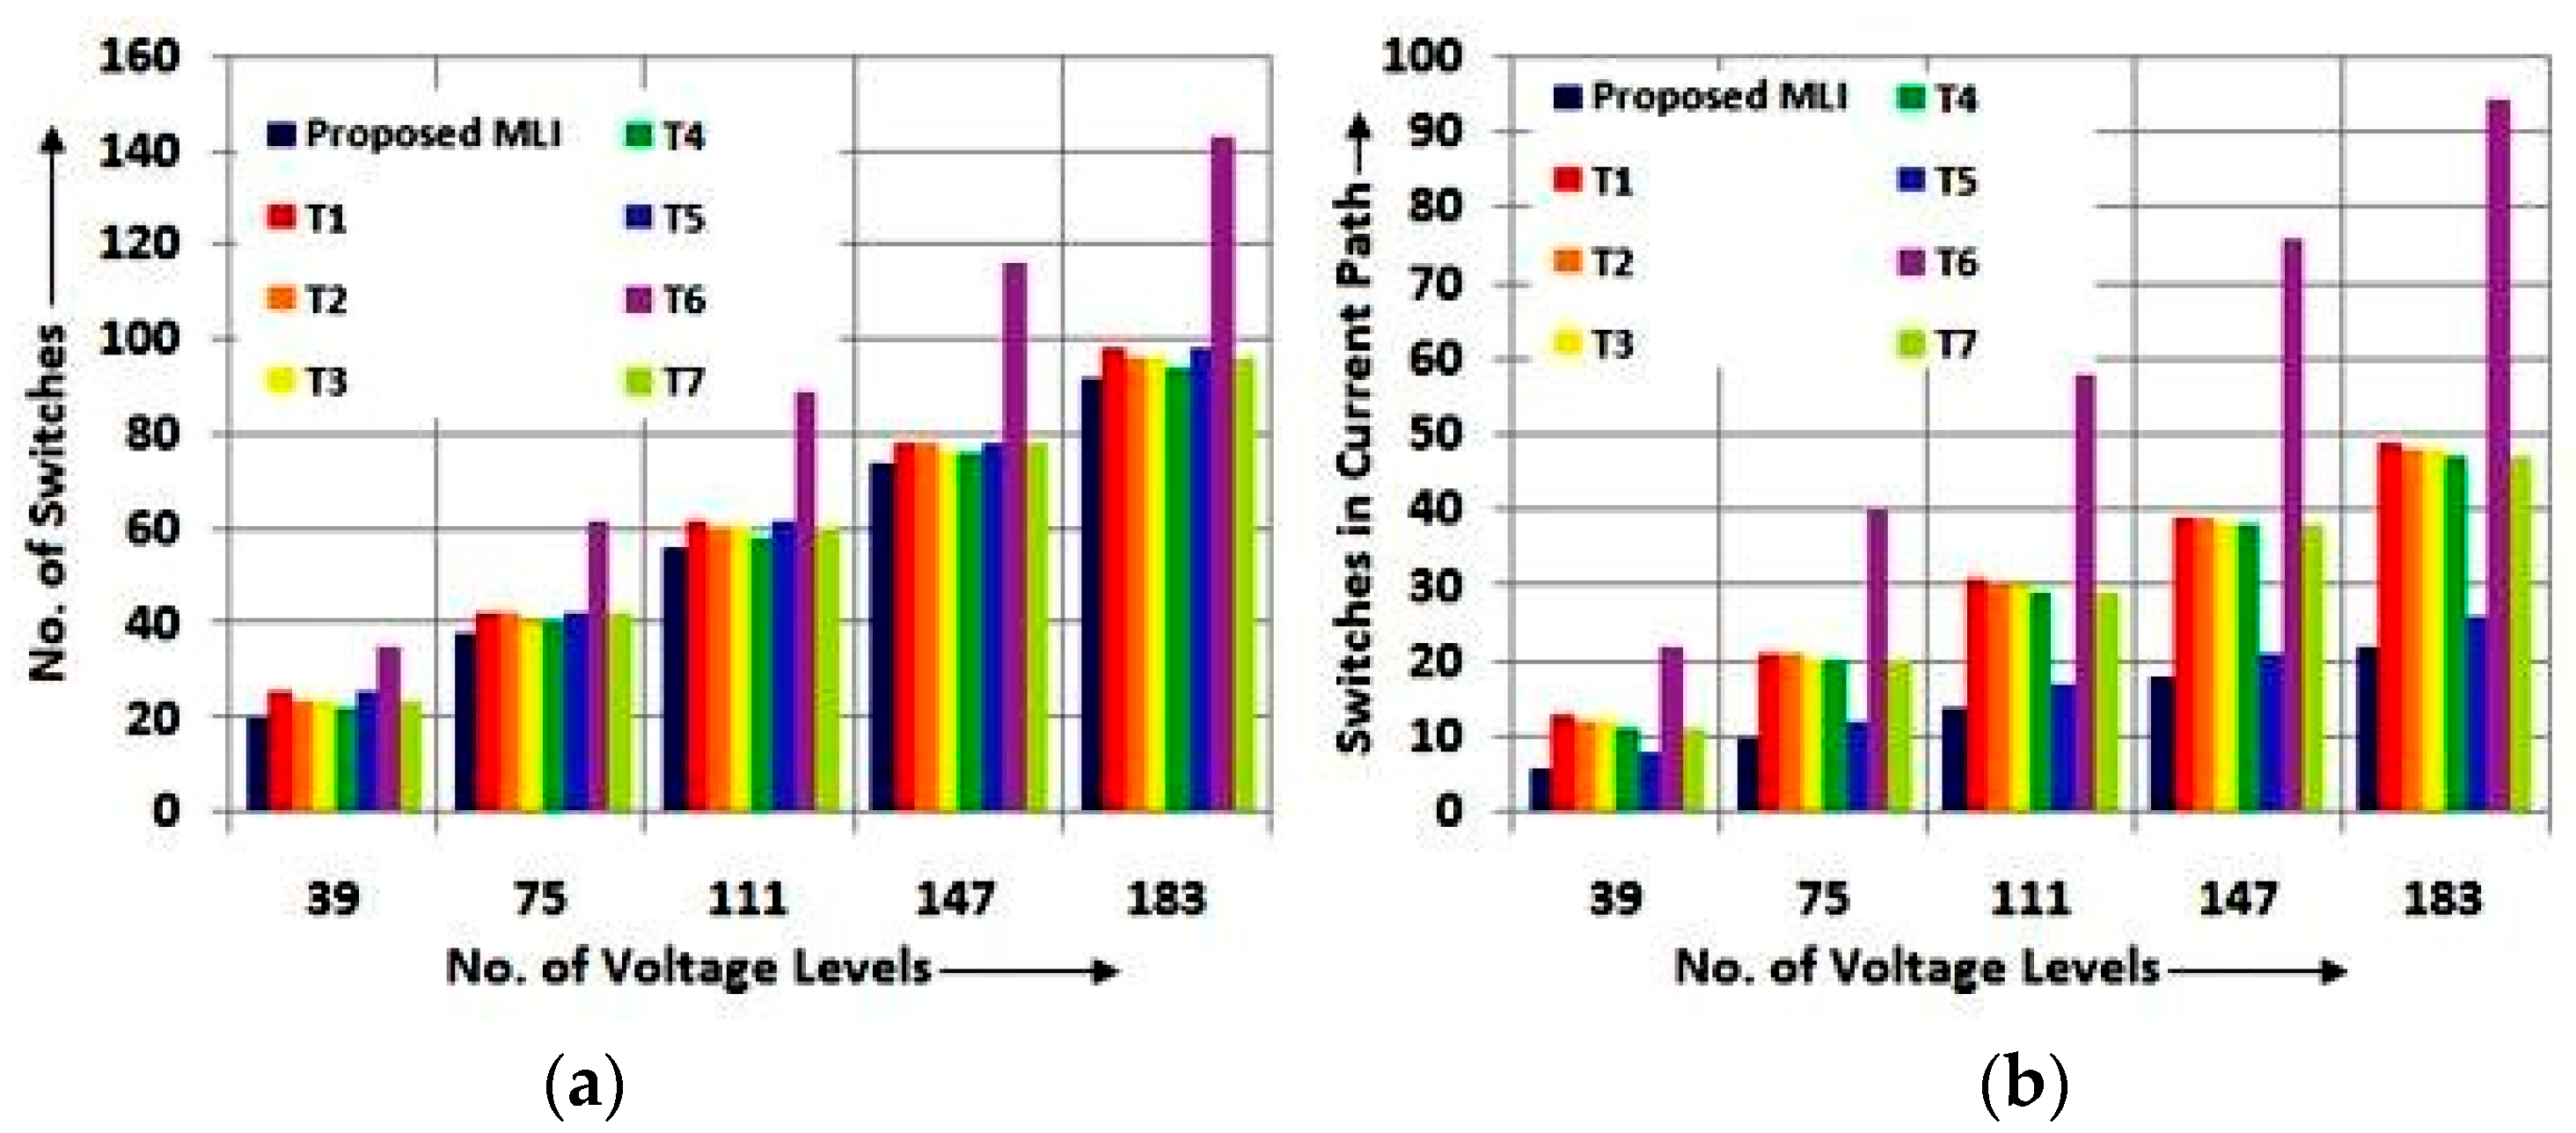
Comparison chart in terms of (a) switches and (b) current-conducting switches for variations in voltage levels.
Figure 14.
Comparison chart in terms of (a) switches and (b) current-conducting switches for variations in voltage levels.
Figure 15.
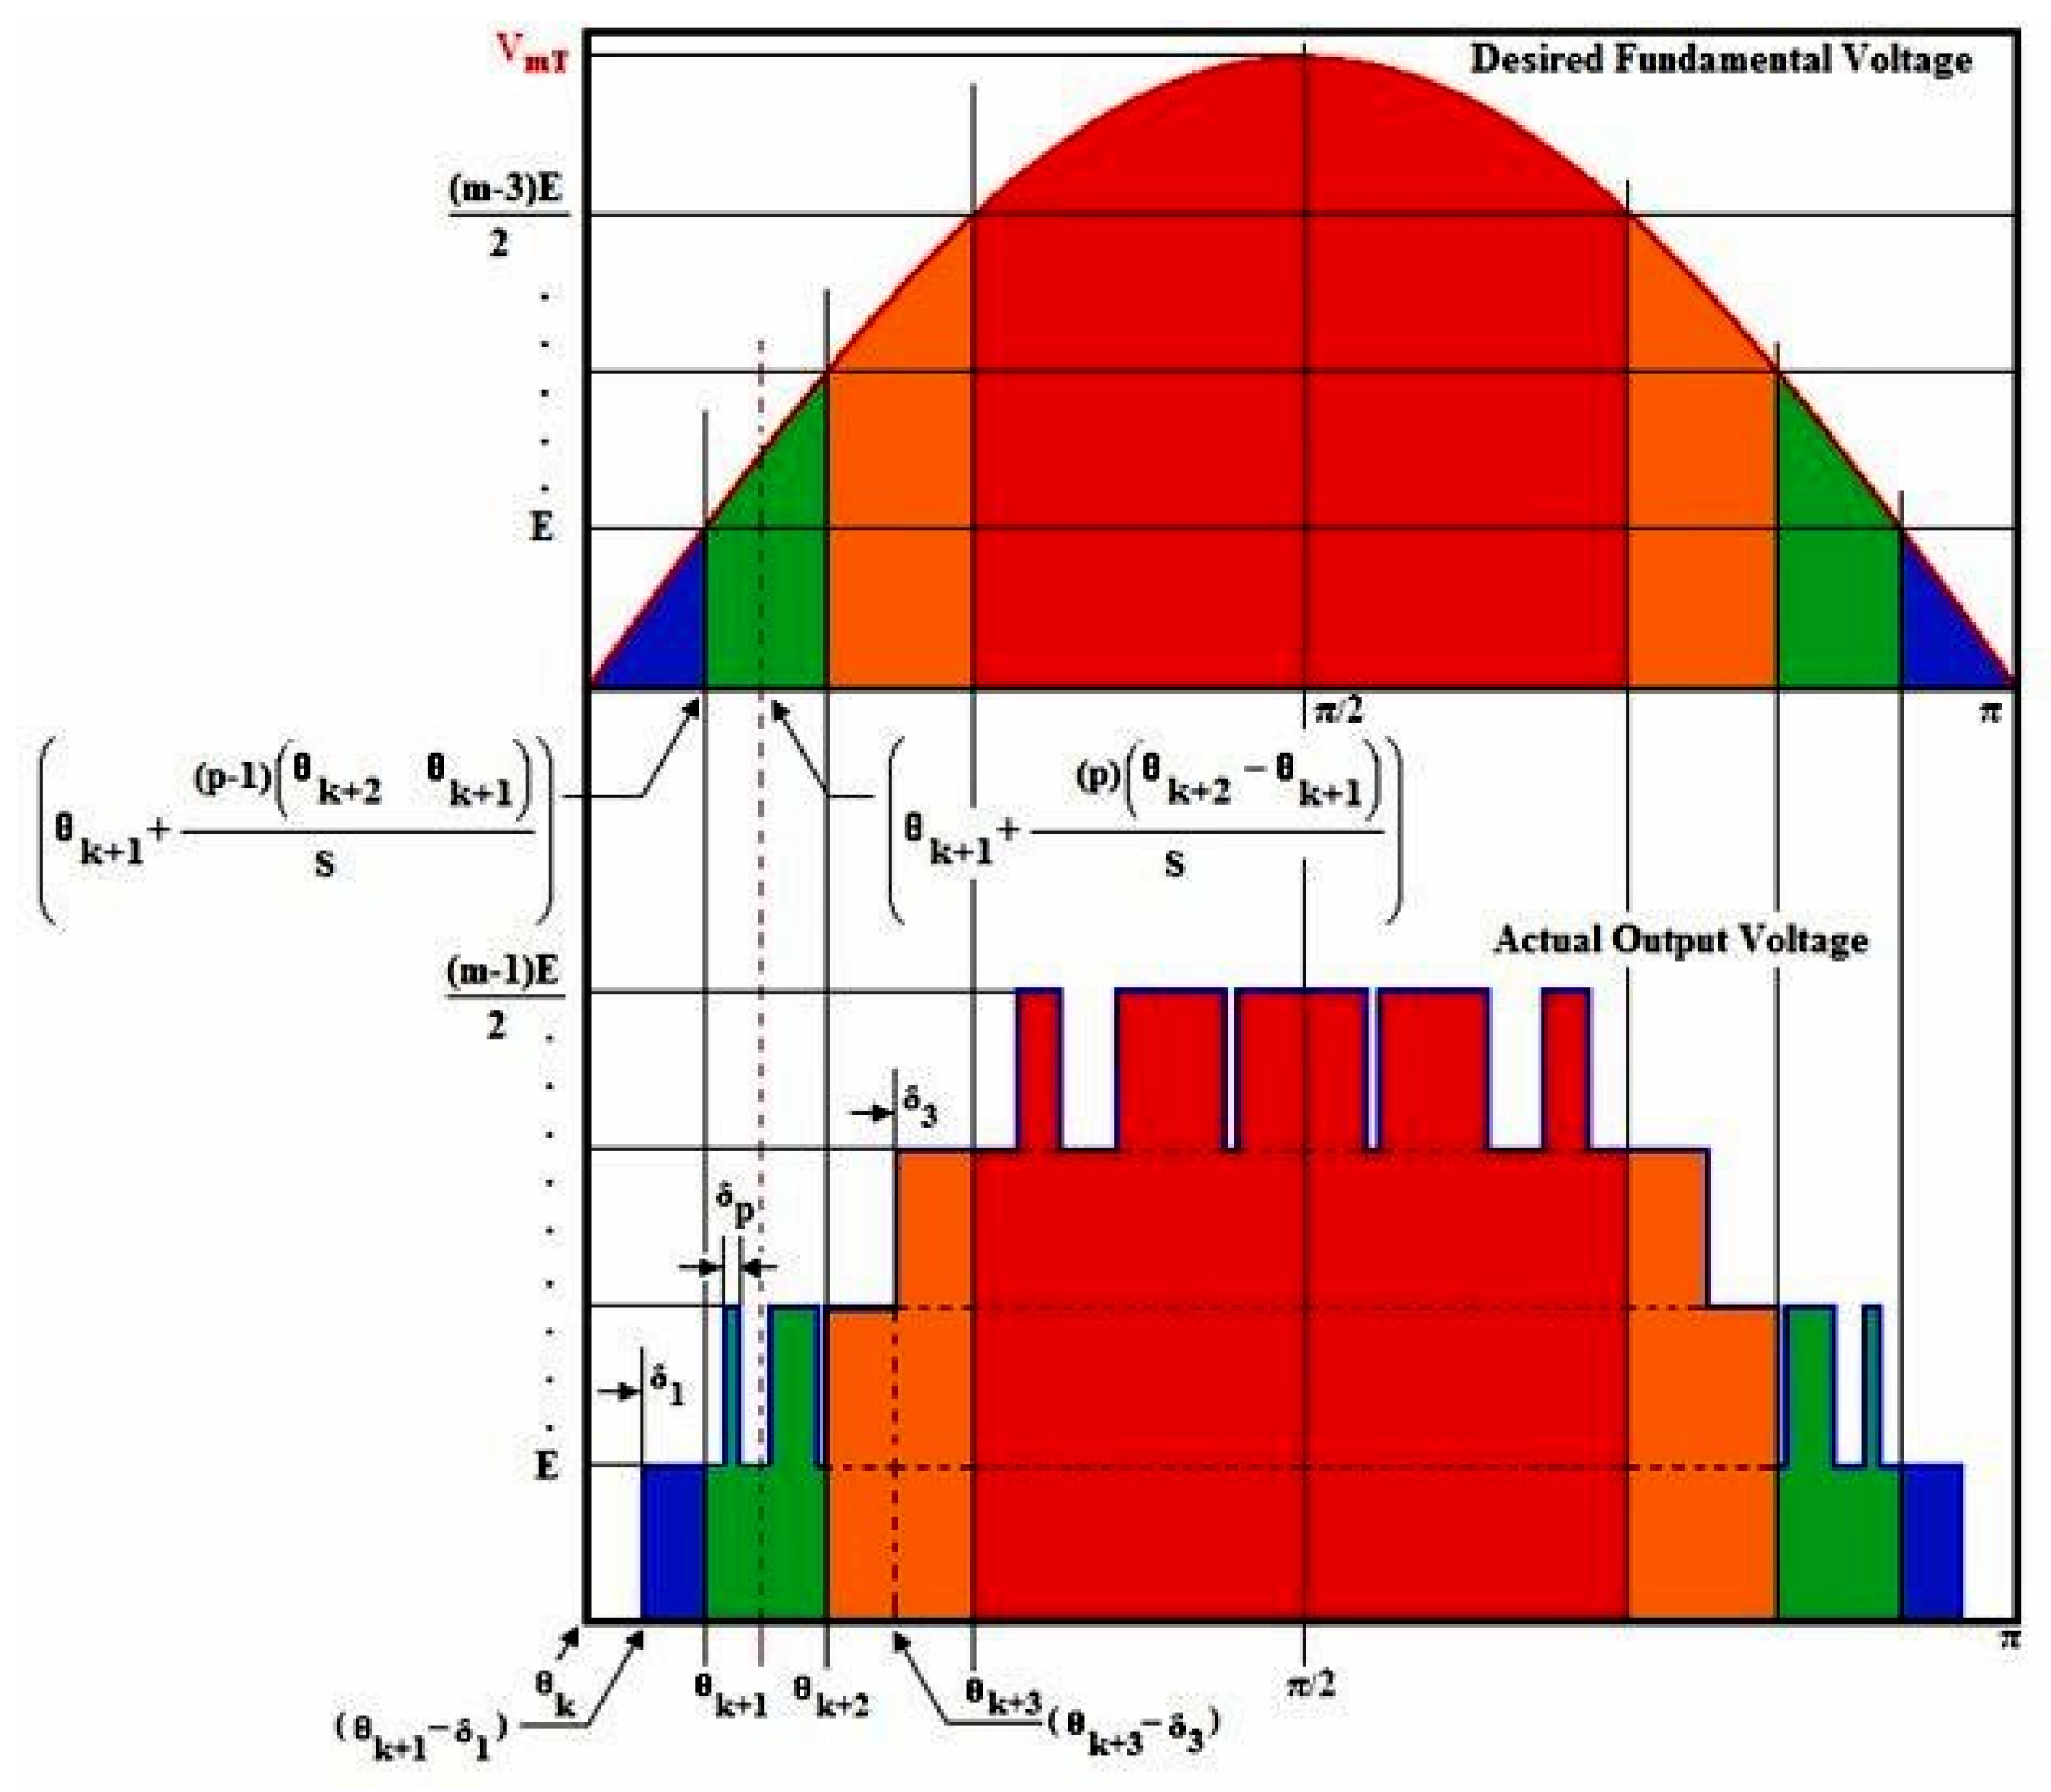
Hybrid PWM strategy-amalgamated AEFSPWM.
Figure 15.
Hybrid PWM strategy-amalgamated AEFSPWM.
Figure 16.
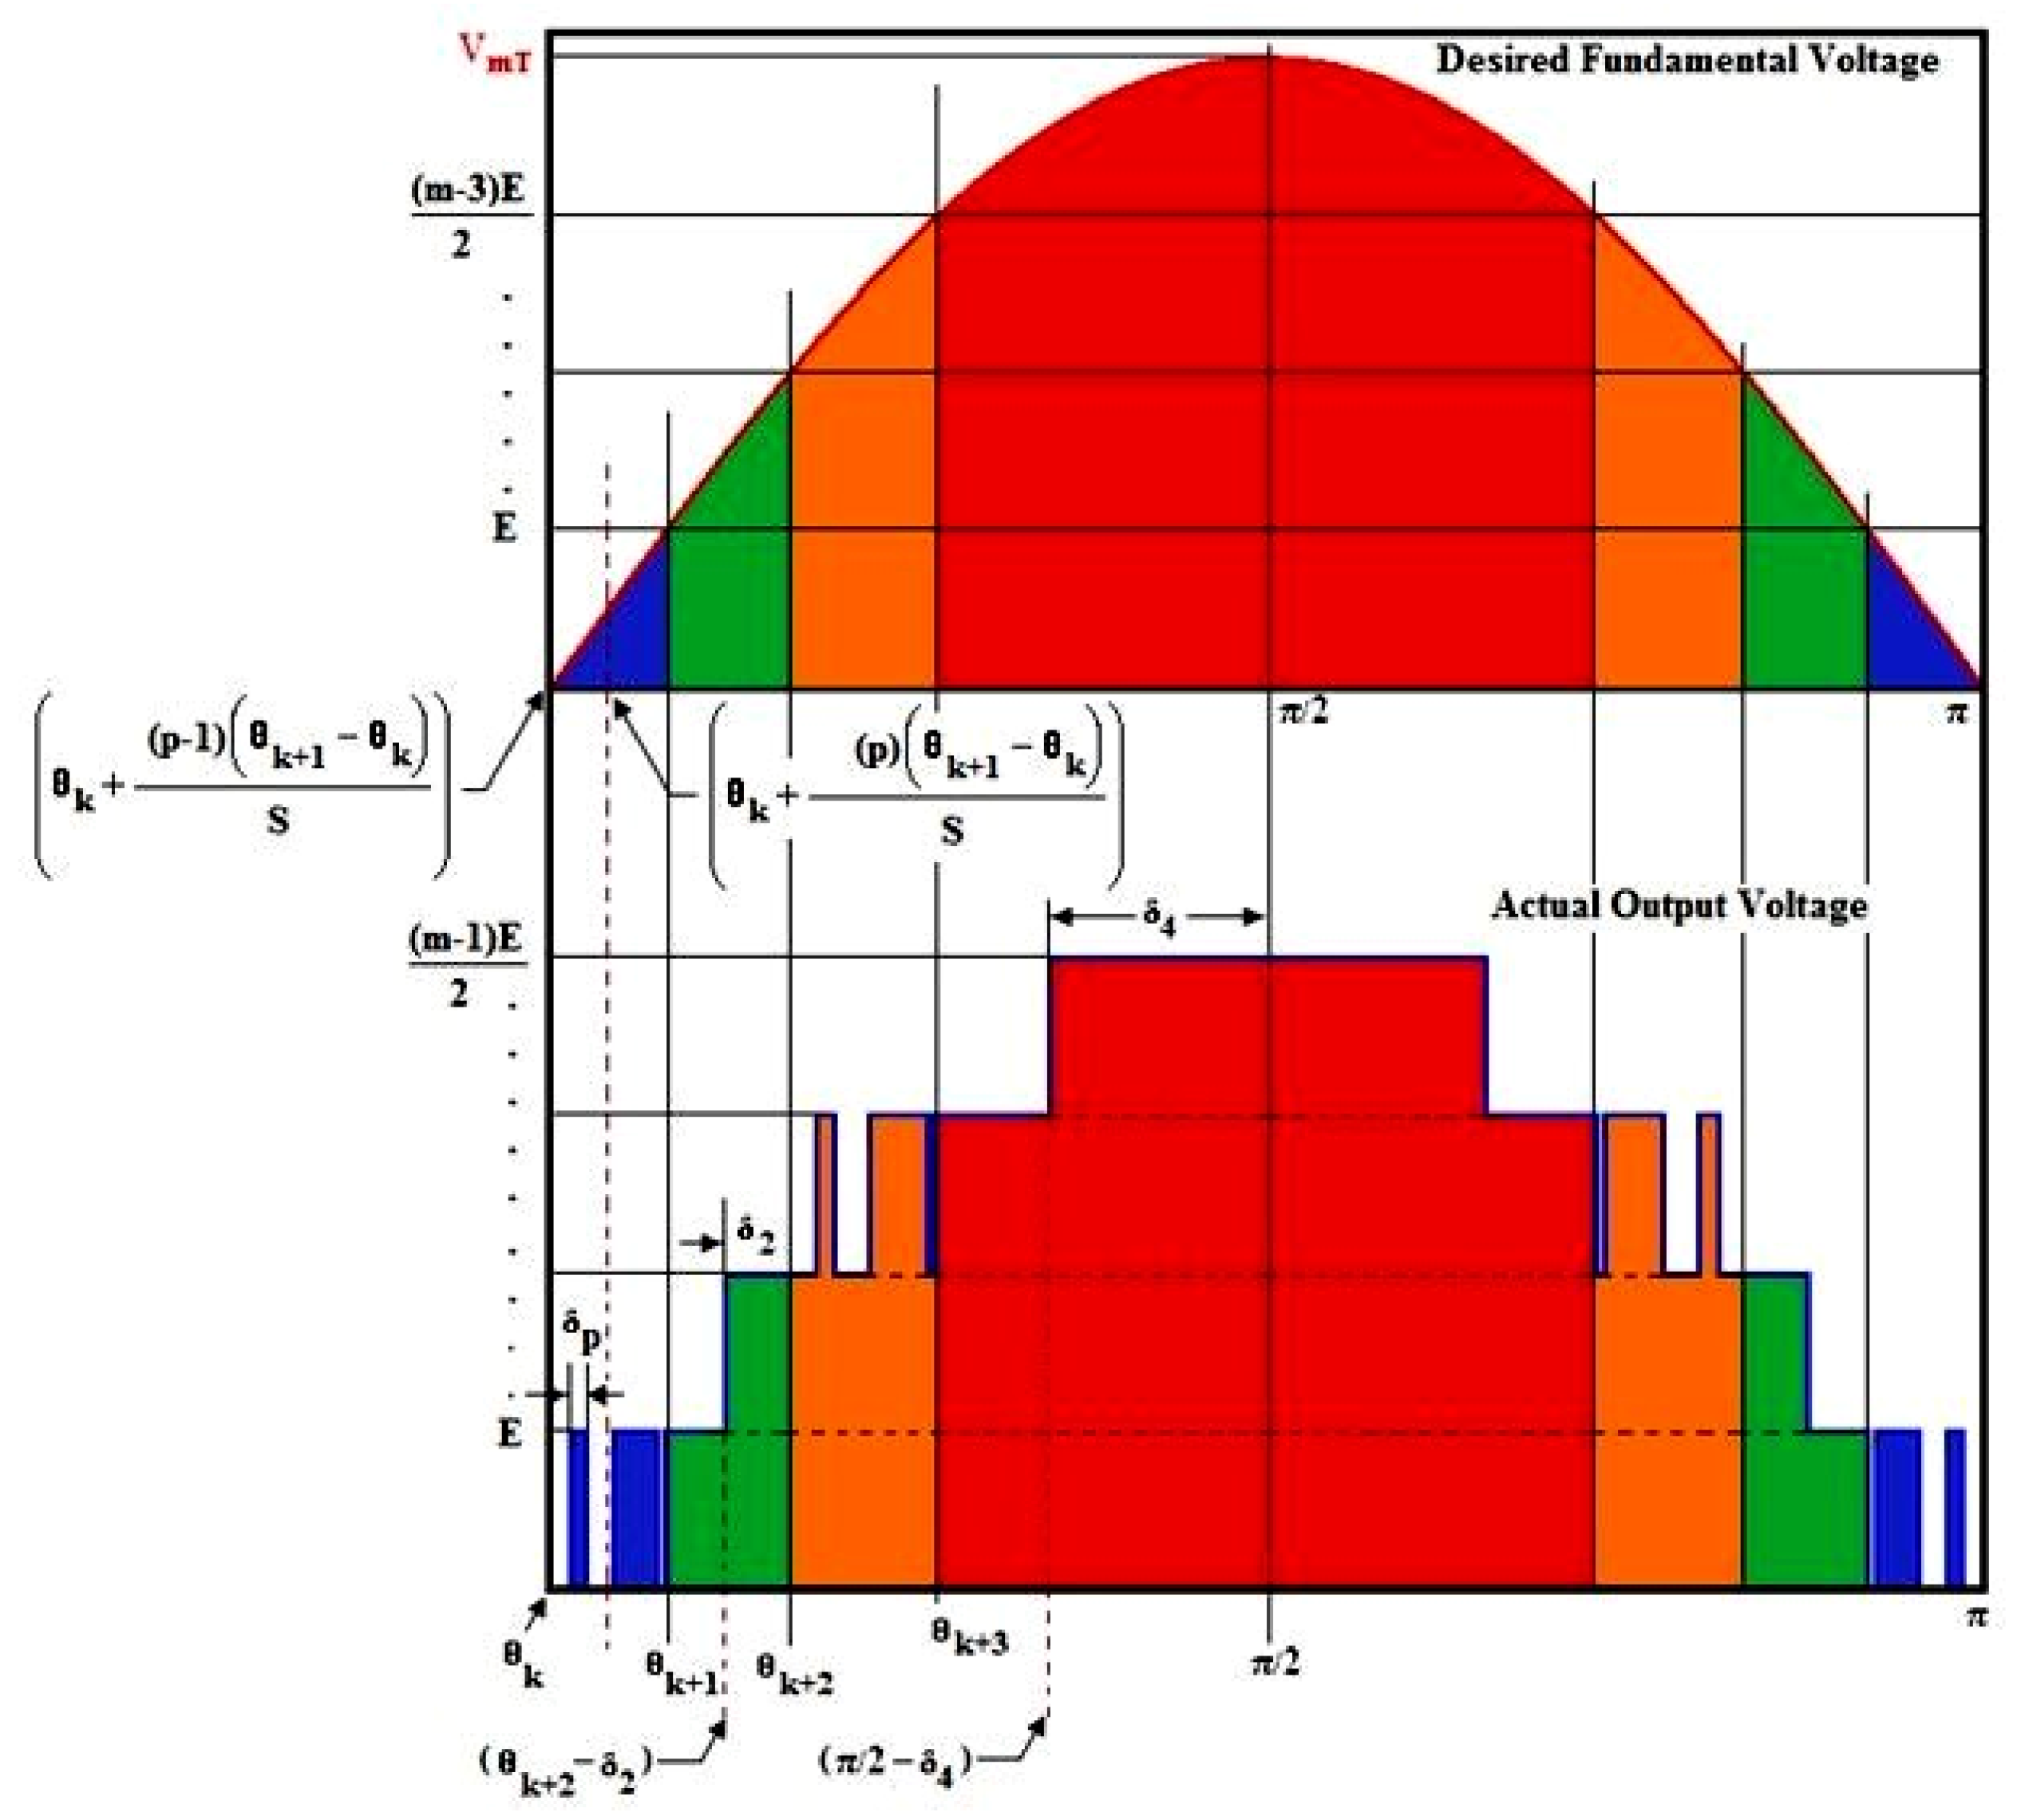
Hybrid PWM strategy-amalgamated FSAEPWM.
Figure 16.
Hybrid PWM strategy-amalgamated FSAEPWM.
Figure 17.
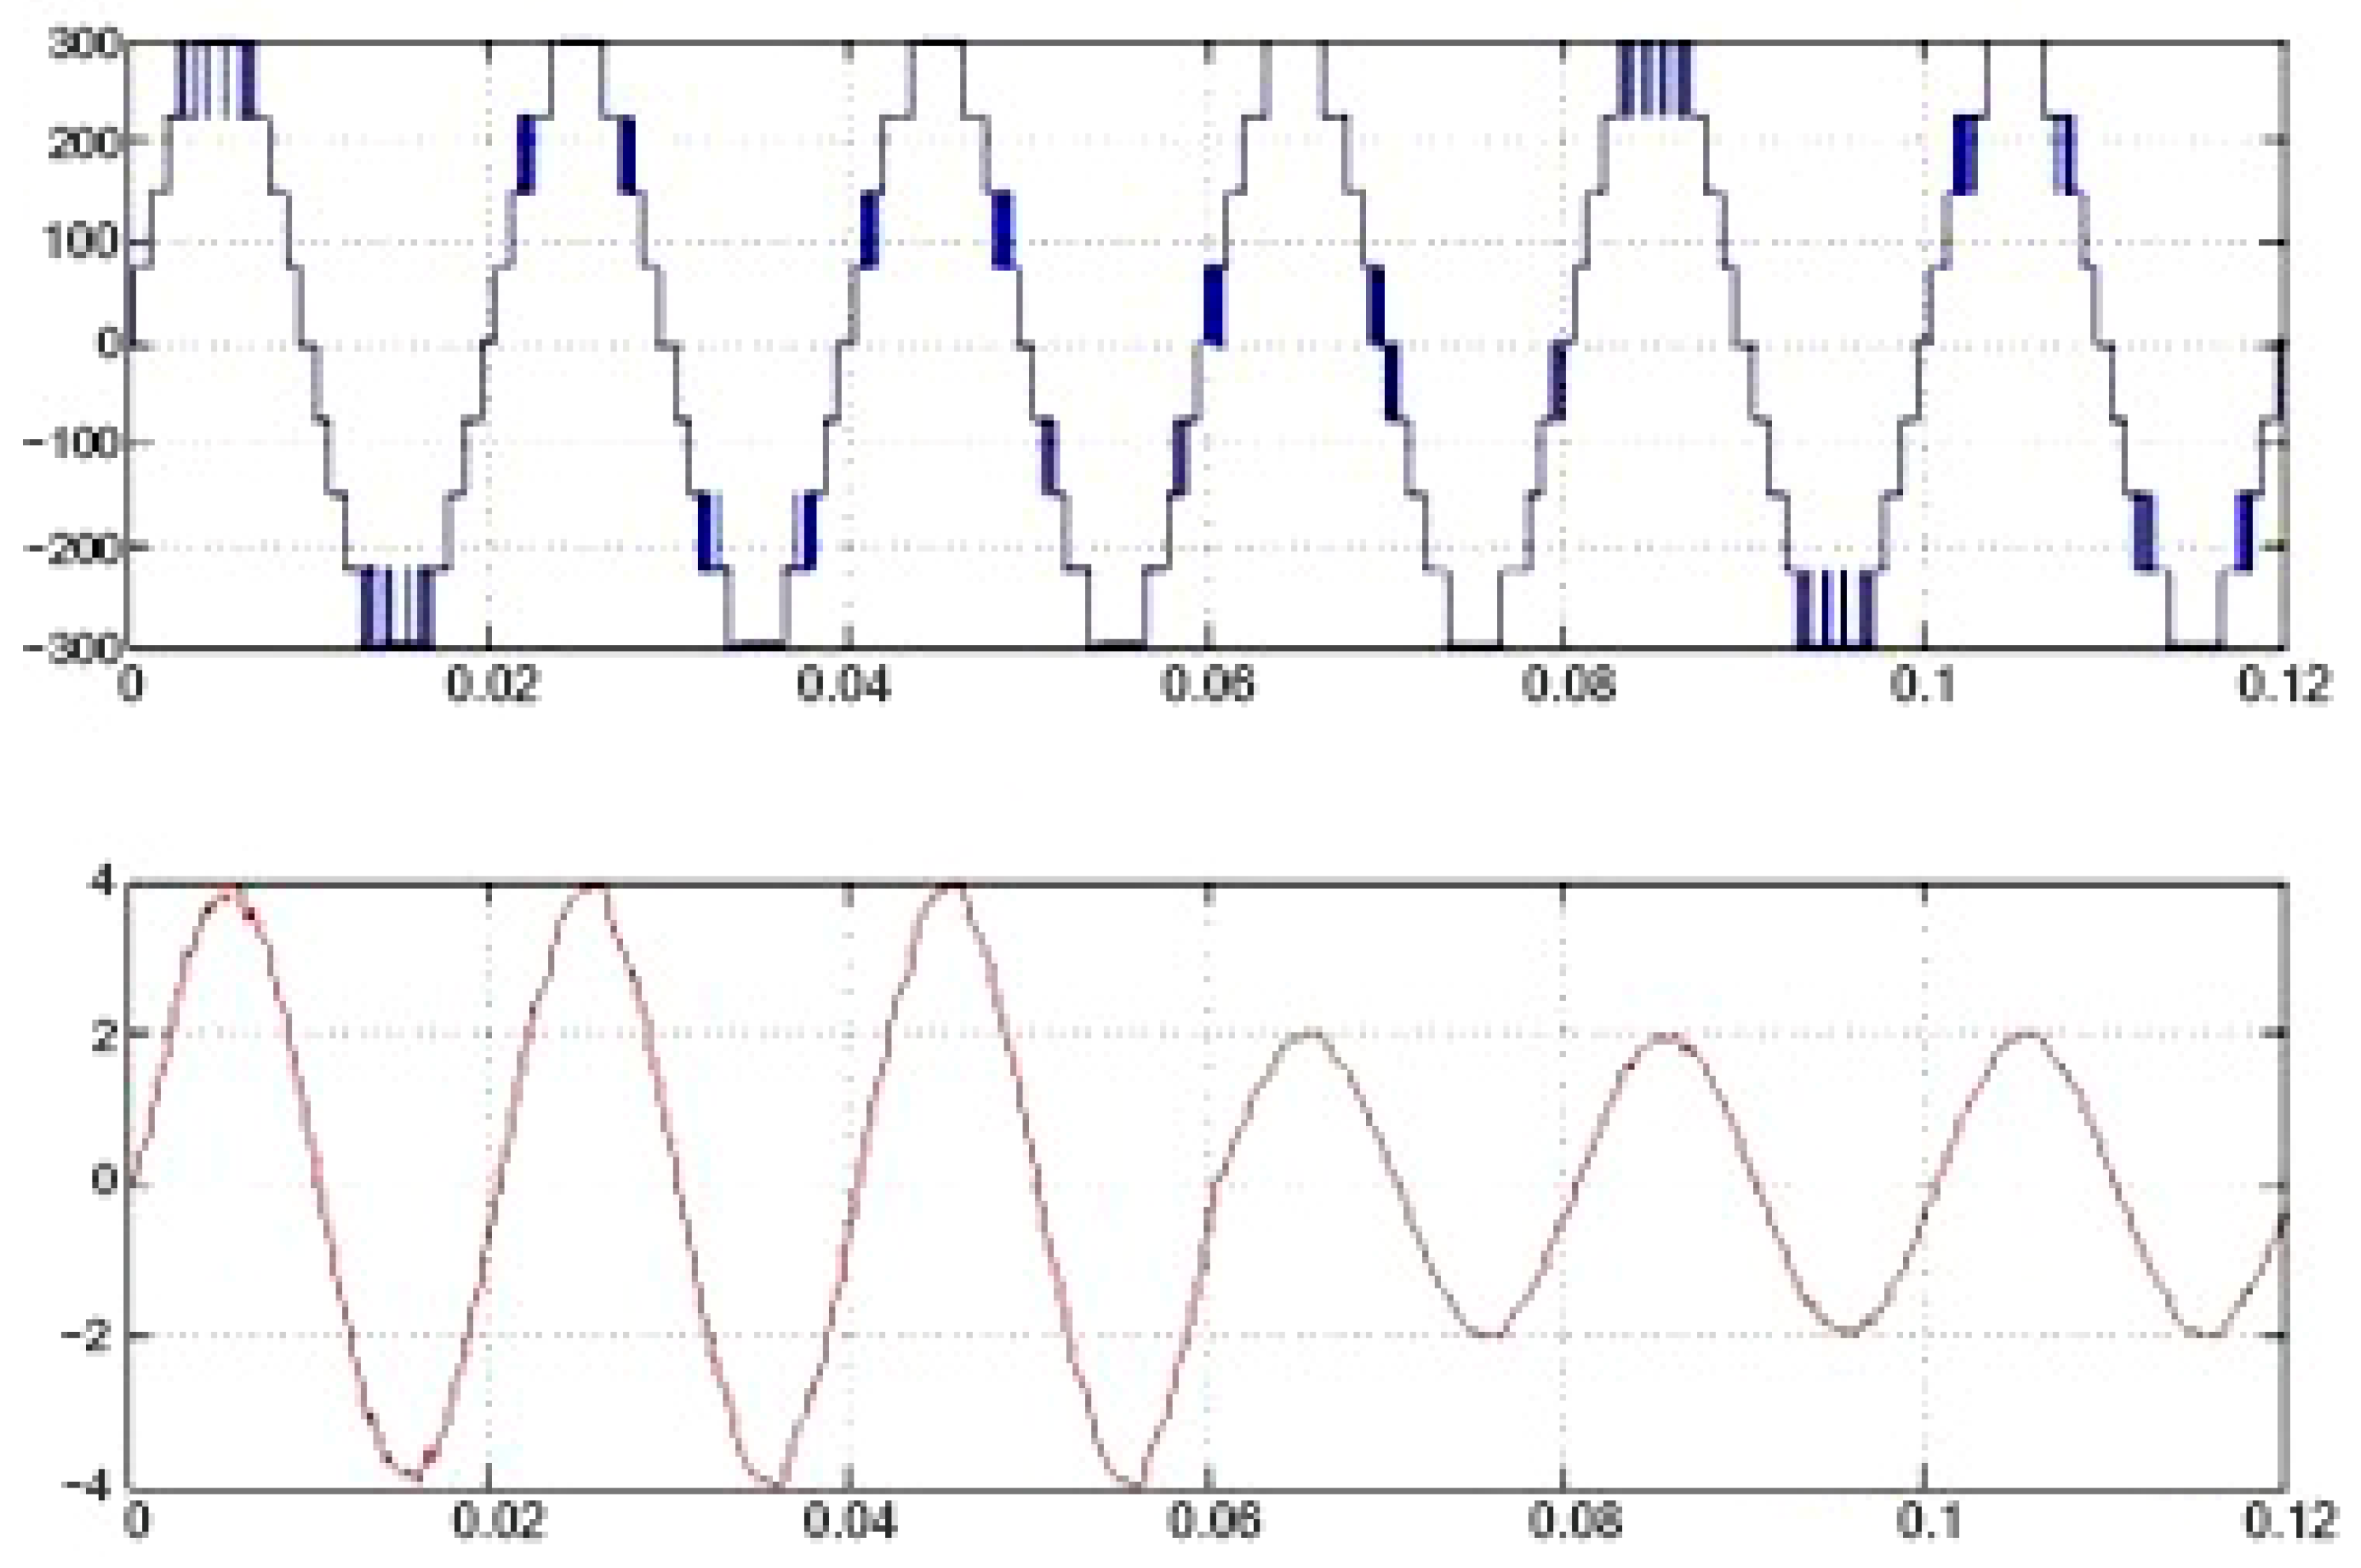
Dynamic performance.
Figure 17.
Dynamic performance.
Figure 18.
Simulated output voltage waveform of the proposed inverter showing 21 distinct levels. The voltage steps are evenly distributed with minimized harmonic distortion. The inset shows the corresponding switching states for one cycle.
Figure 18.
Simulated output voltage waveform of the proposed inverter showing 21 distinct levels. The voltage steps are evenly distributed with minimized harmonic distortion. The inset shows the corresponding switching states for one cycle.
Figure 19.
Simulated output current waveform for a resistive–inductive (R–L) load. The waveform confirms smooth current transitions and continuous conduction without interruption, demonstrating the effectiveness of bidirectional switches and anti-parallel diodes.
Figure 19.
Simulated output current waveform for a resistive–inductive (R–L) load. The waveform confirms smooth current transitions and continuous conduction without interruption, demonstrating the effectiveness of bidirectional switches and anti-parallel diodes.
Figure 20.
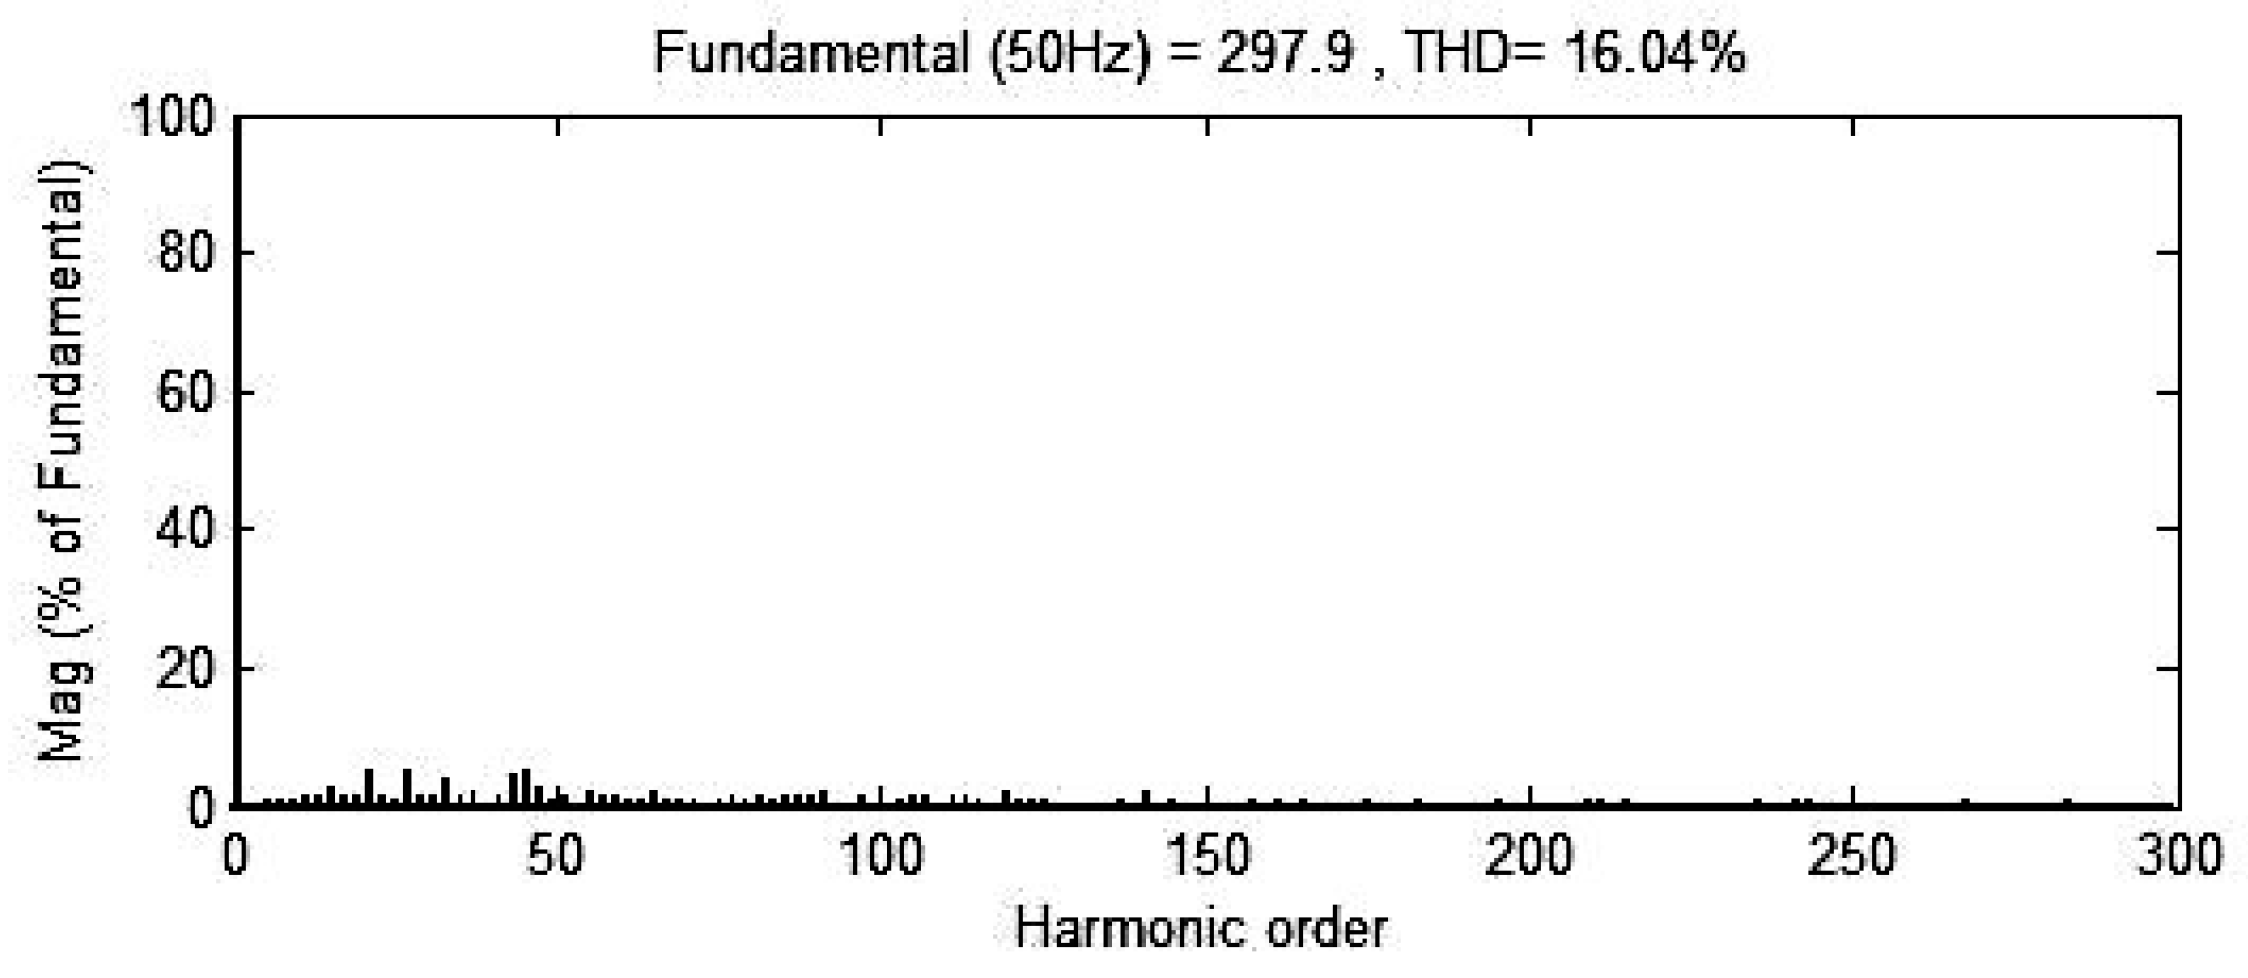
Simulated output voltage spectrum of the traditional area-equalized PWM (AEPWM) method, showing dominant low-order harmonics before optimization.
Figure 20.
Simulated output voltage spectrum of the traditional area-equalized PWM (AEPWM) method, showing dominant low-order harmonics before optimization.
Figure 21.
Output voltage waveform obtained using the proposed amalgamated area-equalized fundamental-switching PWM (A2EFSPWM) technique. The waveform exhibits uniform voltage steps and reduced distortion.
Figure 21.
Output voltage waveform obtained using the proposed amalgamated area-equalized fundamental-switching PWM (A2EFSPWM) technique. The waveform exhibits uniform voltage steps and reduced distortion.
Figure 22.
Inductive load current response under the A2EFSPWM method. The current remains continuous and nearly sinusoidal, confirming smooth commutation and proper conduction through bidirectional switches.
Figure 22.
Inductive load current response under the A2EFSPWM method. The current remains continuous and nearly sinusoidal, confirming smooth commutation and proper conduction through bidirectional switches.
Figure 23.
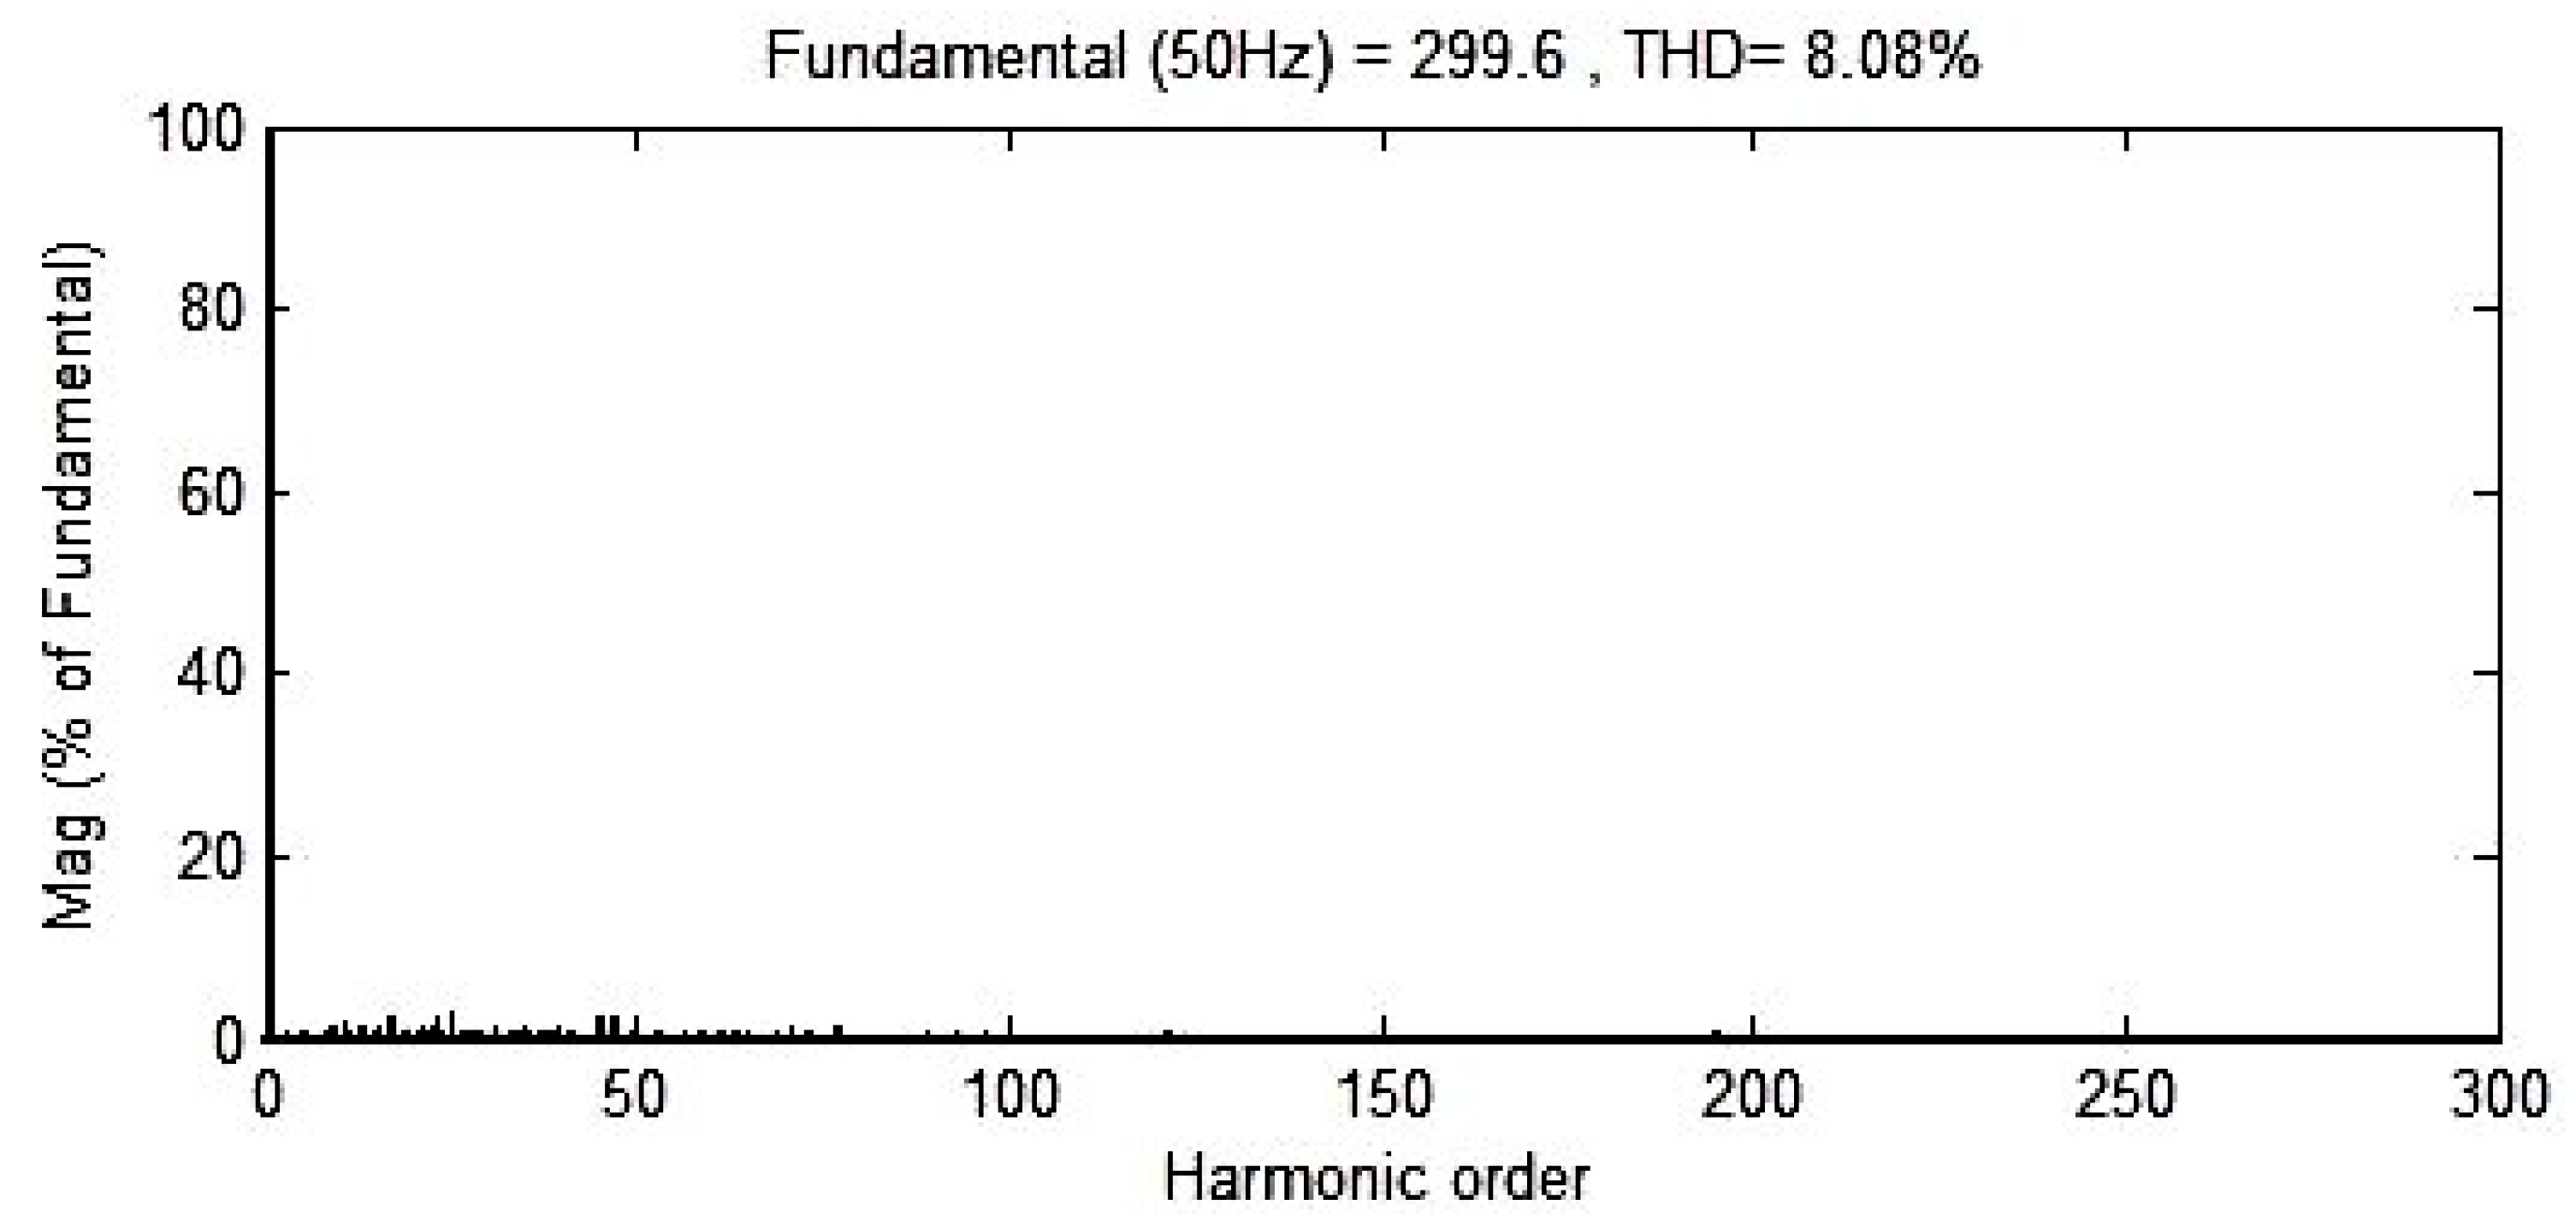
Frequency-domain spectrum of the A2EFSPWM output voltage. The magnitudes of the 5th, 7th, 11th, and 13th harmonics are substantially reduced, resulting in improved total harmonic distortion (THD).
Figure 23.
Frequency-domain spectrum of the A2EFSPWM output voltage. The magnitudes of the 5th, 7th, 11th, and 13th harmonics are substantially reduced, resulting in improved total harmonic distortion (THD).
Figure 24.
Output voltage waveform generated by the amalgamated fundamental-switching area-equalized PWM (AFSAEPWM) method, demonstrating balanced step transitions and high-quality voltage synthesis.
Figure 24.
Output voltage waveform generated by the amalgamated fundamental-switching area-equalized PWM (AFSAEPWM) method, demonstrating balanced step transitions and high-quality voltage synthesis.
Figure 25.
Inductive load current corresponding to the AFSAEPWM technique. The waveform closely follows a sinusoidal profile with negligible distortion, validating the harmonic suppression capability.
Figure 25.
Inductive load current corresponding to the AFSAEPWM technique. The waveform closely follows a sinusoidal profile with negligible distortion, validating the harmonic suppression capability.
Figure 26.
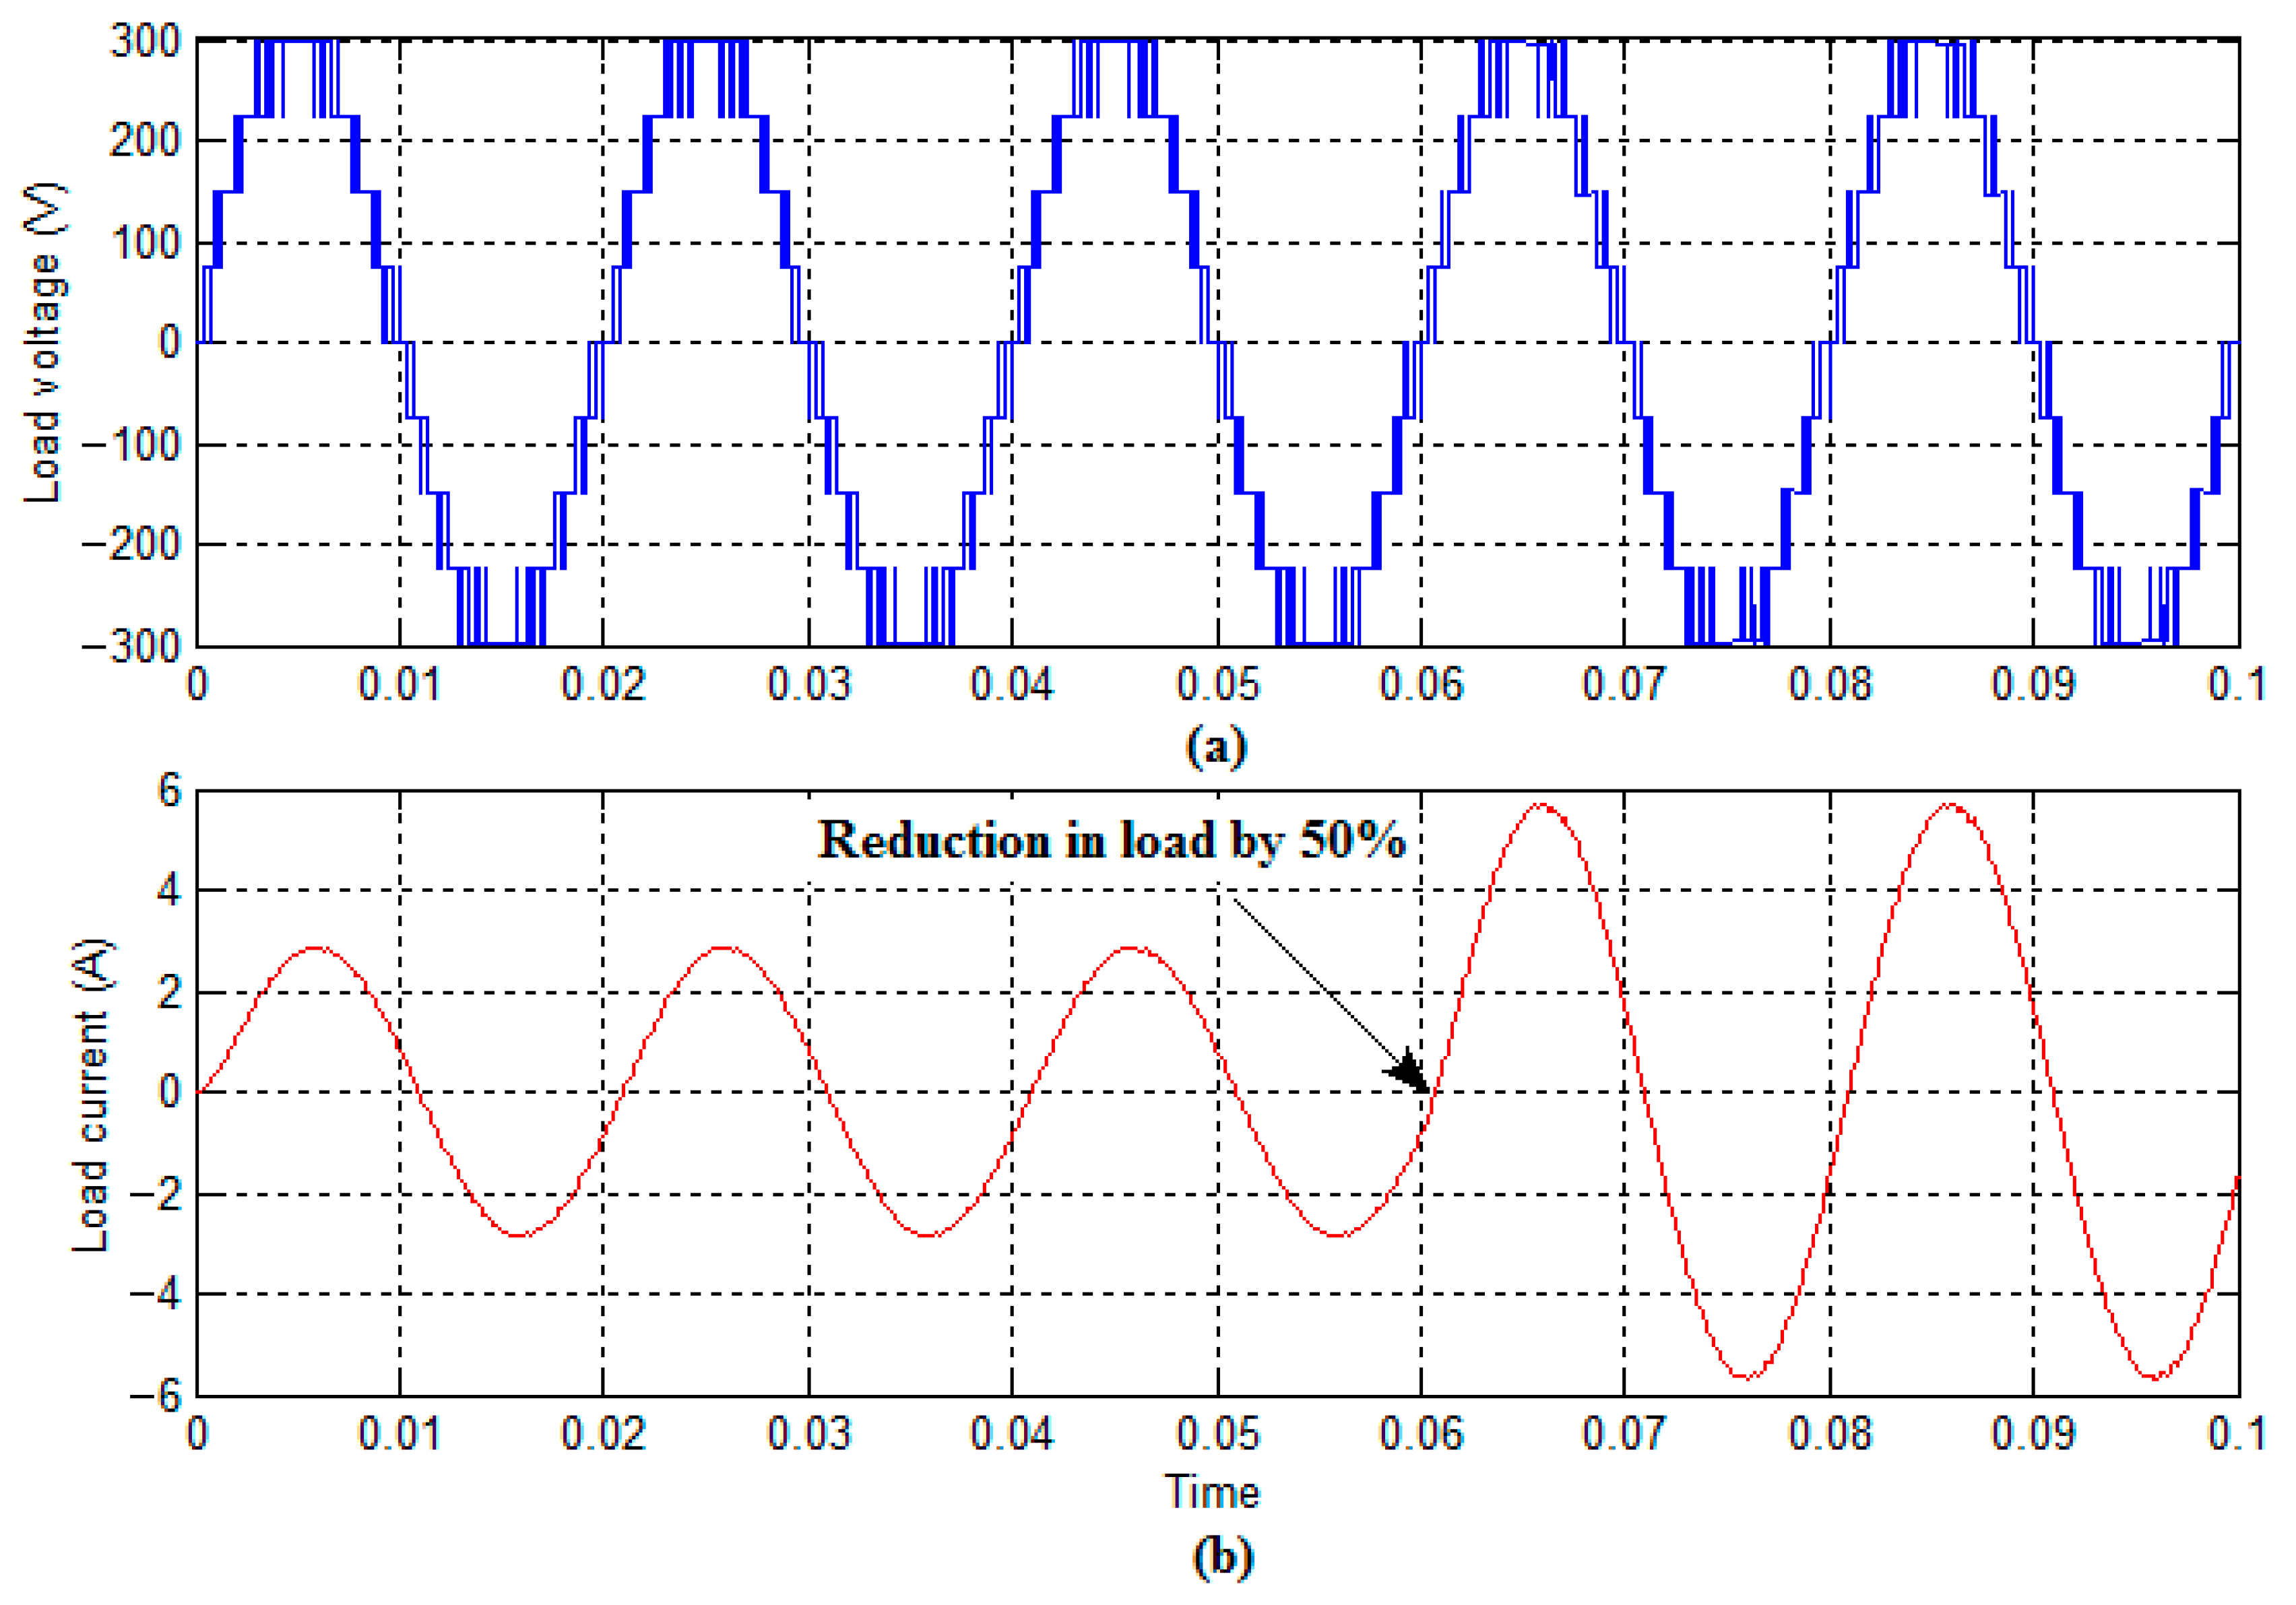
Nine-level inverter, (a) output voltage, and (b) inductive load current waveform for change in load condition.
Figure 26.
Nine-level inverter, (a) output voltage, and (b) inductive load current waveform for change in load condition.
Figure 27.
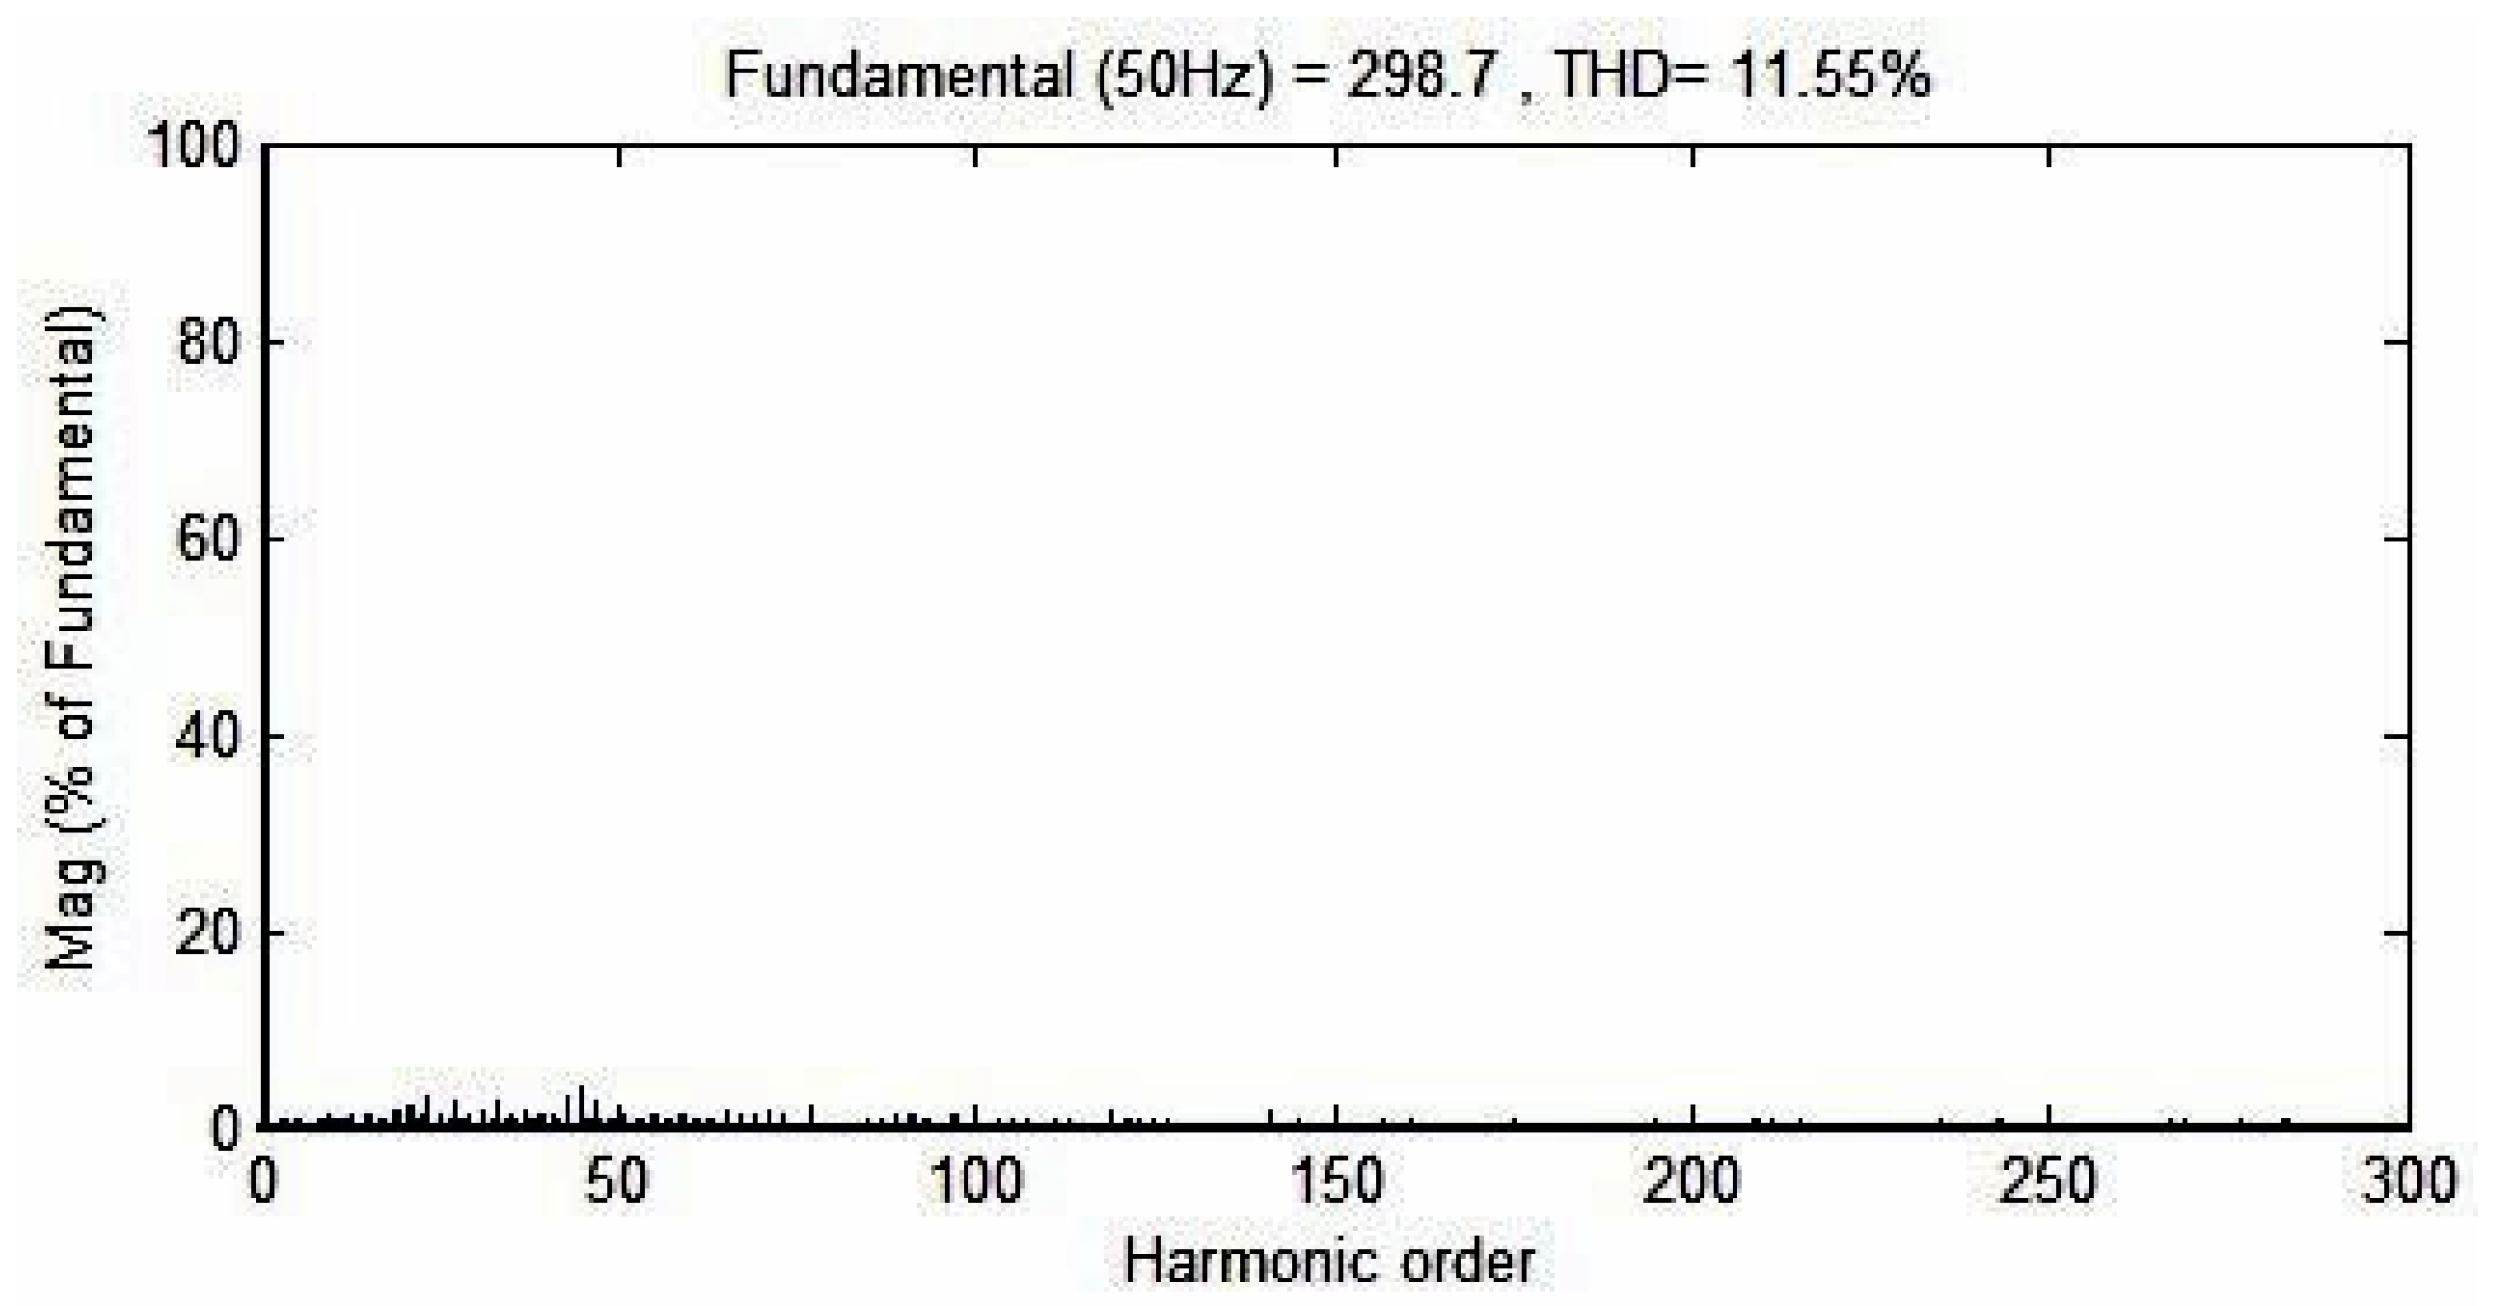
Output voltage FFT spectrum for the AFSAEPWM method showing elimination of low-order harmonics and overall THD reduction below 5%.
Figure 27.
Output voltage FFT spectrum for the AFSAEPWM method showing elimination of low-order harmonics and overall THD reduction below 5%.
Figure 28.
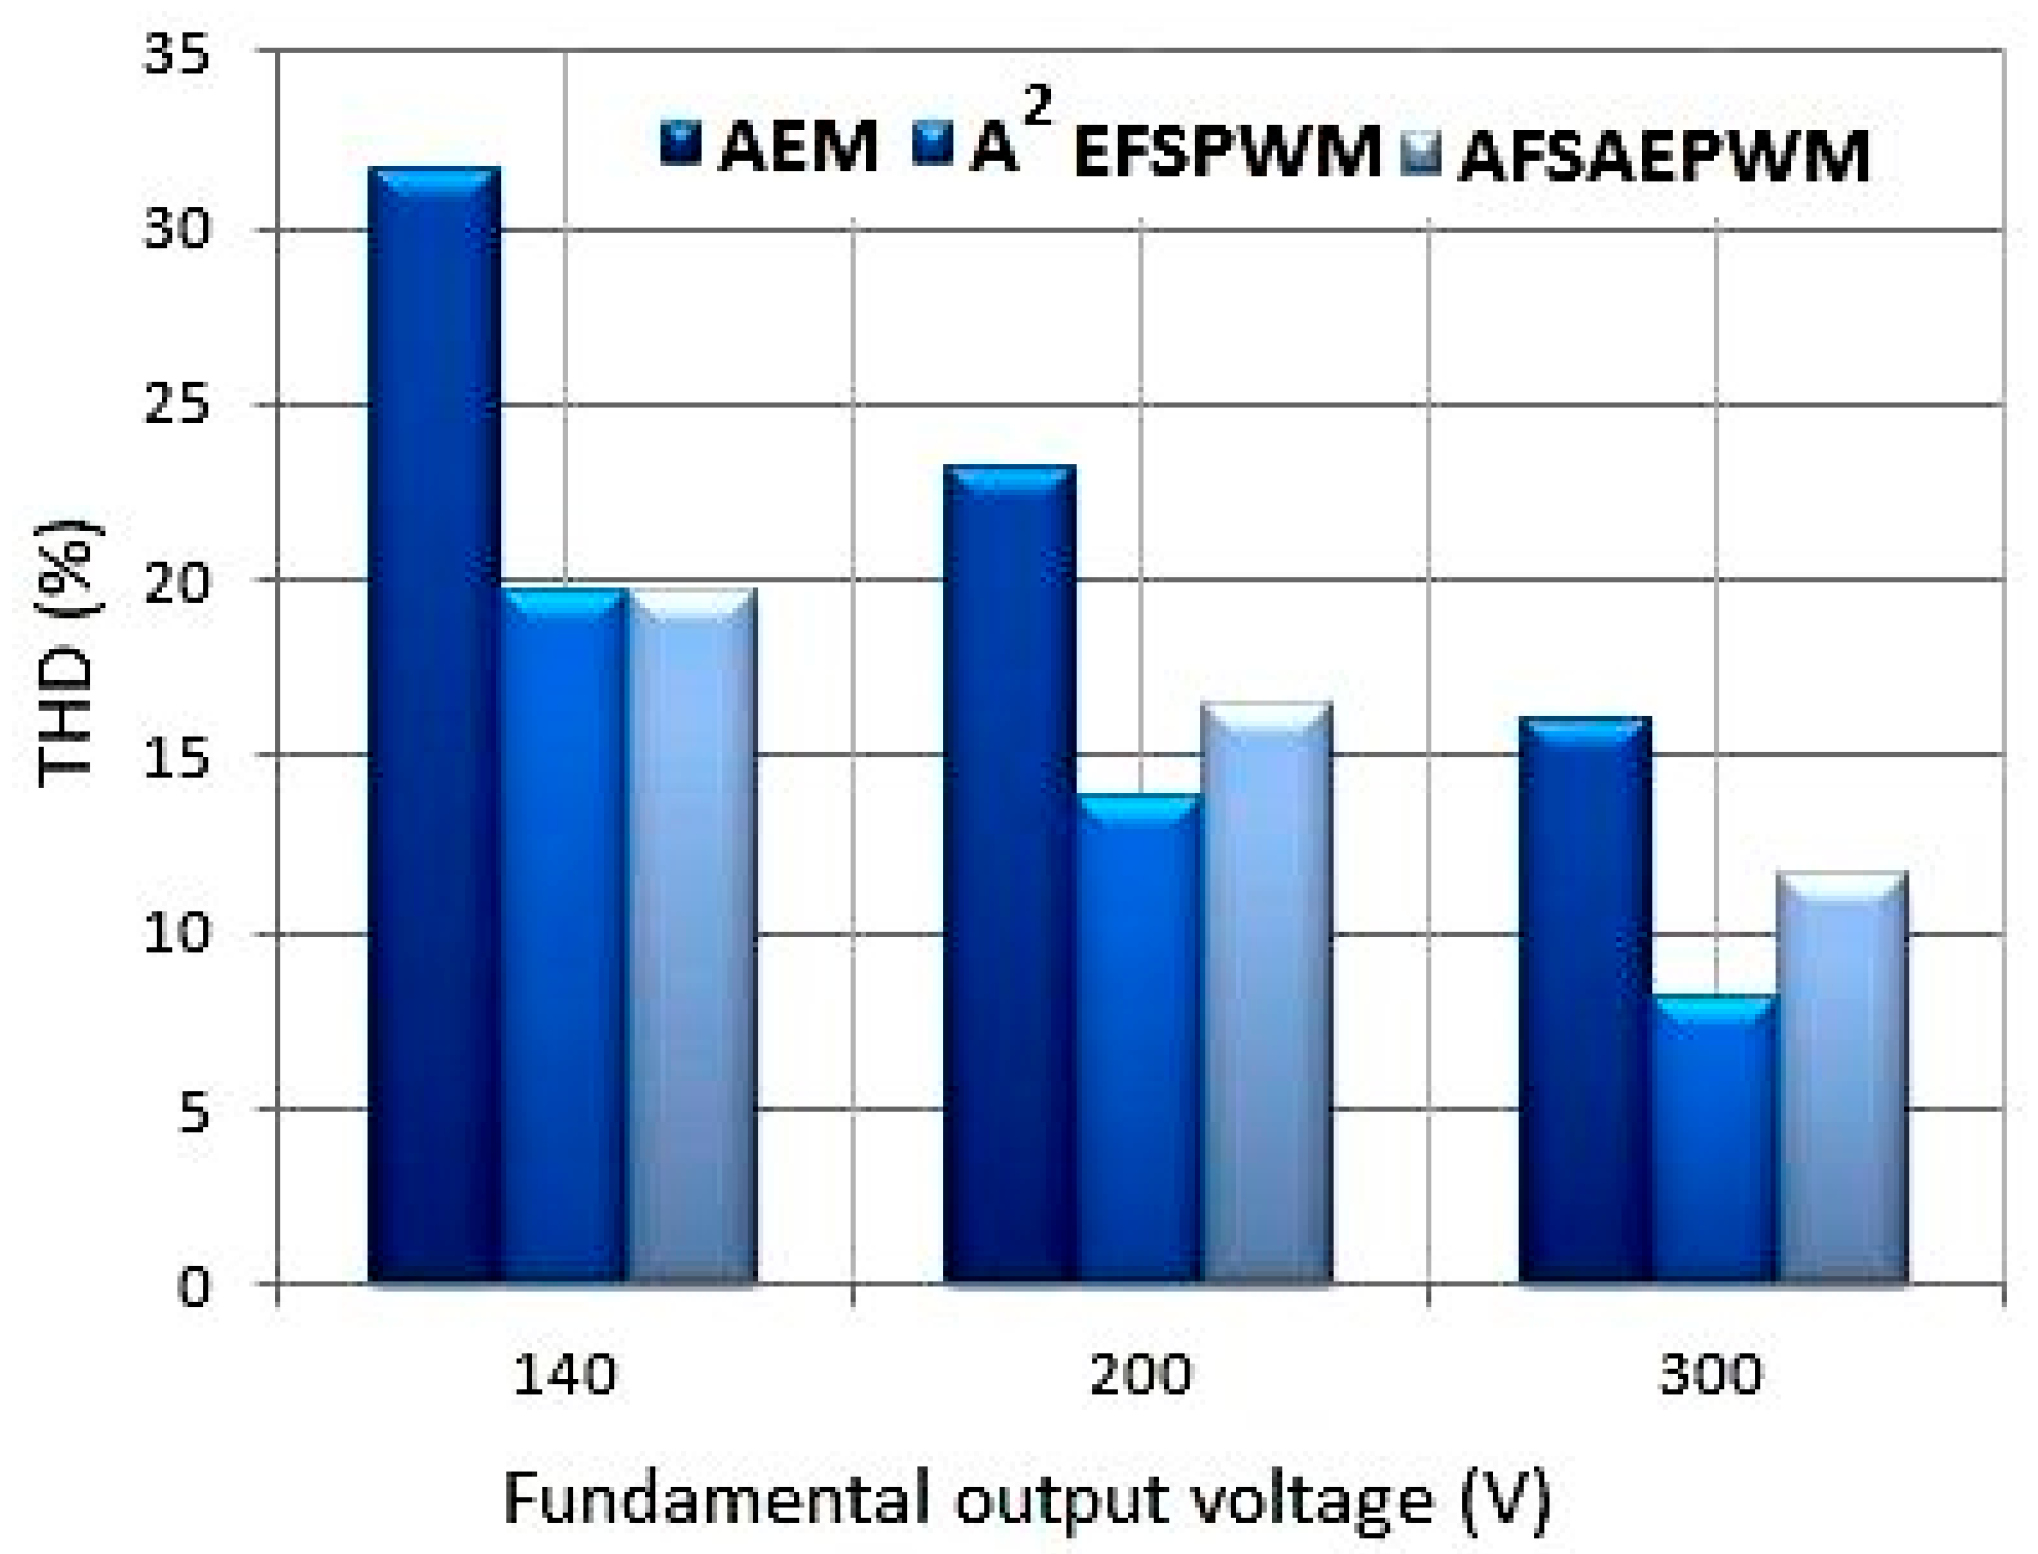
Comparison of the fundamental output voltage amplitude versus total harmonic distortion (THD) for different PWM strategies. The proposed hybrid PWM achieves the lowest THD at a near-unity modulation index.
Figure 28.
Comparison of the fundamental output voltage amplitude versus total harmonic distortion (THD) for different PWM strategies. The proposed hybrid PWM achieves the lowest THD at a near-unity modulation index.
Figure 29.
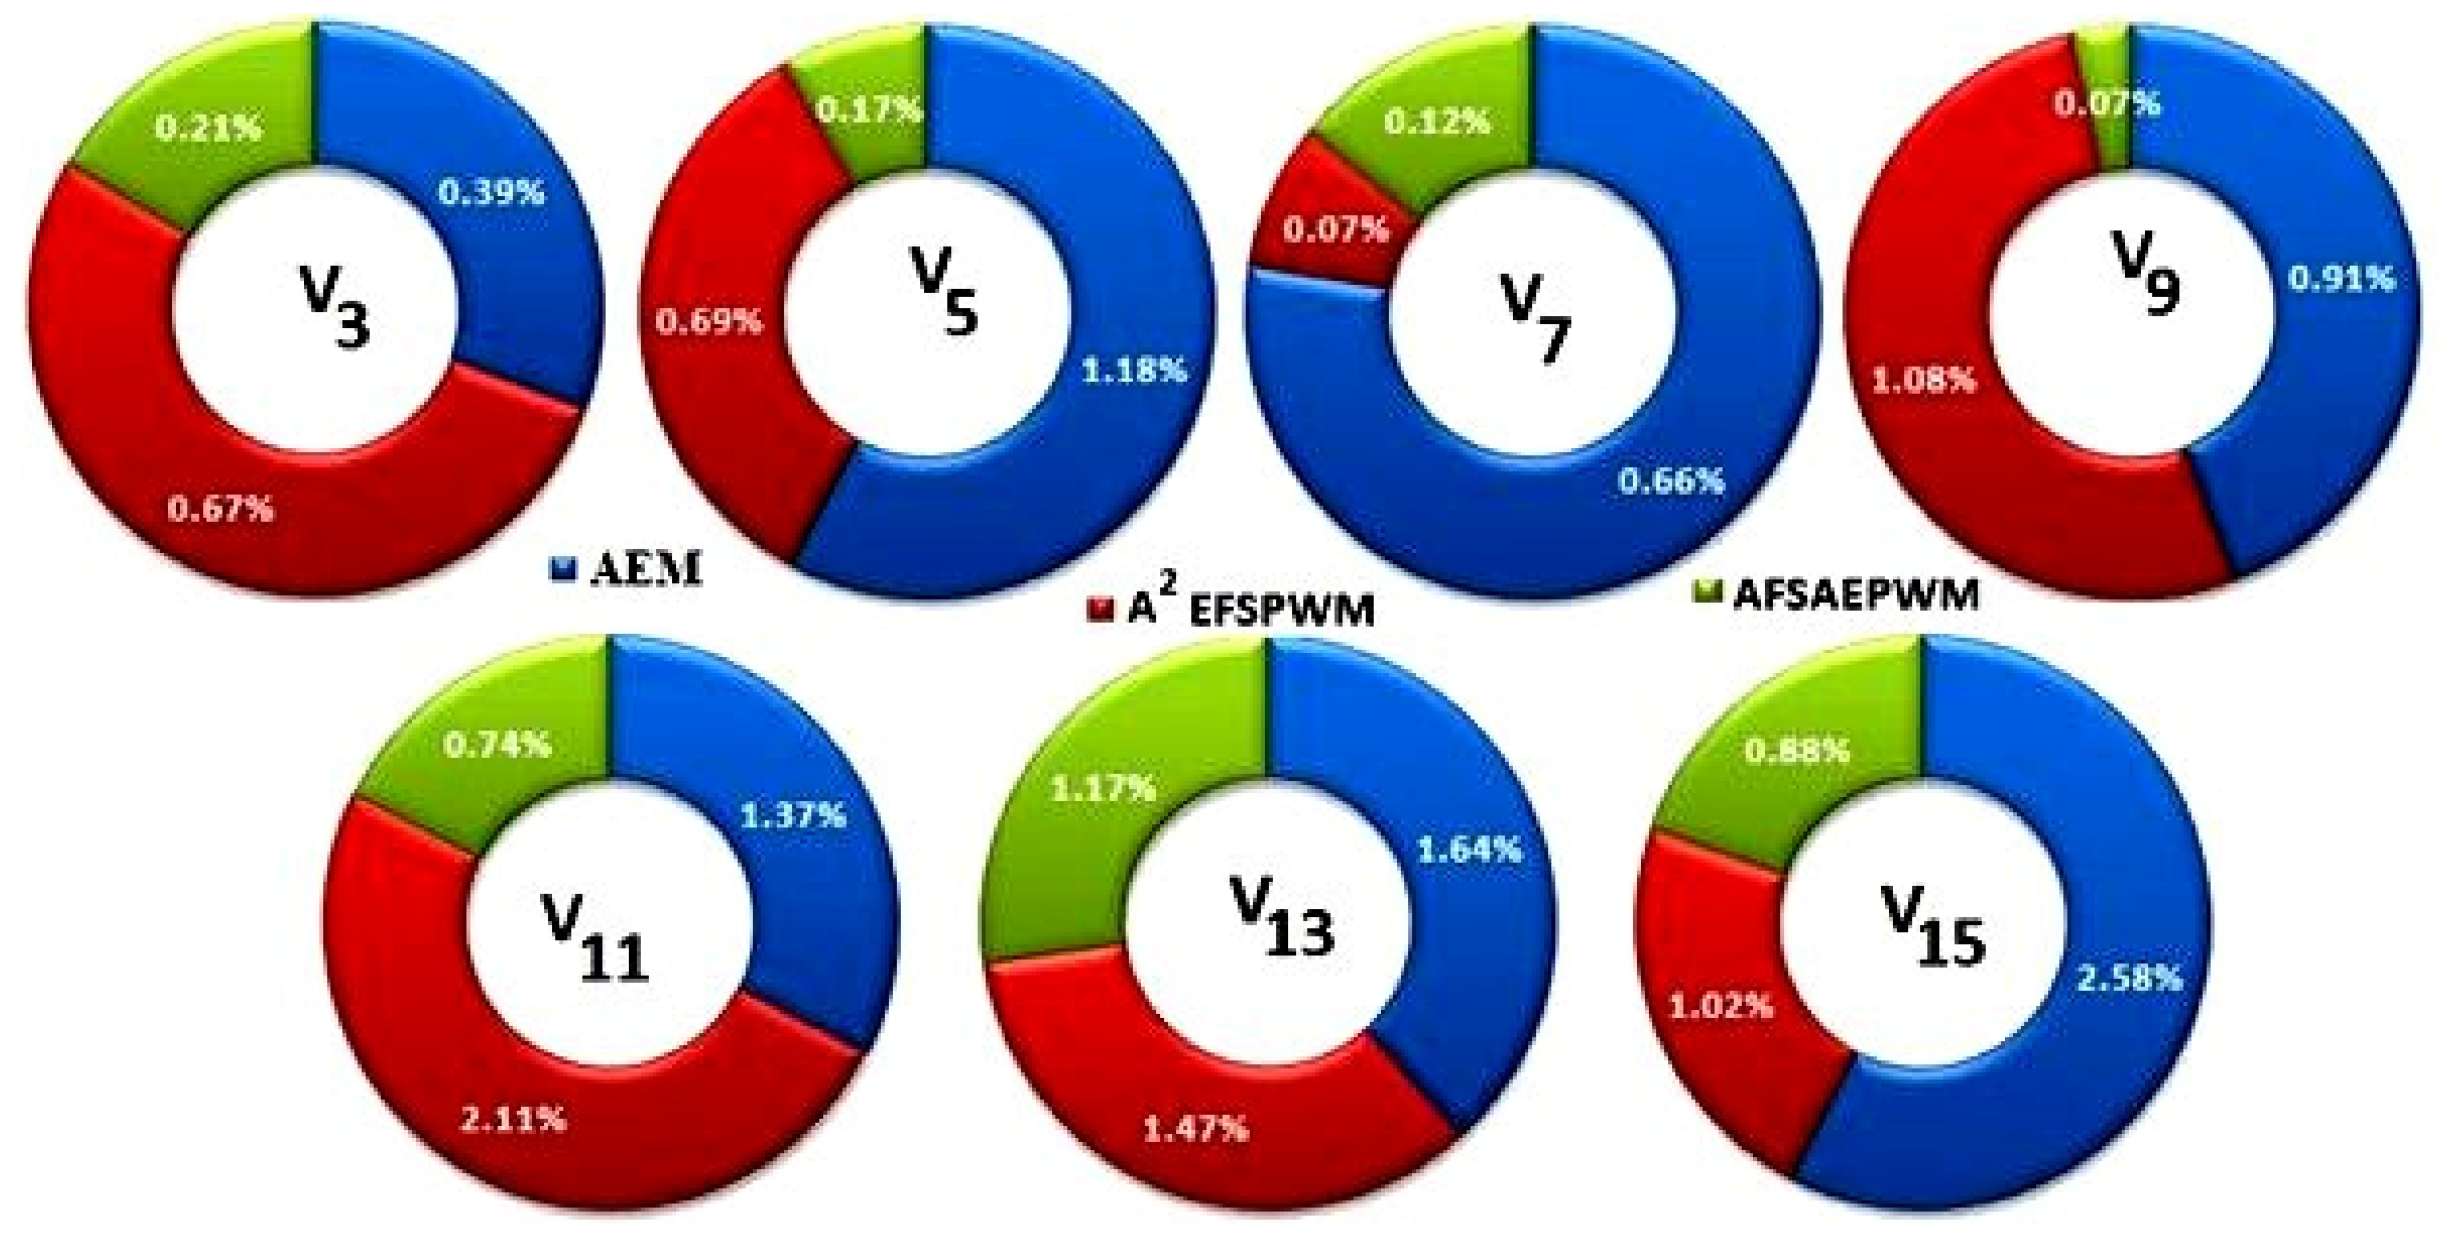
Variation in harmonic magnitudes between the conventional area-equalized modulation (AEM) and the proposed hybrid PWM methods. The hybrid approach exhibits significantly lower low-order harmonic content, confirming enhanced spectral performance.
Figure 29.
Variation in harmonic magnitudes between the conventional area-equalized modulation (AEM) and the proposed hybrid PWM methods. The hybrid approach exhibits significantly lower low-order harmonic content, confirming enhanced spectral performance.
Figure 30.
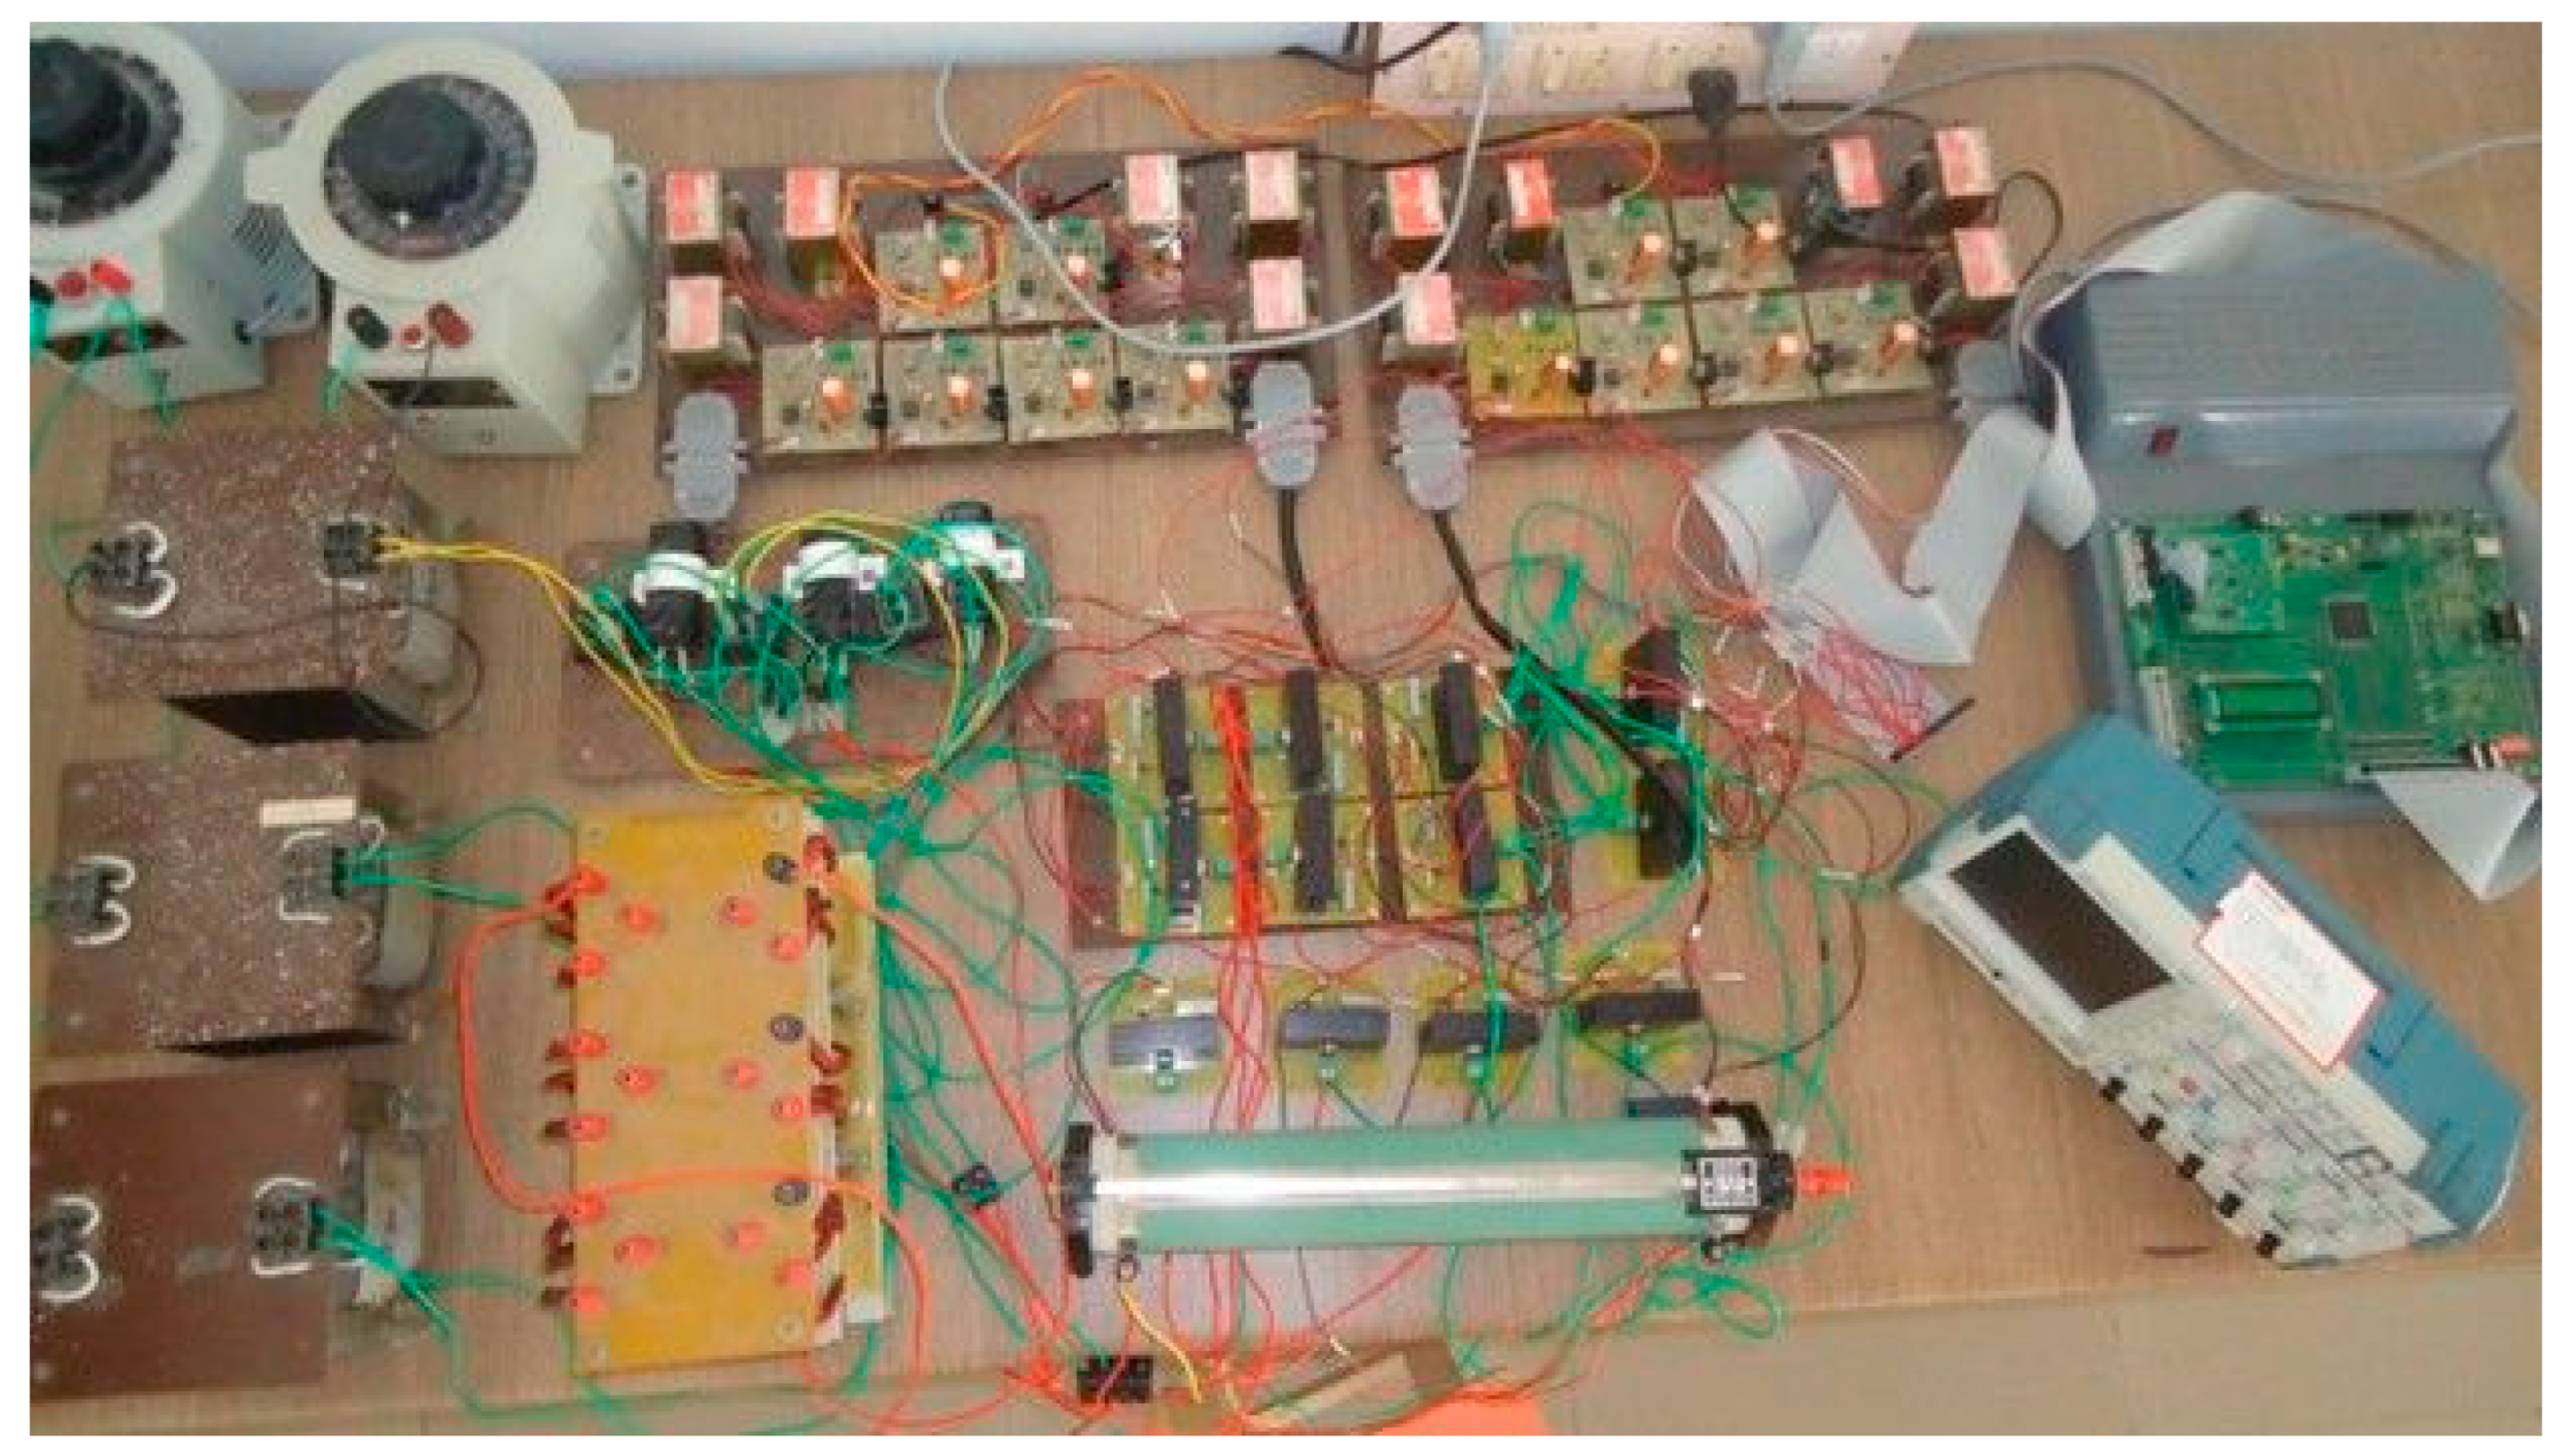
Experimental test bench of the proposed triple-source RCC-MLI showing field-programmable gate array (FPGA) controller, gate driver circuits, IGBTs, and measurement instruments.
Figure 30.
Experimental test bench of the proposed triple-source RCC-MLI showing field-programmable gate array (FPGA) controller, gate driver circuits, IGBTs, and measurement instruments.
Figure 31.
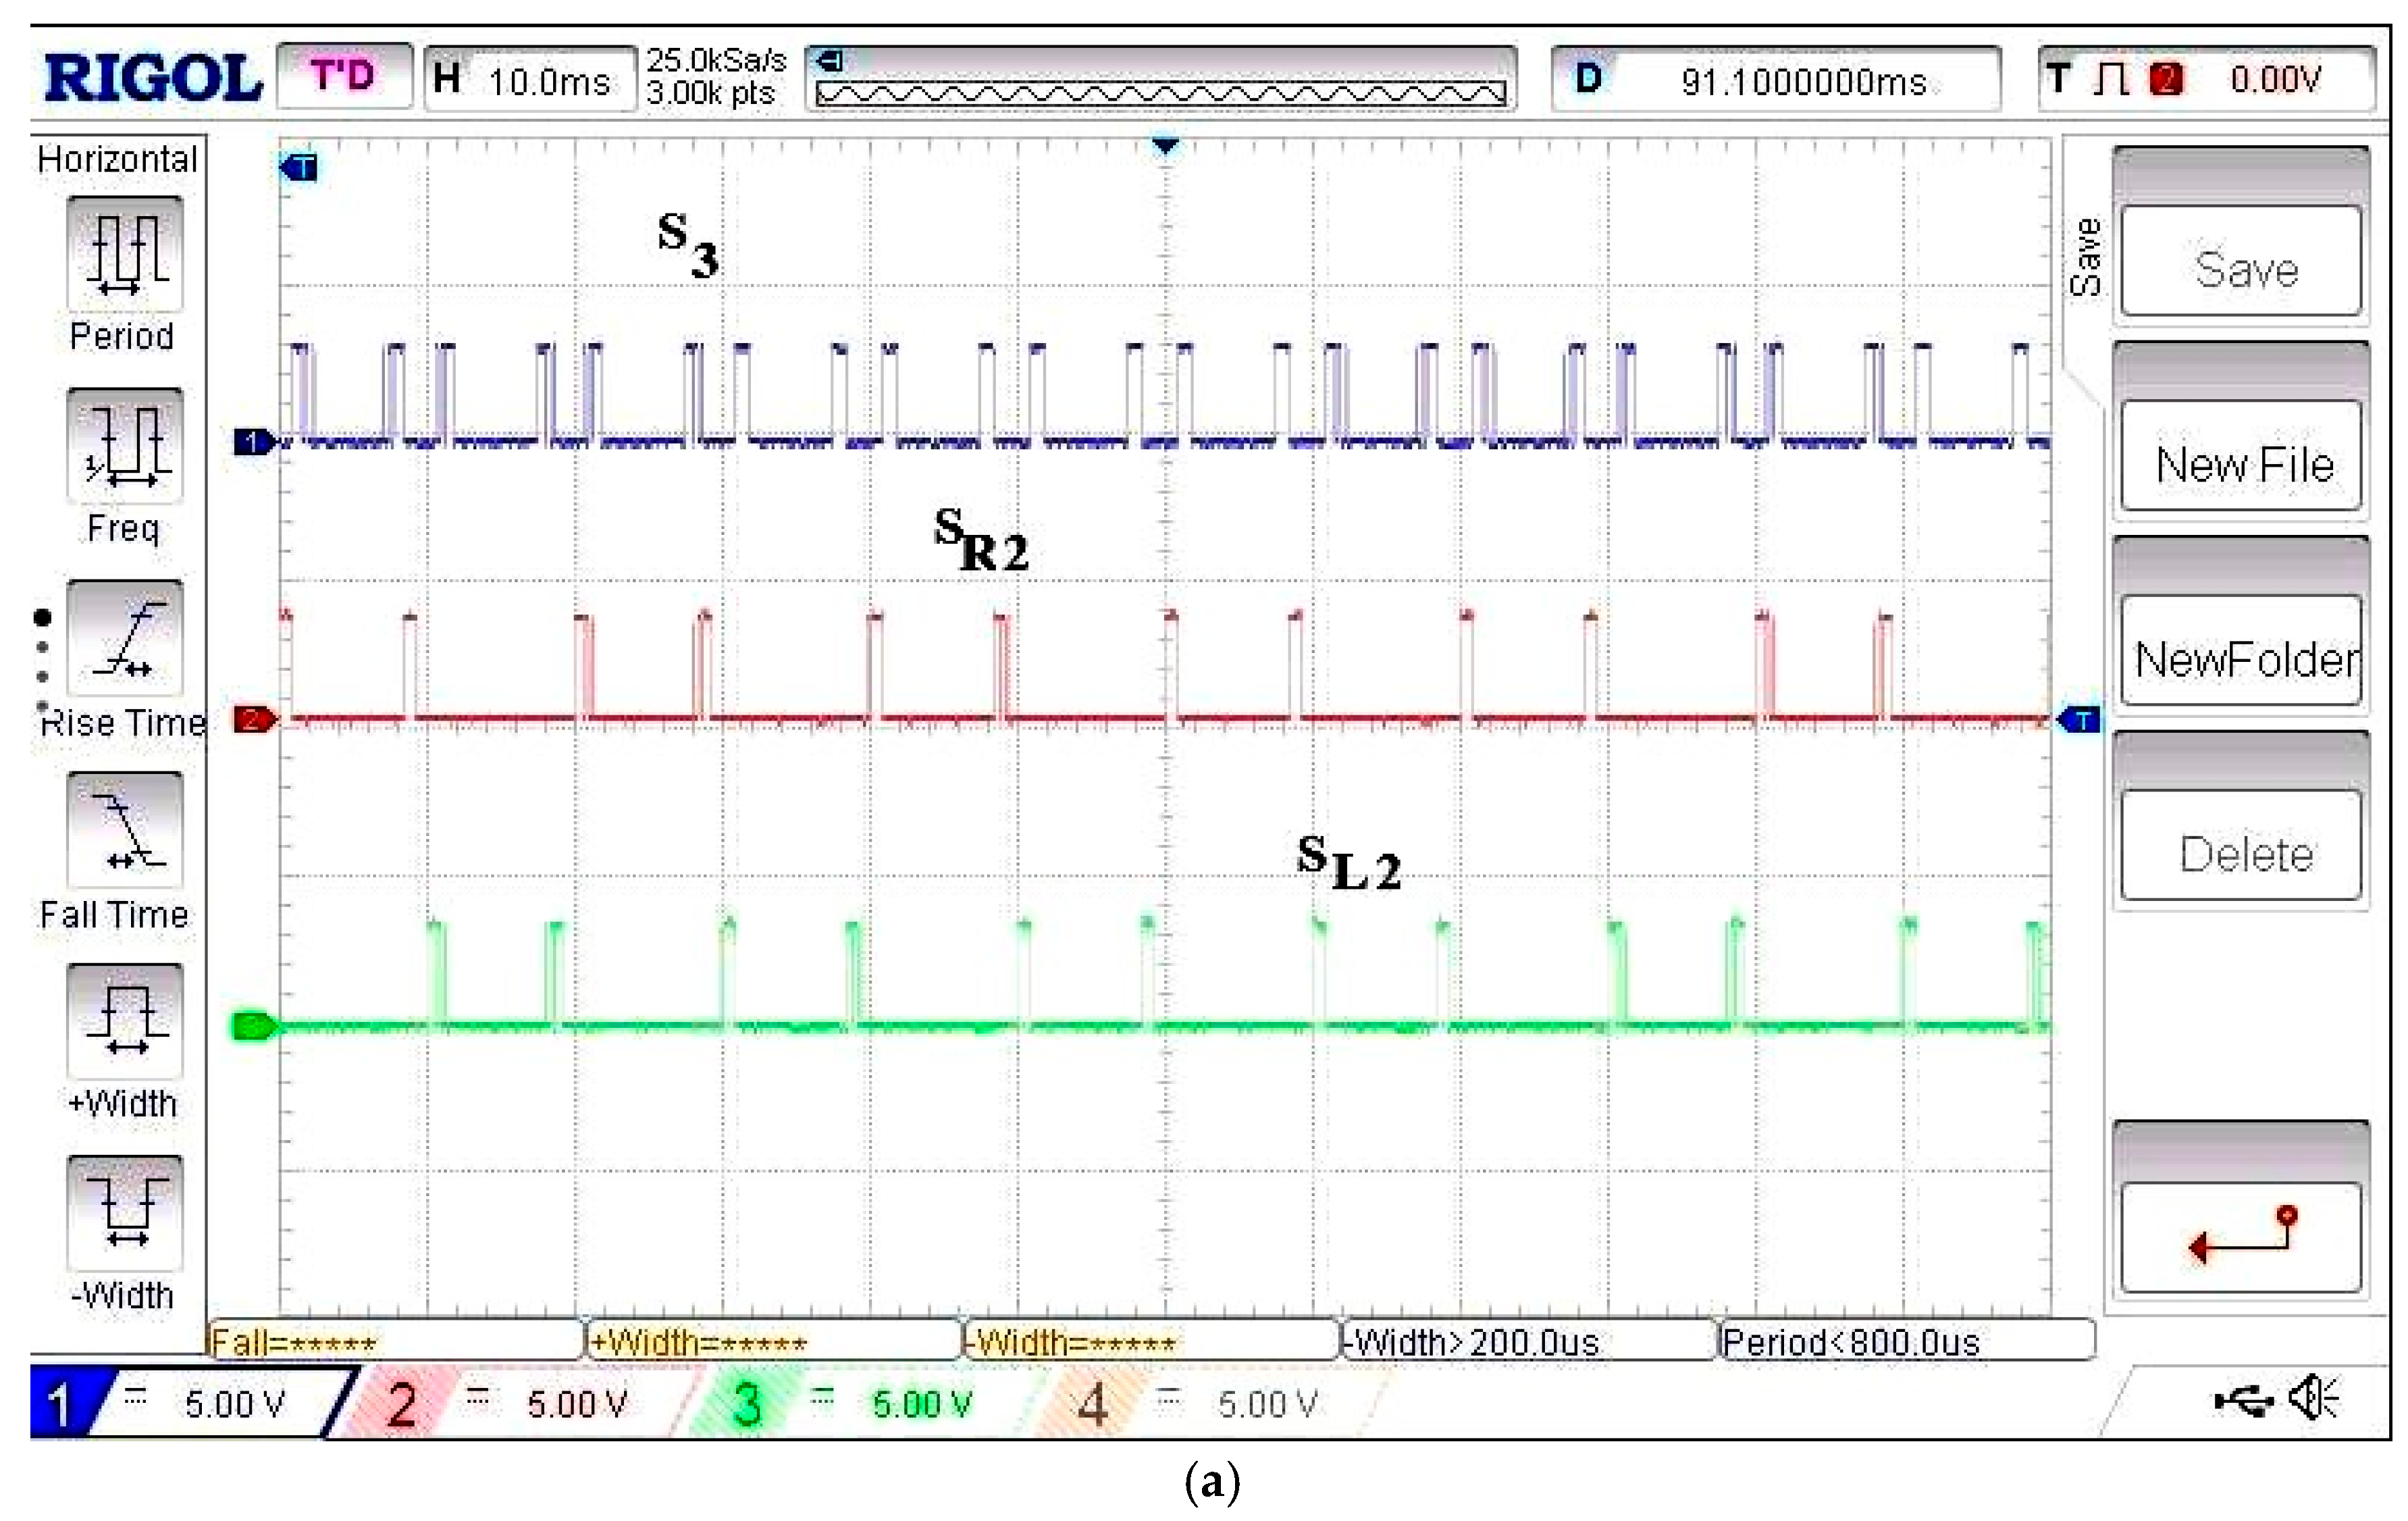
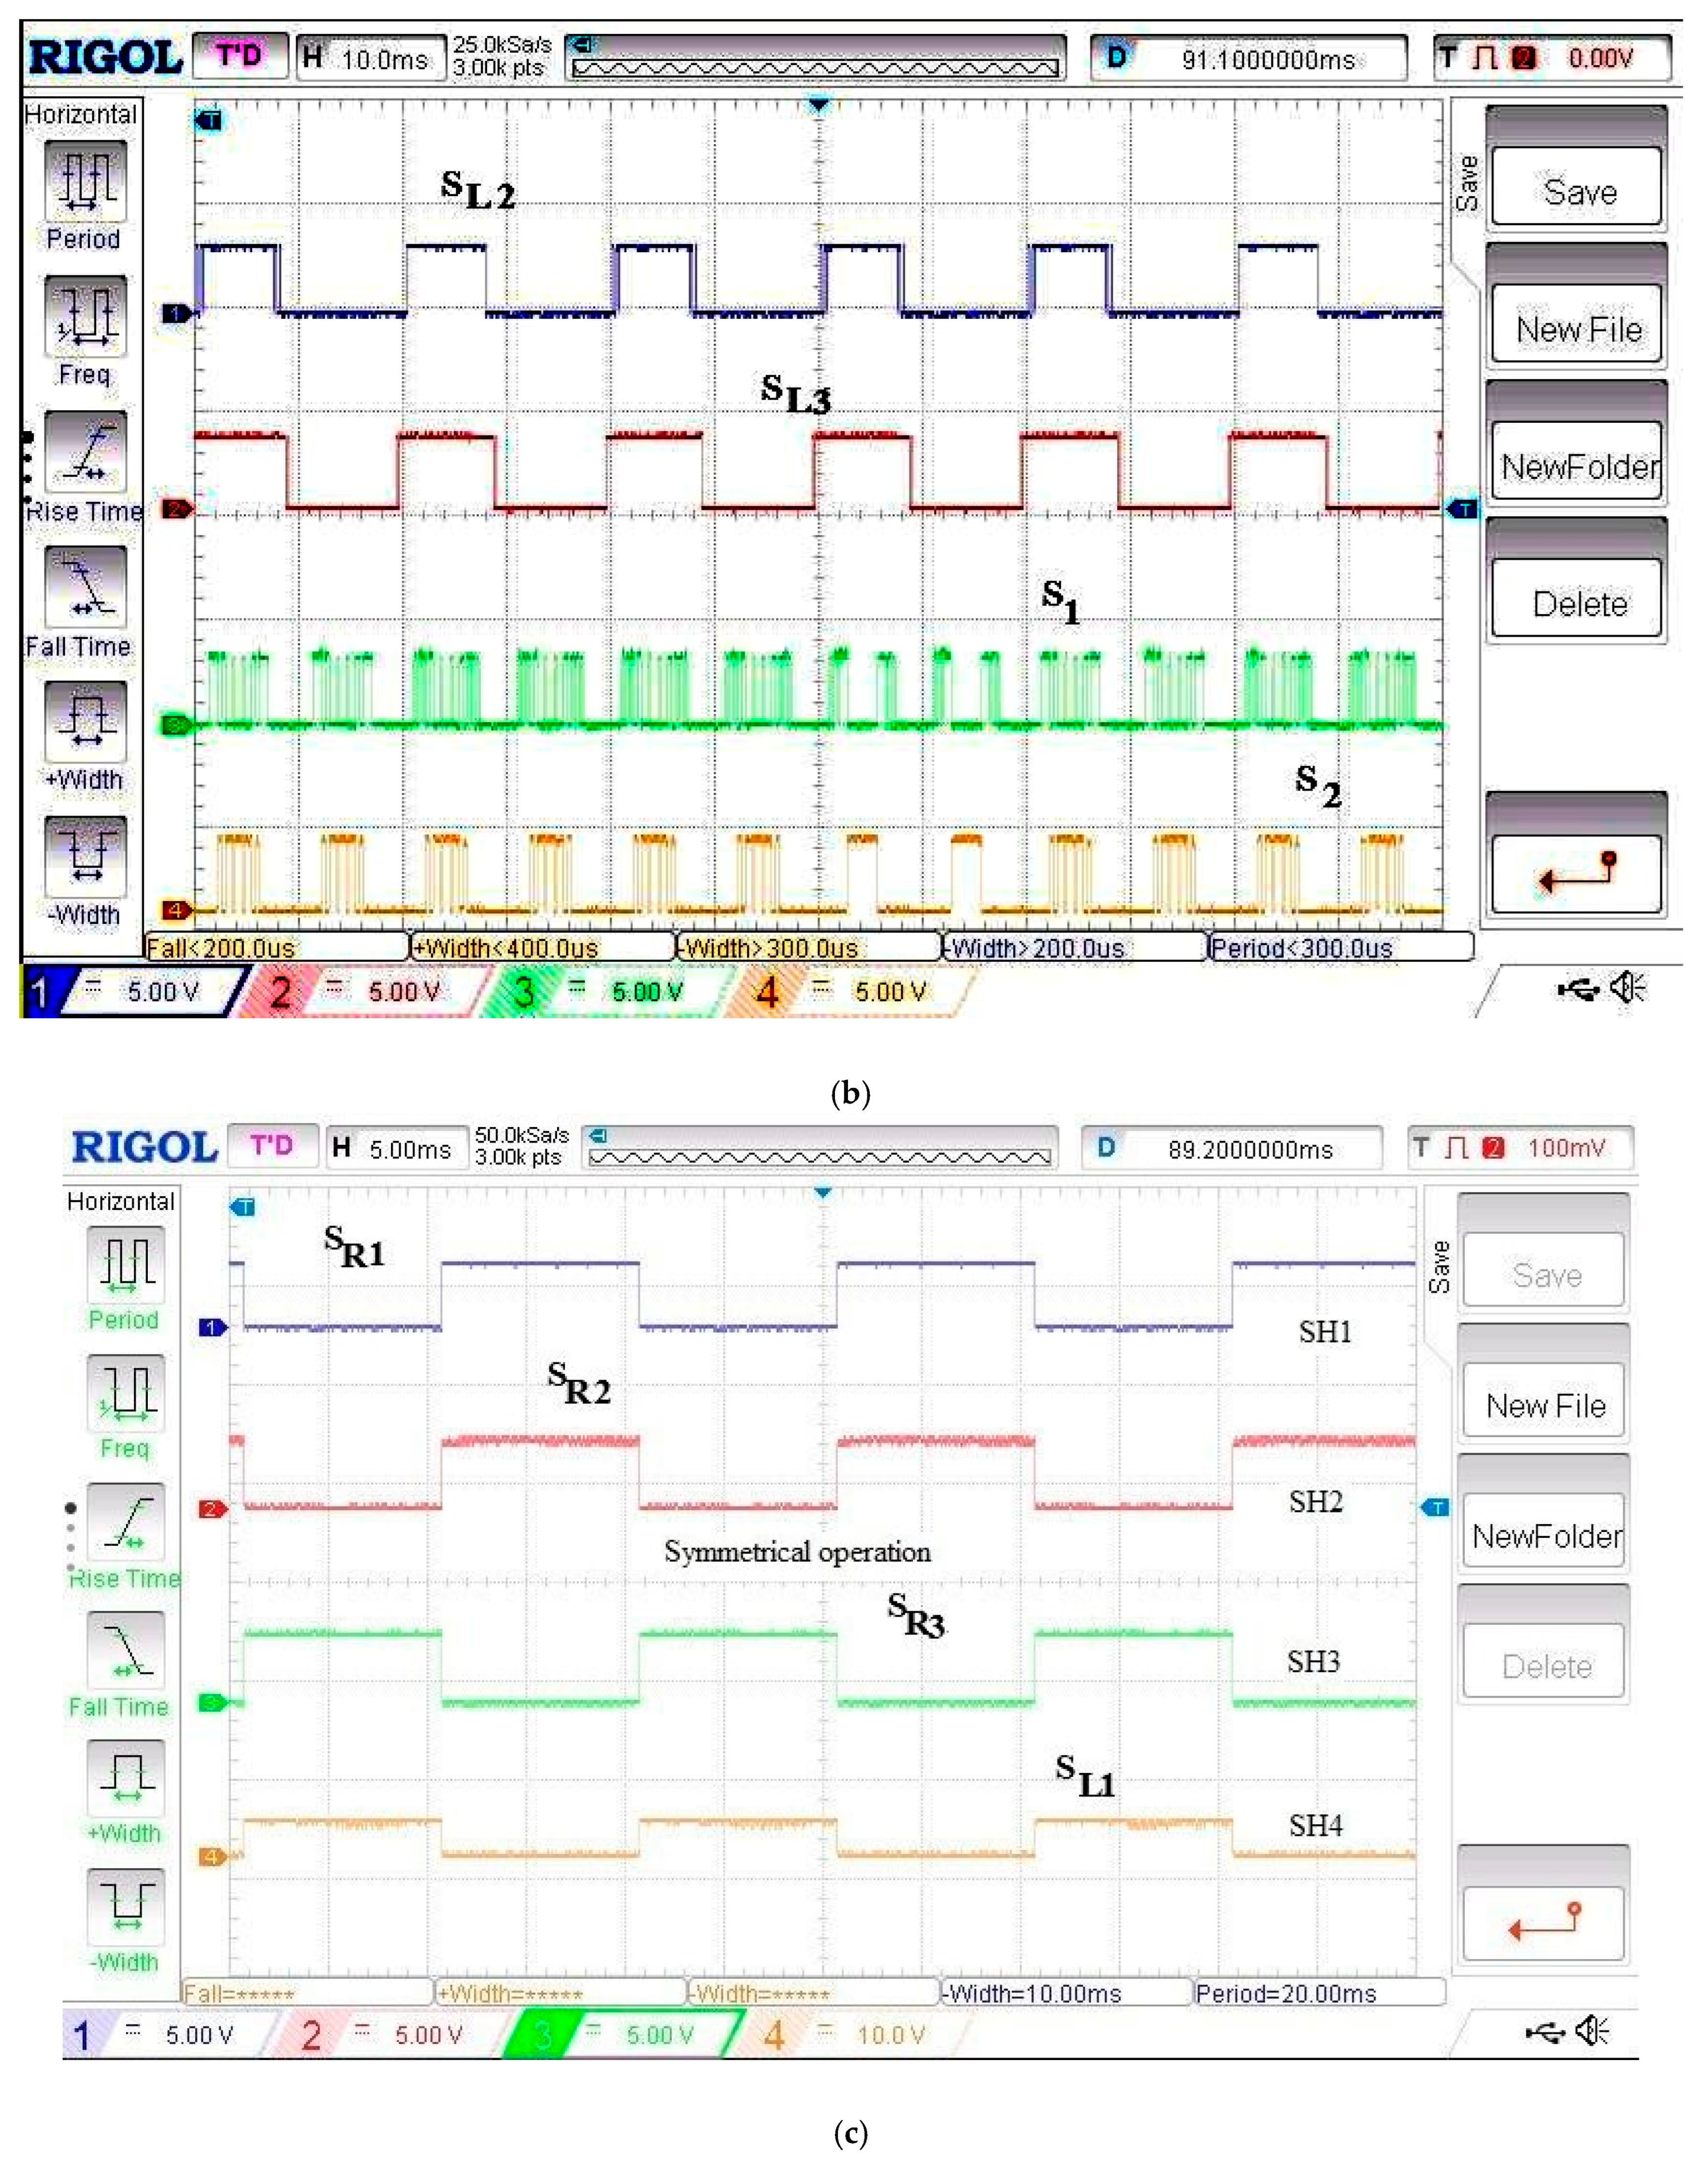
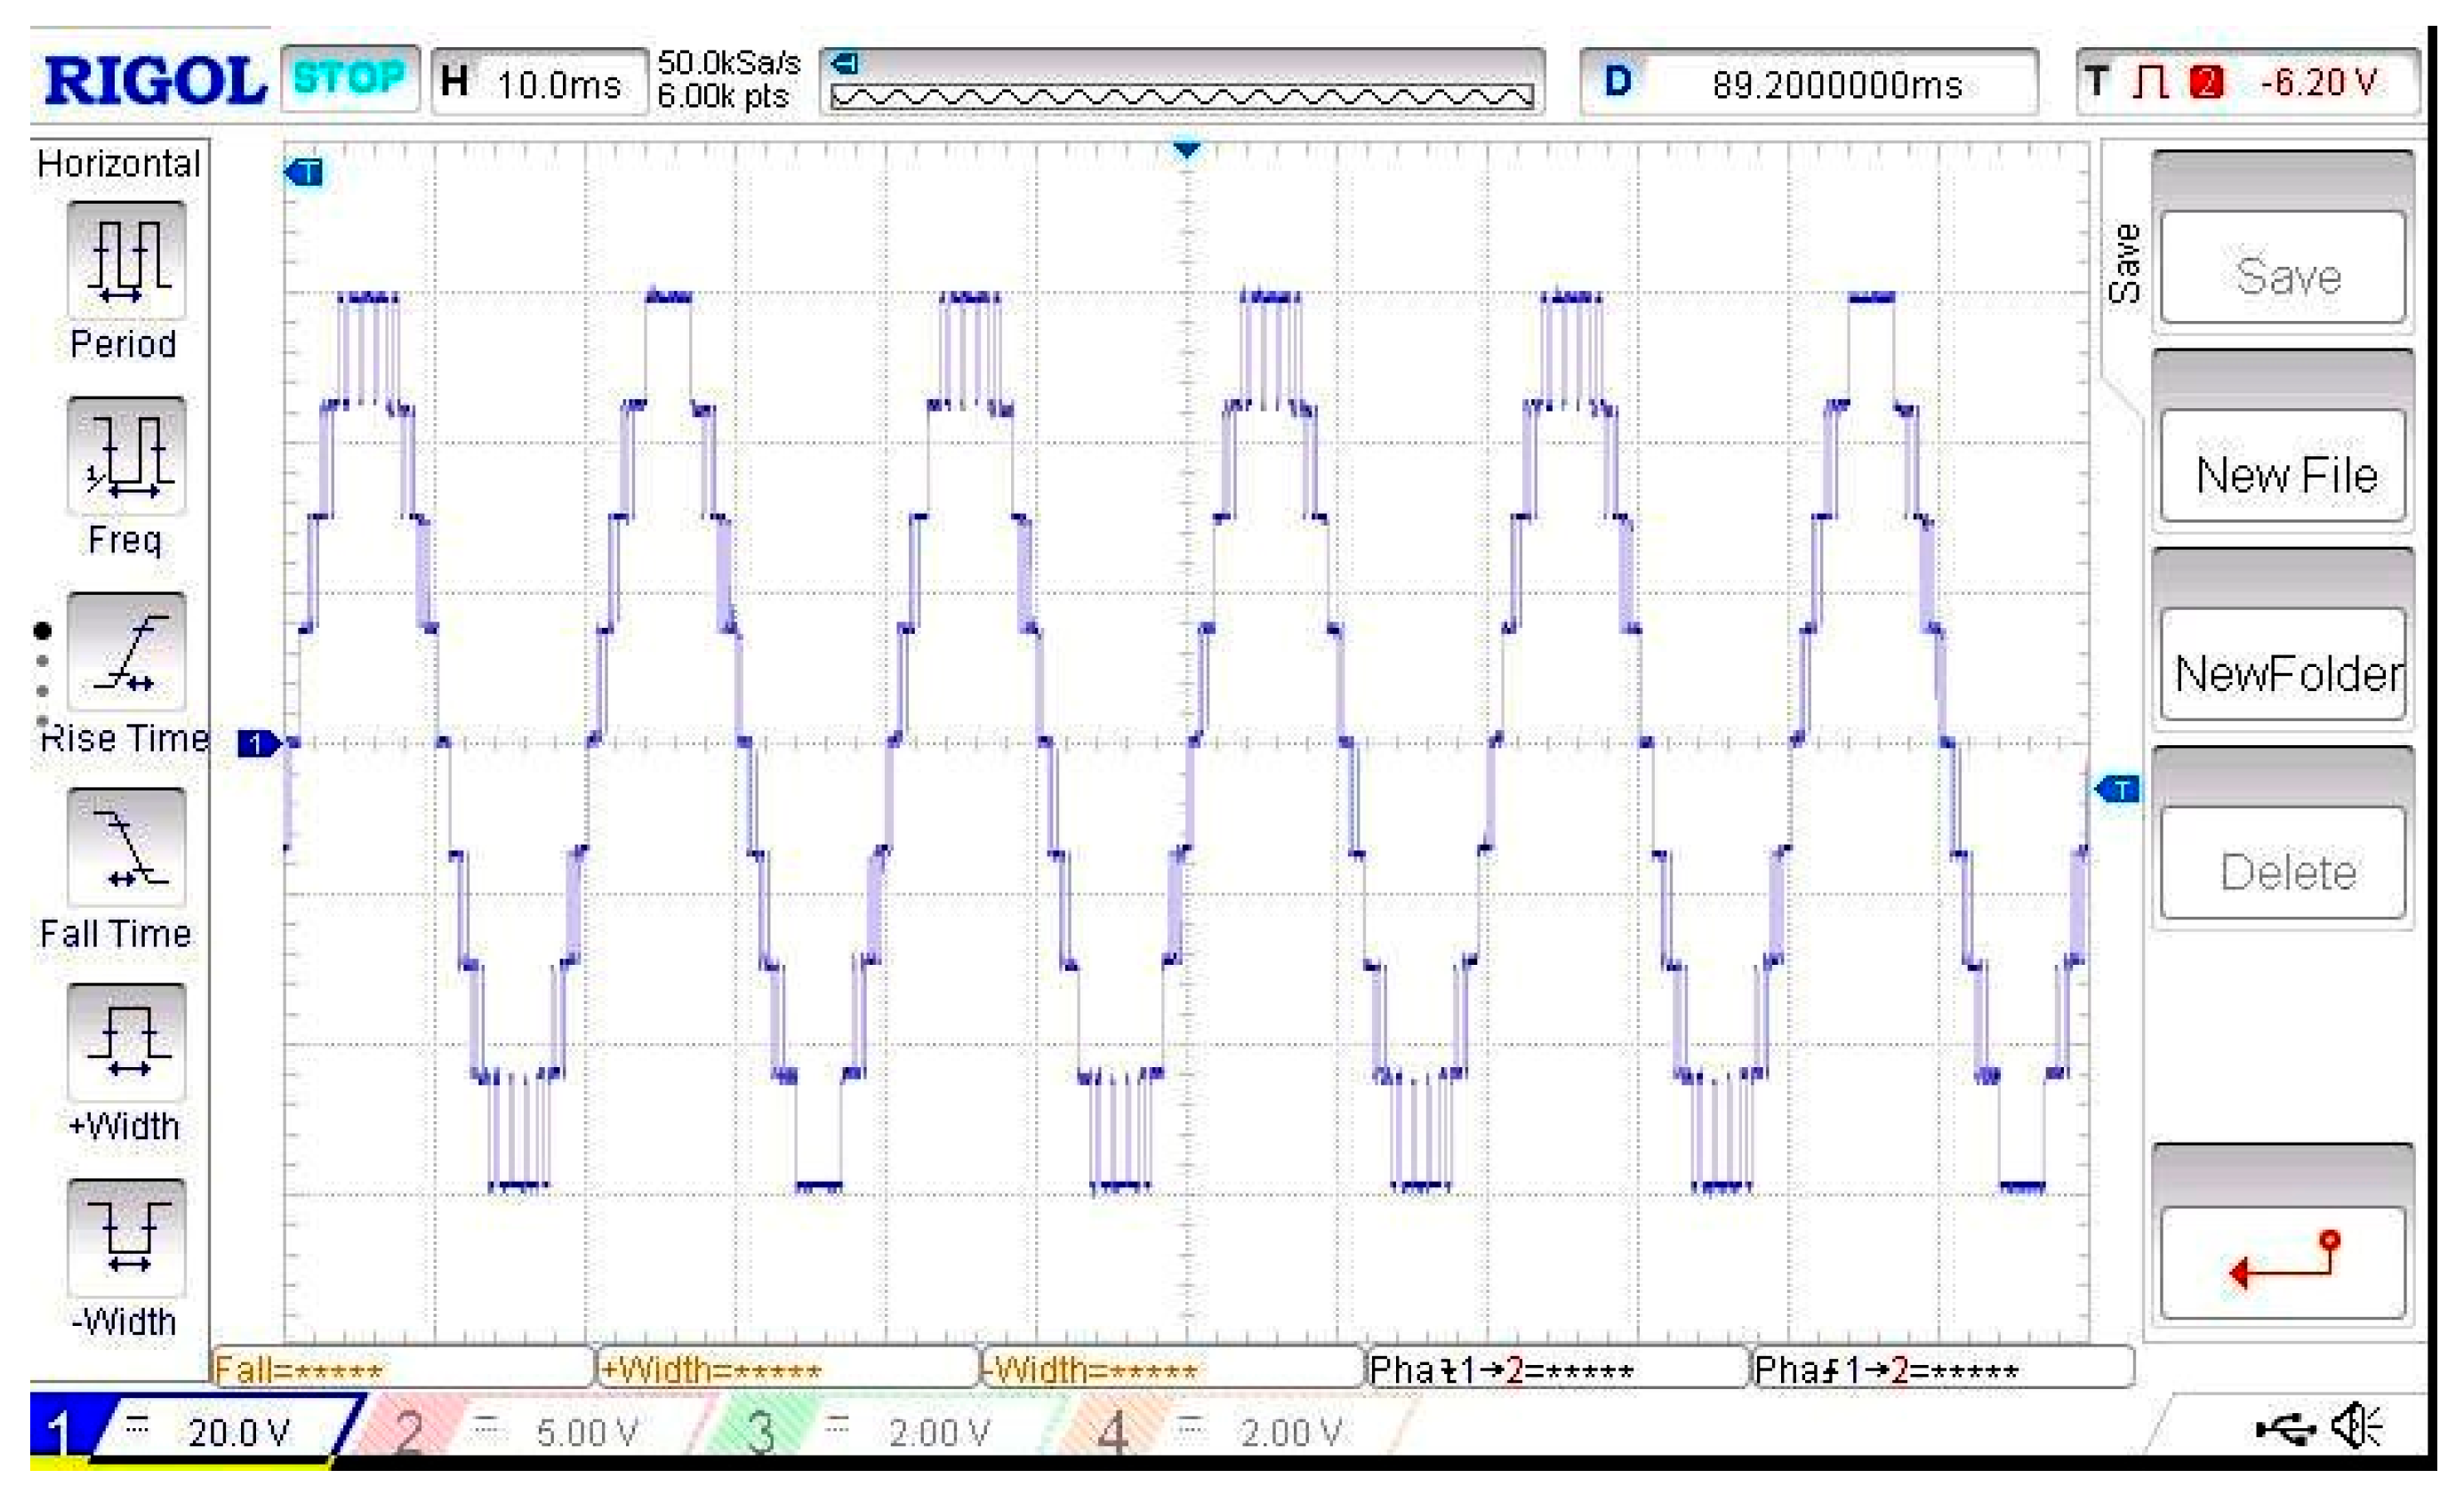
(a) Experimental PWM gating pattern for the A2EFSPWM method during the positive half-cycle, showing properly sequenced switching pulses generated by the FPGA controller. (b) Experimental PWM gating pattern for the A2EFSPWM method during the negative half-cycle. The symmetrical pulse arrangement confirms balanced conduction for both half-periods. (c) Composite PWM circulation pattern for the A2EFSPWM strategy combining both half-cycles, illustrating equal-area modulation and synchronized gate triggering. (a–c) Experimental PWM gating patterns for the proposed amalgamated area-equalized fundamental-switching PWM (A2EFSPWM) method. Subfigures (a,b) show the positive and negative half-cycle pulse patterns, respectively, while (c) presents the composite full-cycle pulse circulation. The symmetrical pulse distribution confirms correct FPGA-based modulation and balanced conduction throughout the fundamental cycle.
Figure 32.
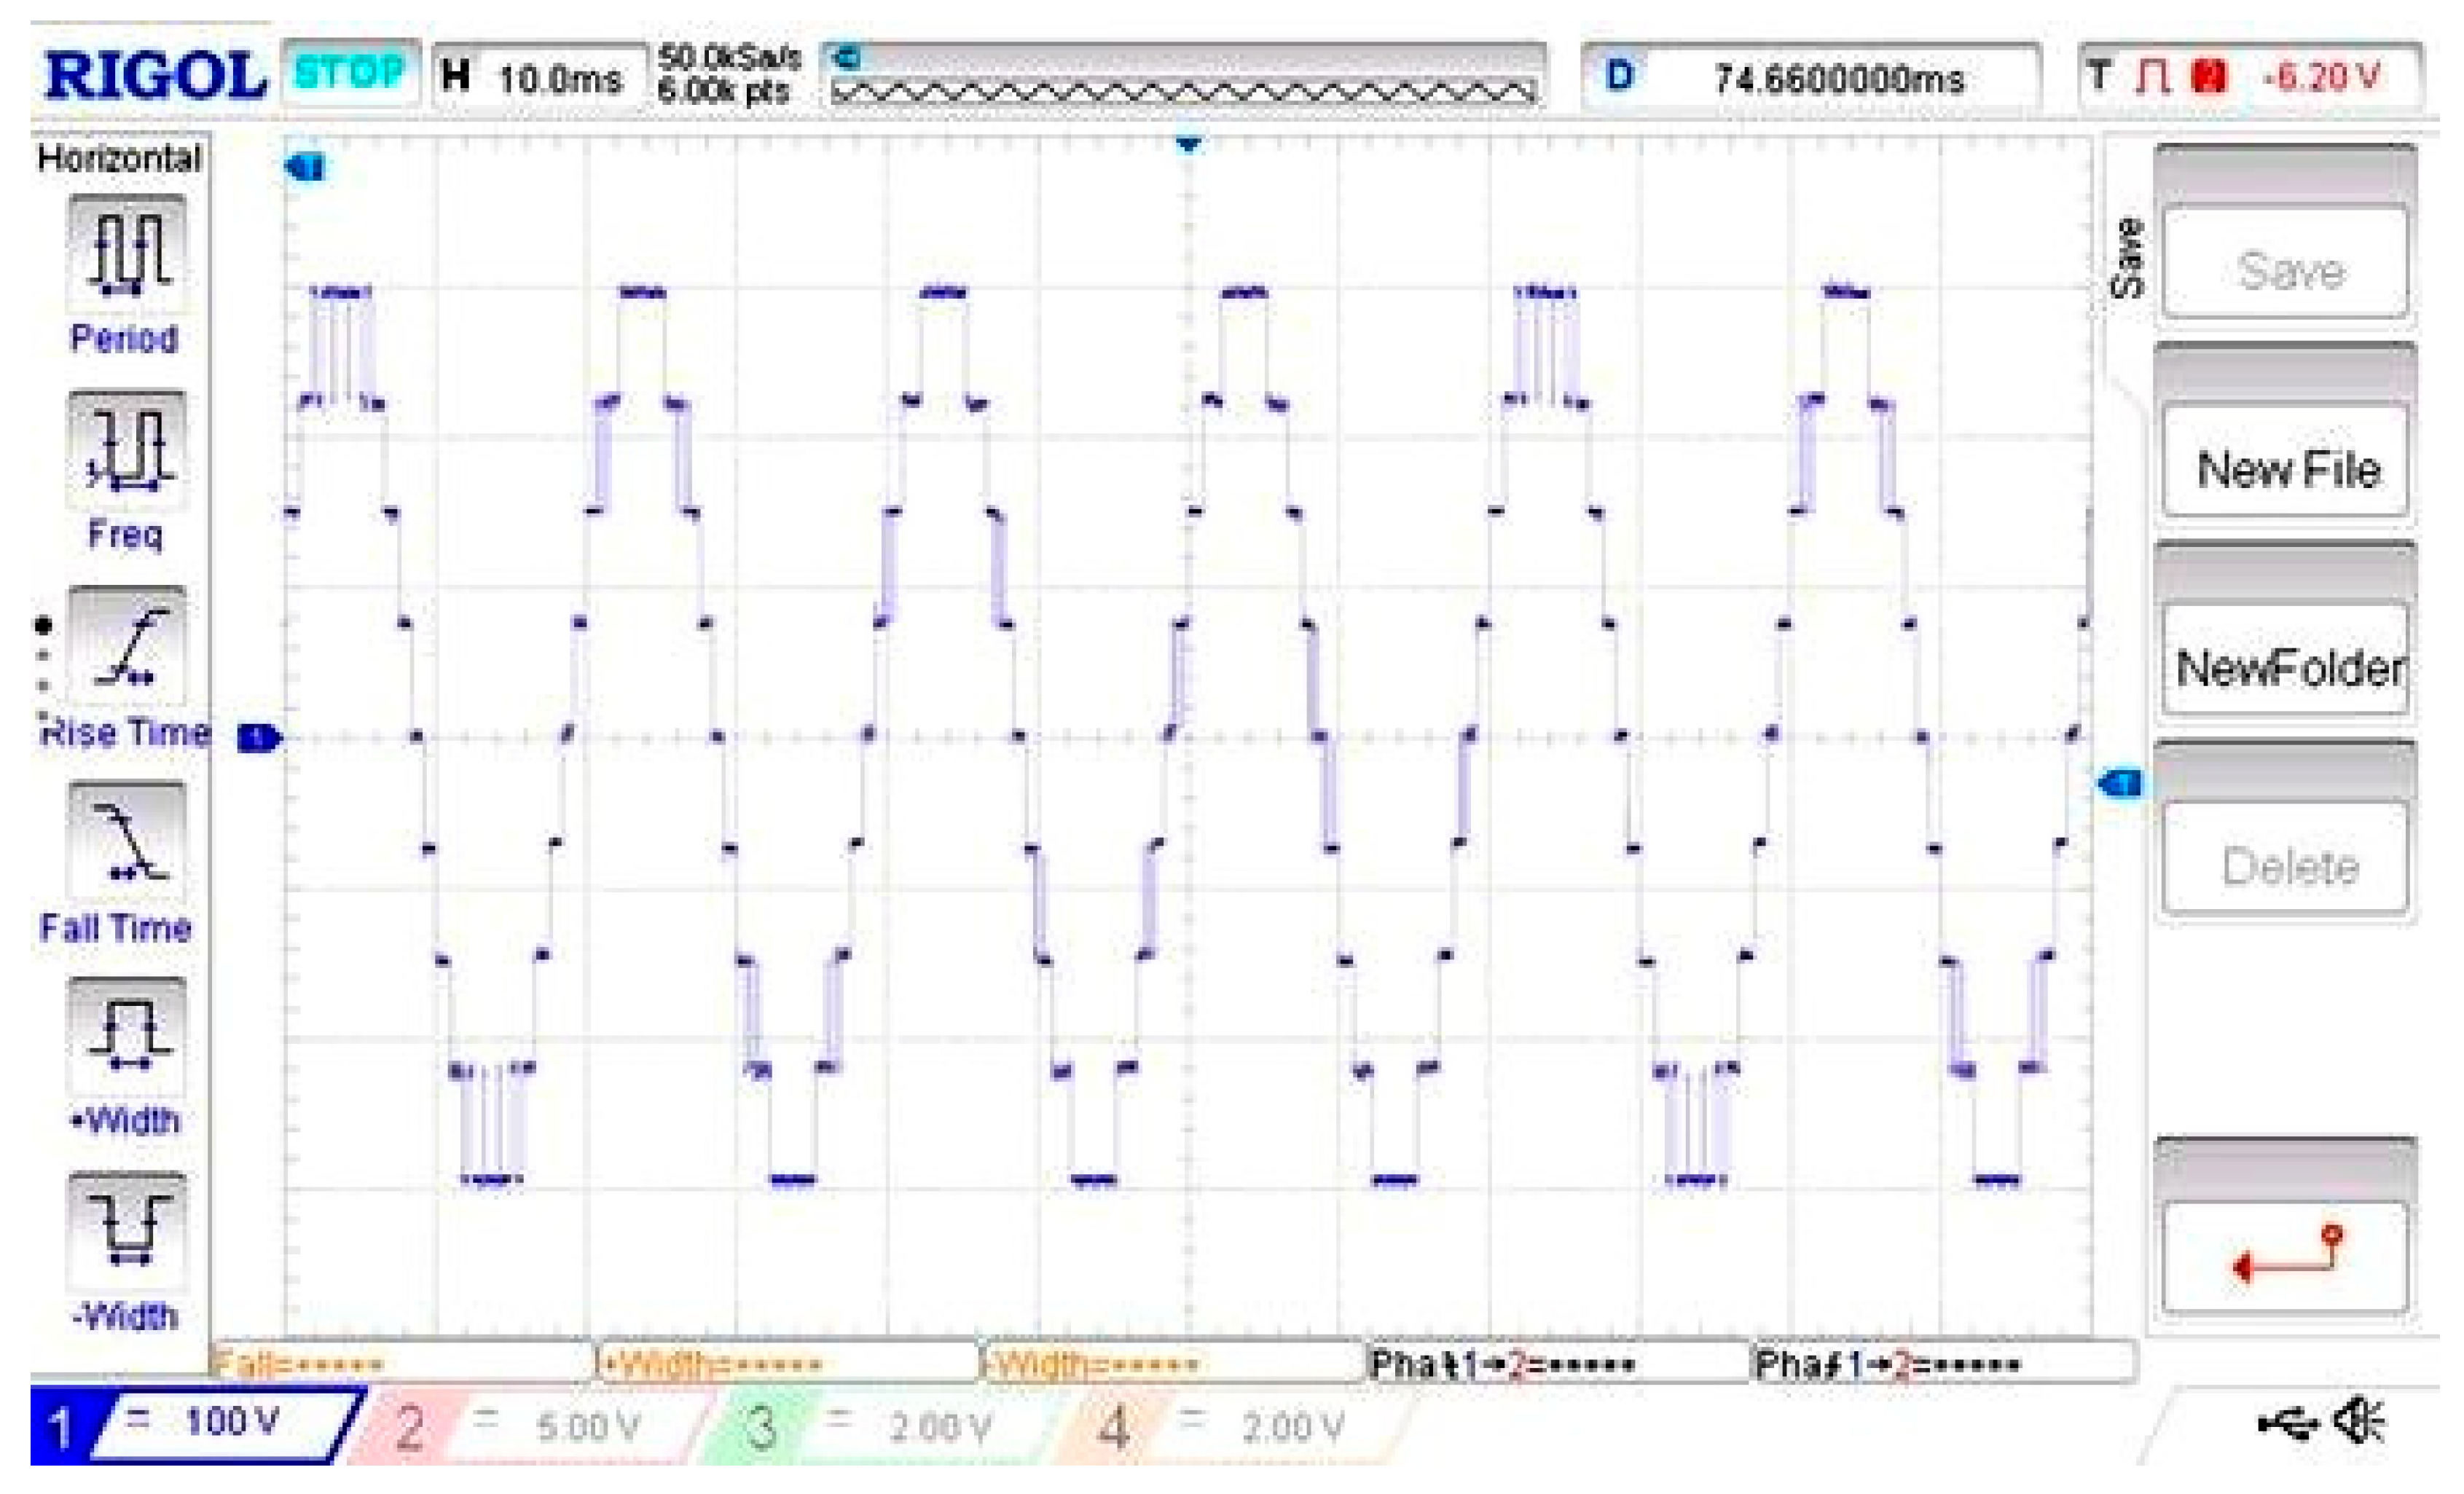
Experimental output voltage waveform for the A2EFSPWM method. The measured stepped waveform demonstrates accurate level synthesis and minimal distortion.
Figure 32.
Experimental output voltage waveform for the A2EFSPWM method. The measured stepped waveform demonstrates accurate level synthesis and minimal distortion.
Figure 33.
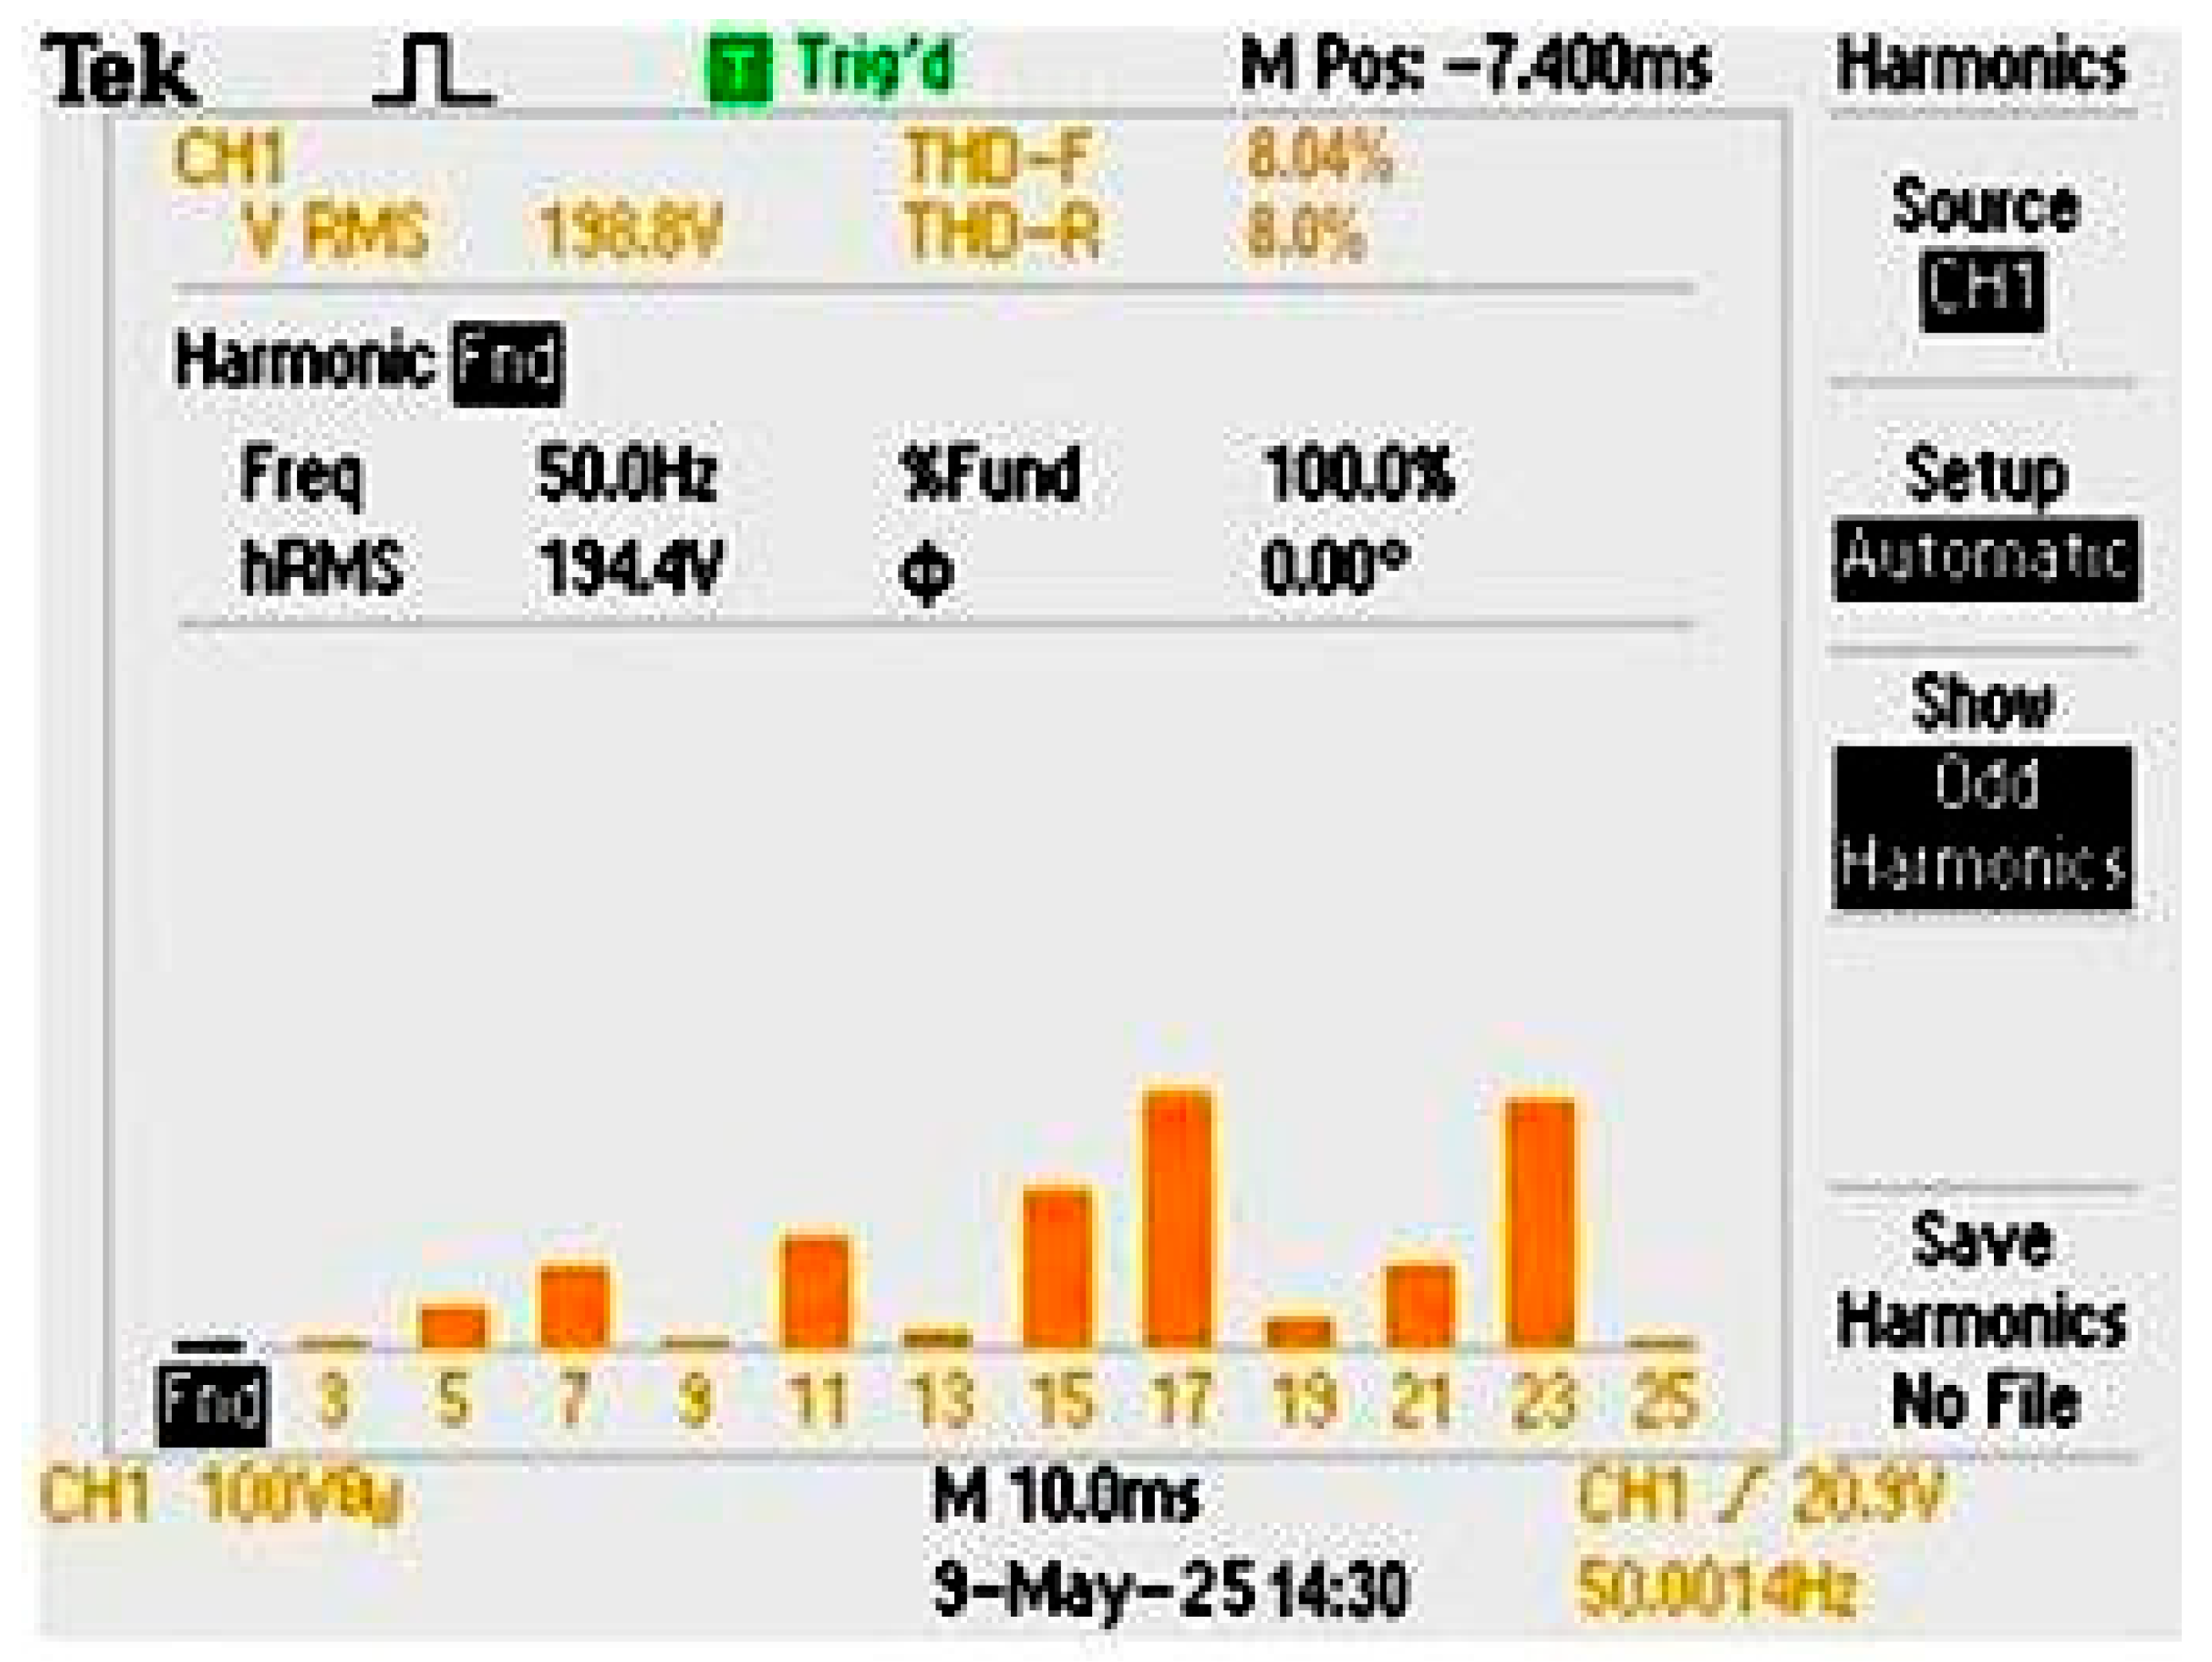
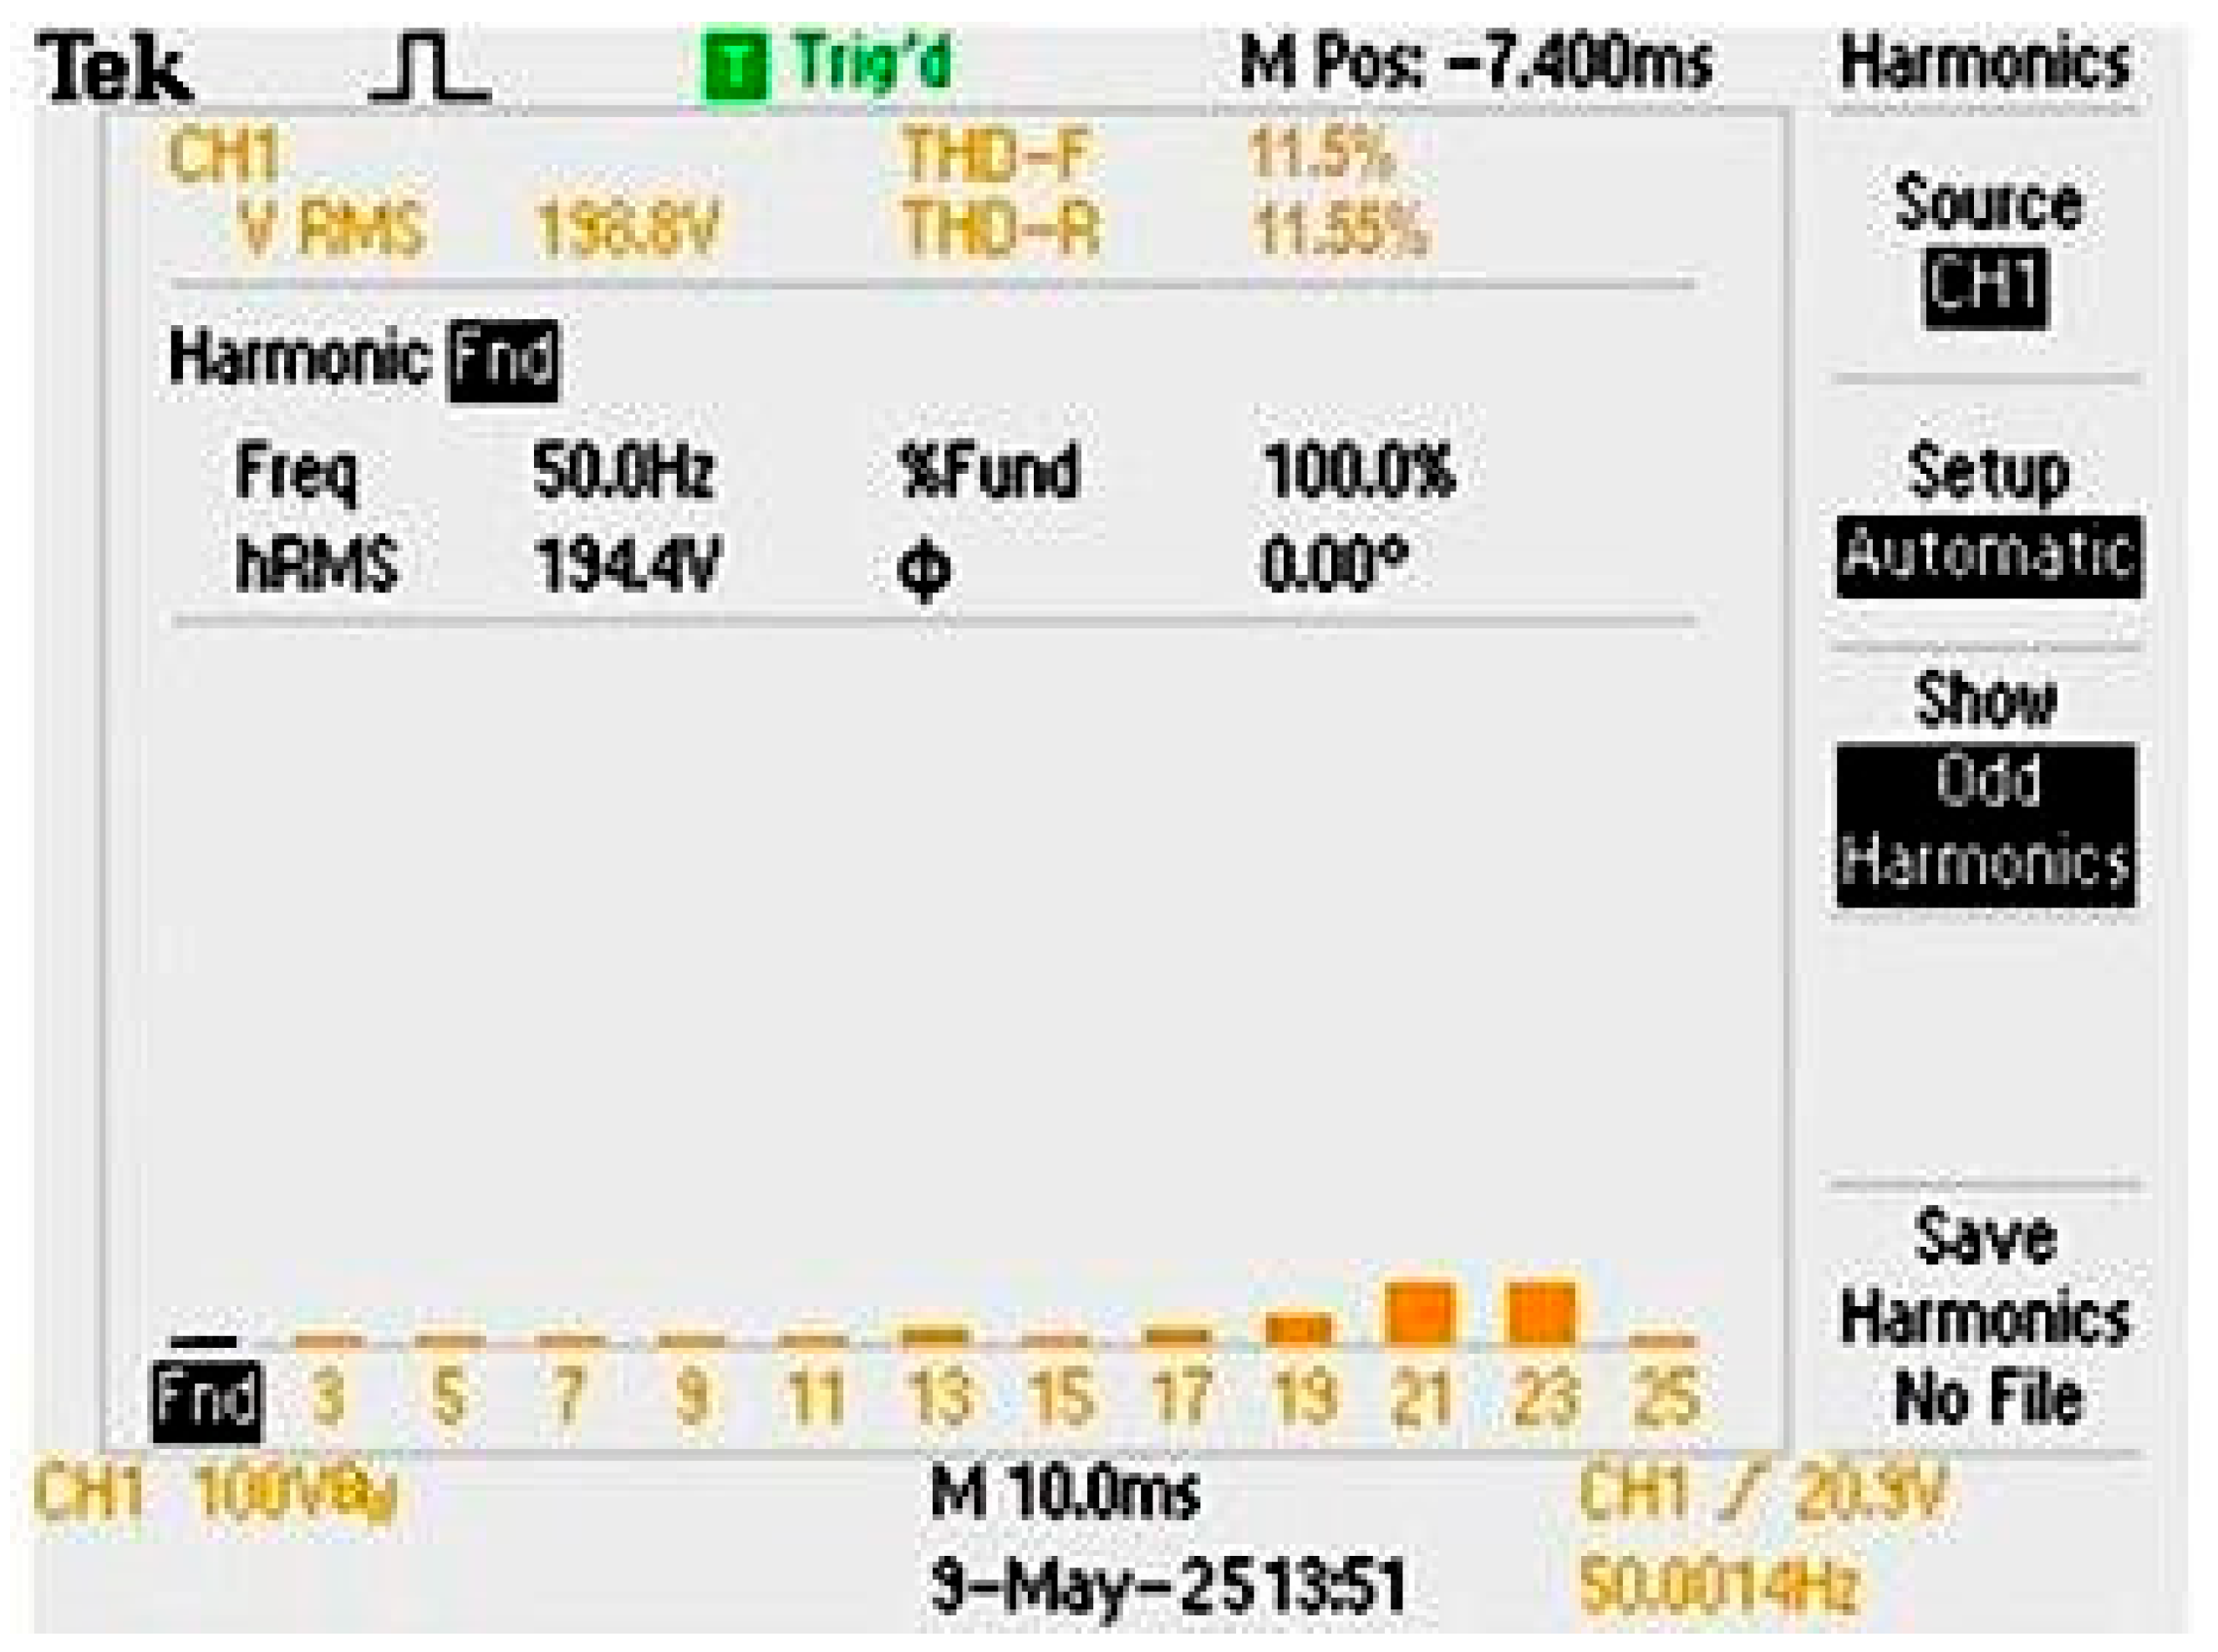
FFT spectrum of the experimental output voltage obtained using A2EFSPWM. The low-order harmonics (5th, 7th, 11th, and 13th) are effectively suppressed, yielding a total harmonic distortion (THD) of approximately 4.5%.
Figure 33.
FFT spectrum of the experimental output voltage obtained using A2EFSPWM. The low-order harmonics (5th, 7th, 11th, and 13th) are effectively suppressed, yielding a total harmonic distortion (THD) of approximately 4.5%.
Figure 34.
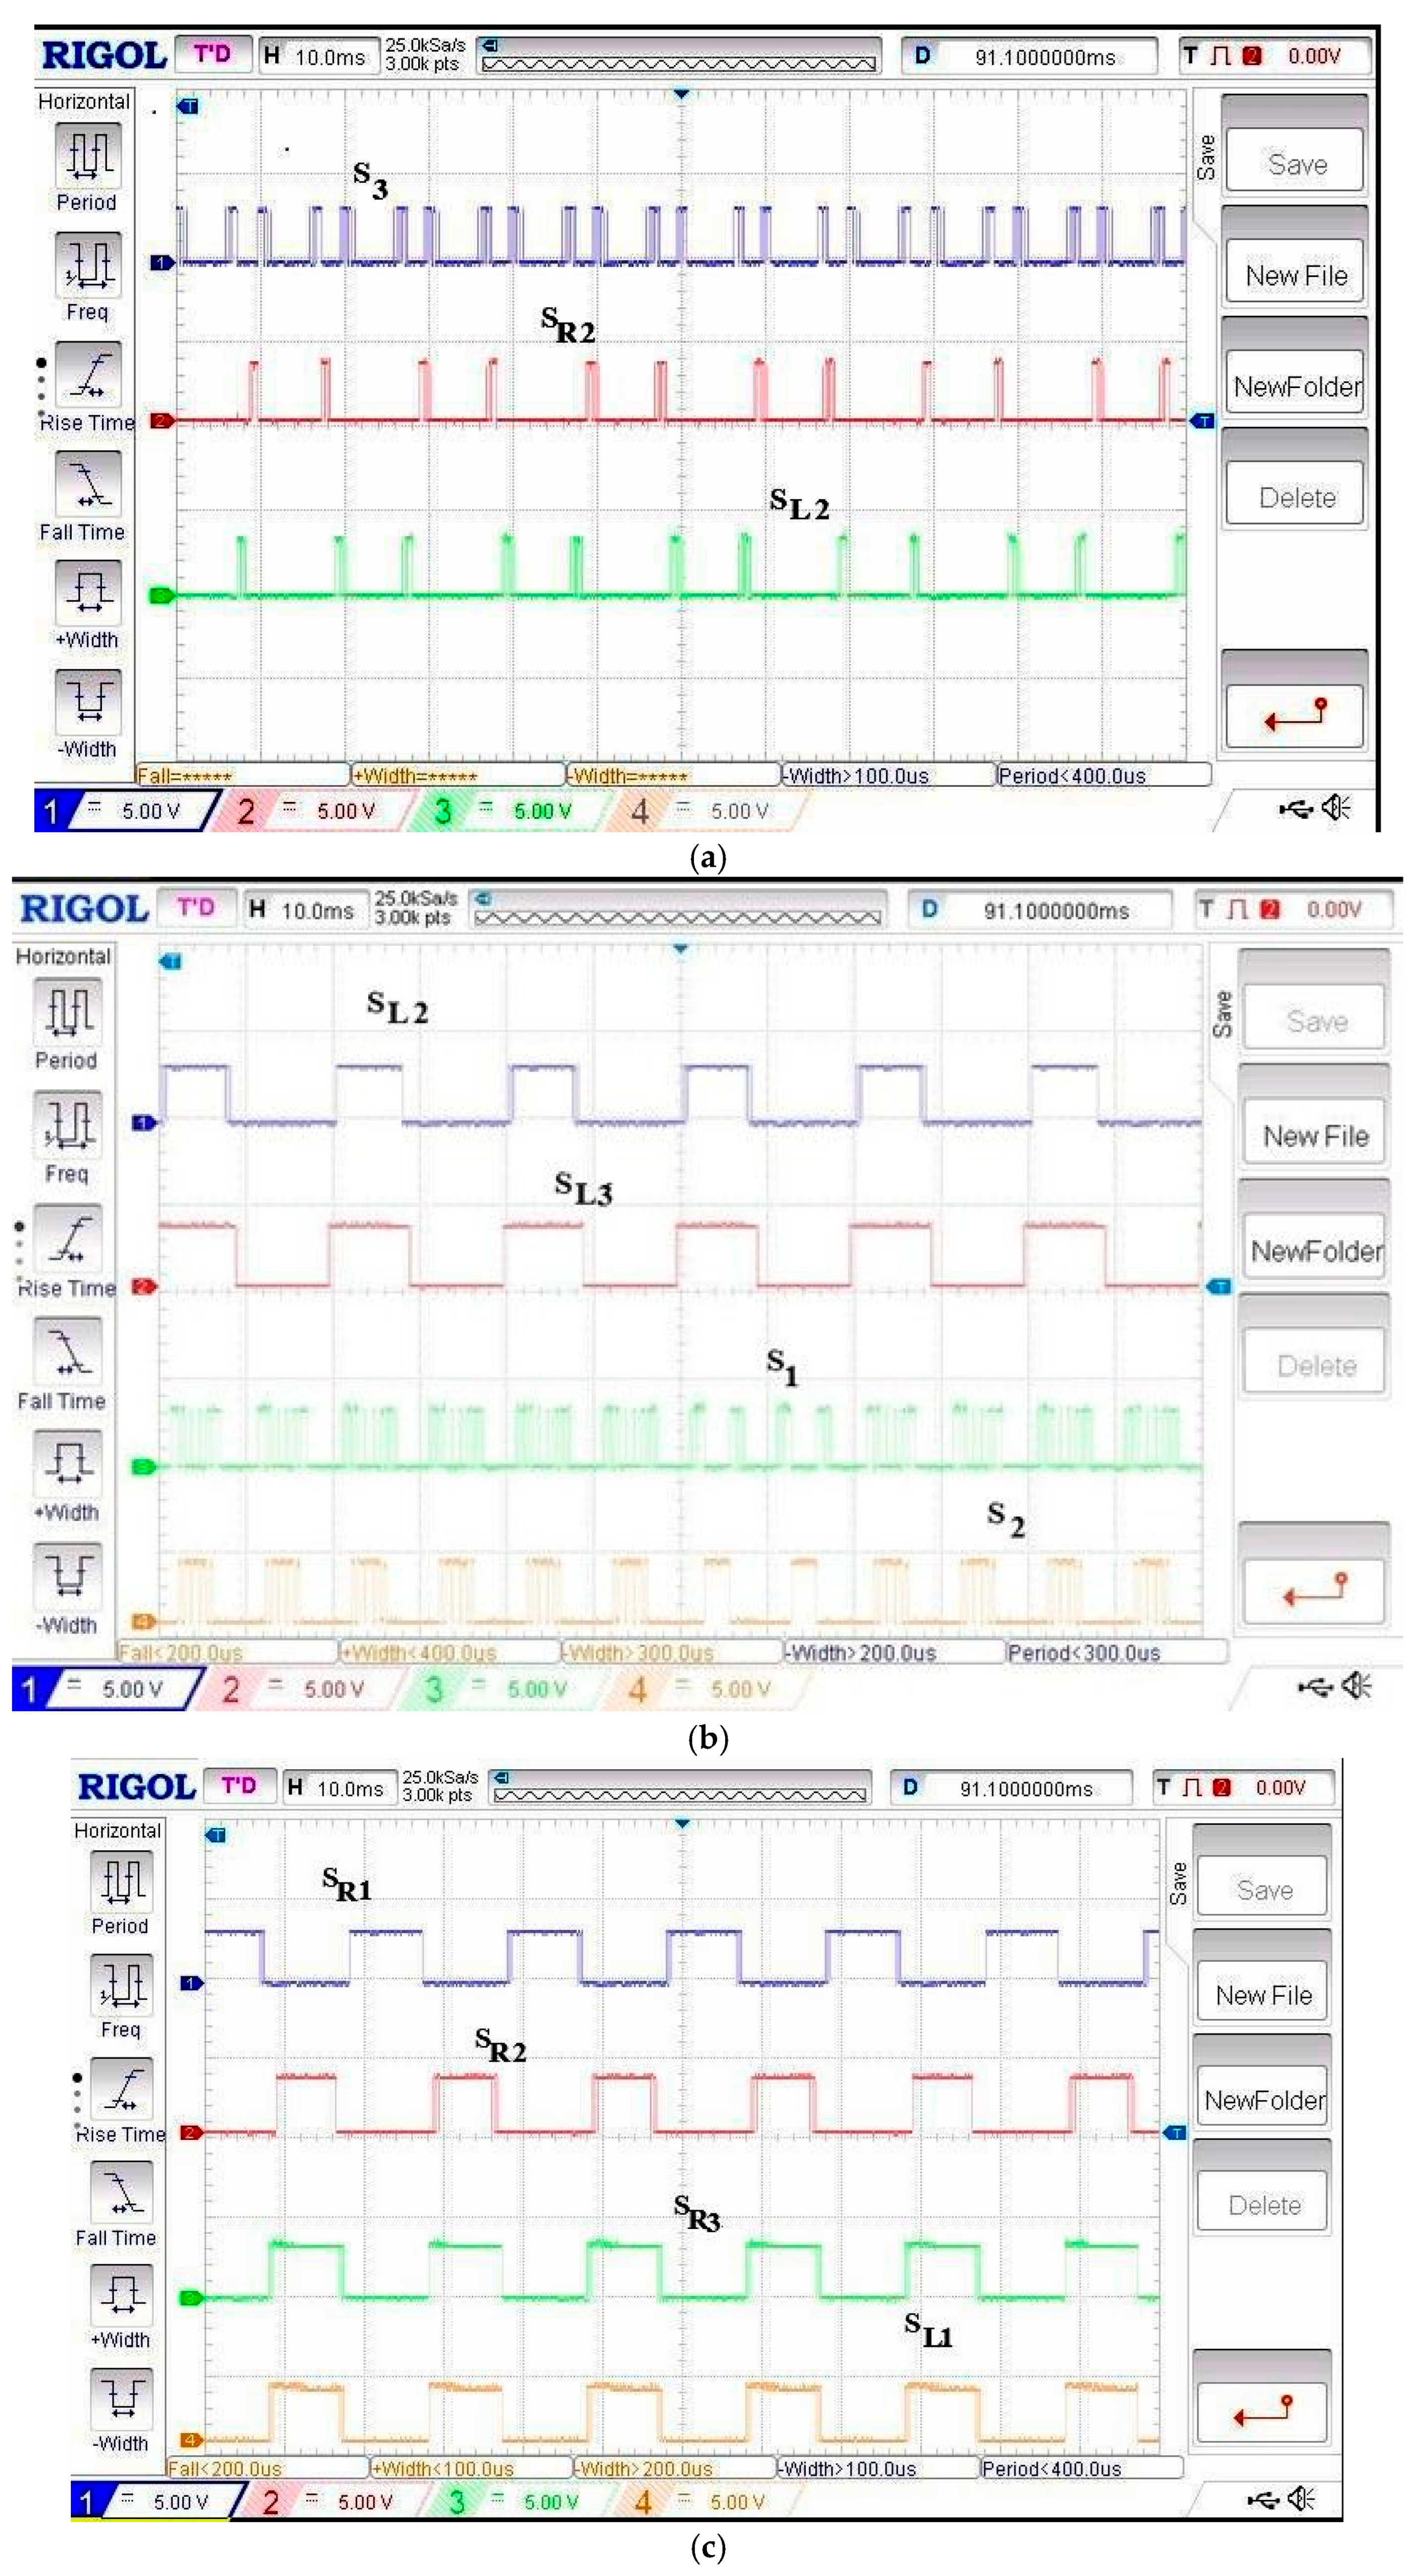
(a) Experimental PWM gating pattern for the AFSAEPWM technique in the positive half-cycle, generated through the hybrid carrier-less modulation approach. (b) Experimental PWM gating pattern for the AFSAEPWM method during the negative half-cycle, showing a symmetrical pulse distribution and correct timing alignment. (c) Full-cycle PWM pulse sequence for the AFSAEPWM technique, verifying synchronized operation of positive and negative intervals under equal-area control. Figure (a–c) Experimental PWM gating patterns for the amalgamated fundamental-switching-area-equalized PWM (AFSAEPWM) method. Subfigures (a,b) show positive and negative half-cycle patterns, while (c) illustrates the full-cycle PWM circulation. The hybrid carrier-less modulation ensures synchronized switching and symmetry between conduction intervals.
Figure 35.
Experimental output voltage waveform for the AFSAEPWM method. The stepped waveform exhibits uniform voltage intervals and high waveform fidelity.
Figure 35.
Experimental output voltage waveform for the AFSAEPWM method. The stepped waveform exhibits uniform voltage intervals and high waveform fidelity.
Figure 36.
Measured output voltage spectrum corresponding to the AFSAEPWM technique. The spectrum reveals strong suppression of low-order harmonics, confirming enhanced power quality and reduced total harmonic distortion (THD).
Figure 36.
Measured output voltage spectrum corresponding to the AFSAEPWM technique. The spectrum reveals strong suppression of low-order harmonics, confirming enhanced power quality and reduced total harmonic distortion (THD).
Table 1.
Relations for computing the magnitude value of DC voltage source.
Table 1.
Relations for computing the magnitude value of DC voltage source.
| Sl. No. | Source Magnitude Configuration | Voltage Level Expression | Total Number of Output Levels |
|---|
| 1 | DC1 = DC2 = DC3 = Vdc | Vout = ±(DC1 + DC2 + DC3) = ±3Vdc | 6 × 31 + 1 = 19 |
| 2 | DC1 = DC2 = DC3 = Vdc | Vout = ±(DC1 + DC2 + DC3 + DC4) = ±4Vdc | 6 × 32 + 1 = 37 |
| 3 | DC1 = DC2 = DC3 = Vdc | Vout = ±(DC1 + DC2 + DC3 + DC4 + DC5) = ±5Vdc | 6 × 33 + 1 = 55 |
| 4 | DC1 = DC2 = DC3 = Vdc | Vout = ±(DC1 + DC2 + DC3 + DC4 + DC5 + DC6) = ±6Vdc | 6 × 34 + 1 = 73 |
Table 2.
Switching states and conducting devices of the proposed 21-level RCC-MLI.
Table 2.
Switching states and conducting devices of the proposed 21-level RCC-MLI.
| Output Voltage Level | Active Switches | Conducting Devices | Current Path Description |
|---|
| +VDC1 | SL1, SR1, and S1 | Two unidirectional switches + load | Current flows through upper left and right arms via S1 |
| +VDC2 | SL2, SR1, S1, and S2 | Four switches | Second source adds to voltage synthesis |
| +VDC3 | SL3, SR2, S2, and S3 | Four switches | Third DC source participates in series addition |
| +VDC2 + VDC3 − VDC1 | SR1, S′R2, SL3, and S1 | Four switches | Reverse polarity state with negative terminal clamping |
| 0 | S1 and S2 | Two switches | Neutral or zero-voltage condition |
| −VDC1 | S′L1, S′R1, and S2 | Three switches | Negative half-cycle; reverse current path |
| −VDC2 | S′L2, S′R1, and S3 | Four switches | Extended negative level |
| −VDC3 | S′L3, S′R2, and S3 | Four switches | Full negative level output |
Table 3.
Simulation and experimental parameters.
Table 3.
Simulation and experimental parameters.
| Parameter | Symbol/Description | Value/Range |
|---|
| DC source voltages | VDC1, VDC2, and VDC3 | 33 V each (total 100 V DC link) |
| Load resistance | R | 100 Ω |
| Load inductance | L | 100 mH |
| Switching frequency | few | 2 kHz |
| Modulation index | m | 0.8−1.0 |
| Number of output levels | - | 9 levels |
| Controller | - | Xilinx Spartan-3E FPGA (50 MHz) |
| Power devices | - | IRG4BC20SD IGBTs |
| Gate driver ICs | - | R2110I |
| Oscilloscope | - | Tektronix TDS2024C (200 MHz, 2 GS/s) |
| Power analyzer | - | Fluke 43B |
Table 4.
Confirmation of excellent correlation between simulation and experimental results.
Table 4.
Confirmation of excellent correlation between simulation and experimental results.
| Parameter | DC Bus (VDC) | Modulation Index (m) | Switching Frequency (fs, kHz) | Load R–L (Ω–mH) | Simulation | Experimental | Absolute Error | Relative Error (%) |
|---|
| THD (%) | 100 | 1.0 | 2.0 | 100—100 | 4.3 | 4.5 | 0.2 | 4.65 |
| Efficiency (%) | 100 | 1.0 | 2.0 | 100—100 | 95.4 | 95.2 | 0.2 | 0.21 |
| Fundamental RMS voltage (V) | 100 | 1.0 | 2.0 | 100—100 | 70.8 | 69.7 | 1.1 | 1.55 |
| Peak voltage stress (% of VDC) | 100 | 1.0 | 2.0 | 100—100 | 45.0 | 46.2 | 1.2 | 2.67 |
| Switching frequency (kHz) | 100 | 1.0 | 2.0 | 100—100 | 2.0 | 2.0 | 0 | 0 |
Table 5.
The detailed specifications of the power semiconductor devices, gate driver units, controller, and filtering elements employed in the prototype are presented below.
Table 5.
The detailed specifications of the power semiconductor devices, gate driver units, controller, and filtering elements employed in the prototype are presented below.
| Component Type | Description/Part Number | Key Specifications/Ratings | Remarks/Function |
|---|
| Semiconductor devices | IGBT—IRG4BC20SD | VCES = 600 V, IC = 20 A, and Ron = 0.18 Ω | Used as main switching devices for both unidirectional and bidirectional paths Two IGBTs configured in common-emitter form act as bidirectional switches |
| Gate driver IC | IR2110 high- and low-side driver | Input logic = 3.3–5 V; output = up to 600 V | Provides level-shifted gate pulses to the IGBT; isolates control and power circuits |
| PWM controller | Xilinx Spartan-3E FPGA board | 50 MHz clock; 32 I/O pins | Generates digital carrier-less PWM pulses using LUT-based sine reference patterns |
| PWM controller | Rectified single-phase supply | 230 V AC; 50 Hz→100 V DC after filtering | Provides input DC voltage for triple-source module |
| Filter inductor (L) | Air-core inductor | 100 mH | Smooths load current and attenuates switching harmonics |
| Filter resistor (R) | Power resistor | 100 Ω | Represents the load and defines the current magnitude during experiments |
| Capacitor (optional for filtering) | Electrolytic capacitor | 470 μF/250 V | Used to stabilize the DC bus and suppress ripple voltage |
| Measurement equipment | Measurement equipment | 100 MHz bandwidth; isolated voltage/current probes | - |
Table 6.
A comparative evaluation of the proposed triple-source reduced-component MLI against recent topologies reported in [
19,
20,
21,
22,
23,
24,
25,
26].
Table 6.
A comparative evaluation of the proposed triple-source reduced-component MLI against recent topologies reported in [
19,
20,
21,
22,
23,
24,
25,
26].
| Parameter | CHB MLI [19] | NPC MLI [20] | Switched-Capacitor MLI [21] | Asymmetric MLI [22] | Proposed Triple-Source RCC-MLI |
|---|
| No. of voltage levels (example) | 21 | 17 | 17 | 22 | 21 |
| No. of switches | 36 | 28 | 28 | 20 | 11 |
| No. of gate drivers | 36 | 28 | 28 | 18 | 9 |
| No. of DC sources/capacitors | 7 DC + balancing caps | 5 DC + 10 caps | 5 DC + 10 caps | 4 DC | 3 DC (triple-source module) |
| Peak voltage stress (% of Vdc) | 100% | 80% | 80% | 65% | ≈45% |
| THD (%) | 8.20% | 7.60% | 7.60% | 6.20% | 4.30% |
| Efficiency (%) | 91.00% | 92.50% | 92.50% | 93.80% | 95.20% |
| Component reduction ratio | - | 1 | 1 | 1.4 | 1.8 |
| PWM control type | Multicarrier SPWM | Level-shifted PWM | Level-shifted PWM | SHE-PWM | Carrier-less hybrid PWM (A2EFSPWM/AFSAEPWM) |
| Special features | Modular design | Neutral point | Neutral point | Flexible DC ratios | Minimal components; high waveform quality |
Table 7.
Comparative performance analysis of PWM strategies.
Table 7.
Comparative performance analysis of PWM strategies.
| Parameter | Traditional AEPWM | Carrier-Less CLPWM | Proposed Hybrid PWM (RCC-MLI) |
|---|
| THD (%) | 8.2 | 6.7 | 4.3 |
| Efficiency (%) | 91.5 | 93 | 95.2 |
| Switching frequency (kHz) | 5 | 2 | 2 |
| Common-mode voltage (V) | 22 | 18 | 10 |
| Peak device voltage stress (% of Vdc) | 70 | 60 | 45 |
| No. of conducting switches per cycle | 6 | 5 | 4 |
| Computation complexity | High | Moderate | Low (FPGA lookup) |
