Article

A Dynamic Evaluation Method for Pumped Storage Units Adapting to Asymmetric Evolution of Power System

1
State Grid Corporation of China, Beijing 100031, China
2
State Grid Shandong Electric Power Company, Jinan 250001, China
3
State Grid Electric Power Engineering Research Institute Co., Ltd., Beijing 100069, China
4
State Grid Shandong Electric Power Research Institute, Jinan 250003, China
5
School of Electrical and Power Engineering, Hohai University, Nanjing 210098, China
*
Author to whom correspondence should be addressed.
Symmetry 2025, 17(11), 1900; https://doi.org/10.3390/sym17111900
Submission received: 9 October 2025 / Revised: 4 November 2025 / Accepted: 5 November 2025 / Published: 7 November 2025
(This article belongs to the Special Issue Symmetry with Power Systems: Control and Optimization)

Abstract

As the core component of pumped storage stations (PSS), pumped storage units (PSU) require a scientific and comprehensive evaluation method to guide the selection of optimal units and support the development of the new-type power system (NPS). This paper aims to address the symmetry issues in PSU evaluation methods by proposing an innovative approach based on evolutionary combination weighting and cloud model theory, thereby adapting to the long-term asymmetric evolution of the power system. First, the subjective and objective weights of indicators at all levels for PSU are obtained using the analytic hierarchy process (AHP) and the entropy weight method (EWM). Then, the optimal combination coefficients for subjective and objective weights are determined through game theory, achieving symmetry and balance between the subjective and objective weights. Subsequently, dynamic correction of the indicator weights is realized using a designed evolutionary response function, enabling the weights to evolve dynamically in response to the asymmetric development of the power system. Finally, the cloud model is employed to characterize the randomness and fuzziness of evaluation boundaries, which enhances the adaptability of the evaluation process and the interpretability of results. The simulation results show that, when considering the long-term asymmetric evolution of the power system, the expected score deviations of secondary indicators are approximately 4.7%, 1.3%, 3.5%, and 7.7%, respectively, with an overall score deviation of about 6.4%. The proposed method not only achieves symmetry and balance between subjective and objective factors in traditional evaluation but also accommodates the asymmetric evolution requirements of the power system.

1. Introduction

Against the backdrop of the global energy system’s accelerated transition towards decarbonization, establishing a new-type power system (NPS) with a high proportion of renewable energy has become the strategic core of China’s efforts to advance its energy revolution and achieve the “dual carbon” goals [1,2,3]. However, the large-scale integration of highly volatile and stochastic renewable energy sources, represented by wind and solar power, poses severe challenges to the stable operation and real-time balance of the power grid [4,5]. As a technologically mature and large-scale form of energy storage, pumped storage station (PSS) has become a key technical solution to address these challenges and support the integration of a high proportion of new energy sources, owing to its superior capabilities in peak shaving, valley filling, rapid response, and frequency regulation [6]. It has now emerged as a research hotspot in the power sector [7].
Currently, scholars have conducted extensive research on the optimal operation of PSS [8,9]. Depending on the time scale involved, research related to PSS can be divided into two aspects. The first focuses on medium- to long-term energy time-shifting and cross-seasonal regulation to enhance the power system’s adaptability to interannual fluctuations in renewable energy [10]. The second concentrates on short-term intraday real-time balance and rapid response to address minute- or hour-level fluctuations in wind and solar power, thereby ensuring the safe and stable operation of the power grid [11]. Li et al. [12] utilized PSS to leverage the cross-seasonal regulation capability of renewable energy, establishing an optimal dispatch model for seasonal PSS that mitigates the seasonal fluctuations of renewable energy. Furthermore, Wang et al. [13] proposed retrofitting neighboring water plants into hybrid PSS, determining the optimal sizing of the hybrid PSS to enhance the integration of renewable energy. For the latter, Jin et al. [14] addressed intra-day fluctuations of renewable energy through PSS regulation, constructing a two-stage distributed robust optimization model based on the Wasserstein metric. Lei et al. [15] conducted a more detailed division of time scales, considering the operational characteristics of PSS at hourly and second-level scales, and analyzed the relationship between PSS and multi-time-scale operational characteristics under different short-term dispatch strategies. Reference [16] simultaneously leveraged the advantages of PSS in long-term and short-term operations, constructing a long-medium-short-term nested operation model for a hydro-wind-solar hybrid system to meet the operational requirements of the hybrid system under multiple scenarios. These studies demonstrate that PSS can effectively enhance the power system’s adaptability to renewable energy fluctuations and play a critical role in promoting the integration of new energy sources and strengthening grid stability. In the construction of future low-carbon power systems, PSS will further leverage their flexibility advantages to ensure grid security and stability and facilitate the efficient integration of new energy sources [17,18].
Pumped storage units (PSU), as the core components of PSS, directly determine the plant’s operational efficiency, power supply reliability, and lifecycle benefits [19,20]. Therefore, conducting a scientific and comprehensive evaluation of these units is crucial for guiding the optimal selection of pumped storage equipment, thereby promoting the low-carbon transformation of the power system. Related research primarily unfolds from two aspects: the construction of evaluation systems and the design of comprehensive evaluation methods. At the level of evaluation system construction, Lei et al. [21] established a comprehensive evaluation index system for the dynamic performance of variable-speed power units, focusing on assessing the overall performance of units under different operating conditions. Considering the synergistic effects of fixed-speed and variable-speed units, Ling et al. [22] proposed a multi-criteria evaluation framework to assess the optimization effectiveness of cooperative operation strategies for hybrid pumped storage power stations. In terms of comprehensive evaluation methods, Peng et al. [23] introduced a novel approach based on the principle of equivalent substitution and system operation simulation to evaluate the value of pumped storage in nuclear power plants. This method incorporates penalties for wind and solar curtailment in dispatch model simulations. Building upon the method in [23,24] further investigated the benefits that PSS brings to NPS, which can provide references for PSS planning issues. Addressing the aging issue of PSU, Zhang et al. [25] proposed a health assessment method integrating quantile regression neural networks (QRNN) with a multi-head self-attention mechanism (MSM) to comprehensively evaluate the operational health status of the units. Table 1 provides a further comparison of the methodologies and contributions of the relevant studies.
While the aforementioned studies provide valuable references for constructing evaluation systems and designing methodologies for PSU [21,25], several critical limitations remain. Specifically, the comprehensive evaluation methods mentioned only consider the current state of the power system’s development, failing to account for its asymmetric evolutionary trajectory [22]. This may render the indicator weights for PSU inapplicable over an extended period, leading to significant discrepancies between the final evaluation conclusions and the practical requirements for building NPS [23,24]. Consequently, these methods cannot accurately reflect the core value of PSU in the development of future power systems and may even misguide investment decisions for medium- to long-term energy projects. Furthermore, existing studies seldom comprehensively assess the contribution of PSU to the development of low-carbon power systems, thus failing to provide effective data support for further improvements in PSS.
To overcome these challenges, this paper proposes a PSU evaluation method based on evolutionary combination weighting-cloud model theory, aiming to achieve comprehensive scientific evaluation of the PSU’s supporting role in NPS construction, thus guiding the optimization and improvement of PSU to provide data support and theoretical basis. The primary contributions of this work are summarized below:
  • Compared with traditional evaluation methods, the proposed approach considers the asymmetric evolutionary development of the power system over long time spans, improves static evaluation into a dynamic method, and accurately characterizes the supporting role of PSU in the construction of NPS, while avoiding scoring errors caused by power system asymmetric evolution in traditional methods.
  • The proposed method derives various indicators for PSU from relevant policy documents and balances conflicts between subjective and objective weights based on game theory, ensuring comprehensive indicator coverage and symmetrical, balanced weighting. By introducing a cloud model to characterize the uncertainty and asymmetry of evaluation results, the adaptability of the evaluation process and the interpretability of the results are enhanced.
  • Based on the asymmetric evolution requirements of the power system, this paper proposes improvements to enhance the performance of PSU. These suggestions provide feasible pathways for equipment upgrading and full life-cycle planning.
In this paper, Section 2 introduces the proposed evaluation method based on evolutionary combination weighting and cloud model. Section 3 describes the evaluation framework. Case studies and conclusions are presented in Section 4 and Section 5.

2. Evaluation Method Based on Evolutionary Combination Weighting and Cloud Model

2.1. Subjective Weight Determination Method

This study employs the Analytic Hierarchy Process (AHP) to determine the subjective weights of PSU indicators. First, a hierarchical structure comprising the target layer, criterion layer, and indicator layer is established [27]. Subsequently, an expert judgment matrix for PSU is obtained through pairwise comparisons of various indicators based on actual units. Finally, the weight matrices from each expert are consolidated and normalized to derive the weight vector for PSU indicators. Notwithstanding this inherent subjectivity, AHP is adopted in this paper to determine the subjective weights owing to its status as one of the most commonly used and effective evaluation methods [28]. A more detailed implementation is presented below.
Assume that a total of N experts evaluate m indicators. Each expert performs pairwise comparisons of these indicators using the 1–9 scale method to establish a judgment matrix. The judgment matrix for a given expert is expressed as follows [28]:
A s u b n = a i j n m × m , a i j n = a j i n 1 , a i i = 1
where A s u b n is an m-th order square matrix. n is the index of the experts, where n = 1, 2, 3, …, N. i and j are the row and column indices of the judgment matrix. The element a i j n represents the result of expert n’s comparison of the importance of indicator i to indicator j, and it satisfies the reciprocal property a i j n = a j i n 1 . When i = j, a i j n = 1.
The weights of the indicators can then be calculated using (2), and the average weight from all experts is obtained using (3) [22].
w i n = j = 1 m a i j n 1 / m i = 1 m j = 1 m a i j n 1 / m , i = 1 , 2 , , m
w i = n = 1 N w i n / N , i = 1 , 2 , , m
where w i n is the standardized weight of indicator i obtained from the judgment matrix; w i is the average weight of indicator i; and m is the number of indicators.
Subsequently, the average weight is normalized using (4) to obtain the subjective weight of each indicator.
w s u b = w 1 / i = 1 m w i , w 2 / i = 1 m w i , , w m / i = 1 m w i
where w s u b is the subjective weight vector composed of the normalized weights of m indicators.

2.2. Objective Weight Determination Method

This study employs the Entropy Weight Method (EWM) to determine the objective weights of PSU indicators. This approach calculates weights by quantifying the dispersion degree of observed values for each indicator, effectively avoiding the interference of human subjective factors [29]. In specific implementation, an initial judgment matrix is first constructed based on PSU sample data. Subsequently, by calculating the information entropy and difference coefficient of each indicator, an objective weight vector representing the relative importance of indicators is ultimately obtained. First, the initial judgment matrix is constructed according to (5).
B o b j = b i j s × m , 0 b i j 1
where B o b j is the judgment matrix; b i j is the standardized matrix element, where i and j are the row and column indices of the matrix; s is the number of samples; and m is the number of indicators.
Subsequently, the entropy value of each indicator is calculated using (6) [26].
e j = 1 ln s i = 1 s b i j / i = 1 s b i j ln b i j / i = 1 s b i j , j = 1 , , m
where e j represents the entropy value of indicator j.
Finally, based on the magnitude of the entropy values, the entropy weight dj is calculated using (7) [29], and the objective weight vector for each indicator is obtained through (8).
d j = 1 e j k = 1 m 1 e k 1 , j = 1 , , m
w o b j = d 1 , d 2 , , d m
where d j is the normalized weight of the j-th indicator. The weights of all indicators collectively form the objective weight vector w o b j ; k is a temporary variable used in the summation operation.

2.3. Evolutionary Combination Weighting Method

In the comprehensive evaluation system for PSU, a single method often fails to fully capture indicator disparities and accurately reflect their true importance [29]. Subjective weighting methods like AHP are susceptible to experts’ cognitive biases regarding unit operational characteristics, while objective methods such as EWM rely entirely on the distribution characteristics of historical operational data. Due to limitations in expert experience and potential data quality issues, using either method independently may compromise the accuracy of unit performance assessment. Therefore, this paper employs game theory to determine the optimal combination coefficients for integrating weights, thereby addressing the drawbacks of relying solely on either subjective or objective methods for PSU evaluation [30]. Furthermore, the weights of PSUs are subsequently refined through an evolutionary response function.
The weight coefficients are obtained by solving the model given in (9) and (10). Here, (9) defines the objective function, which aims to minimize the deviation between the combined weights and the base sets (subjective and objective weights). Equation (10) specifies the corresponding constraint condition.
min α , β   α w s u b + β w o b j w s u b 2 2 + α w s u b + β w o b j w o b j 2 2
subject   to :   α + β = 1 , α 0 , β 0
where α and β represent the optimized decision variables, whose sum is constrained to 1 with all elements being non-negative; · 2 denotes the L2-norm (Euclidean norm) of a vector.
It should be noted that the aforementioned method only assigns weights to the current evaluation system without considering the evolution of the power system. Over a longer time span, the indicator weights obtained by traditional combination weighting methods may no longer be applicable. Therefore, this paper proposes a novel evolutionary combination weighting method that incorporates a designed evolutionary response function to achieve dynamic correction of indicator weights. The evolutionary response function is shown in (11). When an indicator becomes more important with the evolution of the power system, the value of this function will exhibit an increasing trend.
υ i t = 1 + λ i t , i = 1 , 2 , , m , λ i 0
where υ i t is the evolutionary response function corresponding to indicator i; λ i is the evolutionary factor of the corresponding indicator, whose magnitude depends on the direction and speed of power system evolution, it can be derived from relevant policy documents; t is the corresponding year time span.
This paper designs the evolutionary response function as a linear function, which facilitates subsequent calculations. It should be noted that the evolutionary response function can be easily extended to exponential or logarithmic forms without affecting the core conclusions of this study. The vector form of the evolutionary response function is shown below:
υ ( t ) = 1 + λ 1 t , 1 + λ 2 t , , 1 + λ m t
w ( t ) = α w s u b + β w o b j υ ( t ) = w 1 ( t ) , w 2 ( t ) , , w m ( t )
where w ( t ) is the weight vector modified by the evolutionary function; denotes the Hadamard product of vectors.
Finally, the normalized evolutionary weights are obtained according to (14).
w f i n a l ( t ) = w 1 ( t ) / i = 1 m w m ( t ) , w 2 ( t ) / i = 1 m w m ( t ) , , w m ( t ) / i = 1 m w m ( t )
where w f i n a l ( t ) is the final evolutionary weight vector.

2.4. Comprehensive Evaluation Method Based on Cloud Model

The cloud model, proposed by Chinese scholar Li Deyi, serves as a mathematical framework for handling uncertain conversions between qualitative concepts and quantitative data [31]. This model effectively captures the randomness and fuzziness inherent in human conceptual cognition and has found extensive applications in fields such as artificial intelligence, data mining, and decision analysis [32]. In this study, we employ this approach to characterize the fuzziness and uncertainty in PSU evaluation. Specifically, standard cloud model parameters are first determined through expert estimation. Subsequently, comprehensive cloud parameters for specific PSUs are derived through parametric evaluation. Finally, a forward cloud generator is utilized for visual comparison to obtain the evaluation results.
The cloud model primarily relies on three numerical characteristics to comprehensively describe a qualitative concept: expectation (Ex), entropy (En), and hyper-entropy (He), whose relationship is illustrated in Figure 1. Among them, Ex represents the central value of the cloud droplets’ distribution in the universe of discourse, signifying the most typical sample of the concept. En captures both the fuzziness of the concept and the randomness of its probability distribution; a larger value indicates a broader granularity and higher uncertainty of the concept. He, on the other hand, measures the uncertainty of Entropy itself, manifested as the dispersion of cloud droplets and the thickness of the cloud, reflecting the degree of deviation of randomness from Entropy. These three parameters can be determined using (15)–(17) [31].
Ex = C 1 c = 1 C x c
En = π / 2 1 / 2 C 1 c = 1 C x c E x
He = C 1 1 c = 1 C x c E x 2 E n 2 1 / 2
where Ex, En, and He represent the expectation, entropy, and hyper-entropy parameters of the cloud model, respectively; C denotes the number of cloud drops, with c being its index; and x c is the coordinate of the cloud drop.
The generation of the cloud model and its feature extraction are accomplished through a cloud generator. Specifically, the forward cloud generator takes the three numerical characteristics (Ex, En, He) of the cloud model as input and produces a large number of cloud-drops along with their certainty degrees, thereby transforming qualitative concepts into quantitative representations. Conversely, the backward cloud generator analyzes given quantitative sample data to compute the three numerical characteristics that represent the qualitative concept. The specific implementation is illustrated in Figure 2.
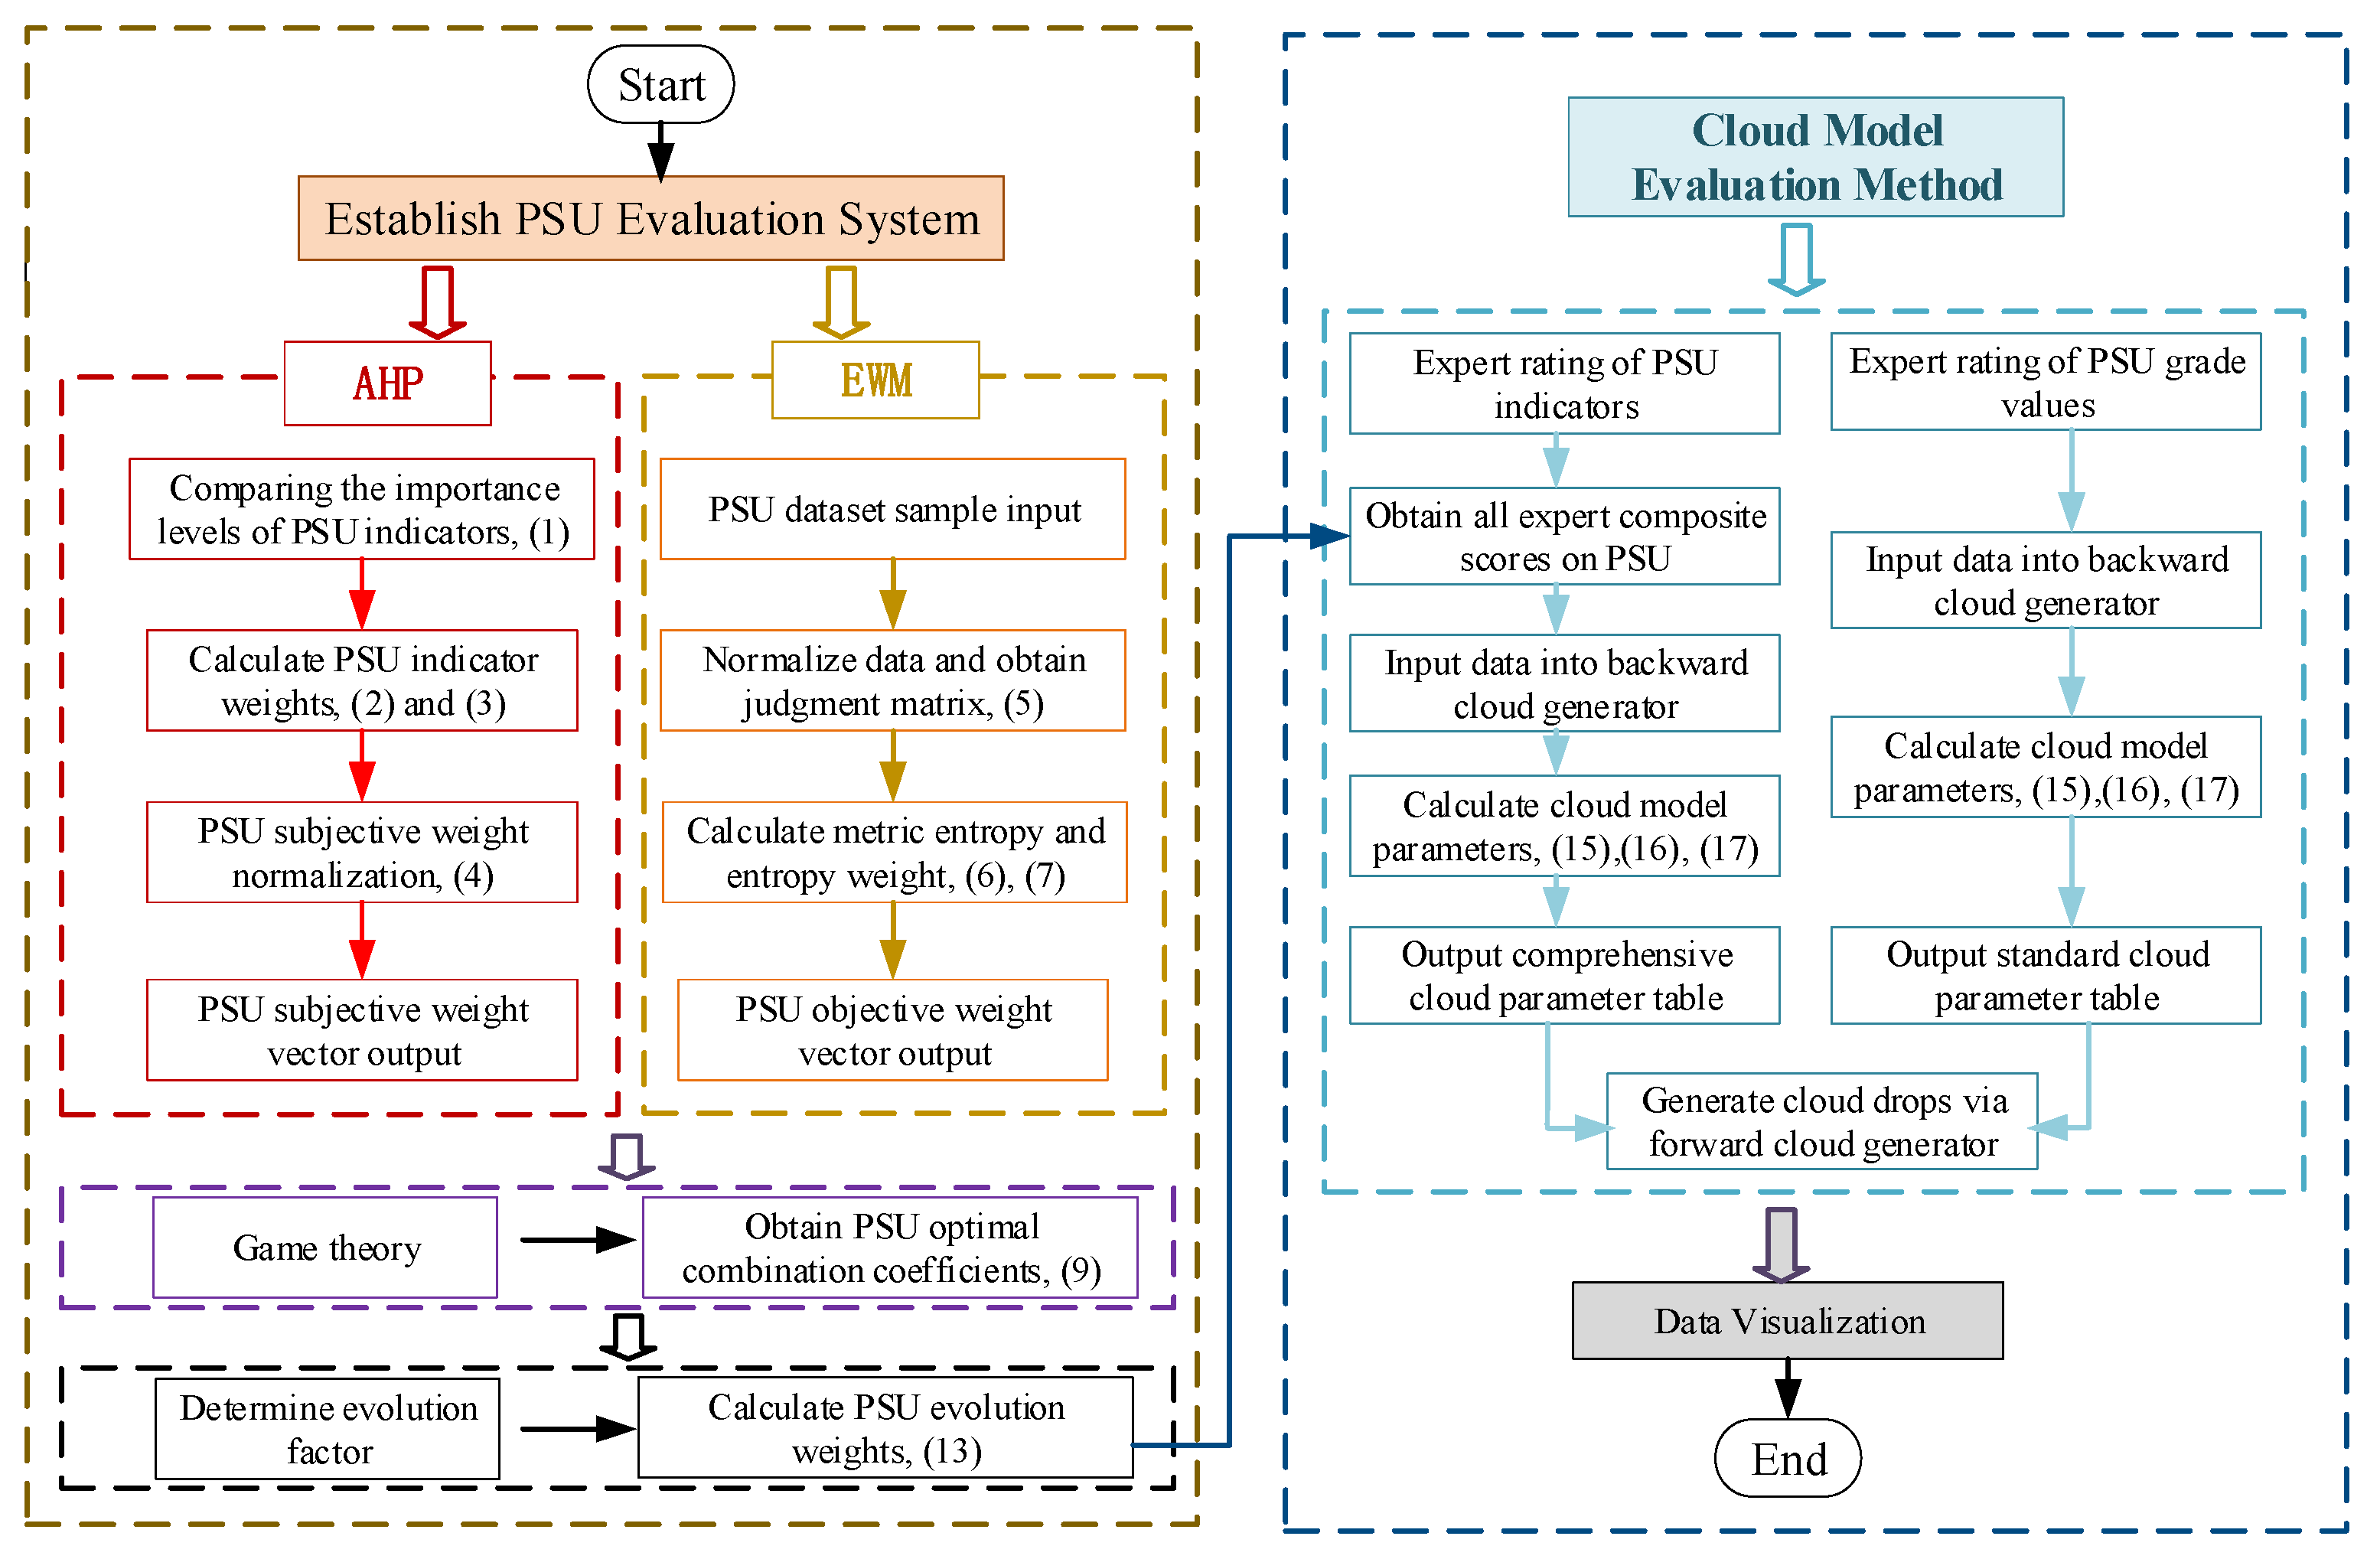
In summary, the flowchart of the proposed evaluation method for PSU is shown in Figure 3. The specific implementation process is as follows: First, an evaluation system for PSU comprising target, criterion, and indicator layers is established through expert interpretation of policy documents. The subjective weight vector is then derived using the AHP method through (1)–(4). Simultaneously, by analyzing PSU sample data and applying Equations (5)–(8), the information entropy and difference coefficients of each indicator are calculated to obtain the objective weight vector. The optimal combination coefficients for the weights are determined using Equation (9) and further refined through the evolutionary response represented by (11). Subsequently, standard cloud parameters are acquired via a backward cloud generator based on expert experience scores, while actual units are evaluated to obtain standard scores. These are combined with the evolved weights to derive comprehensive cloud parameters. Finally, visual comparison is performed through a forward cloud generator.

3. Construction of an Evaluation System for PSU

3.1. Construction of the PSU Evaluation System

The target layer of the evaluation system constructed using AHP is to assess the support capacity of PSU for NPS, thereby guiding optimal unit selection. This study selected secondary and tertiary indicators through expert panel discussions, following three fundamental principles during the selection process: (1) Systematicity Criterion: The indicator set must comprehensively and systematically reflect the core functions and value of pumped storage units in NPS; (2) Independence Criterion: Indicators at the same level should be relatively independent with low information overlap; (3) Quantifiability Criterion: All selected indicators must be quantifiable through field data or simulation results.
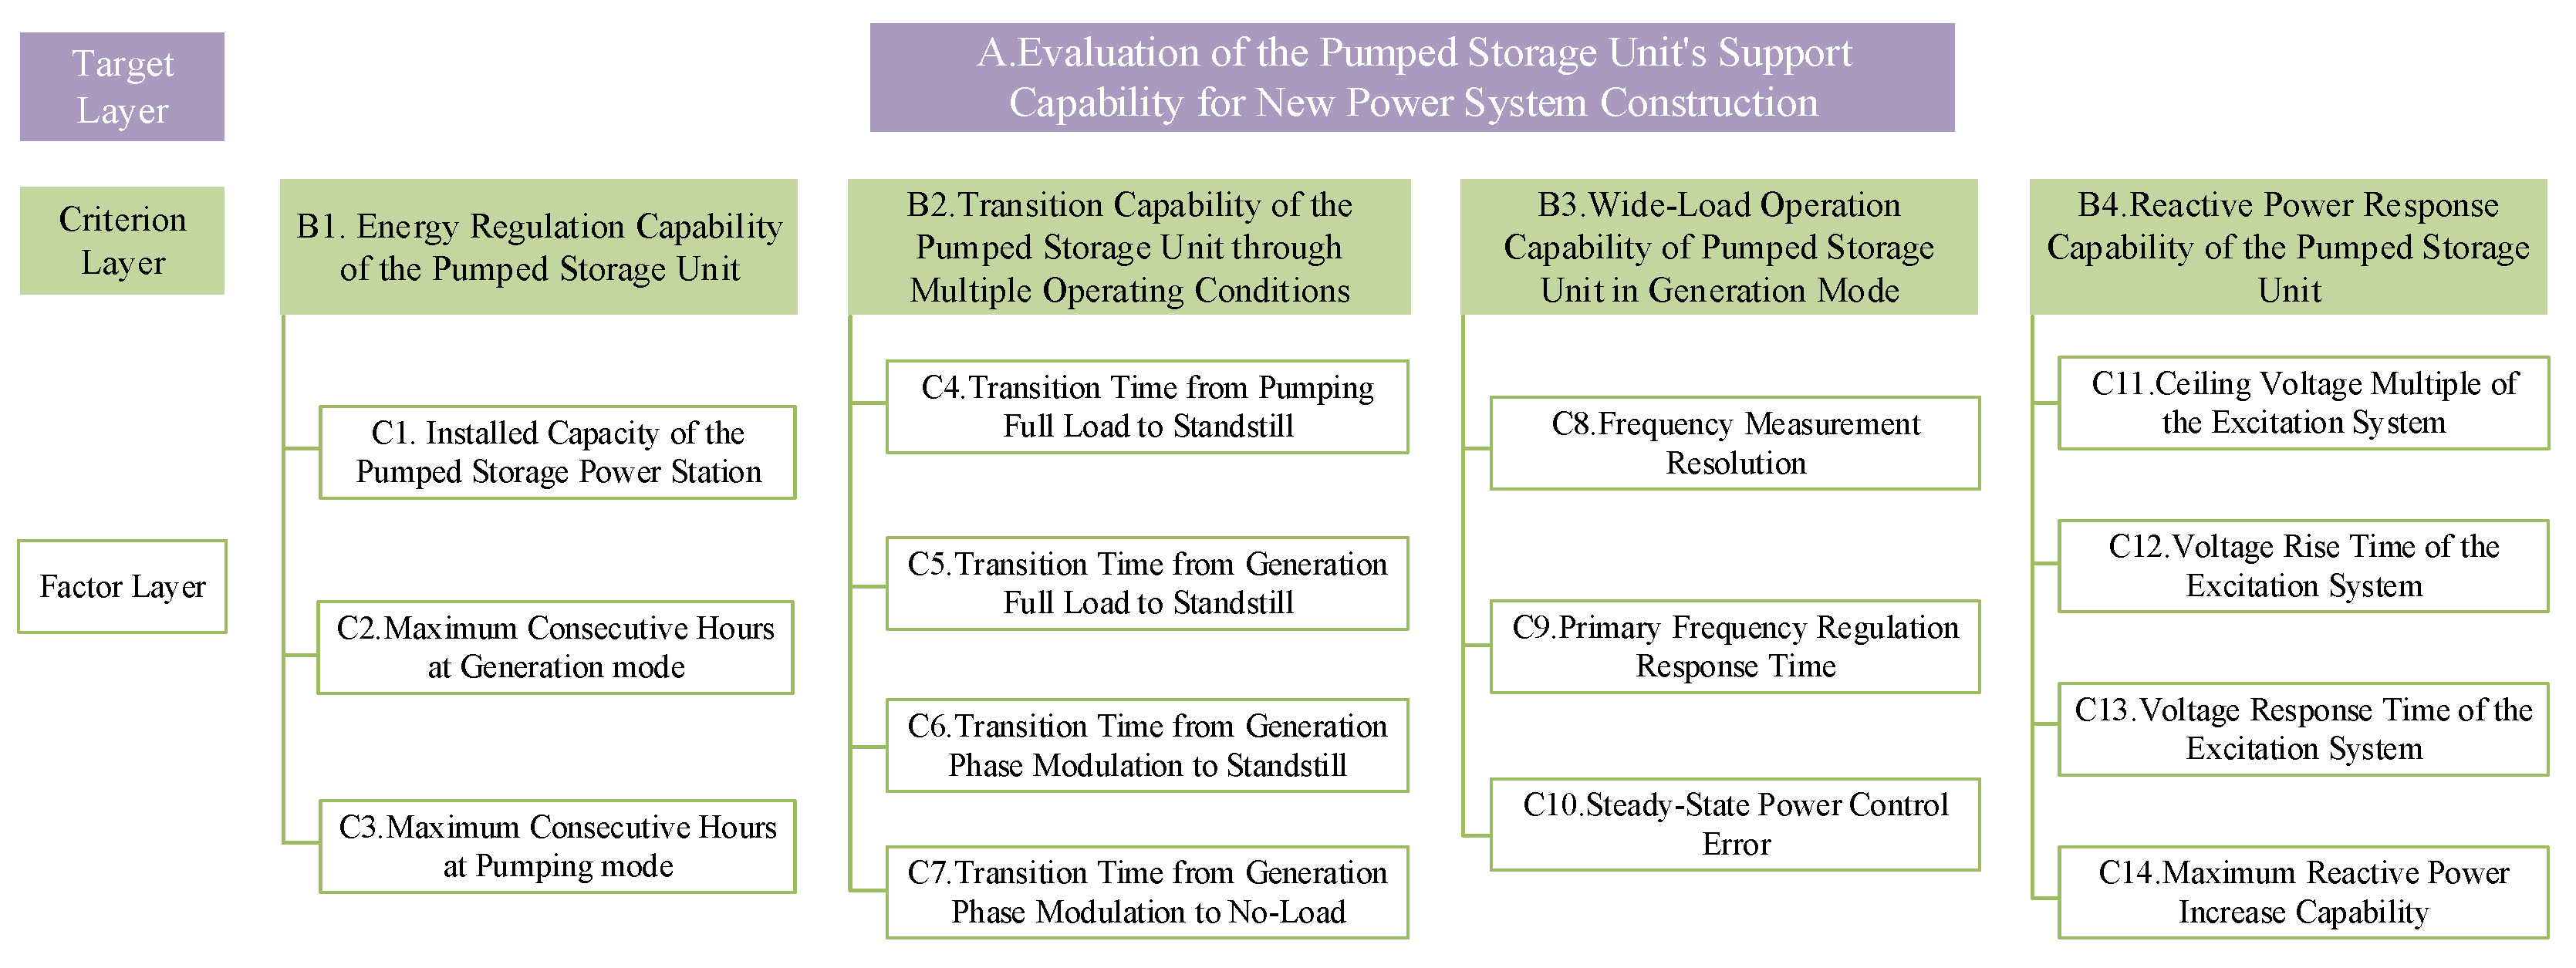
The selection process primarily referenced key policy documents including the “the Blue Book on the Development of the new type power system in China” [33], as well as critical energy industry policy documents such as the “Medium-and Long-Term Development Plan for Pumped Storage (2021–2035) of China” [34], the “14th Five-Year Plan for a Modern Energy System of China” [35], and the “Opinions on Improving Institutional Mechanisms and Policy Measures for Green and Low-Carbon Energy Transition of China” [36]. Ultimately, four second-level indicators were selected: energy regulation capability, multi-condition frequent switching capability, wide-load operation capability, and reactive power response capability. Further refinement of these four second-level indicators yielded 14 third-level indicators. The established evaluation index system is illustrated in Figure 4.
A more detailed explanation of the indicator system is as follows:
  • Energy Regulation Capability refers to the ability of PSU to regulate energy storage and release within the power system. This capability ensures that the units can effectively mitigate fluctuations from renewable energy sources, achieve peak-valley energy transfer, and provide system reserves. Its quantitative evaluation includes three key indicators: rated capacity (MW), full generation/pumping duration (h).
  • Transition capability of PSU through multiple operating conditions describes its dynamic performance in rapidly switching between various operational states. This represents the core advantage of pumped storage over other flexible resources, enabling it to meet rapid dispatch requirements in highly volatile power systems. Its performance is characterized by four indicators: transition time from pumping full load to standstill (s), transition time from generation full load to standstill (s), transition time from generation phase modulation to standstill (s), and transition time from generation phase modulation to no-load (s). The transition times between various operating conditions can be obtained using Equation (18).
    T t r a n s i t i o n m = t e n d m t s t a r t m
    where T t r a n s i t i o n m represents the transition time of the operating condition; m is the index of the corresponding transition condition; t e n d m and t s t a r t m are the start time and end time of the transition, respectively.
  • Wide-load operation capability of PSU in generation mode indicates the ability of a unit to operate safely and stably over a wide load range beyond its rated operating point during generation. Its main evaluation indicators include three third-level metrics: frequency measurement resolution (mHz), primary frequency regulation response time (s), and steady-state power control error (%). The frequency measurement resolution refers to the minimum variation in frequency that the measurement system can identify and respond to. The primary frequency response time and the steady-state power control error are defined by Equations (19) and (20), respectively.
    T p r = t p r 90 % t p r 0
    where T p r is the primary frequency response time; t p r 0 is the time when the system frequency exceeds the limit; t p r 90 % is the moment when the unit output reaches 90% of the target frequency regulation power.
    E p = P a c t u a l P s e t / P r a t e d 100 %
    where E p represents the power control error; P a c t u a l is the steady-state average of the actual output power; P s e t is the power setpoint; P r a t e d is the rated power of the unit.
  • Reactive power response capability of PSU refers to the unit’s service capacity in providing reactive power to regulate system voltage and improve power quality. It encompasses four third-level indicators: ceiling voltage multiple of the excitation system (p.u.), voltage rise time of the excitation system (s), voltage response time of the excitation system (s), and maximum reactive power increase capability (Mvar). The reactive power response capability of the PSU can be evaluated by the following four metrics, as defined in Equations (21)–(24):
    K c e i l i n g = V max / V r a t e d
    T r i s e = t r i s e 90 % t r i s e 10 %
    T r e s p o n s e = t r e s p o n s e 95 % t r e s p o n s e 0
    Q max = Q max Q i n i t i a l
    where K c e i l i n g , T r i s e , T r e s p o n s e and Q max represent the PSU’s excitation system ceiling voltage ratio, excitation system voltage rise time, excitation system voltage response time, and maximum reactive power increment capability, respectively. V max and V r a t e d are the maximum voltage provided by the excitation system and the rated voltage of the excitation system; t r i s e 10 % and t r i s e 90 % are the times when the step response curve reaches 10% and 90% of the target voltage value, respectively. t r e s p o n s e 0 and t r e s p o n s e 95 % are the initial moment when the step voltage command is applied and the moment when the output voltage reaches 95% of the target value, respectively. Q max and Q i n i t i a l are the maximum reactive power the unit can provide and the initial reactive power, respectively.
Through these four core second-level indicators and fourteen third-level indicators, this paper comprehensively characterizes the supporting role of PSU for building NPS. These indicators cover critical aspects such as power support, energy regulation, rapid response, and multi-condition operation, ensuring the comprehensiveness of the evaluation system.
For different types of indicators, this study references the range normalization method from [30] to classify indicators into benefit-type (where larger values are better) and cost-type (where smaller values are better). This process eliminates the influence of measurement units, thereby normalizing all indicators to the [0, 1] range and establishing a foundation for subsequent calculations.

3.2. Evaluation Grade Classification for PSU

This study derives the standard cloud model parameters using a backward cloud generator. First, expert ratings for each grade of the secondary indicators are collected, representing the most recognized scores assigned by experts to each grade. Subsequently, the collected dataset is input into the backward cloud generator, which then calculates the cloud parameters for each grade using Equations (15)–(17). Finally, the standard cloud model parameters are output. The parameters of the standard cloud model are presented in Table 2. The standard clouds for the target layer and criterion layer are then generated from these parameters. Finally, the comprehensive evaluation result is determined by comparing the comprehensive cloud of the object being evaluated against these standard clouds.

4. Case Study

China boasts abundant water resources, with its installed hydropower capacity exceeding 400 million kW and the operational and planned pumped storage capacity surpassing 80 million kW [33,34]. Among these, the East China region has a pumped storage installed capacity of over 20 million kW, playing a central role in peak load regulation and renewable energy integration in the Yangtze River Delta [36]. This study selected a PSU in the East China Power Grid as the evaluation case. Following the Delphi method’s recommendations for expert panel size [37], 15 experts were invited to conduct scoring and rating assessments. The expert panel comprised specialists from universities, equipment manufacturers, and grid dispatch centers, ensuring representativeness. All participating experts had been primarily involved in pumped storage projects as technical personnel, ensuring their professional expertise.
All computations and simulations in this study were performed in the MATLAB R2022b environment. Core algorithms, including cloud model generation and result visualization, were implemented using built-in MATLAB functions and custom-developed scripts. All computational tasks were executed on a personal computer equipped with an Intel Core i5-11400H processor and 16 GB of RAM.

4.1. Acquisition of Evolutionary Indicator Weights

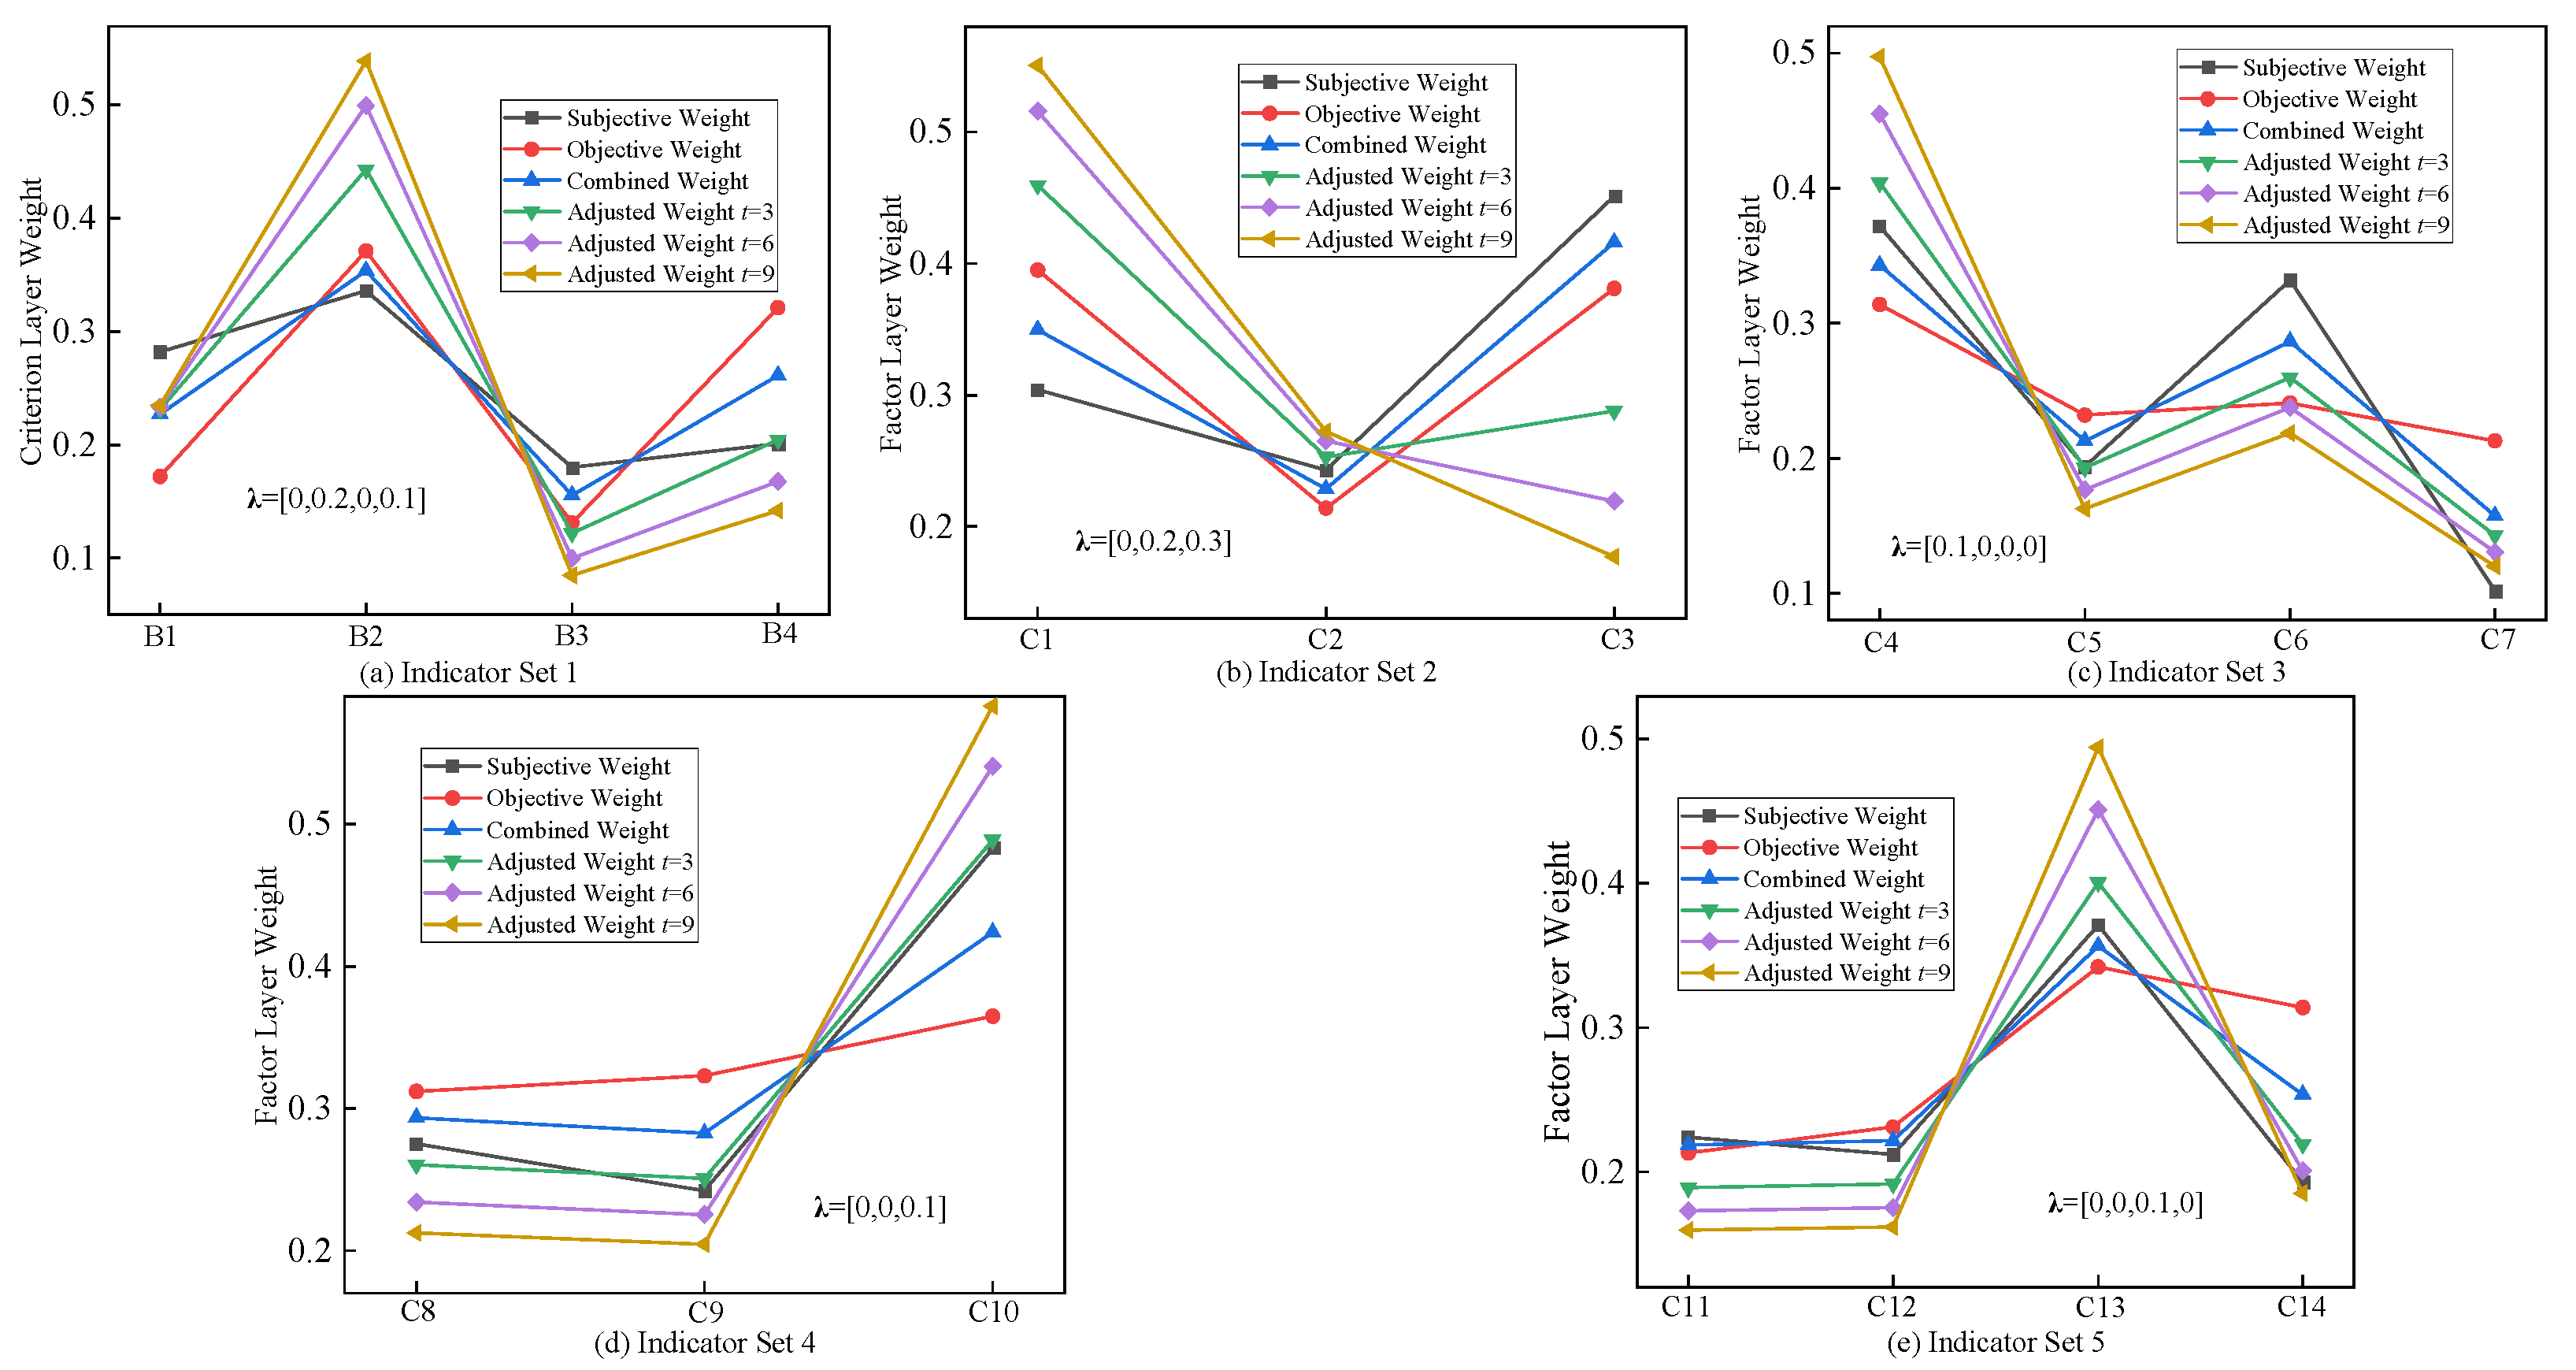
Based on the experts’ assessment of the importance of each indicator, the subjective weights are determined. These subjective weights are first integrated with the objective weights derived from the EWM using the optimal combination coefficient derived from game theory. Subsequently, this combined weight is dynamically adjusted across different time spans using the evolutionary factor. The value of the evolutionary factor is determined through expert panel discussions and the interpretation of relevant policy documents [33,34,35,36]. The final evolutionary weights are shown in Figure 5.

4.2. Evaluation Results Based on Cloud Model

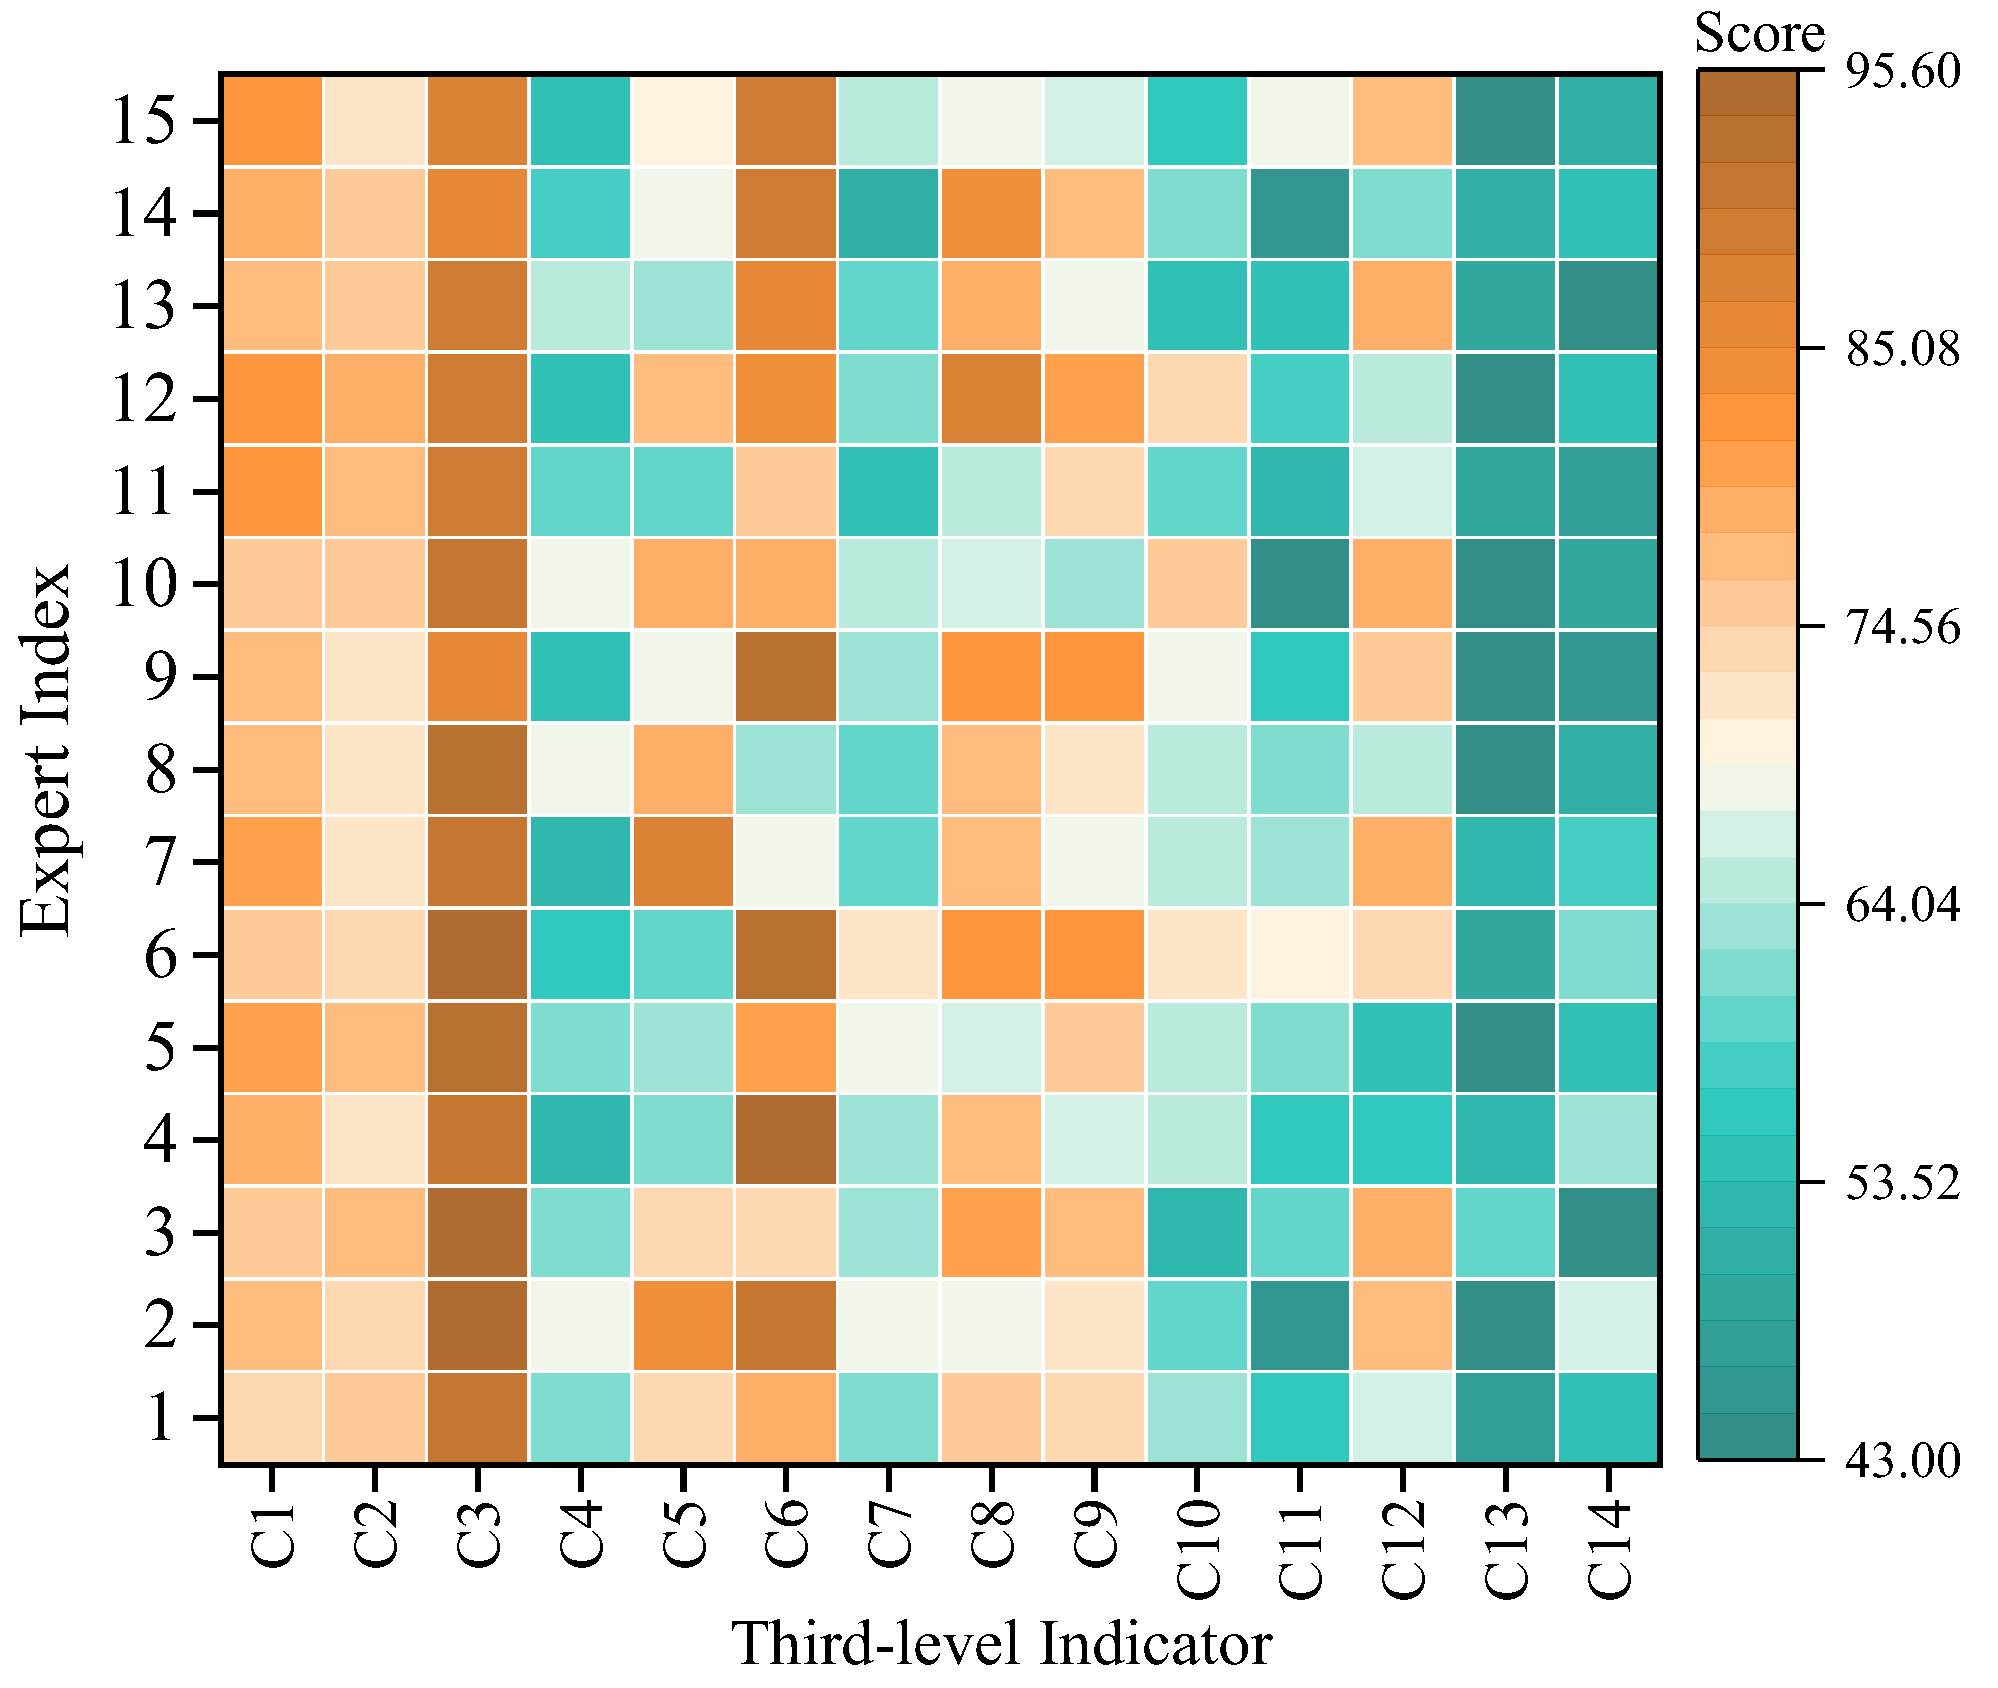
Figure 6 shows the evaluation results from 15 experts for the criterion-level indicators (C1–C14). By integrating the comprehensive weights obtained previously, the target-level cloud parameters were derived using the backward cloud generator. The specific values of these parameters are provided in Table 3. Meanwhile, the obtained cloud parameters were used to generate cloud charts, which were then compared with standard cloud charts for analysis. Due to space constraints, Figure 7 only shows the variations in the target-level cloud model across different evolutionary time spans.
In Figure 6, PSU demonstrates strong energy regulation capabilities, with scores consistently ranging between 75 and 95 points. Additionally, since these indicators are more easily quantifiable, the expert ratings show relatively low variability, which is further confirmed by the low entropy value of the cloud model parameters in Table 3. Figure 6 also reveals that the unit’s reactive power response capabilities are relatively weak, with scores generally below 60 points. Furthermore, the evaluation volatility for these capabilities is significantly higher than that for the power and energy indicators.
As observed in Figure 7, the overall rating of the unit has shifted from being close to the “satisfactory” grade to becoming more aligned with the “average” grade. The primary reason for this change is that when considering the long-term asymmetric development factors of the power system, the supporting capability of PSU for the construction of NPS will place greater emphasis on instantaneous power balance and flexibility. Consequently, the weight of this B2 indicator has become more significant after correction. However, the expected score for this indicator in the unit is only around 68 points, which is the main cause of the rating deviation. This also demonstrates the rationality of considering power system evolution in the proposed evaluation method for PSU.
Figure 8 further illustrates the comprehensive expected scores and scoring errors of the target layer and criterion layer under different evolutionary time spans. In this figure, as the time span increases, the expected scores of both the target layer and the criterion layer undergo varying degrees of change. Specifically, the expected scores of the target layer and criterion layers B1, B3, and B4 decrease to different extents, while the expected score of criterion layer B2 slightly increases. Among these, the most significant change occurs in criterion layer B4, with errors of 4.1%, 6.6%, and 7.7% at time spans of 3, 6, and 9, respectively. The smallest change is observed in criterion layer B2, with a maximum deviation of only 1.3%. The varying degrees of change in the expected scores are mainly attributed to the changes in the evolution factors and comprehensive scores. When an evolution factor has a relatively high value and the corresponding expert scores at the factor layer are also high, it is more likely to result in significant deviations. In contrast, factor layers with smaller evolution factors and lower expert scores exhibit smaller changes. These dynamically changing expected scores further demonstrate that the method can effectively capture the evolutionary trends at various levels over time, providing a reliable basis for comprehensive evaluation in dynamic environments.
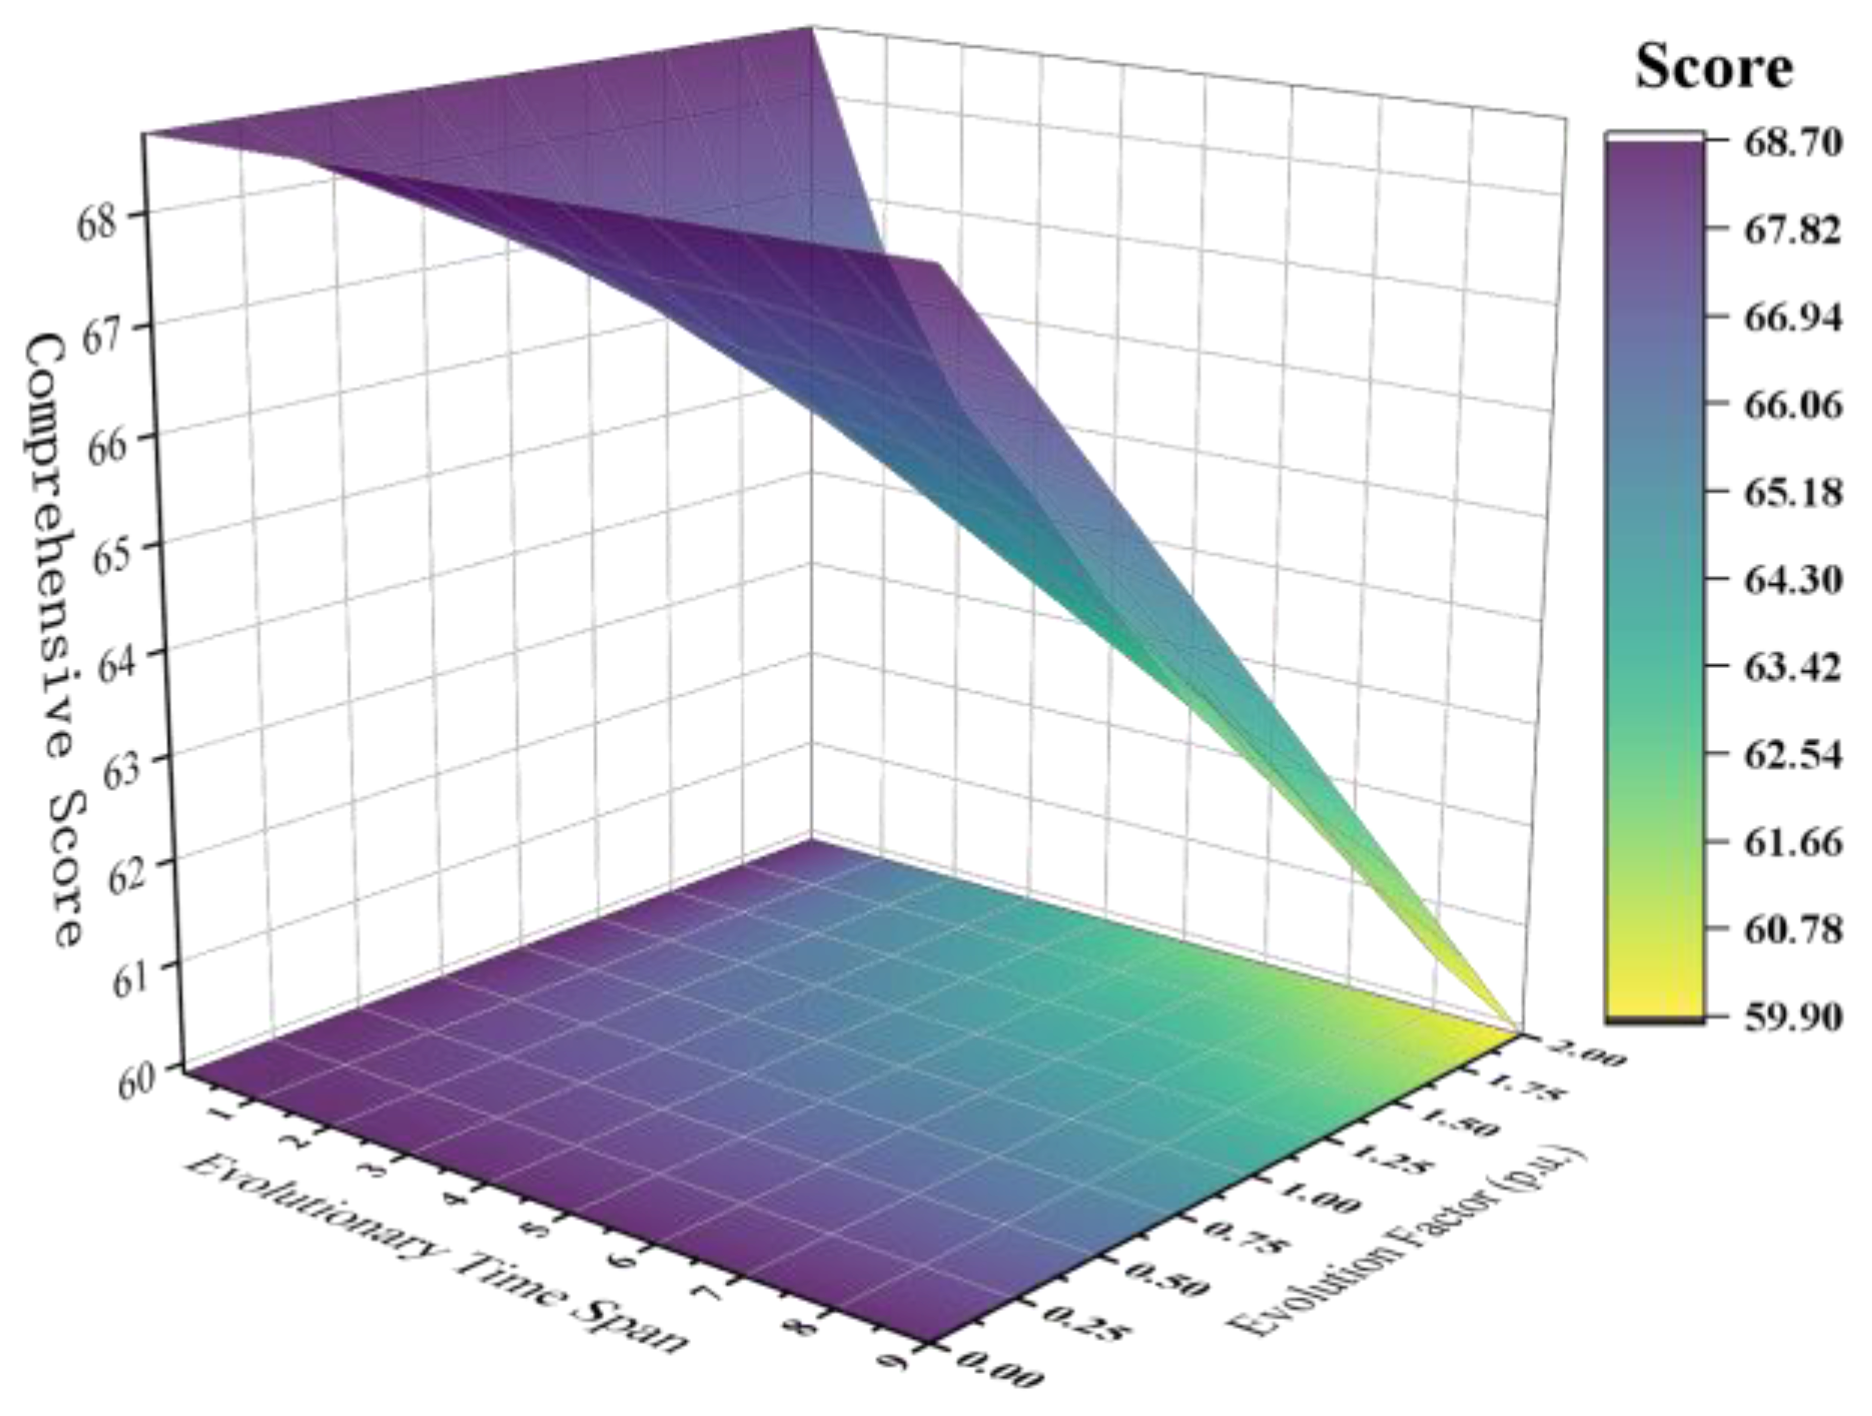
To derive more generalizable conclusions, Figure 9 further demonstrates the impact of different evolutionary timeframes and varying evolutionary factors on the final scores.
As can be observed from Figure 9, under the same evolutionary factor, the comprehensive score of the analyzed case gradually decreases with the extension of evolutionary time. Additionally, as the evolution speed of the power system accelerates, the rating of PSU declines more rapidly. In the most extreme scenario (evolutionary factor of 2 p.u., evolutionary time of 9), the score deviation reaches as high as 12.8%. This finding underscores the critical necessity of developing evaluation methods capable of dynamically responding to system changes, particularly amid the accelerated evolution of NPS. Simultaneously, it demonstrates that the proposed method exhibits certain adaptability to extreme conditions, showing robust universality across different evaluation parameters and time scales.
To validate the consistency of the comprehensive scores, this study conducted a second and third round of expert evaluations for the PSU one week later. The average evaluation scores are shown in Table 4.
As shown in the table, the scores from the first round (which represent the data presented in this study) maintained an absolute error of within 1% (with a maximum of 0.72%) compared to the subsequent two rounds of evaluations. Furthermore, the correlation coefficients between the scores were all close to 0.99, indicating a high level of consistency in the comprehensive scoring method. This suggests that the scores do not exhibit significant deviations across multiple rounds of evaluation. In addition, our study on the scoring errors and correlation coefficients of individual indicators revealed that all errors remained below 2%, with correlation coefficients consistently exceeding 0.97. This further confirms the robustness of the evaluation framework.

4.3. Improvement Suggestions

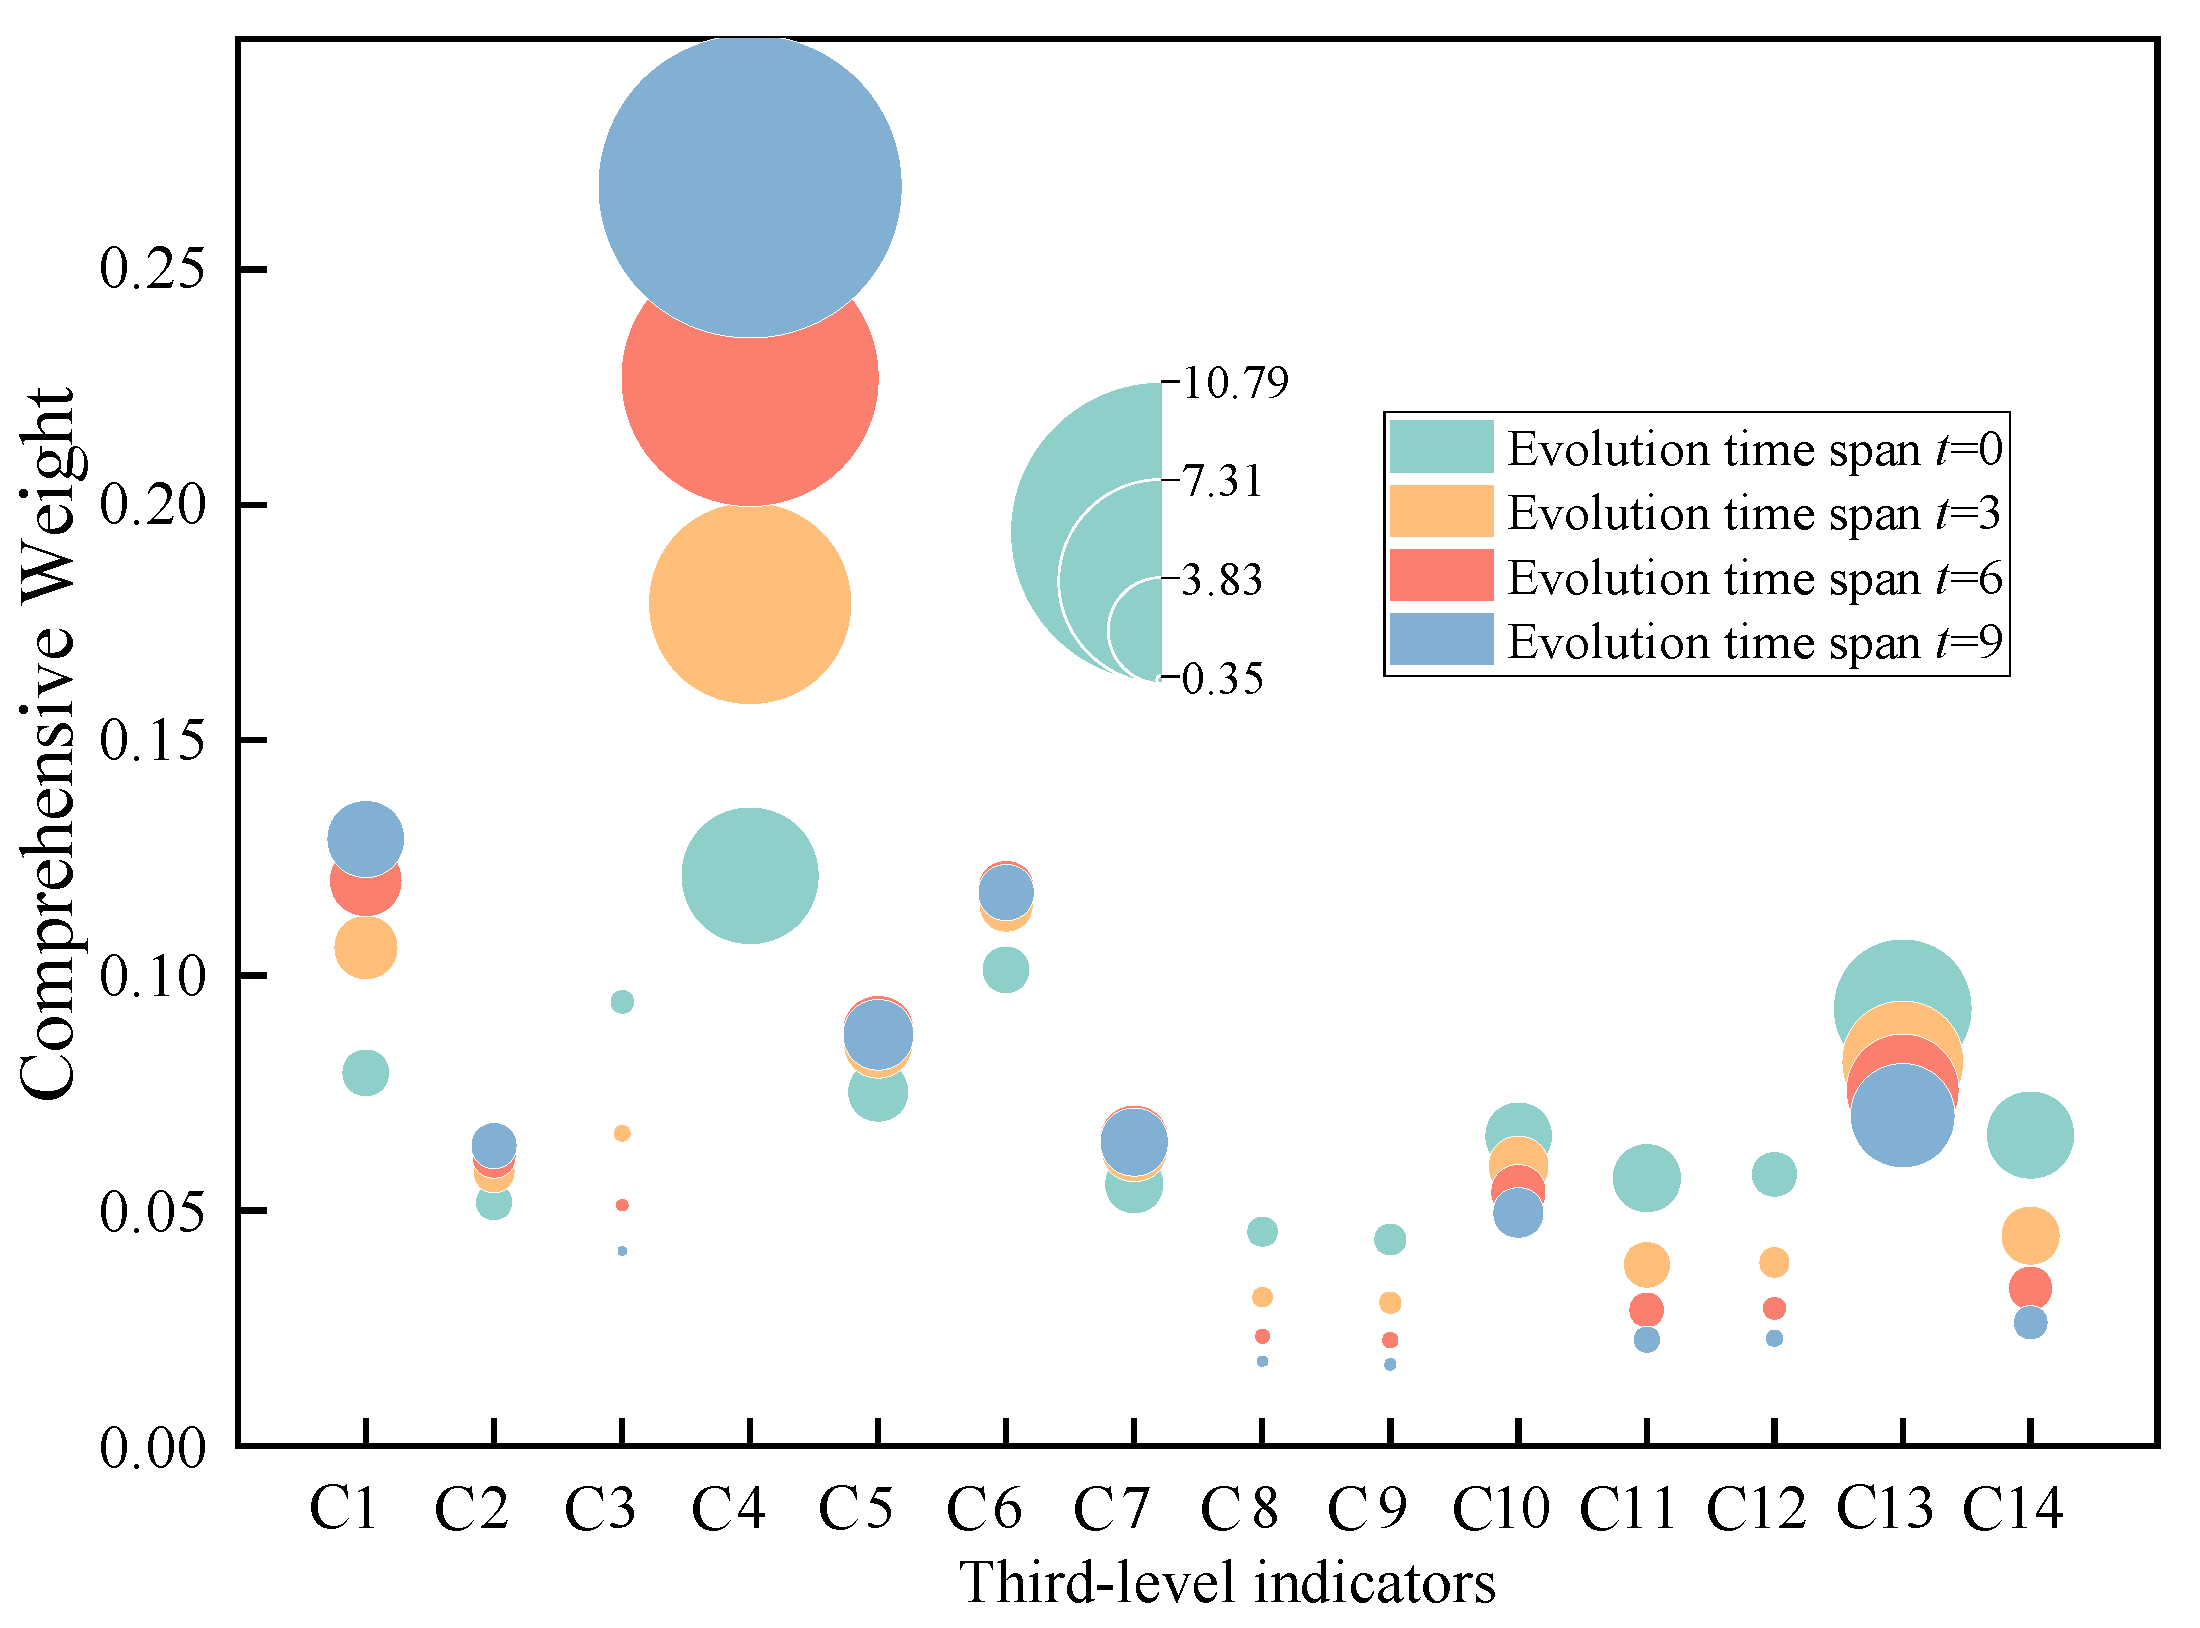
By integrating the weights of various indicators for PSU and expert assessment scores, and using bubble area to represent the improvement potential of each indicator for the comprehensive unit rating (specifically quantified as the incremental change in comprehensive expected score when the indicator’s score increases from its current value to the theoretical maximum), Figure 10 is obtained.
As can be seen from Figure 10, indicators C4 and C13 demonstrate significant potential for improving the comprehensive unit rating, with maximum improvements of 10.78 and 4.32 points, respectively. However, the underlying reasons for this potential differ substantially. Specifically, the C4 indicator possesses a high weight of 0.27, which means that improvement to its theoretical maximum would substantially enhance the comprehensive rating. This effect becomes more pronounced with the evolution of the power system. In contrast, the C13 indicator exhibits high potential mainly due to its low expert assessment scores, with an average score only about 75% of that of C4. Regarding indicators C1 to C3, although their comprehensive weights are relatively high, their improvement potential is limited because their current scores are already close to the upper limit. Their average scores are approximately 79.28, 74.64, and 89.45, respectively. Furthermore, the weight sensitivity analysis along the vertical axis reveals that all evaluation indicators exhibit low local sensitivity. When the weight of any single indicator is perturbed by one unit, the maximum observed variation in the composite score remains below 0.3 (with a peak value of 0.27). This demonstrates the strong robustness of the proposed evaluation model, as its output remains stable against minor fluctuations in individual indicator weights, thereby enhancing the reliability of evaluation results in practical applications.
Analysis of Figure 10 yields important recommendations for improving the PSU. First, when optimizing the performance of units in a pumped storage power station, priority should be given to indicators with both high weight and high optimization potential. For example, since indicator C4 exhibits both high weight and high potential, improving C4 should be prioritized, followed by C13. Second, among indicators with similar optimization potential, those with greater weight should be prioritized for improvement. In particular, indicators whose weights gradually increase with the evolution of the power system, such as C1, C5, and C6, should be assigned higher improvement priority. Conversely, indicators with declining weights, such as C8, C9, C11, C12, and C14, should be given lower priority. Finally, under resource constraints, a dynamic optimization pathway should be established. This involves periodically evaluating and adjusting improvement priorities based on the current development stage and future evolution trends of the power system, ensuring that the optimization strategy for PSU remains aligned with the construction requirements of NPS.

5. Conclusions and Future Work

Addressing the issue that existing evaluation methods struggle to adapt to the long-term asymmetric evolution of power systems, this paper proposes an evaluation method for PSU based on an evolutionary combination weighting-cloud model. The aim is to achieve a comprehensive and scientific assessment of PSU and guide their optimal selection. The main conclusions are as follows:
  • The proposed method takes into account the asymmetric evolution of the power system over extended time spans. By dynamically modifying indicator weights through an evolutionary response function, compared to existing evaluation methods, the proposed method reduces the expected scoring deviations of secondary indicators by approximately 4.7%, 1.3%, 3.5%, and 7.7%, respectively, with an overall scoring deviation reduction of about 6.4%. This enables a dynamic and accurate evaluation of the capability of PSU to support the construction of NPS.
  • The proposed method employs AHP and EWM to determine the subjective and objective weights of indicators of PSU. Using game theory, it obtains optimal combination coefficients for these subjective and objective weights, achieving the symmetry and balance between both factors. Furthermore, by integrating a cloud model to represent the randomness and fuzziness of evaluation boundaries, the method enhances the adaptability of the evaluation process and the interpretability of the results.
  • The improvement suggestions incorporating evolutionary weights enhance the applicability of unit optimization selection. They not only enable a dynamic response to structural and systemic changes in NPS at different asymmetric development stages but also provide an effective decision-making basis for the long-term planning and flexible retrofitting of PSU.
The evaluation framework proposed in this study demonstrates promising effectiveness in enhancing adaptability to the asymmetric evolution of power systems. However, the evolutionary response function used for dynamic weight correction is primarily constructed based on typical system evolution patterns, and its adaptability under extreme operating conditions requires further validation. Therefore, future work will focus on developing a weight adaptation mechanism that accounts for multi-timescale influences to improve the evaluation system’s responsiveness to extreme operating scenarios.

Author Contributions

Conceptualization, L.C. and Y.W.; methodology, L.C. and Y.W.; writing—original draft preparation, L.C., Y.W. and H.X.; project administration, L.D., Z.Z. and X.J.; data curation, H.X., L.D. and Z.Z.; writing—review and editing, X.J., S.F. and J.X. All authors have read and agreed to the published version of the manuscript.

Funding

This work is supported by the Science and Technology Project of State Grid Corporation of China “Technologies Research for Enhancing the Regulation and Stability Support Capabilities and Coordinated Operation of Pumped Storage Units” (No. 4000-202499363A-3-1-DG).

Data Availability Statement

The data supporting the findings of this study are included within the article. For additional information, please contact the corresponding author.

Conflicts of Interest

Longxiang Chen, Yuan Wang, Hengyu Xue, Lei Deng, Ziwei Zhong and Xuan Jia were employed by State Grid Corporation of China. The authors declare that this study received funding from State Grid Corporation of China. The funder was not involved in the study design; collection, analysis, interpretation of data; the writing of this article; or in the decision to submit it for publication.

Abbreviations

The following abbreviations are used in this manuscript:
PSSPumped storage station
PSUPumped storage unit
NPSNew-type power system
AHPAnalytic hierarchy process
EWMEntropy weight method
QRNNQuantile regression neural networks
MSMMulti-head self-attention mechanism
ExExpectation (Cloud Model parameter)
EnEntropy (Cloud Model parameter)
HeHyper-entropy (Cloud Model parameter)

References

  1. Mallapaty, S. How China could be carbon neutral by mid-century. Nature 2020, 586, 482–483. [Google Scholar] [CrossRef]
  2. Li, C.; Wen, X.; Zhang, Y.; Guo, R.; Peng, S. Research on environmental evaluation index of carbon-based power generation formats under the “dual carbon goals”. Energies 2025, 18, 4337. [Google Scholar] [CrossRef]
  3. Liu, Y.; Luo, L.; Li, X.; Liu, H.; Yu, Z.; Wang, Y. A Wasserstein distance-based distributionally robust optimization strategy for a renewable energy power grid considering meteorological uncertainty. Symmetry 2025, 17, 1602. [Google Scholar] [CrossRef]
  4. Ge, Y.; Xie, J.; Chang, J.; Feng, S. A multi-objective deep reinforcement learning method for intelligent scheduling of wind-solar-hydro-battery complementary generation systems. Int. J. Electr. Power Energy Syst. 2025, 167, 110635. [Google Scholar] [CrossRef]
  5. Qu, Y.; Liu, C.; Tong, X.; Xie, Y. Stochastic programming-based annual peak-regulation potential assessing method for virtual power plants. Symmetry 2025, 17, 683. [Google Scholar] [CrossRef]
  6. Papakonstantinou, A.G.; Konstanteas, A.I.; Papathanassiou, S.A. Solutions to enhance frequency regulation in an island system with pumped-hydro storage under 100% renewable energy penetration. IEEE Access 2023, 11, 76675–76690. [Google Scholar] [CrossRef]
  7. Chen, X.; Wu, P.; He, H.; Song, B.; Qin, K.; Teng, X.; Yang, F.; Li, D. Optimal flexibility dispatching of multi-pumped hydro storage stations considering the uncertainty of renewable energy. Symmetry 2024, 16, 1404. [Google Scholar] [CrossRef]
  8. Mahfoud, R.J.; Alkayem, N.F.; Zhang, Y.; Zheng, Y.; Sun, Y.; Alhelou, H.H. Optimal operation of pumped hydro storage-based energy systems: A compendium of current challenges and future perspectives. Renew. Sustain. Energy Rev. 2023, 178, 113267. [Google Scholar] [CrossRef]
  9. O’Dwyer, C.; Ryan, L.; Flynn, D. Efficient Large-Scale Energy Storage Dispatch: Challenges in Future High Renewable Systems. IEEE Trans. Power Syst. 2017, 32, 3439–3450. [Google Scholar] [CrossRef]
  10. Han, S.; He, M.; Yuan, Y.; Hunt, J.D.; Zhao, Z.; Li, G.; Chen, D. Evaluating the performance of seasonal pumped hydro storage coordinated operation with cascade hydropower station integrating variable renewable energy. Renew. Energy 2025, 256, 124023. [Google Scholar] [CrossRef]
  11. Zhang, J.; Cheng, C.; Yu, S.; Shen, J.; Wu, X.; Su, H. Preliminary feasibility analysis for remaking the function of cascade hydropower stations to enhance hydropower flexibility: A case study in China. Energy 2022, 260, 125163. [Google Scholar] [CrossRef]
  12. Li, P.; Zhao, Z.; Li, J.; Liu, Z.; Liu, Y.; Mahmud, M.A.; Sun, Y.; Chen, D. Unlocking potential contribution of seasonal pumped storage to ensure the flexibility of power systems with high proportion of renewable energy sources. Renew. Energy 2023, 218, 119280. [Google Scholar] [CrossRef]
  13. Wang, Z.; Tan, Q.; Wen, X.; Su, H.; Fang, G.; Wang, H. Capacity optimization of retrofitting cascade hydropower plants with pumping stations for renewable energy integration: A case study. Appl. Energy 2025, 377, 124429. [Google Scholar] [CrossRef]
  14. Jin, X.; Liu, B.; Liao, S.; Cheng, C.; Zhang, Y.; Zhao, Z.; Lu, J. Wasserstein metric-based two-stage distributionally robust optimization model for optimal daily peak shaving dispatch of cascade hydroplants under renewable energy uncertainties. Energy 2022, 260, 125107. [Google Scholar] [CrossRef]
  15. Lei, L.; Xiao, Y.; Gao, Y.; Chen, D.; Zhao, Z.; Zhou, Y.; Chen, H.; Mahmud, M.A. Breaking time-scale boundary: An optimization framework for improving multi-timescale operation characteristics of pumped storage power plant. Appl. Energy 2025, 398, 126387. [Google Scholar] [CrossRef]
  16. Zhang, Z.; Dai, H.; Wang, Y. Long-medium-short term nested operation model of hydro-wind-solar hybrid power system considering flood control, power generation, ecology and navigation. Energy 2025, 334, 137705. [Google Scholar] [CrossRef]
  17. Sun, X.; He, Y.; Yang, J.; Zhao, Z.; Yang, Y.; Li, M.; Zhang, M.; Chen, D.; Bai, Z. Optimization and comparative analysis of hydrogen energy storage and pumped hydro storage capacity configuration for enhancing power system flexibility in clean energy bases. Energy Convers. Manag. 2025, 342, 120144. [Google Scholar] [CrossRef]
  18. Zhu, Z.; Wang, L.; Wang, X.; Jiang, C.; Zhou, S.; Gong, K. Complementary operations of multi-renewable energy systems with pumped storage. CSEE J. Power Energy Syst. 2023, 9, 1866–1880. [Google Scholar]
  19. Wang, R.; Yang, W.; Huang, Y.; Li, X.; Liu, Y.; Chen, J.; Cheng, Q.; Mei, Y.; Cheng, Y.; Liu, P. Coordinating regulation reliability and quality of pumped storage units for renewables by a novel scheduling-control synergic model. Appl. Energy 2024, 376, 124162. [Google Scholar] [CrossRef]
  20. Wang, Z.; Yang, W.; Wu, P.; Song, K.; Li, G. Power regulation stability of variable-speed pumped-storage units: Influence law, deviation recognition, and performance quantification. J. Energy Storage 2025, 132, 117972. [Google Scholar] [CrossRef]
  21. Lei, Z.; Zhong-Hua, G.; Shan-Ying, L.; Yi-An, Y.; Lian-Tao, J.; Rong-Rong, J.; Zhi-Feng, T.; Ze, L. Dynamic performance evaluation of variable speed pumped storage units based on multiple physical fields of hydraulic, machinery, and electricity. In Proceedings of the 2024 6th Asia Energy and Electrical Engineering Symposium (AEEES), Chengdu, China, 28–31 March 2024; pp. 28–31. [Google Scholar]
  22. Ling, X.; Wang, Y.; Zhang, M.; Cui, S. Optimization and evaluation of coordinated operation strategy for hybrid pumped storage power plant. In Proceedings of the 2025 7th International Conference on Energy Systems and Electrical Power (ICESEP), Wuhan, China, 20–22 June 2025; pp. 25–27. [Google Scholar]
  23. Peng, Y.; Yang, Y.; Chen, M.; Wang, X.; Xiong, Y.; Wang, M.; Li, Y.; Zhao, B. Value evaluation method for pumped storage in the new power system. Chin. J. Electr. Eng. 2023, 9, 26–38. [Google Scholar] [CrossRef]
  24. Yang, Y.; Yang, Y.; Lu, Q.; Liu, D.; Xie, P.; Wang, M.; Yu, Z.; Liu, Y. Comprehensive evaluation of a pumped storage operation effect considering multidimensional benefits of a new power system. Energies 2024, 17, 4449. [Google Scholar] [CrossRef]
  25. Zhang, X.; Jiang, Y.; Wang, X.-B.; Li, C.; Zhang, J. Health condition assessment for pumped storage units using multihead self-attentive mechanism and improved radar chart. IEEE Trans. Ind. Inform. 2022, 18, 8087–8097. [Google Scholar] [CrossRef]
  26. Tan, Y.; Xie, G.; Xiao, Y.; Luo, Y.; Xie, X.; Wen, M. Comprehensive benefit evaluation of hybrid pumped-storage power stations based on improved rank correlation-entropy weight method. Energies 2022, 15, 8414. [Google Scholar] [CrossRef]
  27. Saaty, T.L. Relative measurement and its generalization in decision making—Why pairwise comparisons are central in mathematics for the measurement of intangible factor, the analytic hierarchy/network process. Rev. R. Acad. Cienc. Exactas Fis. Nat. Ser. A Mat. 2008, 102, 251–318. [Google Scholar] [CrossRef]
  28. Zhao, K.; Dai, Y.; Ji, Y.; Jia, Z. Decision-making model to portfolio selection using analytic hierarchy process (AHP) with expert knowledge. IEEE Access 2021, 9, 76875–76893. [Google Scholar] [CrossRef]
  29. Xu, C.; Xu, C.; Li, G. Establishment and validation of a novel composite index for energy efficiency evaluation of data center chilled water systems based on AHP and Entropy Weight Method. Energy Build. 2025, 337, 115677. [Google Scholar] [CrossRef]
  30. Du, L.; Niu, Z.; Zhang, R.; Zhang, J.; Jia, L.; Wang, L. Evaluation of water resource carrying potential and barrier factors in Gansu Province based on game theory combined weighting and improved TOPSIS model. Ecol. Indic. 2024, 166, 112438. [Google Scholar] [CrossRef]
  31. Li, D.; Cheung, D.; Shi, X.; Ng, V. Uncertainty reasoning based on cloud models in controllers. Comput. Math. Appl. 1998, 35, 99–123. [Google Scholar] [CrossRef]
  32. Jiang, T.; Xu, Z.; He, X.; Xia, B.; Ke, Y.; Skitmore, M.; Liu, Y. Evaluating the resilience of social license to operate towards NIMBY facilities: A cloud model-based approach. Environ. Impact Assess. Rev. 2025, 112, 107808. [Google Scholar] [CrossRef]
  33. The Blue Book of New Type Power System Developing in China. Available online: http://www.nea.gov.cn/download/xxdlxtfzlpsgk.pdf (accessed on 15 April 2025).
  34. Medium-and Long-Term Development Plan for Pumped Storage (2021–2035) of China. Available online: https://zfxxgk.nea.gov.cn/1310193456_16318589869941n.pdf (accessed on 22 April 2025).
  35. 14th Five-Year Plan for a Modern Energy System of China. Available online: https://zfxxgk.nea.gov.cn/1310524241_16479412513081n.pdf (accessed on 8 May 2025).
  36. Opinions on Improving Institutional Mechanisms and Policy Measures for Green and Low-Carbon Energy Transition of China. Available online: https://www.gov.cn/zhengce/zhengceku/2022-02/11/content_5673015.htm (accessed on 19 May 2025).
  37. Okoli, C.; Pawlowski, S.D. The Delphi method as a research tool: An example, design considerations and applications. Inf. Manag. 2004, 42, 15–29. [Google Scholar] [CrossRef]
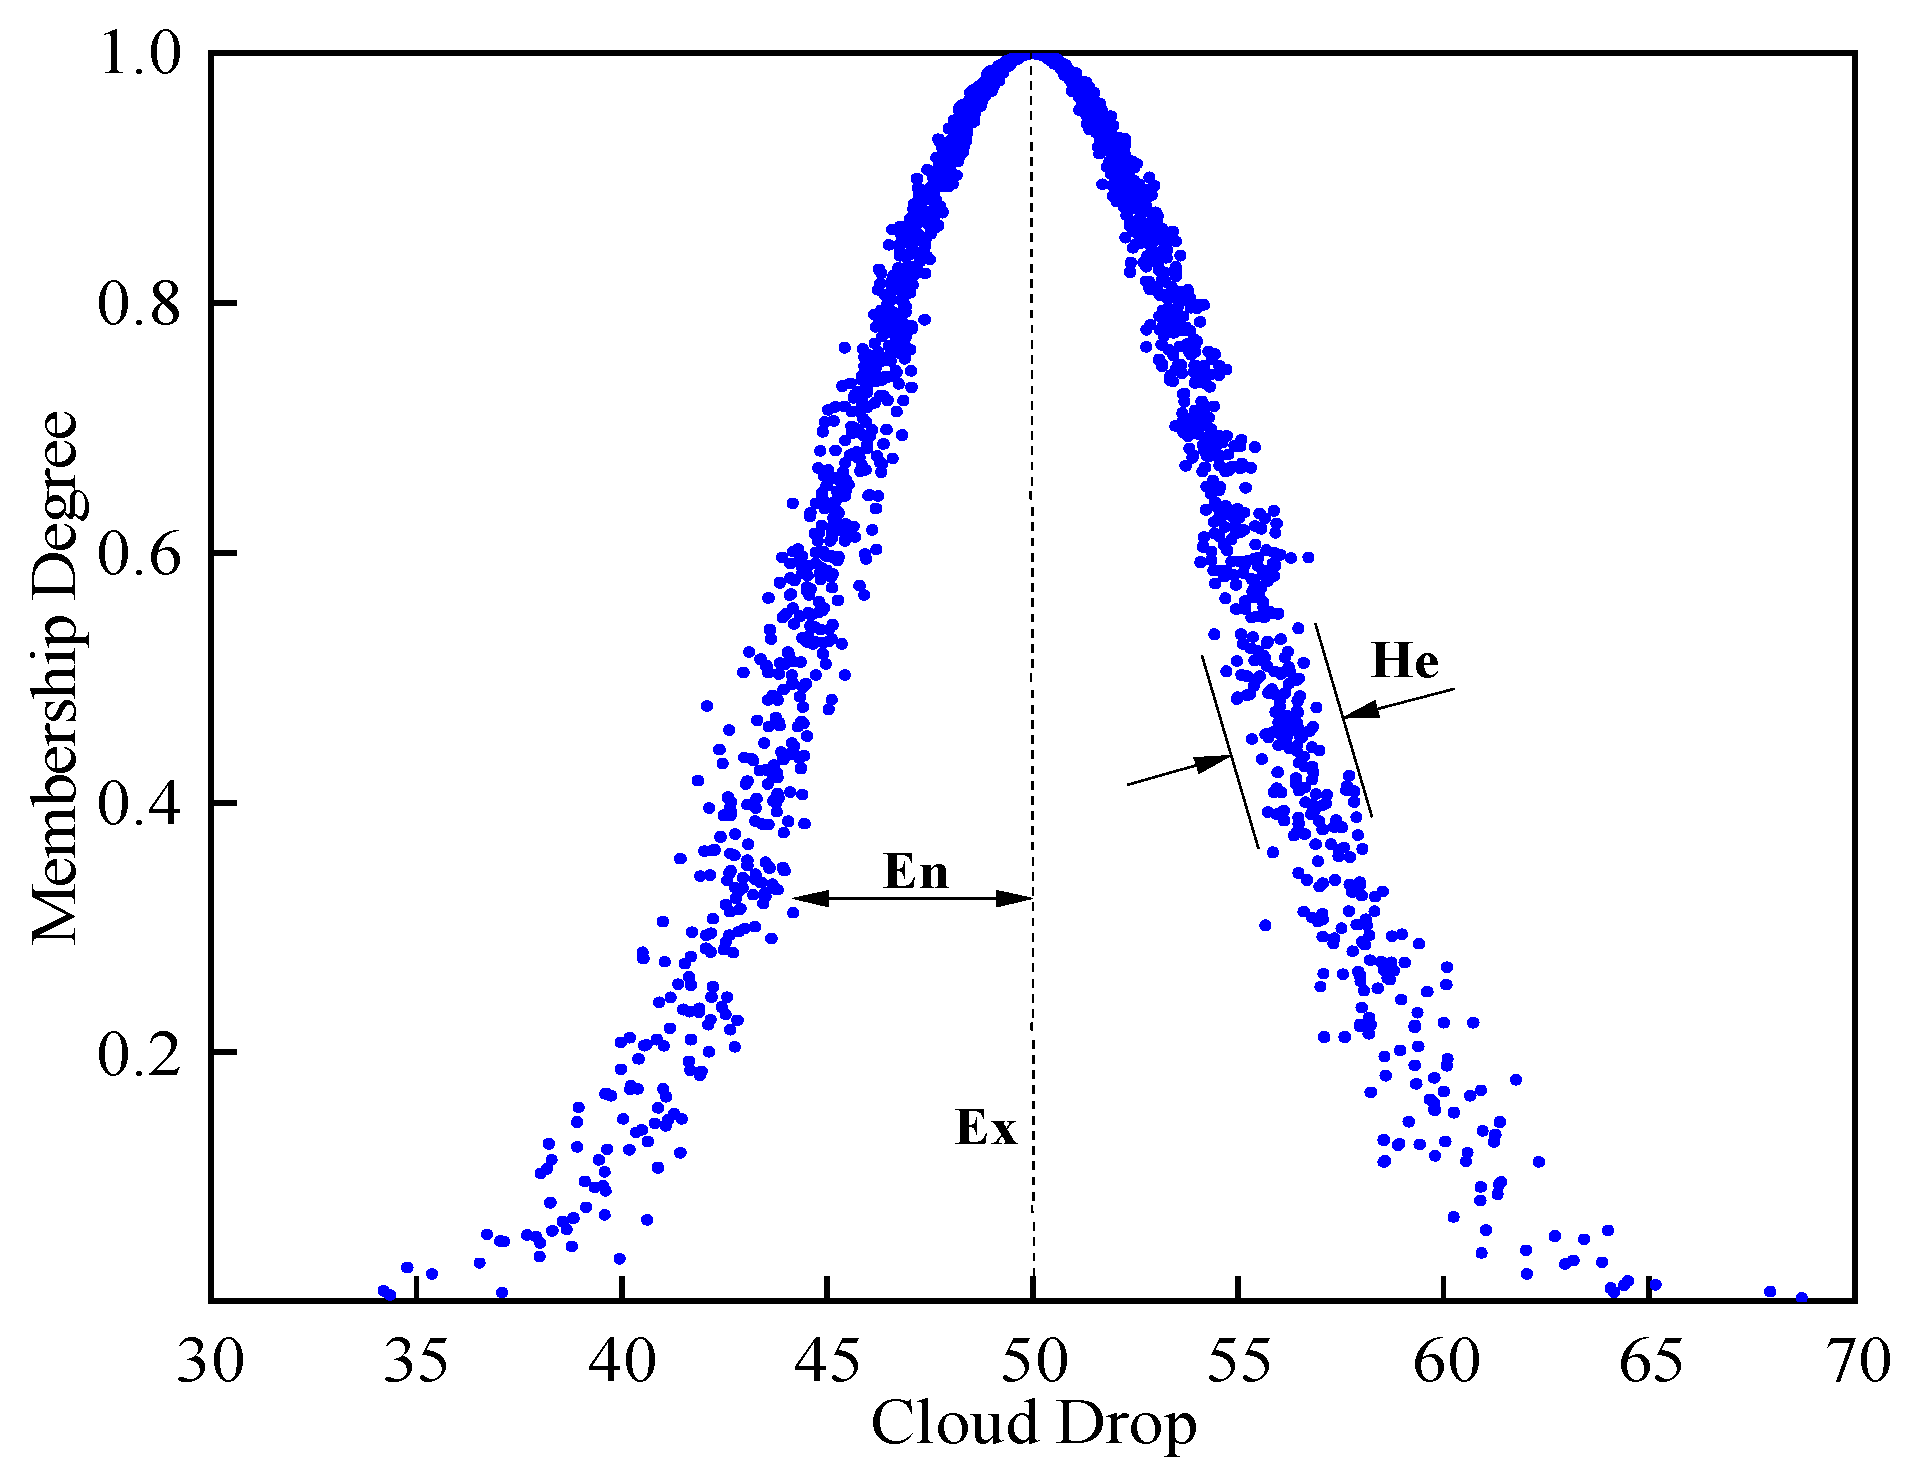
Figure 1. Cloud distribution diagram.
Symmetry 17 01900 g001
Figure 2. Flow chart of backward and forward cloud generator.
Symmetry 17 01900 g002
Figure 3. Evolutionary combination weighting-cloud evaluation method flowchart.
Symmetry 17 01900 g003
Figure 4. Evaluation indicator system diagram.
Symmetry 17 01900 g004
Figure 5. Indicator weight comparison chart.
Symmetry 17 01900 g005
Figure 6. Scoring of Each Indicator by Experts.
Symmetry 17 01900 g006
Figure 7. Comparison between comprehensive cloud model and standard cloud model.
Symmetry 17 01900 g007
Figure 8. Comparison of target and criterion layers at different evolutionary spans.
Symmetry 17 01900 g008
Figure 9. Variation graph of comprehensive score with evolution time and evolution factor.
Symmetry 17 01900 g009
Figure 10. Bubble chart for optimization potential analysis of PSU.
Symmetry 17 01900 g010
Table 1. Literature Review on PSU/PSS Evaluation Methods.
YearReferenceCore Method/ModelConsidered FactorsMain Contribution
2022Ref. [25]QRNN-MSMHealth DegreeInteractions among multiple factors
2022Ref. [26]Improved rank
correlation-entropy weight method
Function, Economy, EnvironmentMulti-weight fusion
2023Ref. [23]Operation
simulation-based method
Economy, Safety,
Environment
Multi-dimensional value
2023Ref. [11]Analytic hierarchy
process-cloud model
EconomyRefined evaluation model
2024Ref. [24]Operation simulation-based methodEconomy, EnvironmentDemonstrates actual
operation effects
2025Ref. [22]Analytic hierarchy processPerformance, EconomyQuantifies
synergistic benefits
--This paperDynamic combination weightingTechnology, OperationDynamic evolution process
Table 2. Standard cloud model parameters.
GradeParameters
of Layer A
Parameters of Layer B1Parameters
of Layer B2
Parameters of Layer B3Parameters
of Layer B4
Excellent(90.3, 2.1, 0.3)(95.3, 1.2, 0.2)(90.2, 2.2, 0.2)(93.1, 1.4, 0.2)(88.1, 1.8, 0.3)
Good(79.6, 3.6, 0.5)(82.0, 1.4, 0.4)(77.8, 2.4, 0.4)(81.3, 1.9, 0.1)(75.3, 1.9, 0.1)
Satisfactory(70.2, 2.3, 0.4)(69.5, 1.7, 0.3)(65.4, 2.6, 0.3)(69.0, 2.1, 0.3)(62.4, 2.1, 0.2)
Average(59.7, 3.7, 0.1)(60.3, 2.9, 0.4)(52.9, 2.3, 0.1)(56.0, 1.7, 0.4)(49.0, 2.6, 0.3)
Poor(40.5, 5.3, 0.6)(45.0, 3.2, 0.6)(40.1, 3.1, 0.4)(42.7, 3.3, 0.3)(38.2, 3.1, 0.7)
Table 3. Comprehensive cloud model parameters.
Period of EvolutionParameters
of Layer A
Parameters of Layer B1Parameters
of Layer B2
Parameters of Layer B3Parameters
of Layer B4
t = 0(68.7, 3.2, 0.5)(80.7, 1.3, 0.1)(68.3, 3.6, 0.7)(72.1, 3.1, 0.5)(58.3, 3.5, 0.7)
t = 3(66.6, 3.1, 0.5)(78.9, 1.4, 0.1)(68.7, 3.5, 0.8)(71.2, 3.2, 0.5)(55.9, 3.6, 0.6)
t = 6(65.3, 3.1, 0.4)(77.6, 1.4, 0.1)(68.9, 3.4, 0.8)(70.3, 3.3, 0.5)(54.4, 3.6, 0.6)
t = 9(64.3, 3.1, 0.4)(76.9, 1.5, 0.2)(69.2, 3.4, 0.9)(69.6, 3.3, 0.6)(53.8, 3.6, 0.5)
Table 4. Multi-round evaluation comprehensive scores.
Time SpanFirst-Round
Mean Score
Second-Round
Mean Score
Third-Round
Mean Score
Mean Absolute
Error
t = 068.768.268.50.51%
t = 366.666.967.10.60%
t = 665.365.765.50.46%
t = 964.364.664.40.31%
Disclaimer/Publisher’s Note: The statements, opinions and data contained in all publications are solely those of the individual author(s) and contributor(s) and not of MDPI and/or the editor(s). MDPI and/or the editor(s) disclaim responsibility for any injury to people or property resulting from any ideas, methods, instructions or products referred to in the content.