Reversible Conversion Formulas Based on Partial Symmetric Linear Regression Models
Abstract
1. Introduction
2. Background
3. Material and Methods
3.1. Model Fitting
3.2. Interaction Terms
3.3. Uncertainty Evaluation
4. Results
4.1. Numerical Studies
4.2. Example: Reversible Conversion Formula for the HAQ and MDHAQ Scores
5. Discussion
Author Contributions
Funding
Data Availability Statement
Acknowledgments
Conflicts of Interest
References
- Taagepera, R. Making Social Sciences More Scientific: The Need for Predictive Models; Oxford University Press: Oxford, UK, 2008. [Google Scholar]
- Carr, J.R. Orthogonal regression: A teaching perspective. Int. J. Math. Educ. Sci. Technol. 2012, 43, 134–143. [Google Scholar] [CrossRef]
- Francq, B.G.; Govaerts, B.B. Measurement methods comparison with errors-in-variables regressions. From horizontal to vertical OLS regression, review and new perspectives. Chemom. Intell. Lab. Syst. 2014, 134, 123–139. [Google Scholar] [CrossRef]
- Greco, L.; Luta, G.; Krzywinski, M.; Altman, N. Symmetric alternatives to the ordinary least squares regression. Nat. Methods 2025, 22, 1610–1612. [Google Scholar] [CrossRef] [PubMed]
- Chen, A.; Bengtsson, T.; Ho, T.K. A Regression Paradox for Linear Models: Sufficient Conditions and Relation to Simpson’s Paradox. Am. Stat. 2009, 63, 218–225. [Google Scholar] [CrossRef]
- Pearson, K. On lines and planes of closest fit to systems of points in space. London, Edinburgh, Dublin Philos. Mag. J. Sci. 1901, 2, 559–572. [Google Scholar] [CrossRef]
- Adcock, R.J. A problem in least squares. Analyst 1878, 5, 53–54. [Google Scholar] [CrossRef]
- Adcock, R. Extension of the method of least squares to any number of variables. Analyst 1880, 7, 22–23. [Google Scholar] [CrossRef]
- Stromberg, G. Accidental and Systematic Errors in Spectroscopic Absolute Magnitudes for Dwarf G0-K2 Stars. Astrophys. J. 1940, 92, 156. [Google Scholar] [CrossRef]
- Kermack, K.; Haldane, J.B. Organic correlation and allometry. Biometrika 1950, 37, 30–41. [Google Scholar] [CrossRef]
- Xu, S. A property of geometric mean regression. Am. Stat. 2014, 68, 277–281. [Google Scholar] [CrossRef]
- Greene, N. Generalized Least Squares Regression I: Efficient derivations. In Proceedings of the 1st International Conference on Computational Science and Engineering, Valencia, Spain, 6–8 August 2013. [Google Scholar]
- Deming, W.E. Statistical Adjustments of Data; Dover Publications: New York, NY, USA, 1943. [Google Scholar]
- Ripley, B.D.; Thompson, M. Regression techniques for the detection of analytical bias. Analyst 1987, 112, 377–383. [Google Scholar] [CrossRef]
- Linnet, K. Estimation of the linear relationship between the measurements of two methods with proportional errors. Stat. Med. 1990, 9, 1463–1473. [Google Scholar] [CrossRef] [PubMed]
- Carroll, R.J.; Ruppert, D.; Stefanski, L.A.; Crainiceanu, C.M. Measurement Error in Nonlinear Models: A Modern Perspective; Taylor & Francis Group: Abingdon, UK, 2006. [Google Scholar]
- Fuller, W.A. Measurement Error Models; John Wiley & Sons: Hoboken, NJ, USA, 2009. [Google Scholar]
- Kim, T.; Luta, G.; Bottai, M.; Chausse, P.; Doros, G.; Pena, E.A. Maximum Agreement Linear Prediction via the Concordance Correlation Coefficient. arXiv 2023, arXiv:2304.04221. [Google Scholar]
- Tan, C.Y.; Iglewicz, B. Measurement-methods comparisons and linear statistical relationship. Technometrics 1999, 41, 192–201. [Google Scholar] [CrossRef]
- Greene, N. Generalized Least-Squares Regressions V: Multiple Variables. In New Developments in Pure and Applied Mathematics, Proceedings of the International Conference on Mathematical Methods, Mathematical Models and Simulation in Science and Engineering (MMSSE 2015), Vienna, Austria, 15–17 March 2015; INASE: London, UK, 2015. [Google Scholar]
- Isobe, T.; Feigelson, E.D.; Akritas, M.G.; Babu, G.J. Linear regression in astronomy. Astrophys. J. 1990, 364, 104–113. [Google Scholar] [CrossRef]
- Stefanski, L.A.; Boos, D.D. The calculus of M-estimation. Am. Stat. 2002, 56, 29–38. [Google Scholar] [CrossRef]
- Kelly, G. The influence function in the errors in variables problem. Ann. Stat. 1984, 12, 87–100. [Google Scholar] [CrossRef]
- Gillard, J.; Iles, T. Variance Covariance Matrices for Linear Regression with Errors in Both Variables; Cardiff University School of Mathematics Technical Report; Cardiff University: Cardiff, UK, 2006. [Google Scholar]
- Therneau, T. deming: Deming, Theil-Sen, Passing-Bablock and Total Least Squares Regression, R package version 1.4; R Foundation for Statistical Computing: Vienna, Austria, 2018. [Google Scholar]
- Francq, B.G. Bootstrap in Errors-in-Variables Regressions Applied to Methods Comparison Studies. Inform. Medica Slov. 2014, 19, 1. [Google Scholar]
- Potapov, S.; Model, F.; Schuetzenmeister, A.; Manuilova, E.; Dufey, F.; Raymaekers, J. mcr: Method Comparison Regression, R package version 1.3.3.1; R Foundation for Statistical Computing: Vienna, Austria, 2024. [Google Scholar]
- Fries, J.F. The dimension of health outcomes: The Health Assessment Questionnaire. J. Rheumatol. 1982, 9, 789–793. [Google Scholar]
- Ørnbjerg, L.M.; Svensson, E.; Løngaard, K.; Meincke, R.H.; Pedersen, J.K.; Dreyer, L.; Krogh, N.S.; Jensen, D.V.; Hetland, M.L. Conversion of the MDHAQ to the HAQ score: A simple algorithm developed and validated in a cohort of 13 391 real-world patients. Rheumatology 2022, 61, 3919–3929. [Google Scholar] [CrossRef]
- Li, M.; Ma, Y. An update on measurement error modeling. Annu. Rev. Stat. Its Appl. 2024, 11, 279–296. [Google Scholar] [CrossRef]
- Barry, T.; Roeder, K.; Katsevich, E. Exponential family measurement error models for single-cell CRISPR screens. Biostatistics 2024, 25, 1254–1272. [Google Scholar] [CrossRef]
- Ma, Z.; Chen, M.H. A Bayesian model-based reduced major axis regression. Biom. J. 2024, 66, 2300279. [Google Scholar] [CrossRef]


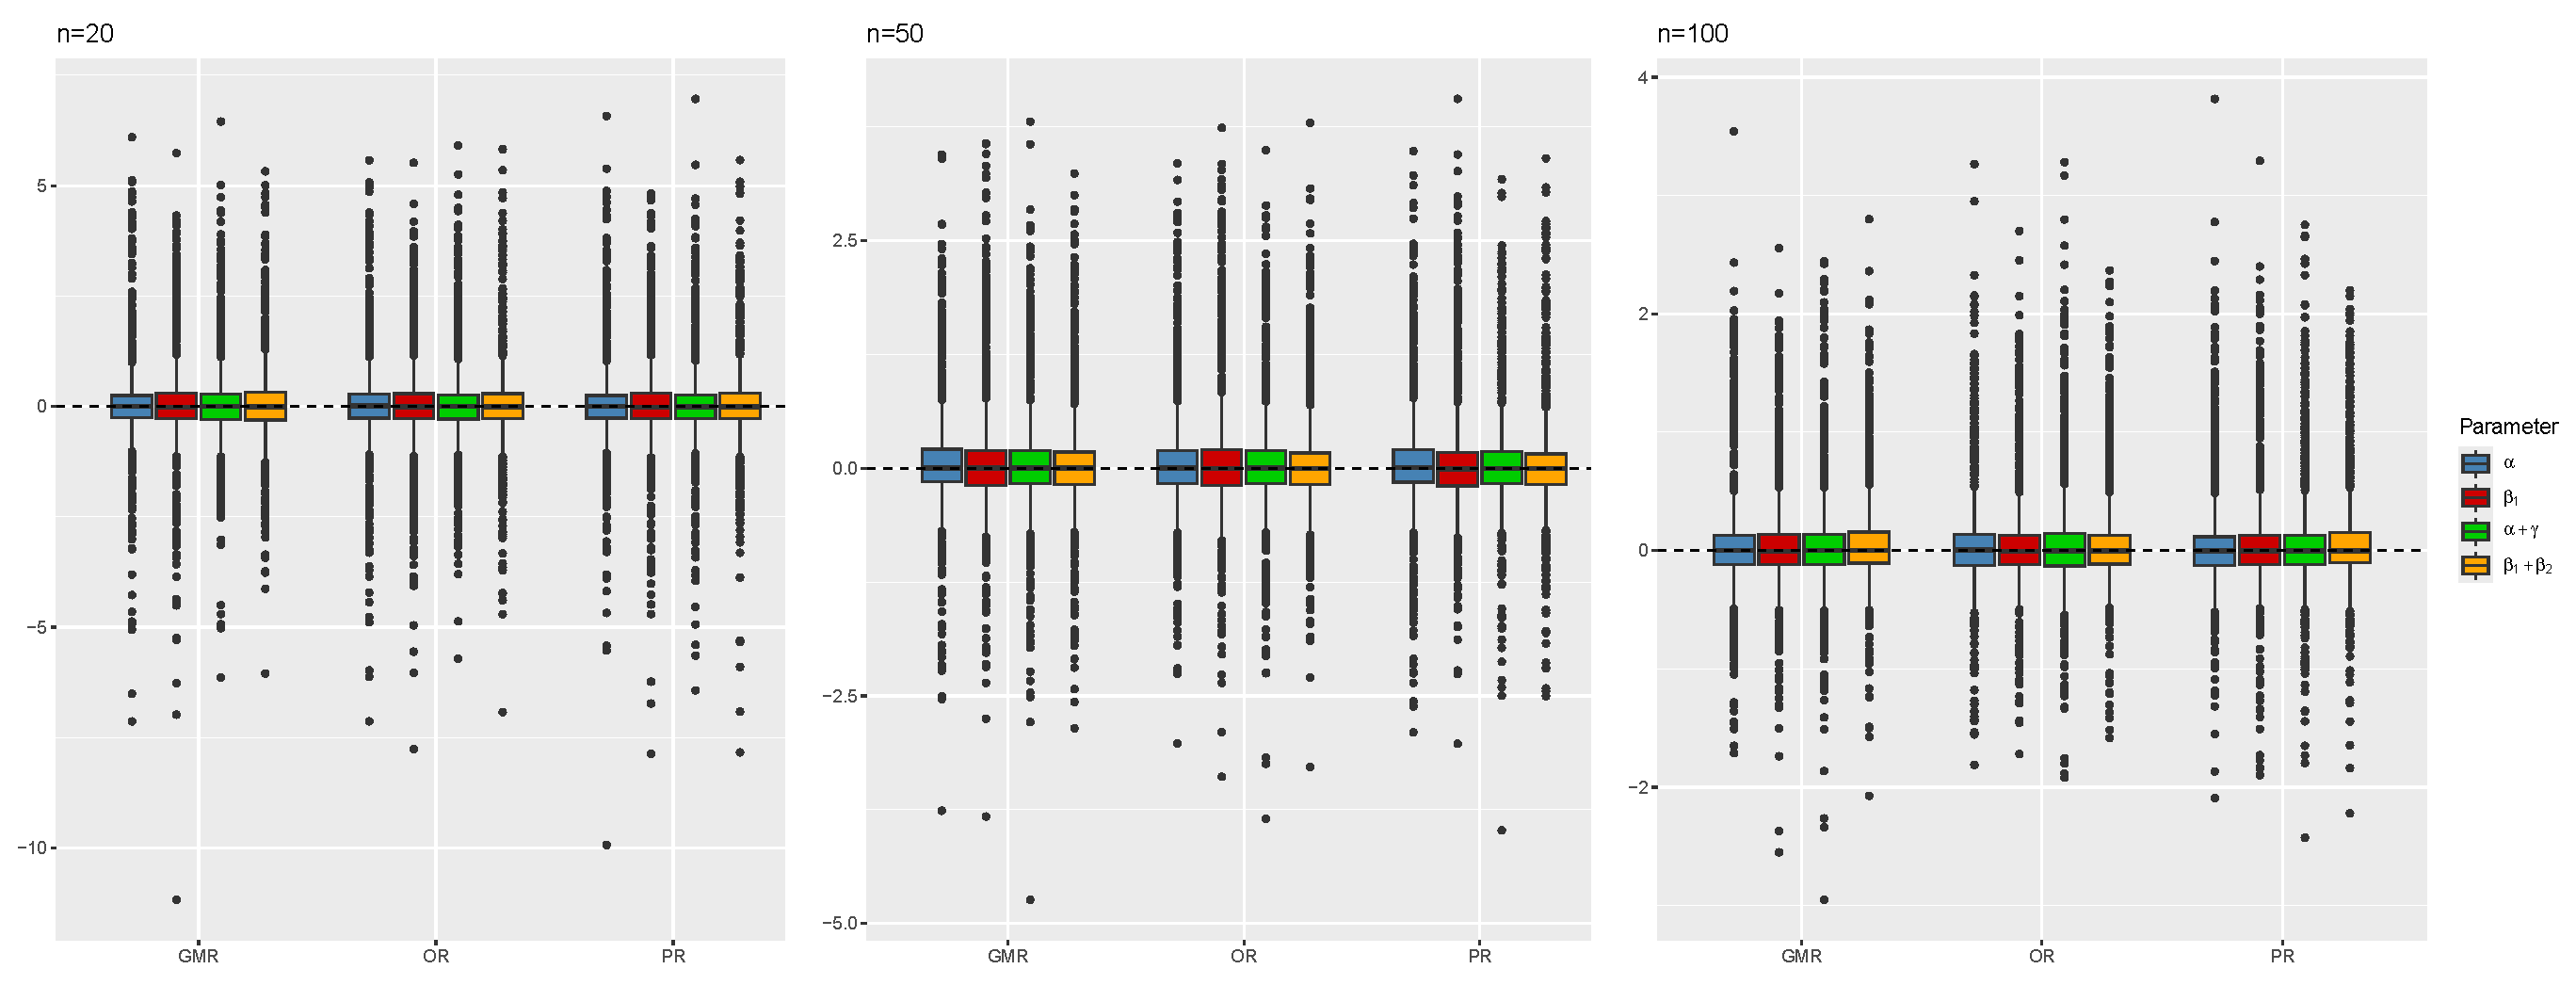
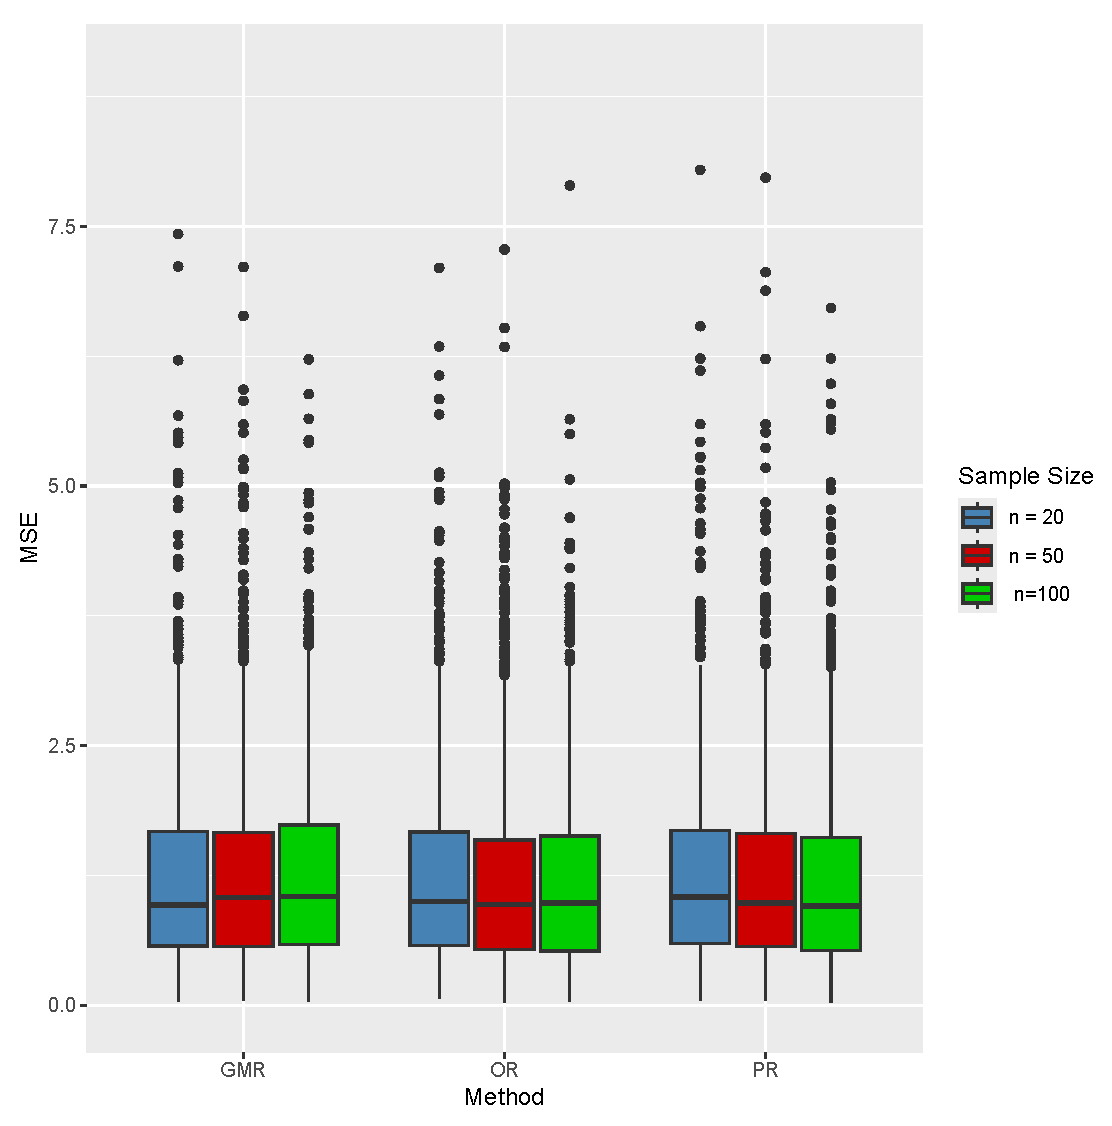


| GMR | PR | OR | ||||
|---|---|---|---|---|---|---|
| n | 0.90 | 0.95 | 0.90 | 0.95 | 0.90 | 0.95 |
| 20 | 0.89 | 0.93 | 0.89 | 0.94 | 0.89 | 0.93 |
| 50 | 0.89 | 0.93 | 0.89 | 0.93 | 0.89 | 0.93 |
| 100 | 0.91 | 0.95 | 0.91 | 0.95 | 0.91 | 0.95 |
| 20 | 0.89 | 0.94 | 0.89 | 0.94 | 0.89 | 0.94 |
| 50 | 0.87 | 0.94 | 0.87 | 0.94 | 0.87 | 0.94 |
| 100 | 0.90 | 0.95 | 0.91 | 0.95 | 0.90 | 0.95 |
| GMR | PR | OR | ||||
|---|---|---|---|---|---|---|
| n | 0.90 | 0.95 | 0.90 | 0.95 | 0.90 | 0.95 |
| 20 | 0.87 | 0.92 | 0.86 | 0.92 | 0.86 | 0.92 |
| 50 | 0.87 | 0.92 | 0.87 | 0.92 | 0.87 | 0.92 |
| 100 | 0.91 | 0.95 | 0.91 | 0.95 | 0.91 | 0.95 |
| 20 | 0.86 | 0.91 | 0.86 | 0.91 | 0.86 | 0.91 |
| 50 | 0.89 | 0.94 | 0.89 | 0.94 | 0.89 | 0.94 |
| 100 | 0.90 | 0.95 | 0.90 | 0.95 | 0.90 | 0.94 |
| GMR | PR | OR | ||||
|---|---|---|---|---|---|---|
| n | 0.90 | 0.95 | 0.90 | 0.95 | 0.90 | 0.95 |
| 20 | 0.85 | 0.91 | 0.85 | 0.91 | 0.86 | 0.91 |
| 50 | 0.87 | 0.93 | 0.87 | 0.93 | 0.88 | 0.93 |
| 100 | 0.90 | 0.95 | 0.91 | 0.95 | 0.91 | 0.95 |
| 20 | 0.85 | 0.90 | 0.85 | 0.90 | 0.85 | 0.91 |
| 50 | 0.89 | 0.94 | 0.89 | 0.94 | 0.90 | 0.94 |
| 100 | 0.89 | 0.94 | 0.89 | 0.94 | 0.89 | 0.94 |
| GMR | PR | OR | |||||
|---|---|---|---|---|---|---|---|
| n | 0.90 | 0.95 | 0.90 | 0.95 | 0.90 | 0.95 | |
| 20 | 0.82 | 0.92 | 0.88 | 0.92 | 0.88 | 0.91 | |
| 0.82 | 0.87 | 0.81 | 0.86 | 0.82 | 0.87 | ||
| 0.84 | 0.89 | 0.88 | 0.92 | 0.81 | 0.91 | ||
| 0.80 | 0.85 | 0.78 | 0.83 | 0.82 | 0.86 | ||
| 50 | 0.89 | 0.93 | 0.90 | 0.93 | 0.89 | 0.93 | |
| 0.85 | 0.91 | 0.85 | 0.91 | 0.85 | 0.91 | ||
| 0.84 | 0.90 | 0.90 | 0.93 | 0.89 | 0.94 | ||
| 0.82 | 0.88 | 0.82 | 0.88 | 0.85 | 0.92 | ||
| 100 | 0.91 | 0.95 | 0.91 | 0.95 | 0.91 | 0.95 | |
| 0.87 | 0.93 | 0.87 | 0.93 | 0.87 | 0.93 | ||
| 0.82 | 0.890 | 0.91 | 0.95 | 0.90 | 0.95 | ||
| 0.85 | 0.90 | 0.85 | 0.90 | 0.90 | 0.94 | ||
| Age | MDHAQ | HAQ | |
|---|---|---|---|
| Minimum | 15.00 | 0.0000 | 0.0000 |
| 1st Quartile | 45.00 | 0.1000 | 0.1250 |
| Median | 58.00 | 0.4000 | 0.6250 |
| Mean | 56.42 | 0.5827 | 0.7333 |
| 3rd Quartile | 69.00 | 0.9000 | 1.1250 |
| Maximum | 99.00 | 3.0000 | 3.0000 |
| Standard Deviation | 15.8814 | 0.5495 | 0.6773 |
| GMR | OLS | |||
|---|---|---|---|---|
| Estimate | S.E. | Estimate | S.E. | |
| −0.1142 | 0.0047 | −0.0795 | 0.0049 | |
| 1.2213 | 0.0024 | 1.1137 | 0.0024 | |
| 0.0024 | 0.0001 | 0.0029 | 0.0001 | |
Disclaimer/Publisher’s Note: The statements, opinions and data contained in all publications are solely those of the individual author(s) and contributor(s) and not of MDPI and/or the editor(s). MDPI and/or the editor(s) disclaim responsibility for any injury to people or property resulting from any ideas, methods, instructions or products referred to in the content. |
© 2025 by the authors. Licensee MDPI, Basel, Switzerland. This article is an open access article distributed under the terms and conditions of the Creative Commons Attribution (CC BY) license (https://creativecommons.org/licenses/by/4.0/).
Share and Cite
Greco, L.; Luta, G. Reversible Conversion Formulas Based on Partial Symmetric Linear Regression Models. Symmetry 2025, 17, 1862. https://doi.org/10.3390/sym17111862
Greco L, Luta G. Reversible Conversion Formulas Based on Partial Symmetric Linear Regression Models. Symmetry. 2025; 17(11):1862. https://doi.org/10.3390/sym17111862
Chicago/Turabian StyleGreco, Luca, and George Luta. 2025. "Reversible Conversion Formulas Based on Partial Symmetric Linear Regression Models" Symmetry 17, no. 11: 1862. https://doi.org/10.3390/sym17111862
APA StyleGreco, L., & Luta, G. (2025). Reversible Conversion Formulas Based on Partial Symmetric Linear Regression Models. Symmetry, 17(11), 1862. https://doi.org/10.3390/sym17111862


