Abstract
Accurate heavy-duty vehicle load estimation is crucial for transportation and environmental regulation, yet current methods lack precision in data accuracy and practicality for field implementation. We propose a Self-Supervised Reconstruction Heterogeneous Graph Convolutional Network (SSR-HGCN) for load estimation using On-Board Diagnostics (OBD) data. The method integrates physics-constrained heterogeneous graph construction based on vehicle speed, acceleration, and engine parameters, leveraging graph neural networks’ information propagation mechanisms and self-supervised learning’s adaptability to low-quality data. The method comprises three modules: (1) a physics-constrained heterogeneous graph structure that, guided by the symmetry (invariance) of physical laws, introduces a structural asymmetry by treating kinematic and dynamic features as distinct node types to enhance model interpretability; (2) a self-supervised reconstruction module that learns robust representations from noisy OBD streams without extensive labeling, improving adaptability to data quality variations; and (3) a multi-layer feature extraction architecture combining graph convolutional networks (GCNs) and graph attention networks (GATs) for hierarchical feature aggregation. On a test set of 800 heavy-duty vehicle trips, SSR-HGCN demonstrated superior performance over key baseline models. Compared with the classical time-series model LSTM, it achieved average improvements of 20.76% in RMSE and 41.23% in MAPE. It also outperformed the standard graph model GraphSAGE, reducing RMSE by 21.98% and MAPE by 7.15%, ultimately achieving < 15% error for over 90% of test samples. This method provides an effective technical solution for heavy-duty vehicle load monitoring, with immediate applications in fleet supervision, overloading detection, and regulatory enforcement for environmental compliance.
1. Introduction
China’s road freight transported 403.37 billion tons of commercial cargo in 2023 [1], representing significant growth in the transportation sector. Accurate heavy-duty vehicle load estimation is crucial for improving logistics efficiency, reducing costs, and minimizing environmental pollution. However, traditional weighing technologies struggle to meet real-time performance and cost-effectiveness requirements for such large-scale operations. Current load monitoring systems primarily rely on weighbridges at highway entrances, which, despite having high accuracy, suffer from fixed locations and operational inefficiencies. These limitations have prompted the development of vehicle-mounted sensor methods. Tosoongnoen et al. [2] developed a strain gauge-based sensor for real-time truck freight monitoring and found linear relationships between sensor values and vehicle loads. However, their method exhibited limited measurement range and struggled with dynamic responses under complex conditions. Nikishechkin et al. [3] employed fluxgate sensors to measure magnetic field strength from DC traction motors, but their method required identical calibration routes, severely limiting practical deployment. Marszalek et al. [4] utilized inductive-loop technology for load estimation of moving passenger cars, which achieved good results for light vehicles but lacked scalability to heavy-duty applications.
While these sensor-based approaches demonstrate feasibility, they universally face challenges of high installation costs, complex calibration procedures, and limited adaptability across diverse vehicle types. To address these limitations, researchers have turned to Unobtrusive On-Board Weighing (UOBW) methods, which estimate loads through vehicle dynamics without hardware modifications. Torabi et al. [5] applied feedforward neural networks using acceleration, torque, and speed parameters, achieving an RMSE of approximately 1% in specific scenarios. However, their approach was limited to simulation data and particular slope conditions. Jensen et al. [6] developed mass estimation based on longitudinal dynamics using IMU and CAN-bus data; while their method achieved errors within 5% for light vehicles, it struggled with heavy-duty vehicle applications and varying road conditions. Korayem et al. [7] compared physics-based and machine learning methods for trailer mass estimation, demonstrating errors below 10% but requiring extensive calibration for different vehicle types.
While these UOBW methods eliminate hardware requirements, they still face challenges in generalization across diverse operating conditions and vehicle configurations, particularly for heavy-duty vehicles. Deep learning integration has shown promise in overcoming traditional limitations. Han et al. [8] utilized Bi-LSTM networks for real-time truck load estimation based on deep learning, achieving an average relative error of 3.58% on 80% of samples. Nevertheless, their method required high-quality structured data and manual preprocessing. Gu et al. [9] enhanced this approach with multi-head attention mechanisms, reducing MAE by 6% and RMSE by 5%, but their method still faced challenges with data quality requirements and computational complexity. Li et al. [10] employed Internet-of-Vehicles big data with clustering analysis, controlling errors within 10%, but their method suffered from non-end-to-end processing that introduced variability in results.
While deep learning methods demonstrate improved accuracy over traditional approaches, they still face challenges with data quality issues and lack interpretability, motivating researchers to explore complementary approaches. Recent advances include computer vision-based and physics-constrained methods. Feng et al. [11] applied computer vision for moving vehicle weight estimation through tire deformation analysis, but their method faced challenges with environmental conditions and tire variability. Yu et al. [12] developed a physics-constrained generative adversarial network for probabilistic vehicle weight estimation; their method showed innovation in handling uncertainty but was limited by computational efficiency and specific infrastructure requirements. İşbitirici et al. [13] noted that traditional LSTM-based virtual load sensors struggle with dynamically changing features and long-term dependencies in heavy-duty vehicle applications. Integrating prior physics-based knowledge into deep learning models is a key research direction for enhancing their performance and data efficiency.
Despite recent advances, current methods face the following critical limitations:
- (1)
- Excessive sensor dependence that increases costs and limits widespread adoption;
- (2)
- Restricted application scenarios due to the lack of universality across vehicle types and conditions;
- (3)
- Significant manual intervention required for data preprocessing, which reduces practical deployment feasibility.
To overcome the shortcomings of existing models, current state-of-the-art research has advanced in two key directions: physics-informed machine learning (PIML) and graph neural networks (GNNs). PIML techniques, in particular, have demonstrated tangible benefits. For instance, Pestourie et al. [14] showed that coupling a low-fidelity simulator with a neural network can achieve a threefold accuracy improvement while reducing data requirements by a factor of over 100. Other hybrid architectures, such as the dual-branch neural ODE proposed by Tian et al. [15], have achieved state-of-the-art performance in air quality prediction. Beyond accuracy, PIML can also tackle fundamental scientific challenges; Zou et al. [16] have shown that ensembles of PINNs can discover multiple physical solutions, successfully identifying both stable and unstable results for problems like the Allen–Cahn equation. In parallel, GNNs have excelled in modeling complex relational systems. Liu et al. [17], for example, incorporated the flow conservation law into the loss function of a heterogeneous GNN, which outperformed conventional models in both convergence rate and prediction accuracy for traffic assignment.
Despite these advances, a critical research gap remains for the specific challenge of real-world vehicle load estimation. Existing PIML techniques often require well-defined governing equations or simulators that are impractical for noisy OBD data where key variables (e.g., road grade and wind resistance) are unobserved. Similarly, while GNNs can model relationships, a standard application does not inherently enforce vehicle-specific physical laws or address the significant data quality issues (noise, outliers, and missing values) endemic to real-world OBD streams. Therefore, an innovative method is needed that synergistically combines the structural relational learning of GNNs with the domain knowledge of physics, while also being inherently robust to low-quality, unlabeled sensor data.
To bridge this gap, this paper proposes a Self-Supervised Reconstruction Heterogeneous Graph Convolutional Network (SSR-HGCN), a novel framework designed for robust and accurate load estimation based on raw OBD data. Our approach is founded on three key innovations that directly address the aforementioned limitations:
- (1)
- A physics-constrained heterogeneous graph structure: Unlike models that ignore physics or require rigid equations, we encode vehicle dynamics directly into the model’s architecture. We construct a heterogeneous graph where distinct node types represent kinematic and dynamic features, and cross-domain edges explicitly enforce known physical relationships. This provides a strong inductive bias, enhancing both accuracy and interpretability.
- (2)
- A self-supervised reconstruction mechanism: To tackle real-world data quality issues without costly manual labeling, we introduce a self-supervised auxiliary task. The model is forced to reconstruct the input features from their learned representations, which promotes the learning of robust features that are invariant to noise and sensor irregularities.
- (3)
- A hierarchical feature extraction framework: We design a multi-layer architecture combining graph convolutional networks (GCNs) and graph attention networks (GATs) to effectively aggregate information across temporal, kinematic, and dynamic dimensions, capturing complex dependencies in the data.
2. Materials and Methods
2.1. Data Collection and Preprocessing
Considering that vehicle loads remain stable during continuous highway driving and that highway entrance/exit weighbridge measurements are accurate, we collected heavy-duty vehicle trajectory data from highway segments as our research material. The vehicle trajectory data originates from second-by-second OBD transmission data required by China’s Stage VI Heavy-Duty Vehicle Emission Standards, covering 800 6-axle heavy-duty vehicle trips on selected highways in Hebei Province from September to December 2024, with an average single trip duration of 4 h. The data format is shown in Table 1.

Table 1.
Vehicle data field specification.
The vehicle highway weighing data comes from real-time weighbridge data uploaded through the national highway networked toll collection platform, collected at highway entrances/exits corresponding to the trajectory data. By matching weighing data with trajectory data from similar time periods, we obtained actual vehicle loads for each trip.
The specific data matching process includes
- Grouping samples based on X_VIN identifiers, using time windows to divide data segments with time intervals not exceeding 2 h under the same X_VIN into independent data groups, ensuring temporal continuity.
- Matching highway weighing raw data (containing X_VIN, timestamp, and weight values) with segmented datasets through X_VIN and timestamps, retaining only successfully matched data groups as reliable datasets.
- Supplementing calculations for acceleration and traction force features that have strong correlations with load using empirical formulas (see Equations (1) and (2)). In the equations, is the current data vehicle speed, is the previous data vehicle speed, is the current data timestamp, is the previous data timestamp. is the engine net output torque, u is the transmission efficiency (0.8 based on empirical formula), and is the wheel radius (0.5 m based on empirical formula), with units corresponding to those presented in Table 1.
- Filtering outliers for all fields to ensure logical data features, with the range boundaries based on transportation industry empirical data, while maximizing data continuity and completeness; the filtering ranges are shown in Table 1.
- Calculating the mean and variance for all fields, and standardizing all fields to obtain complete valid input. For feature X with mean and standard deviation , the standardization process follows Equation (3), where is the standardized result.
The complete dataset includes all standardized fields shown in Table 1, except for X_VIN and timestamp. The final sample weight distribution is shown in Figure 1, which exhibits a unimodal distribution centered at 40–48 t, indicating that vehicles typically operate at full capacity for bulk material transportation, with most tasks requiring vehicles to reach the design load limits, reflecting the scale characteristics of logistic transportation. Low-load intervals have lower proportions, corresponding to empty return trips and scattered cargo scenarios.
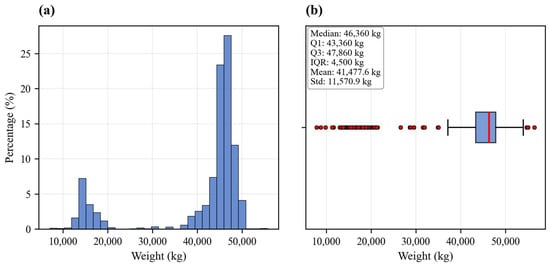
Figure 1.
Distribution analysis of vehicle weight data. (a) Histogram showing the percentage distribution of vehicle weights with 30 bins; (b) box plot displaying the statistical summary including the median, quartiles, and outliers.
2.2. Overall Framework Design
We combined deep learning technology with graph neural networks, physical constraints, and self-supervised techniques to construct a comprehensive estimation system framework, achieving a physically constrained model SSR-HGCN with strong interpretability and high estimation accuracy.
The architectural design of the SSR-HGCN is fundamentally informed by the principle of leveraging representational asymmetry to capture underlying physical symmetries. The governing laws of vehicle dynamics exhibit invariance across diverse operational contexts, a symmetry that conventional models struggle to learn due to their flawed inductive bias of treating all input features homogeneously. Our framework directly confronts this by constructing a heterogeneous graph, which introduces a structural asymmetry that segregates kinematic and dynamic features into distinct node domains. This physics-informed asymmetry provides a more accurate inductive bias, compelling the model to learn the universal, symmetric laws of motion with higher fidelity from noisy, real-world data.
As shown in Figure 2, the graph neural networks serve as the feature extraction module, leveraging their message-passing mechanism to explicitly model physical constraints between features [18]. The methodology comprises four main steps:
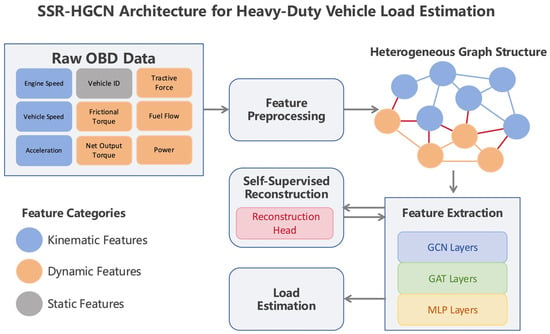
Figure 2.
SSR-HGCN complete workflow diagram.
- (1)
- Constructing a heterogeneous graph topology with physical constraint edges based on the coupling between vehicle load and kinematic/dynamic features;
- (2)
- Designing a corresponding feature extraction network;
- (3)
- Implementing feature reconstruction for enhanced robustness;
- (4)
- Applying fully connected layers for final load estimation.
As shown in Figure 2, the heterogeneous graph construction begins with establishing separate node domains for kinematic and dynamic features. Cross-domain dependency edges enable feature interaction and enforce physical constraints (illustrated as red edges in Figure 2). Additionally, temporal edges connect adjacent data records within each domain. These three edge types collectively form the data topology and corresponding adjacency matrix.
For feature extraction, linear mapping first embeds the heterogeneous graph features into high-dimensional space to enhance expressiveness. The graph convolutional and attention layers then aggregate neighborhood information hierarchically, extracting three distinct feature representations: kinematic domain features, dynamic domain features, and cross-domain constraint information. Pooling and concatenation operations subsequently reduce dimensionality while preserving semantic information from all three feature types.
The feature reconstruction module enhances model robustness by reconstructing pre-pooling representations back to the original input space through linear mapping. This reconstruction task, serving as an auxiliary objective, enables the network to learn robust representations from noisy data.
Finally, a multilayer perceptron (MLP) transforms the extracted features into load estimates through multiple linear transformations with activation functions. The main task (load estimation) and auxiliary task (feature reconstruction) jointly optimize model parameters, thereby improving both accuracy and robustness to data quality variations.
2.3. Feature Reconstruction
The reconstruction head, as a component that can restore model-extracted feature representations to original inputs [19], operates on the core mechanism of forcing the model to learn the intrinsic structure and semantic information of input data through reconstruction auxiliary tasks.
This component typically works collaboratively with the feature extraction module to enhance model generalization capability. In heavy-duty vehicle load estimation scenarios, the acquisition cost of high-quality labeled data is significant, but the self-supervised reconstruction head can alleviate limitations brought by low-quality data (such as noisy data, missing values, and outliers). By identifying low-quality data features through reconstruction errors, it ensures that the model maintains stable estimation performance under complex data features corresponding to various working conditions. At the same time, it minimizes the impact on model accuracy.
We adopted a regression-based self-supervised learning reconstruction head that forces the graph convolutional networks to learn more semantically representative graph embedding structures through a node feature reconstruction mechanism. The workflow is shown in Figure 3. The model connects a linear reconstruction head after the feature extraction network, with its structure shown in Equation (4).
where represents the reconstructed original input; represents the node embeddings output by the feature extraction network; is the output dimension corresponding to the nodes; and are the weight and bias terms of the reconstruction head feature vector, respectively; and is the corresponding dimension of input features. The reconstruction head maps the node embeddings back to the original feature space, supervised by the mean squared error loss during training, as shown in Equation (5):
where represents the original input features and N is the total number of nodes. The reconstruction head serves as a model auxiliary task, minimizing through gradient descent methods, and forcing the feature extraction network to learn the intrinsic structure and semantic information of input data.
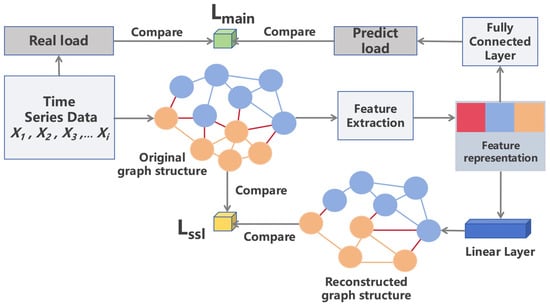
Figure 3.
Feature reconstruction workflow.
2.4. Graph Convolutional Network
The graph structures consist of nodes and edges , represented formally as shown in Equation (6).
where represents the number of nodes, the edge structure is represented by the adjacency matrix, the node feature matrix is , and and correspond to different graph node indices. Graph convolutional networks (GCNs) extract cross-node features through message-passing mechanisms that aggregate node neighborhood information to learn node-level representations. The main processes include message generation (Equation (7)), message aggregation (Equation (8)), and feature updating (Equation (9)).
In message generation, the neighbors of node , messages are generated based on their features, where is a custom message function that is typically set as a simple linear mapping neural network. For message aggregation, node aggregates messages passed from all neighbors to obtain an aggregated message , where is the aggregation function, typically taking global average aggregation or global maximum aggregation. For feature updating, node features are updated based on aggregated messages, where is the update function, which is typically a nonlinear transformation. We used ReLU activation function plus a fully connected layer as the update function, as shown in Equation (10).
Heavy-duty vehicle trajectory data exhibits temporal dependencies and large feature fluctuations; thus, we adopted graph convolutional networks as the feature extraction network [20]. As shown in Equation (11), the core idea is to perform normalized linear transformation on the nodes and their neighborhood feature matrices.
where is the feature vector of node in the -th layer; denotes the first-order neighborhood of node , with indicating the inclusion of self-loops; represents the degree of node with self-loops; is the learnable weight matrix of the -th layer; and is a nonlinear activation function, referring to Equation (10). This transformation process is extended to the entire graph, as shown in Equations (12) and (13), where is the normalized adjacency matrix, is the original adjacency matrix, is the identity matrix, and is the diagonal matrix.
The final update process of the global feature vector is shown in Equation (14).
2.5. Graph Attention Network
A graph attention network (GAT) is a feature extraction module that dynamically assigns weights based on feature importance. Its core idea is to weight connections between nodes through dynamically learned attention mechanisms, determining neighbor importance during feature aggregation. GATs differ from GCNs in that GCNs use degree-based weighted summation to aggregate neighbor node information, whereas GATs calculate attention coefficients through attention mechanisms to adjust node weights; this enables better capture of non-local graph information, as shown in Equation (15). To make the model focus more on features directly related to load, we used a GAT as a special GCN for feature extraction in ablation experiments [21].
where is a learnable weight vector representing attention mechanism weights; || represents feature concatenation operation; and are features obtained by linear transformation of nodes i and j, respectively. is an activation function that performs better than ReLU in GATs, and it is specifically shown in Equation (16), where is an adjustable parameter corresponding to the activation function.
Finally, attention coefficients are normalized through the Softmax function to obtain a normalized attention coefficient, representing the influence degree of node j on node i. The Softmax function is shown in Equation (17), where exp represents the natural exponential function. Figure 4 illustrates the GAT feature processing pipeline.

Figure 4.
Schematic diagram of attention coefficient calculation between single nodes in the GAT layer.
2.6. SSR-HGCN Model
Building upon the self-supervised reconstruction module and graph neural network described above, we categorized OBD parameters into two groups: kinematic features (vehicle speed, engine speed, and acceleration) and dynamic features (engine torque, friction torque, fuel flow, power, and traction) for heavy-duty vehicle load estimation. To capture the temporal interactions between kinematic and dynamic features that influence vehicle load, we proposed the SSR-HGCN model, which enforces physical constraints through cross-domain message passing between kinematic and dynamic features.
As shown in Figure 5, the complete structure and data flow of the SSR-HGCN model are as follows: After window grouping, standardization, and feature domain division of the original input features, we obtain kinematic feature input X1 and dynamic feature input X2. Cross-domain edges connect corresponding time steps between X1 and X2 to encode physical constraints. After extraction via the feature extraction network, the three types of features generate graph-level kinematic representation X3, dynamic representation X5, and physical constraint representation X4, respectively. After pooling X3 and X5, they are concatenated with the corresponding dimensional physical constraint representation X4, and input to the multilayer perceptron to form the main task, producing load prediction Y2 for comparison with actual load Y1 in the main task. Pre-pooling representations are reconstructed through the reconstruction head into temporal edge features consistent with the original temporal edges, forming the auxiliary task. The two types of tasks are trained collaboratively through joint loss functions, ultimately forming the complete model training process. Below is further explanation of the feature dimensions and physical constraint logic:
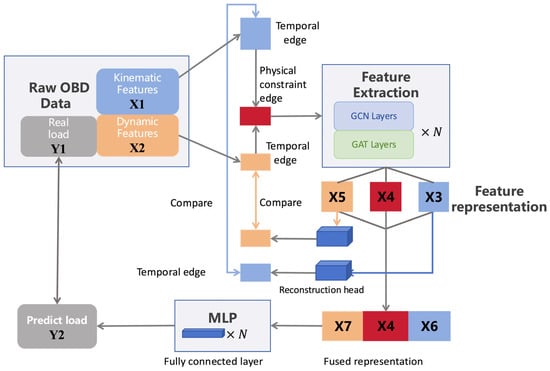
Figure 5.
Schematic diagram of data flow process.
- The original features (where “−2” corresponds to derivative fields such as acceleration and traction that have not yet been supplemented) are split into kinematic and dynamic features, and , after window grouping, standardization processing, and derivative field supplementation. The processing logic is detailed in the experimental section below. Here, “batch_size” represents the number of data groups participating in each batch input, window is the time window length, and and correspond to the kinematic and dynamic feature dimensions, respectively.
- The kinematic feature is connected through temporal edges and outputs node embeddings through the feature extraction network (where is the number of output channels for feature extraction), obtaining graph-level representation after pooling. The dynamic feature is processed through a feature extraction network with different input dimensions but an otherwise identical structure, outputting node embeddings and obtaining representation after pooling.
- The longitudinal force balance equation for a moving vehicle describes the equilibrium between traction force and all resistive/inertial forces acting upon the vehicle. The general form of this equilibrium iswhere is the traction force (N) transmitted from the engine to the driving wheels via the powertrain; is the inertial force (N) opposing vehicle acceleration, calculated as , with being the total mass of the vehicle; is the grade resistance (N) caused by road inclination, expressed as ; is the gravitational acceleration; is the rolling resistance (N) between the tires and the road surface, defined as ; is the aerodynamic drag (N) opposing vehicle motion, calculated using the standard air resistance formula: .Based on the above formula, it can be derived that (Equation (18))where is the load, is the traction force, is air density (kg/m3), is the frontal area (m2), is the air resistance coefficient, is the vehicle speed (m/s), is gravitational acceleration, is the rolling resistance coefficient, is acceleration (m/s2), and is the vehicle’s unladen weight. Physical constraints are constructed based on the relationships between the measured variables, including acceleration, vehicle speed, and traction. Specifically, after abstracting and into graph nodes and corresponding temporal edges, nodes of the same time sequence are connected to obtain corresponding physical constraint edges, which are transformed into graph-level physical constraint representation after feature extraction network and pooling operations.
- The reconstruction head reconstructs and through linear mapping into adjacency matrix structures corresponding to the original temporal edges, and the reconstruction loss is calculated based on the mean squared error between the reconstructed and original temporal features.
- The three types of graph-level representations are concatenated and fused, outputting the final load prediction result through the multilayer perceptron, which is compared with the actual load through the mean squared error to obtain the fitting main task loss.
- We adopted a joint optimization learning method for gradient descent, balancing prediction accuracy with generalization. The total loss function L is calculated as shown in Equation (19):where λ is the self-supervised loss weight determined through ablation experiments. The reconstruction head design considers two key aspects: loss balance parameters λ and reconstruction head structure. First, to ensure that the encoder can capture sufficiently compact semantic features to support reconstruction, we adopted a simple single-layer linear transformation reconstruction head as the main structure of the reconstruction module. Second, by adjusting different loss balance parameters, we ensure that the model does not deviate from the prediction target.
2.7. Evaluation Metrics
As shown in Figure 1, the main distribution interval of the original load data concentrates at 40–48 t, directly reflecting the prevalence of 6-axle heavy-duty vehicle loads under full-load scenarios; the low-proportion interval at 10–25 t on the left corresponds to the typical load characteristics of empty states and return cargo scenarios. Further analysis of the box plot shows a median load of 44 t, with most experimental samples being 42–46 t.
Based on the above analysis, the original load data exhibits certain long-tail characteristics that closely match actual transportation scenarios but cause conventional evaluation metrics like the mean square error to inadequately represent model fitting effects. To alleviate evaluation metric distortion from such issues, we adopted the root mean square error (RMSE) as the core evaluation metric, calculated as shown in Equation (20), where is the actual value, is the predicted value, and n is the test set size. However, a disadvantage of using the RMSE is its sensitivity to outliers with large absolute errors. To avoid the influence of extreme outliers in the test samples, we also introduced the mean absolute percentage error (MAPE) to measure model fitting consistency across the overall sample set. The MAPE significantly reduces outlier interference on evaluation results by calculating the mean relative error between the predicted and actual values, as shown in Equation (21).
Lower values for both metrics indicate higher model estimation accuracy. The combined application of both metrics enables both quantitative analysis of individual sample fitting accuracy and reliable overall evaluation of models under complex data distributions.
2.8. Implementation Details
The SSR-HGCN model was implemented using PyTorch 1.12.0. All experiments were conducted on a server equipped with NVIDIA RTX 3090 GPU (24 GB memory) and Intel Core i9-10900K CPU. The dataset was split into 70% training, 15% validation, and 15% test sets. The key parameters were as follows:
- Time window size: 60 s (corresponding to 60-time steps at a sampling rate of 1 Hz);
- Batch size: 32 (“Batch size” is a core hyperparameter in deep learning training, referring to the number of samples processed by the model);
- Learning rate: 0.001, using the Adam optimizer;
- Training epochs: 200 epochs, using early stopping strategy (threshold = 20, signaling that training stops when the validation set’s root mean square error (RMSE) does not decrease for 20 consecutive epochs);
- Dropout probability: 0.2 (used for model regularization to prevent overfitting).
To enable real-world deployment, the field terminal was connected to a 4G-Cat1 device via the OBD-II interface, powered by the vehicle’s electrical system. Upon power-up, it automatically completes network registration. The terminal periodically reads critical data such as engine RPM, vehicle speed, and fault codes. This data is encapsulated into JSON messages with timestamps and vehicle identifiers, and then securely transmitted to the cloud via MQTT-TLS. The edge device handles only data collection and transmission and does not perform local computation. Model inference is uniformly executed on cloud GPU servers, enabling a complete streaming workflow.
3. Results
3.1. Ablation Study
To explore the effectiveness of the feature extraction networks and self-supervised learning modules in the SSR-HGCN model, we employed ablation experimental strategies. By adjusting various layer settings of the feature extraction networks to construct differentiated feature extraction networks and controlling the activation status of the self-supervised learning modules, we conducted multiple comparative experiments to optimize the hyperparameters and module combinations. Simultaneously, we selected data subsets with sufficient samples from different load intervals for full-range load data fitting, and we quantitatively evaluated model prediction accuracy to verify engineering feasibility and reliability in real transportation scenarios. The experimental results are shown in Table 2, where (1) the first row numbers represent model feature extraction network levels, with each level corresponding to a feature extraction module; (2) the REC column represents the reconstruction head ratio coefficient (Equation (19)), with a larger coefficient indicating a higher reconstruction degree of extracted features; (3) GCN(a, b) and GAT(a, b) represent the model feature extraction modules, where a is the input dimension and b is the output dimension; (4) the first column numbers are comparison model numbers in the ablation experiments (e.g., 16 represents Model 16); and (5) the underlined parameters are the optimized parameters.

Table 2.
Results of ablation experiments.
From Models 0 to 12, we observed that in early stages with fewer layers, the reconstruction head’s learning of original features disrupts the simple associations between shallow features and targets. As the GCN layers increase, the model’s ability to capture high-order interaction features strengthens, but the use of irregular graph topology structures from low-quality data risks overfitting in deep networks. Here, the reconstruction head acts as a regularization method, effectively constraining deep network parameter update directions by minimizing feature reconstruction errors, thus promoting more stable extraction of high-order association features, and ultimately improving prediction accuracy.
Through the ablation analysis, we selected four typical models for subsequent comparison under different working conditions, as shown in Table 3.

Table 3.
Comparison of estimation accuracy for different models (with a focus on ablation experiment).
3.2. Model Performance Analysis in Real Scenarios
To verify model effectiveness in real scenarios, we selected data subsets with sufficient samples from different load intervals for the analysis. Table 4, Table 5 and Table 6 and Figure 6, Figure 7 and Figure 8, respectively, show the model estimation results versus actual fitting curves under empty-load, full-load, and load-change scenarios.

Table 4.
Comparison of estimation accuracy for different models under empty-load scenario (with focus on ablation experiment).

Table 5.
Comparison of estimation accuracy for different models under full-load scenario (with a focus on ablation experiment).

Table 6.
Comparison of estimation accuracy for different models under load-change scenario (with a focus on ablation experiment).
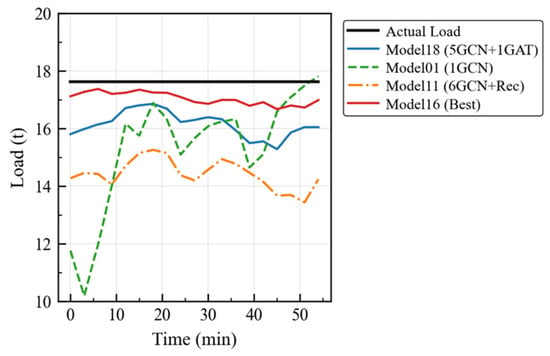
Figure 6.
Model comparison curves under empty-load scenario (with a focus on ablation experiment).
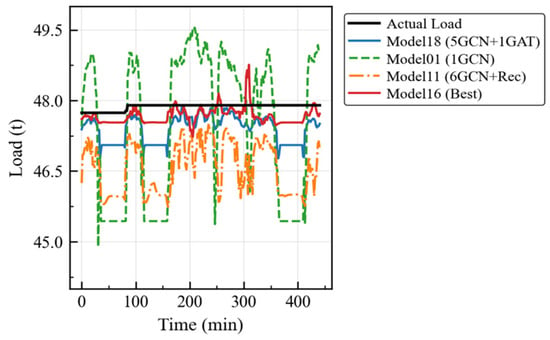
Figure 7.
Model comparison curves under full-load scenario (with a focus on ablation experiment).
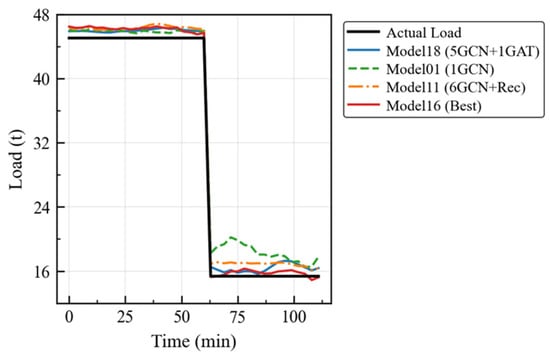
Figure 8.
Model comparison curves under load-change scenario (with a focus on ablation experiment).
The experimental results demonstrate that the optimized Model 16 maintains fitting errors within 1 t throughout all time periods under the empty-load scenario, and it also maintains similar performance under full-load conditions. Under the load-change scenario, all models can quickly adjust the estimation trends based on dynamic changes in the feature parameters.
3.3. Error Distribution Analysis
By calculating the proportion of test set samples with prediction errors below specific thresholds, we quantitatively evaluated each model’s overall fitting performance. As shown in Table 7 and Figure 9, a total of 19.62% of samples have prediction errors less than 1%, with over 90% of samples having errors less than 15%.

Table 7.
Distribution of test sample errors.
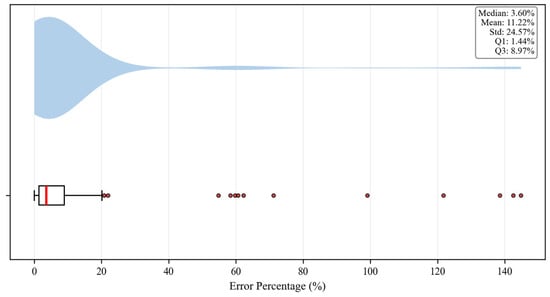
Figure 9.
Box plot of test sample error distribution.
3.4. Model Performance Comparison
We conducted a comparative analysis of SSR-HGCN against several baseline models, including traditional time-series methods (GRU, LSTM, BI-LSTM), an attention-based model (Transformer), and a standard graph neural network (GraphSAGE). As summarized in Table 8, the proposed SSR-HGCN model demonstrates state-of-the-art performance across all evaluation metrics on the complete test set.

Table 8.
Comparison of estimation accuracy for different models.
The superiority of SSR-HGCN over the time-series models, including LSTM, is particularly pronounced. While LSTM achieved an RMSE of 5106 and an MAPE of 12.37%, SSR-HGCN reduced these errors by 20.76% and 41.23%, respectively. This significant improvement stems from SSR-HGCN’s ability to move beyond simple temporal dependencies. LSTMs process features as a flat vector at each timestep and struggles to capture the complex, instantaneous physical relationships between variables like torque, acceleration, and speed. Our model’s physics-constrained heterogeneous graph, however, explicitly encodes these relationships as structural information through cross-domain edges. This provides a strong inductive bias that guides the learning process, preventing the model from making physically implausible predictions. In the full-load case (Table 9 and Figure 10), the error superiority of SSR-HGCN over time-series models has been clearly demonstrated: while the LSTM achieves an RMSE of 1647.62 and a MAPE of 3.25%, the SSR-HGCN has significantly reduced these errors to 405.09 (RMSE) and 0.73% (MAPE). The dramatic failure of the time-series models in non-standard scenarios is evident in the empty-load case (Table 10 and Figure 11), where LSTM’s MAPE skyrockets to 67.49%, whereas SSR-HGCN maintains a low 3.32% error, highlighting its robustness.

Table 9.
Comparison of estimation accuracy for different models under full-load scenario.
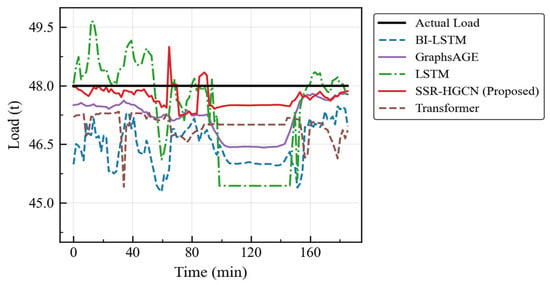
Figure 10.
Model comparison curves under full-load scenario.

Table 10.
Comparison of estimation accuracy for different models under empty-load scenario.
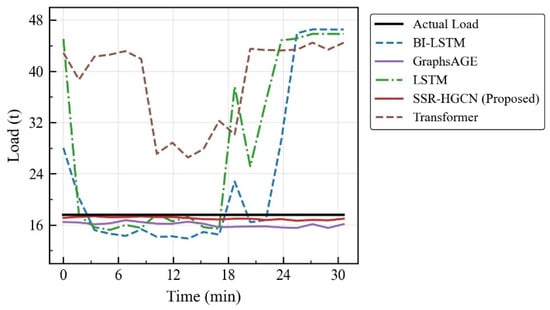
Figure 11.
Model comparison curves under empty-load scenario.
Similarly, SSR-HGCN outperforms the Transformer model, reducing RMSE by 33.21% and MAPE by 26.57%. Although the Transformer’s self-attention mechanism is powerful for capturing long-range sequential dependencies, it still lacks an explicit understanding of the underlying vehicle dynamics. It may identify spurious correlations in the time series without grounding them in physical principles. In contrast, the SSR-HGCN’s graph structure forces the model to learn representations that are consistent with the physical laws of motion, leading to better generalization and accuracy, especially in dynamic situations like the load-change scenario (Table 11 and Figure 12).

Table 11.
Comparison of estimation accuracy for different models under load-change scenario.
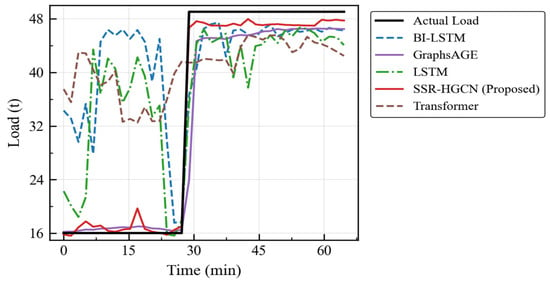
Figure 12.
Model comparison curves under load-change scenario.
The most direct comparison is with GraphSAGE, another graph-based model. SSR-HGCN reduces RMSE by 21.98% and MAPE by 7.15% relative to GraphSAGE. This advantage highlights two key innovations of our approach. First, the heterogeneous graph distinguishes between kinematic and dynamic features, allowing for more specialized and meaningful message passing compared with GraphSAGE’s homogeneous treatment of nodes. Second, and more critically, the self-supervised reconstruction module acts as a powerful regularizer. By forcing the model to reconstruct input features, it learns more robust and noise-tolerant representations. This is vital for handling the inherent noise and variability in real-world OBD data. As seen in the highly sensitive empty-load and load-change scenarios (Table 10 and Table 11), where feature signals are weaker or more volatile, GraphSAGE’s performance degrades significantly (MAPE of 8.62% and 9.64%, respectively), while SSR-HGCN remains highly accurate (MAPE of 3.32% and 4.16%, respectively). This confirms that the combination of physics-informed graph structure and self-supervised learning is critical for achieving robust, high-fidelity load estimation.
3.5. Real-Time Inference Validation
Using the RTX 3090 platform described in Section 2.8, we conducted 1000 independent forward passes on the trained SSR-HCN model. The input data corresponds to a 60 s OBD window (60 samples at 1 Hz) that yields a graph consisting of 120 nodes and 356 edges. Table 12 summarizes the latency–throughput trade-off for different batch sizes.

Table 12.
Inference performance vs. batch size.
At a batch size = 32, the per-sample latency drops to 0.18 ms, which is only 0.018% of the 1 Hz sampling period. The results confirm that SSR-HCN delivers both real-time single-sample response and high-throughput batch processing for multi-channel on-board deployments without model compression.
4. Conclusions
We addressed three key challenges in dynamic load estimation for heavy-duty vehicles: the insufficient accuracy of traditional models, the lack of interpretability, and data quality issues arising from equipment and environmental factors. Through the collection of kinematic and dynamic domain feature data from heavy-duty vehicles via OBD devices, we developed the SSR-HGCN model, which integrates graph neural networks, physical constraints, and self-supervised learning techniques. This model achieves robust physical constraints, high interpretability, and superior measurement accuracy for load assessment in dynamic driving scenarios. With 60 s of OBD data collected at 1 Hz, the model completes inference in just 0.005 s, achieving high-precision estimation with a mean absolute percentage error of 7.27%.
The key innovations include (1) a heterogeneous graph architecture that structurally encodes physical relationships between kinematic and dynamic features through cross-domain edges; (2) a self-supervised reconstruction module that enhances robustness to noisy OBD data without extensive manual labeling; and (3) a hierarchical feature extraction framework combining GCN and GAT layers for effective information aggregation across temporal and physical constraint dimensions.
Comprehensive experimental validation demonstrated that SSR-HGCN significantly outperformed traditional time-series models, achieving reductions of 20.76% in RMSE and 41.23% in MAPE over LSTM. It also outperformed the standard graph model GraphSAGE, reducing RMSE by 21.98% and MAPE by 7.15%, ultimately achieving < 15% error for over 90% of test samples. The model completed inference in 0.18 ms per sample at a batch size of 32, confirming its viability for real-time fleet monitoring applications.
4.1. Practical Implications
The SSR-HGCN framework offers substantial advantages for real-world deployment in transportation and environmental regulation. Unlike traditional weighbridge-based systems, this approach requires only standard OBD devices mandated by China’s Stage VI Heavy-Duty Vehicle Emission Standards, eliminating infrastructure costs while enabling continuous monitoring across entire highway networks. The model’s real-time computational performance supports immediate applications in fleet supervision, overloading detection, and regulatory enforcement for environmental compliance.
4.2. Limitations and Future Directions
Several limitations warrant future investigation.
Model limitations: The current model shows insufficient response capability in scenarios with changing data features. Future work could explore more complex physical constraints and temporal dependency structures to enrich graph model expressiveness and enhance the capability to capture temporal changes. Additionally, incorporating external environmental factors such as road gradients, traffic flow, and different vehicle types could further improve prediction accuracy.
Scalability considerations: Given the generality of the load estimation problem, future research should introduce state-of-the-art pre-trained models like BERT on large-scale datasets to pre-train heterogeneous graph models for improved performance. We also plan to explore multi-task learning frameworks to achieve the joint optimization of load prediction and vehicle state assessment in order to enhance model comprehensive applicability across multiple scenarios.
Data quality enhancement: While our self-supervised approach addresses some data quality issues, developing more sophisticated data cleaning and augmentation techniques could further improve model robustness, particularly for edge cases and rare events.
Author Contributions
Conceptualization, L.L., H.W., L.Z. and H.Y.; methodology, L.L. and L.Z.; software, L.L. and L.Z.; validation, L.L., H.W., Y.W. and H.Y.; formal analysis, L.L. and H.Y.; investigation, L.L., Y.W., H.W., L.Z. and H.Y.; resources, H.W., L.Z. and H.Y.; data curation, L.L., Y.W., H.W. and L.Z.; writing—original draft preparation, L.L. and L.Z.; writing—review and editing, L.L., H.W., Y.W., L.Z. and H.Y.; visualization, L.L. and L.Z.; supervision, L.Z. and H.Y.; project administration, L.Z. and H.Y.; funding acquisition, L.Z. and H.Y. All authors have read and agreed to the published version of the manuscript.
Funding
This work was supported by Open Research Fund of Key Laboratory for Vehicle Emission Control and Simulation of the Ministry of Ecology and Environment, Chinese Research Academy of Environmental Sciences (VECS2024K09), and the Fundamental Research Funds for the Central Public-interest Scientific Institution (2024YSKY-03), and the National Key R&D Program of China (Grant No. 2022YFC3701802).
Data Availability Statement
The raw data supporting the conclusions of this article will be made available by the authors on request.
Conflicts of Interest
The authors declare that they have no known competing financial interests or personal relationships that could have appeared to influence the work reported in this paper.
References
- Ministry of Transport of China. Summary of National Logistics Operation Data for the First 10 Months of 2024. China Standard News. Available online: https://www.stdaily.com/web/gdxw/2024-11/29/content_266208.html (accessed on 4 June 2025).
- Tosoongnoen, J.; Saengprachatanarug, K.; Kamwilaisak, K.; Ueno, M.; Taira, E.; Fukami, K.; Thinley, K. Strain Gauge Based Sensor for Real-Time Truck Freight Monitoring. Eng. Appl. Sci. Res. 2017, 44, 208–213. [Google Scholar]
- Nikishechkin, A.P.; Dubrovin, L.; Davydenko, V.I. Fluxgate Sensors for Onboard Weighing Systems of Heavy-Duty Dump Trucks. World Transp. Transp. 2021, 19, 167–174. [Google Scholar] [CrossRef]
- Marszalek, Z.; Duda, K.; Piwowar, P.; Stencel, M.; Zeglen, T.; Izydorczyk, J. Load Estimation of Moving Passenger Cars Using Inductive-Loop Technology. Sensors 2023, 23, 2063. [Google Scholar] [CrossRef] [PubMed]
- Torabi, S.; Wahde, M.; Hartono, P. Road Grade and Vehicle Mass Estimation for Heavy-Duty Vehicles Using Feedforward Neural Networks. In Proceedings of the 2019 4th International Conference on Intelligent Transportation Engineering (ICITE), Singapore, 20–22 September 2019; IEEE: Piscataway, NJ, USA, 2019; pp. 316–321. [Google Scholar]
- Jensen, K.M.; Santos, I.F.; Clemmensen, L.K.H.; Theodorsen, S.; Corstens, H.J. Mass Estimation of Ground Vehicles Based on Longitudinal Dynamics Using IMU and CAN-Bus Data. Mech. Syst. Signal Process. 2022, 162, 107982. [Google Scholar] [CrossRef]
- Korayem, A.H.; Khajepour, A.; Fidan, B. Trailer Mass Estimation Using System Model-Based and Machine Learning Approaches. IEEE Trans. Veh. Technol. 2020, 69, 12536–12546. [Google Scholar] [CrossRef]
- Gu, M.C.; Xiong, H.Y.; Liu, Z.J.; Luo, Q.Y.; Liu, H. Truck Load Estimation Model Integrating Multi-Head Attention Mechanism. J. Jilin Univ. (Eng. Technol. Ed.) 2023, 53, 2456–2465. [Google Scholar]
- Han, C.Y.; Su, Y.; Pei, X.; Yue, Y.; Han, X.; Tian, S.; Zhang, Y. Research on Real-Time Estimation Method of Truck Load Based on Deep Learning. China J. Highw. Transp. 2022, 35, 295–306. [Google Scholar]
- Li, B.; Jin, H.N.; Song, R.; Jin, L.J. Load Estimation Method for Heavy-Duty Trucks Based on Internet of Vehicles Big Data. Trans. Beijing Inst. Technol. (Nat. Sci. Ed.) 2024, 44, 712–721. [Google Scholar]
- Feng, M.Q.; Leung, R.Y. Application of Computer Vision for Estimation of Moving Vehicle Weight. IEEE Sens. J. 2021, 21, 11588–11597. [Google Scholar] [CrossRef]
- Yu, Y.; Cai, C.S.; Liu, Y. Probabilistic Vehicle Weight Estimation Using Physics-Constrained Generative Adversarial Network. Comput.-Aided Civ. Infrastruct. Eng. 2021, 36, 781–799. [Google Scholar] [CrossRef]
- İşbitirici, A.; Giarré, L.; Xu, W.; Falcone, P. LSTM-Based Virtual Load Sensor for Heavy-Duty Vehicles. Sensors 2024, 24, 226. [Google Scholar] [CrossRef] [PubMed]
- Pestourie, R.; Mroueh, Y.; Rackauckas, C.; Das, P.; Johnson, S.G. Physics-Enhanced Deep Surrogates for Partial Differential Equations. Nat. Mach. Intell. 2023, 5, 1458–1465. [Google Scholar] [CrossRef]
- Tian, J.; Liang, Y.; Xu, R.; Chen, P.; Guo, C.; Zhou, A.; Pan, L.; Rao, Z.; Yang, B. Air Quality Prediction with Physics-Informed Dual Neural ODEs in Open Systems. arXiv 2024, arXiv:2410.19892. [Google Scholar] [CrossRef]
- Zou, Z.; Wang, Z.; Karniadakis, G.E. Learning and Discovering Multiple Solutions Using Physics-Informed Neural Networks with Random Initialization and Deep Ensemble. arXiv 2025, arXiv:2503.06320. [Google Scholar] [CrossRef]
- Liu, T.; Meidani, H. End-to-End Heterogeneous Graph Neural Networks for Traffic Assignment. Transp. Res. Part C Emerg. Technol. 2024, 165, 104695. [Google Scholar] [CrossRef]
- Baldi, P.; Pollastri, G. The Principled Design of Large-Scale Recursive Neural Network Architectures—DAG-RNNs and the Protein Structure Prediction Problem. J. Mach. Learn. Res. 2003, 4, 575–602. [Google Scholar]
- Hinton, G.E.; Salakhutdinov, R.R. Reducing the Dimensionality of Data with Neural Networks. Science 2006, 313, 504–507. [Google Scholar] [CrossRef] [PubMed]
- Li, Y.; Yu, R.; Shahabi, C.; Liu, Y. Diffusion Convolutional Recurrent Neural Network: Data-Driven Traffic Forecasting. arXiv 2017, arXiv:1707.01926. [Google Scholar]
- Chen, C.; Chen, X.; Yang, Y.; Hang, P. Sparse Attention Graph Convolution Network for Vehicle Trajectory Prediction. IEEE Trans. Veh. Technol. 2024, in press. [CrossRef]
Disclaimer/Publisher’s Note: The statements, opinions and data contained in all publications are solely those of the individual author(s) and contributor(s) and not of MDPI and/or the editor(s). MDPI and/or the editor(s) disclaim responsibility for any injury to people or property resulting from any ideas, methods, instructions or products referred to in the content. |
© 2025 by the authors. Licensee MDPI, Basel, Switzerland. This article is an open access article distributed under the terms and conditions of the Creative Commons Attribution (CC BY) license (https://creativecommons.org/licenses/by/4.0/).