Article

Research on Broadband Oscillation Mode Identification Based on Improved Symplectic Geometry Algorithm

1
Qujing Bureau of Yunnan Province Ultra-High Voltage Transmission Company, Qujing 655000, China
2
Faculty of Power Engineering, Southwest Jiaotong University, Chengdu 610000, China
3
Faculty of Power Engineering, Kunming University of Science and Technology, Kunming 650500, China
*
Author to whom correspondence should be addressed.
Symmetry 2025, 17(10), 1650; https://doi.org/10.3390/sym17101650 (registering DOI)
Submission received: 10 July 2025 / Revised: 16 August 2025 / Accepted: 30 August 2025 / Published: 4 October 2025
(This article belongs to the Section Engineering and Materials)

Abstract

The rapid integration of renewable energy sources into modern power systems has exacerbated power quality challenges, particularly broadband oscillation phenomena that threaten grid symmetry and stability. The proposed symplectic geometric mode decomposition (SGMD) method advances the field; however, issues like mode aliasing and over-decomposition are unresolved within the symplectic geometric paradigm. To resolve these limitations in existing methods, this paper proposes a novel time-frequency-coupled symmetry mode decomposition technique. The approach first applies symplectic symmetry geometric mode in the time domain, then iteratively refines the modes using frequency-domain Local Outlier Factor (LOF) detection to suppress aliasing. Final mode integration employs Dynamic Time Warping (DTW) for optimal alignment, enabling accurate extraction of oscillation characteristics. Comparative evaluations demonstrate that the average error of the amplitude and frequency identification of the proposed method are 1.39% and 0.029%, which are lower than the results of SVD at 5.09% and 0.043%.

1. Introduction

As global fossil fuel reserves dwindle and environmental challenges like climate change intensify, renewable energy development has emerged as a critical priority worldwide [1]. Grid integration of utility-scale wind and solar PV systems induces broadband oscillation phenomena across a wide frequency range (Hz~kHz) [2]. A notable case occurred on 1 July 2015, when power system oscillations in the 20~40 Hz range caused the tripping of multiple thermal power units more than 300 km distant [3]. Given that broadband oscillations demonstrate distinct spatiotemporal propagation patterns that severely compromise grid stability, accurate modal analysis serves as a fundamental prerequisite for understanding their generation mechanisms [4].
Existing studies typically adopt either analytical [5] or numerical [6] approaches to investigate broadband oscillation influencing factors. Although widely adopted for small-system studies [7], conventional analytical methods (complex torque coefficient, state-space, and impedance analysis [8]) lack the robustness needed for modern, large-scale, renewable-rich grids. The proliferation of high-resolution broadband PMU and synchronized phasor measurement systems has enabled a fundamental transition in oscillation analysis—from reliance on physical models to data-centric techniques [9,10,11]. Owing to the time-varying nature and inherent complexity of broadband oscillations, the numerical simulation methods currently exhibit limitations in both accuracy and stability [12].
Traditional signal processing tools exhibit distinct limitations in this context. Fourier transform, despite its computational efficiency, suffers from spectral leakage and fence effects that compromise oscillation analysis [13]. While wavelet transform overcomes spectral leakage through its adjustable windowing approach, notable challenges remain: quadratic error scaling with frequency [14], and critical dependence on proper basis function initialization [15]. Unlike conventional methods, HHT combines EMD and Hilbert analysis to achieve basis-free, adaptive time-frequency decomposition [16]. However, its practical application is constrained by boundary artifacts and limited theoretical underpinnings [17]. The accuracy improvement achieved in Reference [18] via S-G filtering and total least squares comes at the cost of computational overhead, requiring multiple iterations to optimize filter duration. Recent works [19,20,21,22,23] have explored artificial intelligence techniques for broadband oscillation detection. Although these data-driven methods demonstrate enhanced accuracy when trained on substantial historical data, they remain challenged by noise sensitivity and inadequate component-level information extraction.
The Prony algorithm, while providing comprehensive time-domain parameter extraction, becomes computationally prohibitive in noisy environments due to the curse of dimensionality [24]. Current denoising techniques—including Feature mode decomposition (FMD) [25], Particle Swarm Optimization-based Variational Mode Decomposition (PSO-VMD) [26], Singular Value Decomposition (SVD) [27], Kalman filtering [28], and various hybrid methods [29,30,31]—either lack consistency or fail to adequately preserve signal integrity. Notably, while Symplectic Geometric Mode Decomposition (SGMD) [32] excels in phase space reconstruction, its noise suppression capability remains limited by unverified component independence.
A single-component symplectic geometric mode decomposition approach is developed for precise broadband oscillation analysis, coupled with Prony’s method to achieve enhanced identification accuracy. The proposed methodology follows four key steps: Firstly, signal denoising via single-component symplectic geometric mode decomposition (SC-SGMD); secondly, Prony-based identification of modal parameters (amplitude, frequency, initial phase, and damping factor) for each component; thirdly, comparative analysis using Prony processing of both original signals and signals denoised by singular value decomposition (SVD) and conventional SGMD, Lastly, validation through simulation studies and practical case analysis using operational data from Yunnan power grid.
The change in system impedance characteristics resulting from the integration of renewable energy into the power grid is a key factor contributing to broadband oscillations. The measured data utilized in this study are derived from multiple actual oscillation events recorded in the Yunnan power grid, and the observed oscillation characteristics align with the resonance modes induced by the grid connection of new energy sources. The rest of this paper is organized as follows: Section 2 introduces the Prony algorithm, Section 3 introduces single-component symplectic geometric mode decomposition, Section 4 introduces the identification process of the broadband oscillation in this paper, Section 5 and Section 6 analyze the simulation data and measured data, followed by the conclusion in Section 7.

2. Prony Algorithm

As a spectral estimation technique, Prony’s algorithm approximates signals using damped exponentials, yielding both component parameters and signal reconstruction under uniform sampling conditions.
A constant-coefficient linear difference equation is derived to characterize the underlying system behavior.
x ( n ) = k = 1 P a k x ( n k ) + k = 0 P a k e ( n k )
where e ( n ) is the fit error.
Taking error e ( n ) as the excitation of the P-order auto-regressive model x ^ ( n ) , achieving the actual signal x(n) to solve the regular equation. Hence, the parameter z k is obtained by (2) with a k .
k = 0 P a k z P k = 0
The coefficients bk are determined through least squares regression applied to the corresponding matrix formulation.
b = ( V H V ) 1 V H x ^
Final parameter estimation yields the amplitude, frequency, initial phase, and damping coefficient for each identified mode.
b k = A k e j φ k
z k = e ( α k + j 2 π f k ) Δ t

3. Symplectic Geometric Mode Decomposition and Improvement

3.1. Classic SGMD Method

In this article, the SGMD algorithm [33] is used as the denoising method before Prony modal identification. The symplectic geometric decomposition fundamentally adheres to symplectomorphism—a diffeomorphism that preserves the symplectic structure of the Hamiltonian matrix. This symmetry ensures that the eigenvalue spectrum maintains conjugate pairing properties, critical for accurate energy distribution in modal decomposition. It decomposes the original signal into several components by means of phase space geometric decomposition. Then the effective signal is reconstructed to achieve the denoising effect.
The trajectory matrix, X, is constructed according to the original sampling signal x ( n ) = x 1 , x 2 , , x n .
X = x 1 x 1 + λ x 1 + ( d 1 ) λ x 2 x 2 + λ x 2 + ( d 1 ) λ x m x m + λ x m + ( d 1 ) λ
where m = n − (d − 1), λ is the delay time, generally taken as 1, and d is the embedding dimension, which is determined by the power spectral density. If the normalized frequency f 1 = 2 π f / F s is less than 10−3, d = n/3; otherwise, d = 1.2*Fs/fkmax, in which fkmax is the maximum peak frequency of the original sampling signal x ( n ) .
The Hamilton matrix is constructed by the trajectory matrix, and there is
M = A T 0 0 A
A is the covariance matrix of the trajectory matrix, A = X T X .
By N = M 2 , the symplectic matrix, Q, is constructed, which satisfies
Q T N Q = B R 0 B T
where B is an upper triangular matrix, and the eigenvalue of B is λ 1 , λ 2 , , λ d .
The eigenvalue spectrum of matrix A, derived from its Hamiltonian structure, possesses the following inherent properties:
σ i = λ i i = 1 , 2 , , d
Accordingly, the σ 1 , σ 2 , , σ d is arranged in descending order, and the corresponding feature vector Qi, Zi = QiQiTXi. The reconstructed trajectory matrix Z = Z 1 + Z 2 + + Z d .
The single-group trajectory matrix is transformed into a set of time series by diagonal averaging, and the elements in the initial single-group trajectory matrix, Z i , are defined as zij, where 1 ≤ i ≤ d, 1 ≤ jm, d* = max(m,d), m* = max(m,d), n = m + ( d 1 ) τ .
y k = 1 k p = 1 k z p , k p + 1 , 1 k d 1 d p = 1 d z p , k p + 1 , d k m 1 n k + 1 p = k m + 1 n m + 1 z p , k p + 1 , m k n
The matrix Z i can be converted into a reconstructed signal Y i ,
Y i = [ y 1 , y 2 , , y k , , y n ]
z i j = z i j m < d z i j = z j i m d
Then directly compares the similarity and then carries out the similar component reconstruction.

3.2. Local Outlier Factor

In order to solve the mode aliasing phenomenon existing in symplectic geometric mode decomposition method, the primary challenge to be tackled is mode overlap. Building upon this foundation, a frequency domain-based local outlier factor method is proposed. This approach serves to assess whether modes overlap and subsequently determine when symplectic geometric mode decomposition should cease.
Employing density-based anomaly detection, the local outlier factor (LOF) algorithm evaluates points through local reachability density metrics. Spatial outliers are identified when a point’s local density substantially differs from its neighbors, quantified by the following anomaly measure:
r e _ d k ( a , b ) = max { d i s t k ( b ) , d ( a , b ) }
where re_dk(a,b) denotes the maximum value between the k-proximity distance of point b and the direct distance between points a and b. distk(b) represents the k-proximity distance of point b, which indicates the furthest distance to its nearest k neighboring points.
The local reachability density measure for point a is computed as follows:
l r d k ( a ) = N k ( a ) a N k ( m ) r e _ d k ( a , b )
where Nk(a) represents the set of points whose distance from point a is less than or equal to distk(b);
The LOF algorithm [34] measures the degree of anomaly value by calculating the relative density of a data point and its neighboring data points. The calculation expression is as follows:
LOF k ( b ) = a N k ( b ) l r d ( a ) / l r d ( b ) N k ( b )
If LOFk(b) is less than 1, it indicates that the data point b is located in a relatively dense area and does not belong to the abnormal point. If LOFk(b) is much larger than 1, it indicates that the data point b may belong to an abnormal point.
The set of outliers L of the mode IMFi is calculated according to Formulas (13)–(15) in the frequency domain, and then the outliers are arranged in descending order according to their amplitude. If Formula (16) is satisfied, the mode is considered to be a completely decomposed component. Otherwise, it is considered that there is an overlap, and this mode needs to be decomposed again.
A m I M F i 1 m A m I M F i 2 , I M F i { L }
where A m I M F i 1 is the amplitude of the first anomaly after descending arrangement; A m I M F i 2 is the amplitude of the second outlier after descending arrangement; and m indicates the anti-overlap parameter, which ranges from 0 to 1.
The following Figure 1 shows an example of using the LOF method to judge outliers for an amplitude-frequency signal. It can be seen from the figure that a total of outliers are selected, among which point 1 and point 3 are valid outliers, and all outliers of this component are selected, which shows the effectiveness of LOF.

3.3. Normalized Dynamic Warping Time

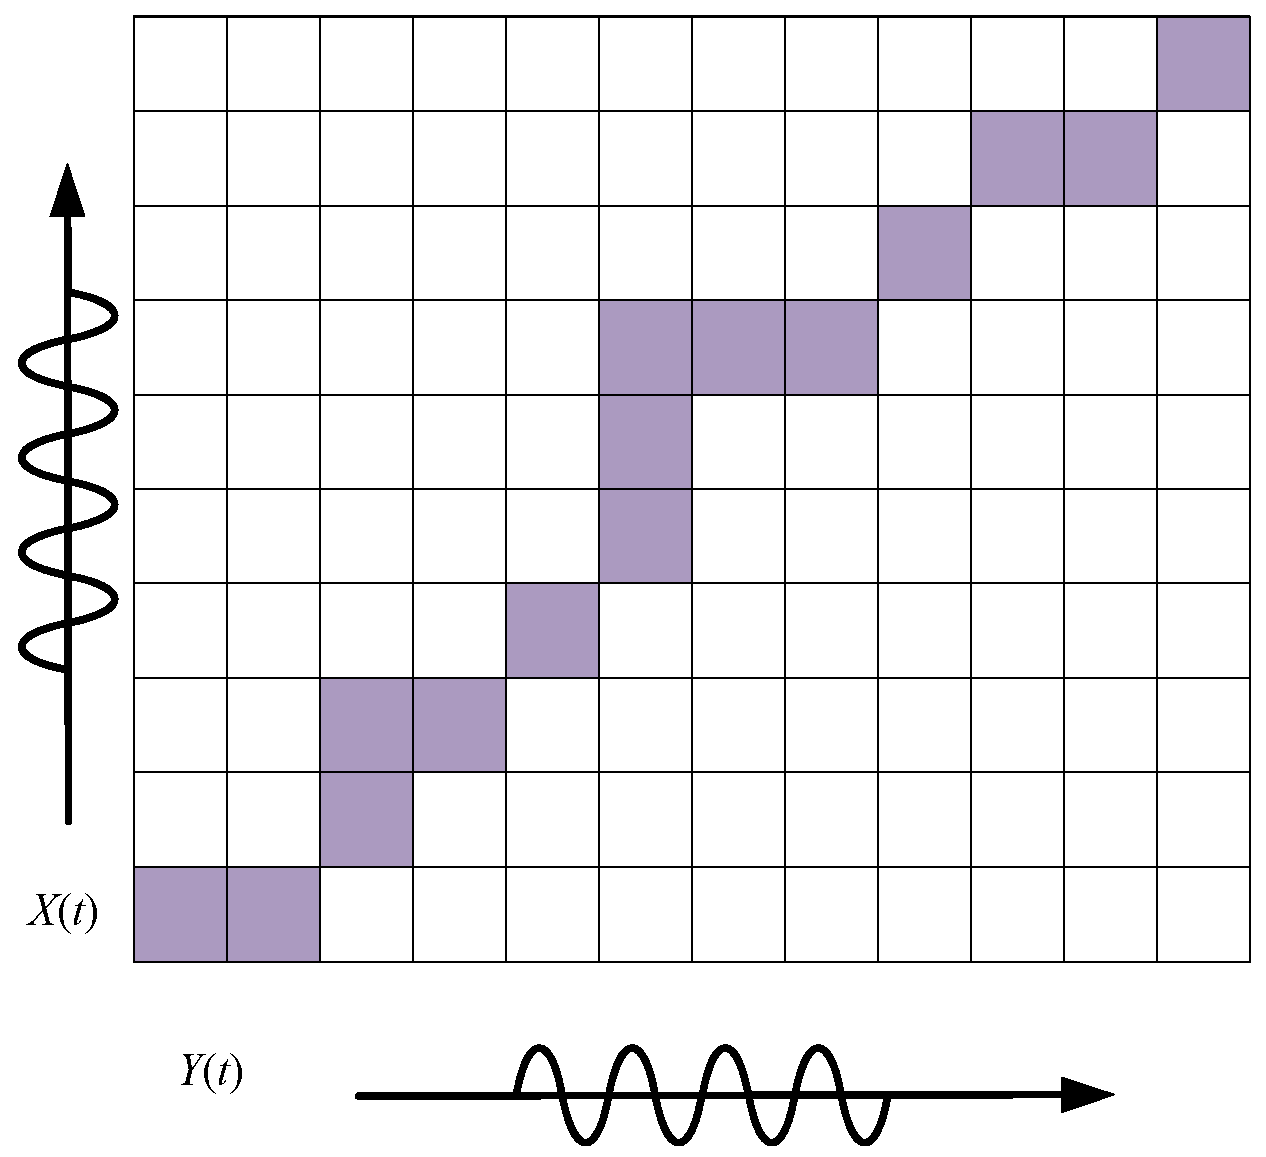
When the mode aliasing phenomenon of the symplectic geometric mode decomposition method is solved by the LOF, the mode repetition phenomenon exists in the decomposed modes, and the general similarity calculation method must have the same length and ignore the effect of phase. Therefore, the dynamic warping time method is used in this paper, which allows the phase difference between sequences of different lengths. As shown in Figure 2.
The DTW distance between sequence X = {x1,x2,…,xn} and sequence Y = {y1,y2,…,ym} is
ρ ( n , m ) = min { d ( x i , y j ) + min { ρ ( i 1 , j 1 ) , ρ ( i 1 , j ) , ρ ( i , j 1 ) } }
where ρ ( n , m ) is the cumulative distance from (1,1) to (n,m), and d(xi,yi) is the distance between xi and yi;
In order to eliminate the influence of sequence amplitude and number on DTW value, this paper adopts a normalized DTW value, which is more convenient to unify the threshold value in Figure 3.
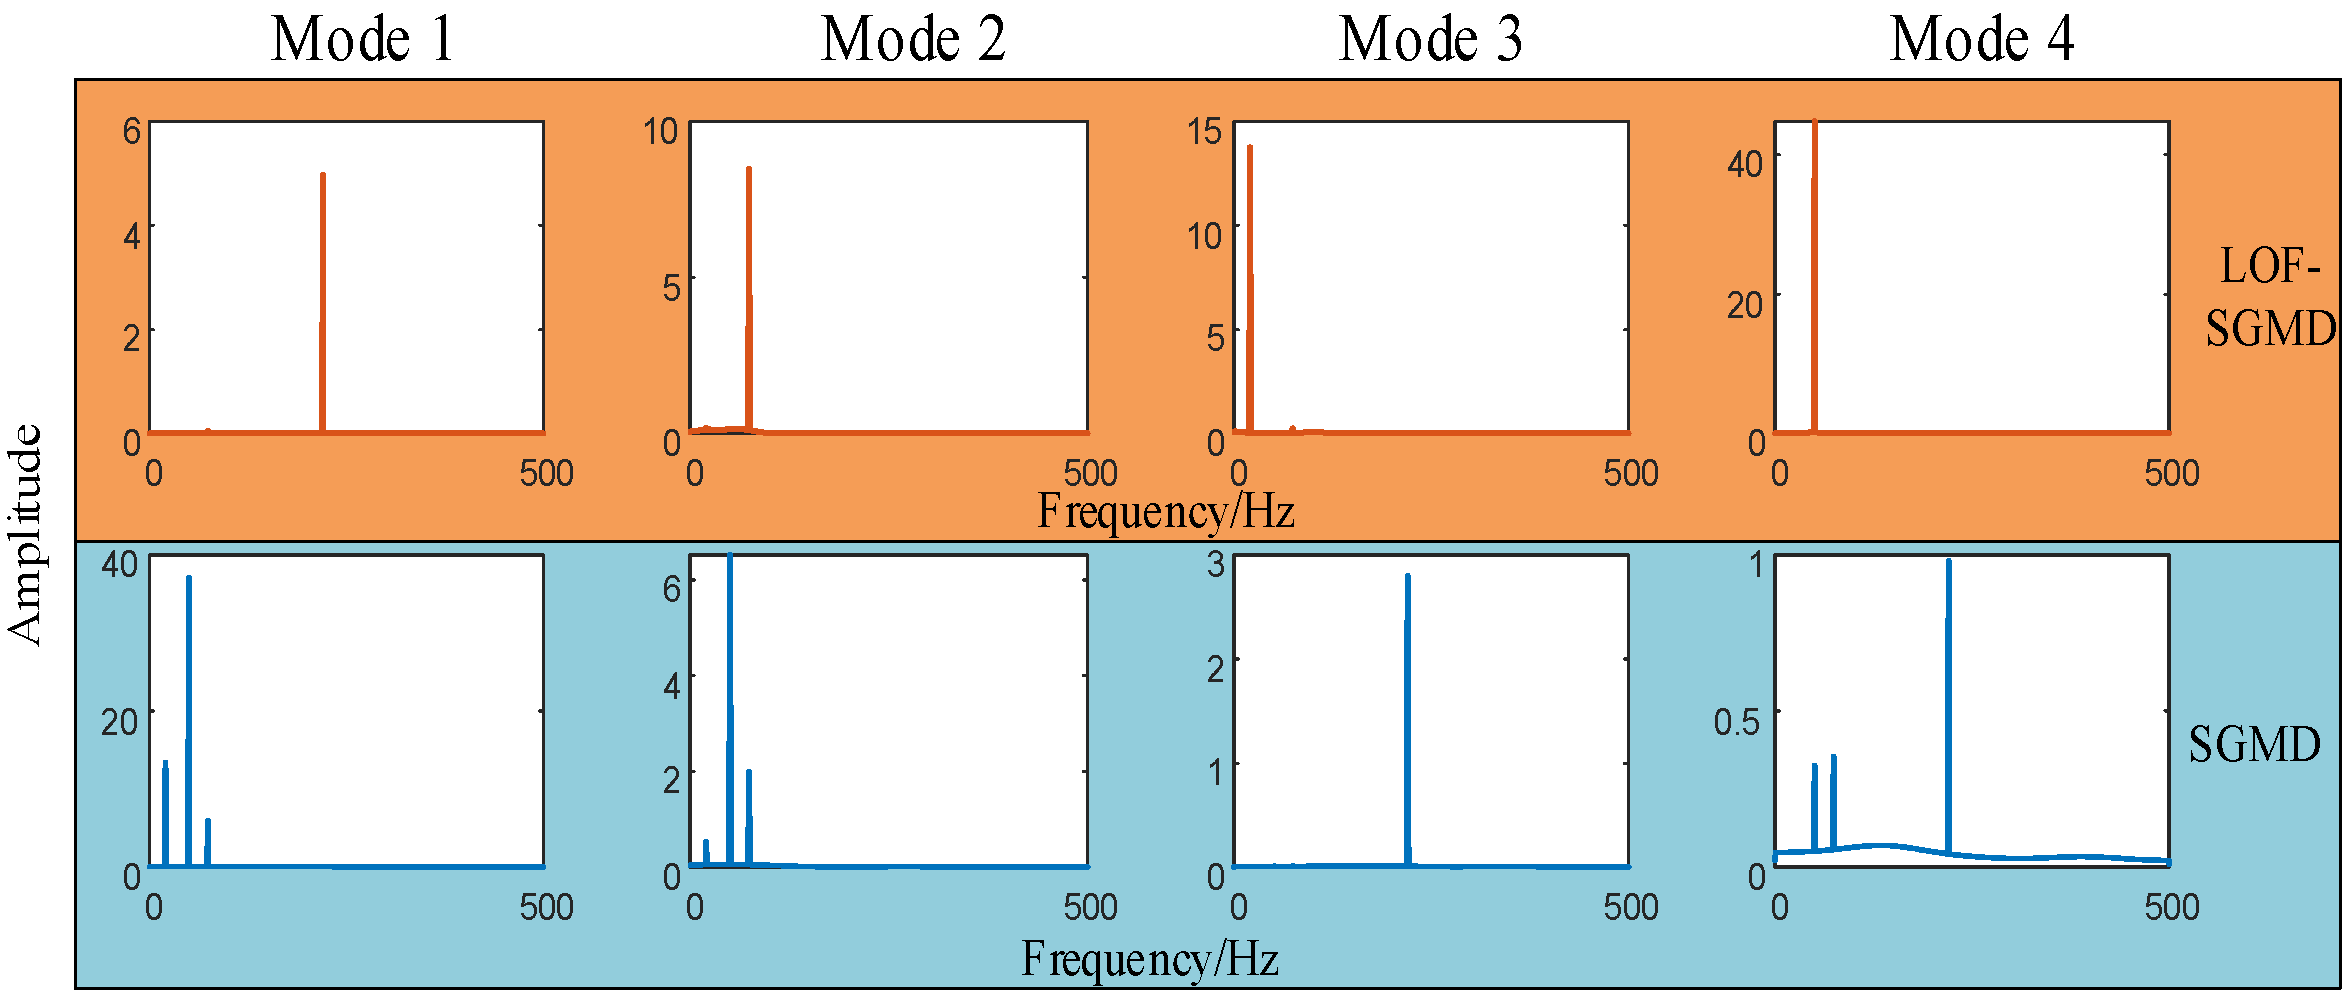
From Figure 3, it is readily ascertainable that mode aliasing is present in the decomposition outcomes of the SGMD. Nonetheless, the enhanced SGMD method, which integrates time-frequency domain data and is delineated within the confines of this treatise, is capable of mitigating mode aliasing and facilitating efficacious separation of the constituent components.

4. Broadband Oscillation Mode Identification Algorithm Flow

While white noise dominates power system interference, symplectic decomposition of individual components reveals that low-frequency harmonics constitute the principal signal elements, exhibiting substantial amplitudes with negligible noise contamination. The detection of higher-order harmonics in medium-to-high frequency bands is challenging due to their inherently small amplitudes and increased susceptibility to noise contamination. The preceding analysis reveals that medium- and high-frequency modal components contribute minimally to broadband oscillation signal accuracy due to their limited effective signal content. Furthermore, the pronounced noise presence in high-frequency modes leads to excessive order determination in Prony analysis. Consequently, these frequency components can be effectively characterized as noise-dominated elements.
The conventional Prony algorithm exhibits significant limitations in identification accuracy and computational performance under noisy conditions, particularly demonstrating inadequate signal fitting capability for low signal-to-noise ratio (SNR) scenarios. These deficiencies impair the precise characterization of signal parameters. To address these challenges, this study proposes a novel hybrid approach combining single-component symplectic geometric decomposition denoising with Prony analysis for enhanced broadband oscillation signal processing. The methodological workflow comprises the following steps, and the following are shown in Figure 4:
(1)
The modal separation of the original signal is carried out by the symplectic geometric mode decomposition method, and the modal quantities are obtained.
(2)
Consequently, the frequency domain attributes of each decomposition mode are evaluated utilizing the local outlier factor. If Equation (16) is not satisfied, repeat step (1). Otherwise, it is regarded as complete decomposition.
(3)
Using dynamic warping time to compare the similarity of the component obtained from step (2) to obtain the real harmonic component.
(4)
The real harmonic component is reconstructed, and the reconstructed signal is identified by the Prony algorithm to obtain the amplitude, frequency, initial phase, and damping factor of the signal.
Figure 4. Flow chart of single-component symplectic geometry.
Symmetry 17 01650 g004

5. Example Analysis

To validate the signal identification capability of the proposed algorithm, this paper constructs an ideal test signal [35] defined by Equation (18).
y = 14 e 0.13 t cos ( 2 π 12 t 0.25 π ) + 45 e 0.02 t cos ( 2 π 50 t + 0.25 π ) + 9 e 0.03 t cos ( 2 π 88 t + 0.3 π )
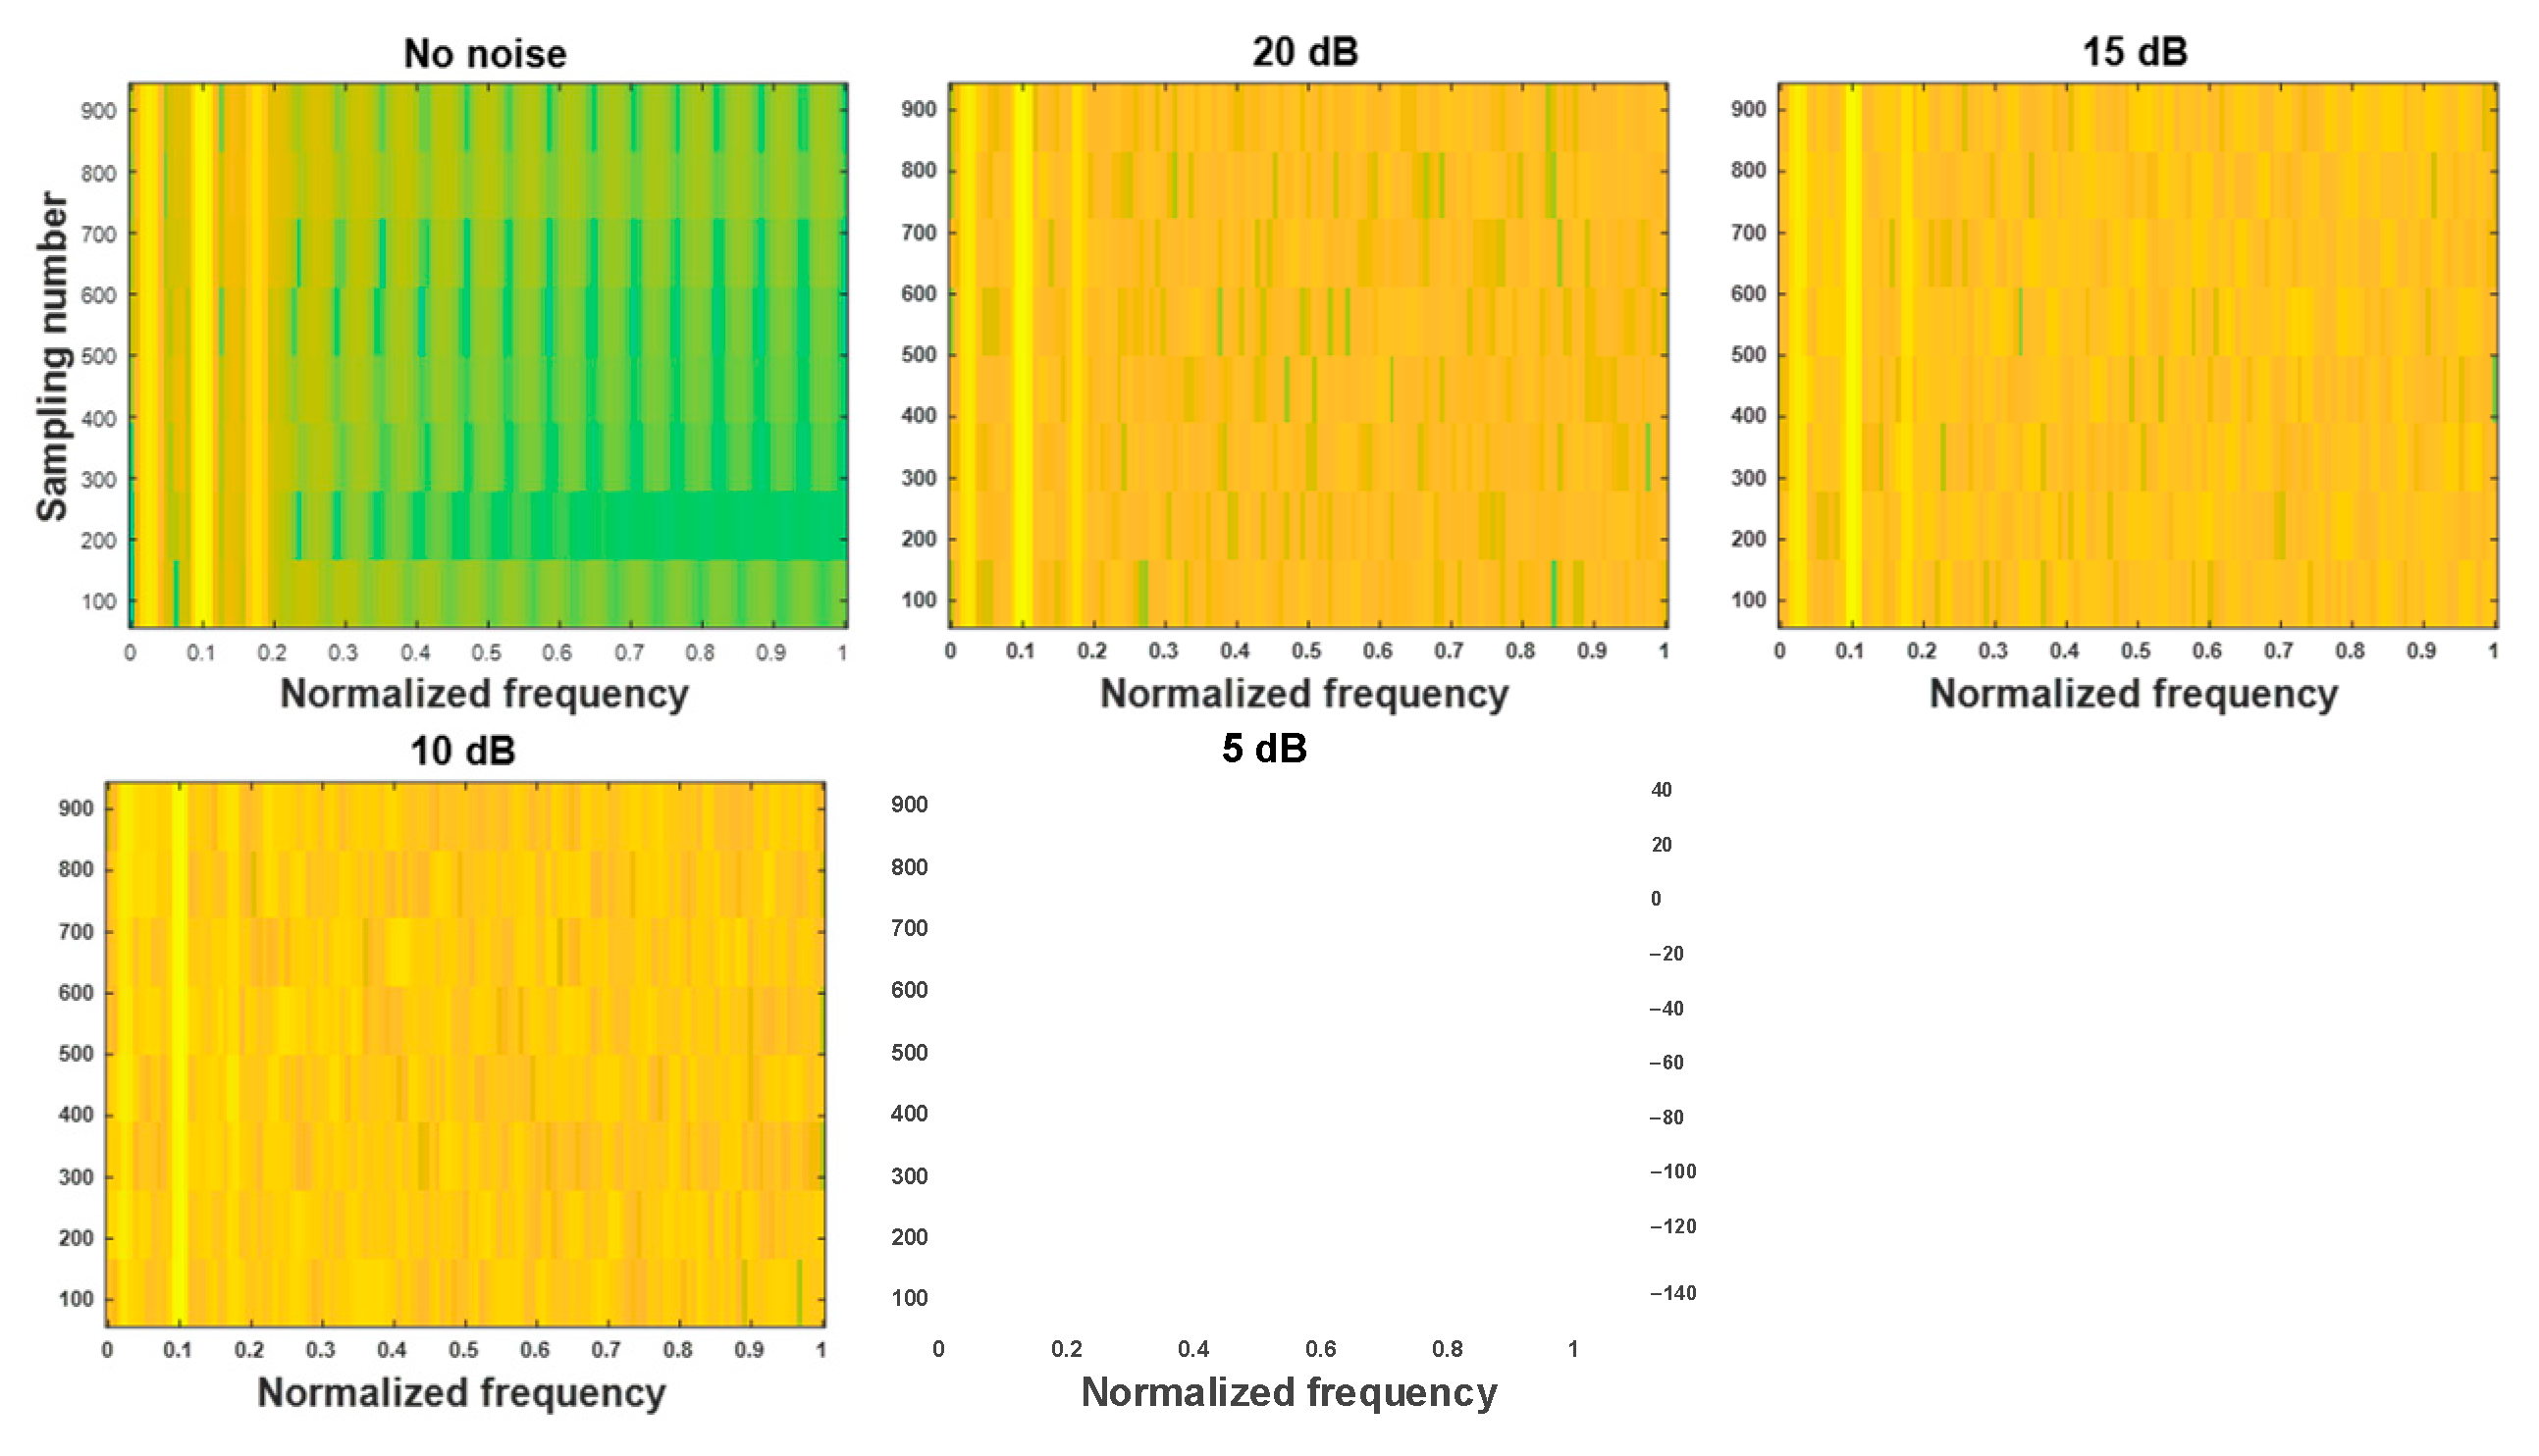
In order to explore the influence of noise on the component information more clearly, spectral graphs of the ideal signal and noisy signal with different noise content are shown in Figure 5. The overlap between the modal component and the background noise increases with the increase of added noise content. The component with weak initial energy is apt to be overlapped. It is difficult to extract the component information directly, so it is important to denoise before extracting the information. In this paper, m in LOF chooses 0.1, and k in LOF chooses 4.

5.1. Denoising Performance Analysis of Example Signal

To evaluate the denoising performance of the proposed method, this paper employs three quantitative metrics: signal-to-noise ratio (SNR), root mean square error (RMSE), and normalized cross-correlation coefficient (NCC). The RMSE quantifies the residual error between the denoised and ideal signals, while the NCC measures their waveform similarity.
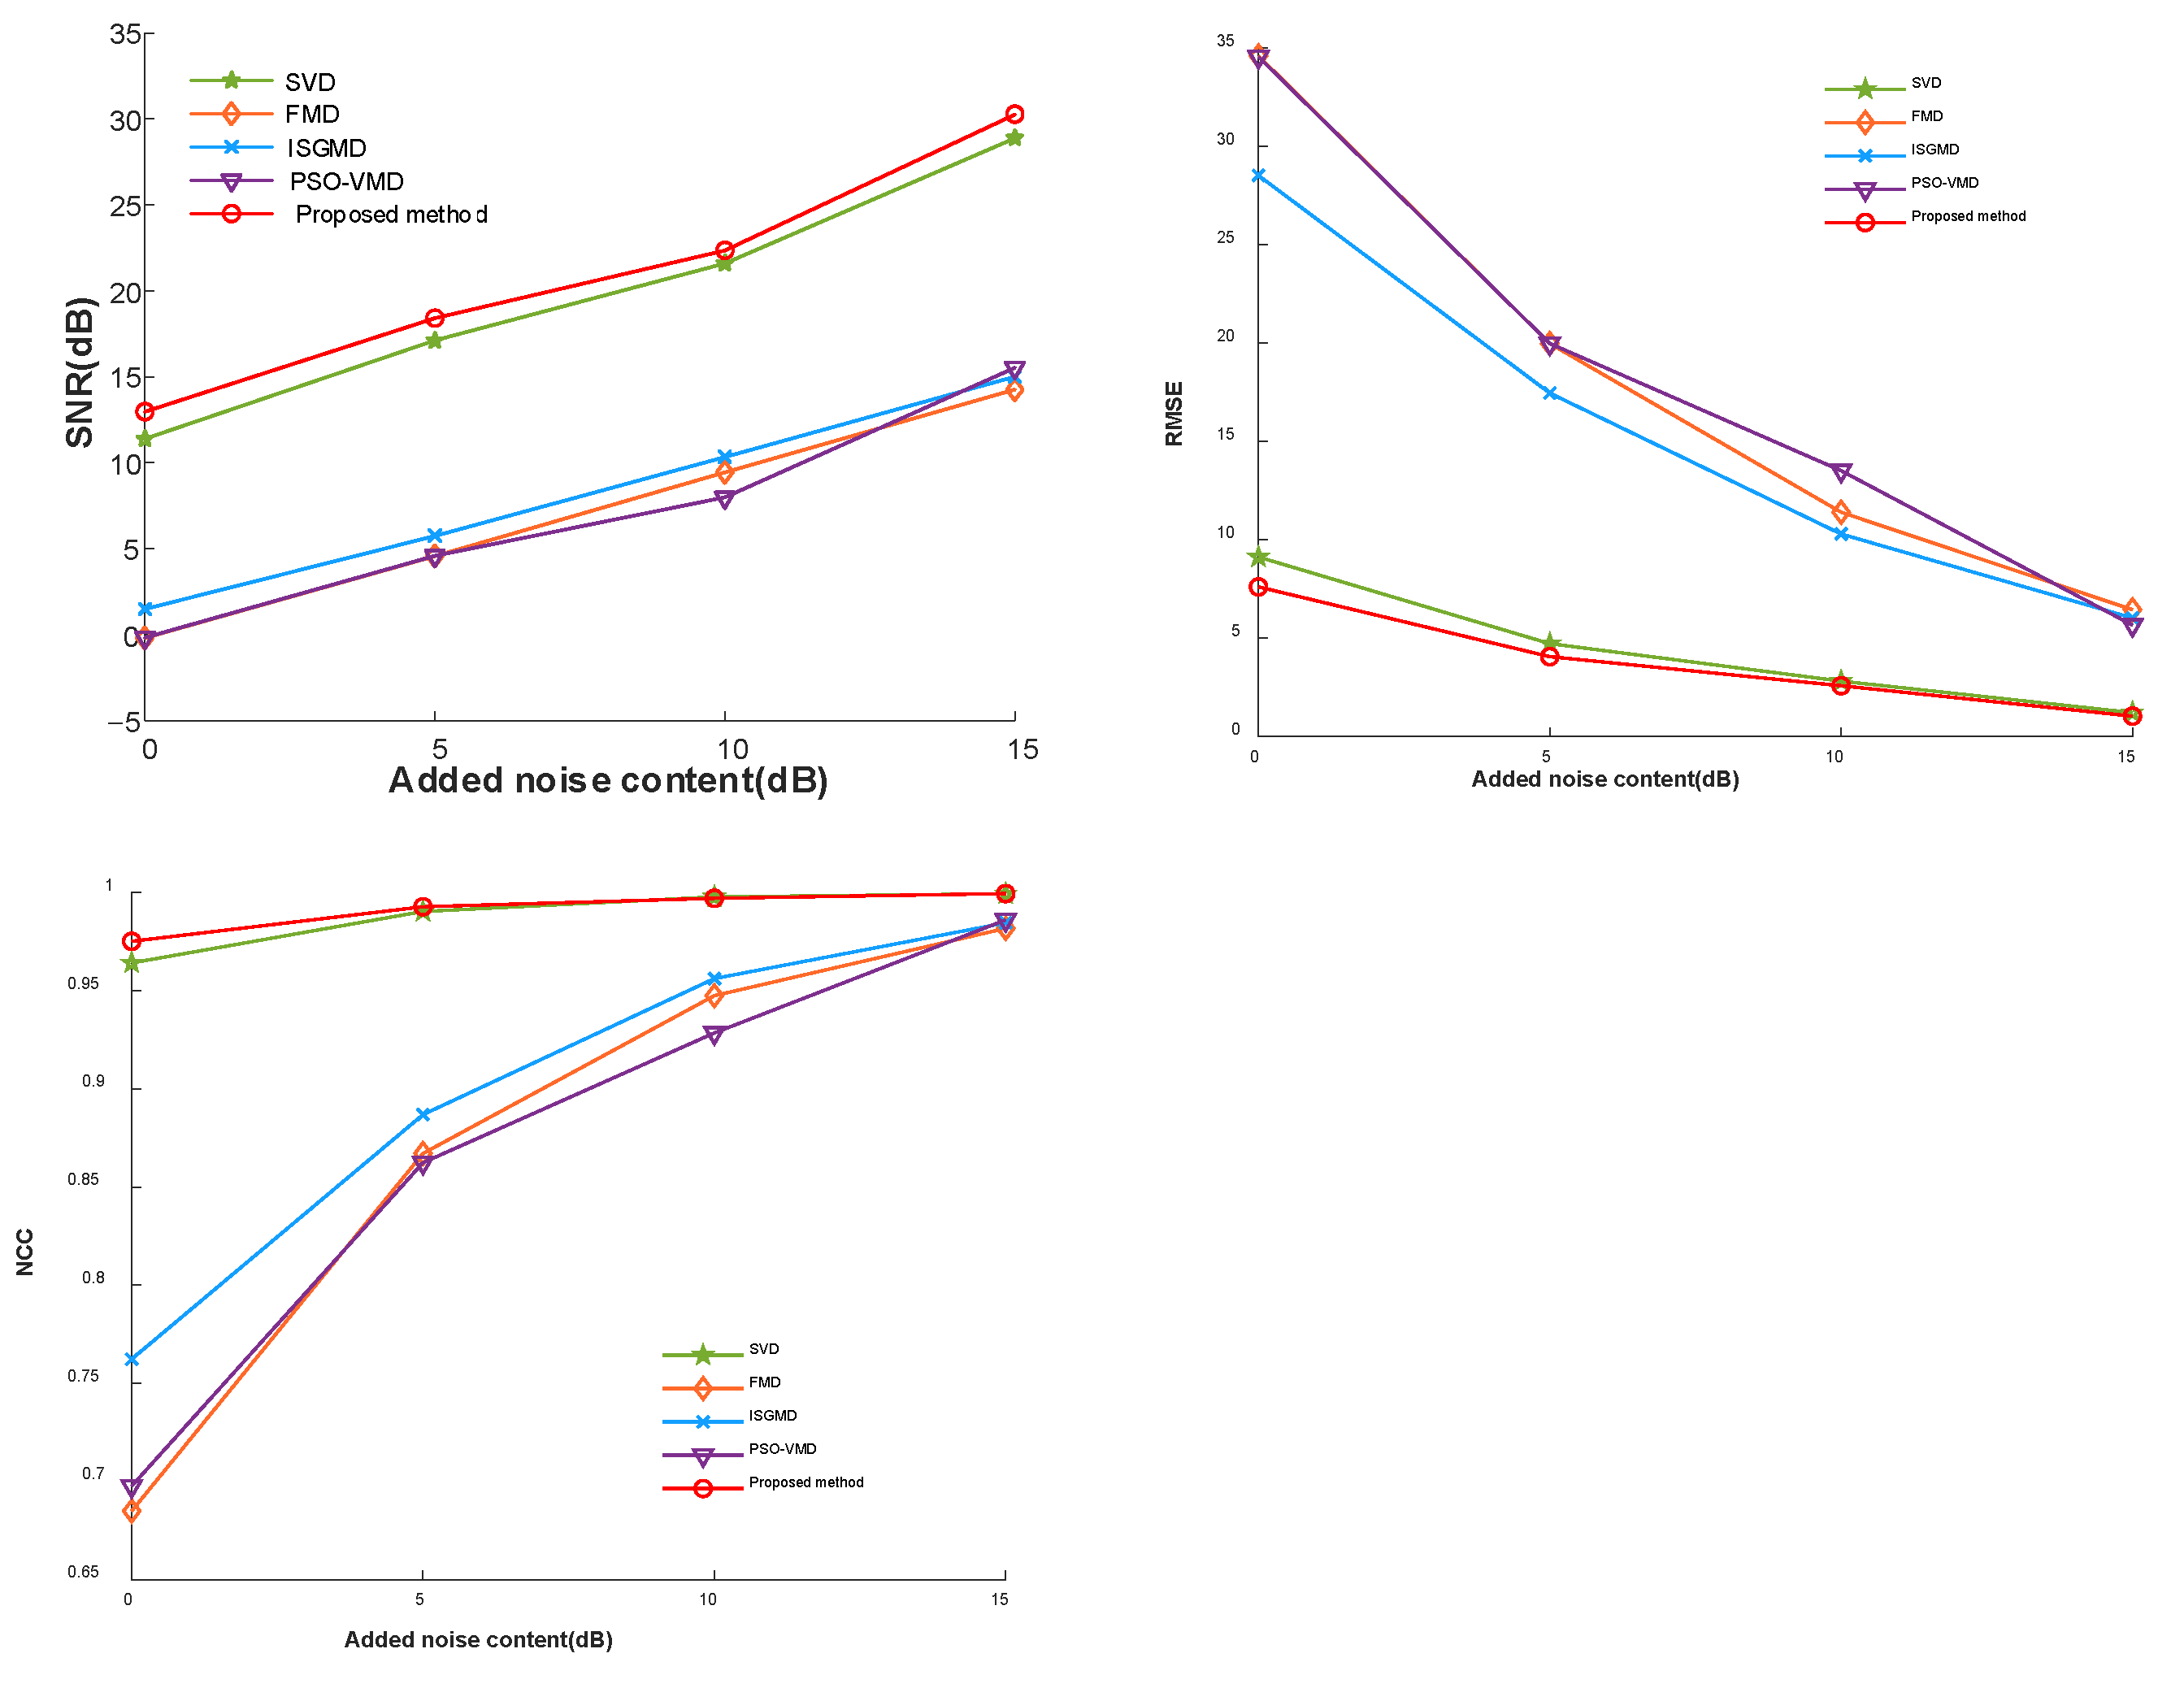
In this paper, SVD, ISGMD, PSO-VMD, and the proposed methods are, respectively, used to denoise the white Gaussian noise with different content. Three evaluation indices—SNR, NCC, and RMSE—are, respectively, used to evaluate the denoising results. The comparison results of different indices are shown in Figure 6, and all the denoising results are shown in Table 1.
Figure 6 intuitively demonstrates that the proposed method achieves the highest SNR value, the lowest RMSE value, and an NCC value closest to 1 under varying noise levels. These three evaluation indices indicate that the proposed method has superior denoising capabilities. The denoising effect of the proposed method is comparable to that of SVD, whereas FMD, PSO-VMD, and ISGMD exhibit similar denoising effects. Furthermore, it is evident from Figure 5 that the denoising performance of the proposed method surpasses that of ISGMD across all three evaluation indicators. This highlights the significant improvement achieved by our proposed structural enhancement-based ISGMD combined with DTW.
The denoising effect of the proposed method in this paper is nearly twice the noise level, as shown in Table 1. The denoising performance of FMD is closely related to the quantity and length of filters, leading to instability in its denoising effect. PSO-VMD and ISGMD exhibit similar denoising effects, but the running time of PSO-VMD is influenced by the number of iterations and population size.
Through analysis, it can be known that the computational complexity of the method proposed in this paper is O(Nd2), where N represents the signal length and d represents the embedding dimension, generally d<<N in practical applications. The computational complexity of SVD + Prony is O(N3), which shows that the algorithm proposed in this paper is more efficient than SVD + Prony. For instance, with 30 iterations, a population size of 20, and a noise level of 5 dB, the running times for SVD, FMD, ISGMD, and PSO-VMD are recorded at 25, 16, 19, and 1921 s. In contrast, the proposed method demonstrates a significantly reduced running time of just 21 s, thereby enhancing its real-time performance.

5.2. Detection Performance Analysis of Example Signal

A benchmark comparison evaluates the proposed method against SVD, FMD, ISGMD, and PSO-VMD reconstructions through Prony-based signal fitting and pattern recognition metrics. The fitting effects of different noise contents are shown in Figure 7.
The fitting effect increases with the rise in fitting order for data with varying noise content, as illustrated in Figure 7. Notably, the proposed method and SVD exhibit the most favorable fitting effect, consistent with the observation in Figure 6. Moreover, when the fitting order reaches a certain level, FMD, ISGMD, and PSO-VMD methods demonstrate higher fitting SNR than before Prony is applied, indicating that Prony can enhance data quality and improve final identification parameter accuracy. The fitting effect is stable when the fitting order reaches 25. Among the four different noise contents, the fitting effect of the proposed method is optimal.
Then, the specific recognition results of the proposed method and the SVD + Prony method are analyzed.
Afterwards, the original signal with 15 dB Gaussian white noise using SVD + Prony and the method proposed in this paper are compared in Table 2.
In the same model order p = 25, the fitting SNR of this work and the SVD + Prony method are stable. The different evaluation results obtained by Prony analysis of the two signals are shown in Table 2. It can be seen that the fitting SNR of the reconstructed signal by the method proposed in this paper is 31.3593 dB. Under the condition that the order of the model is 25, the results after denoising by the proposed method and SVD denoising are identified. The identification results of each parameter are shown in Table 3.
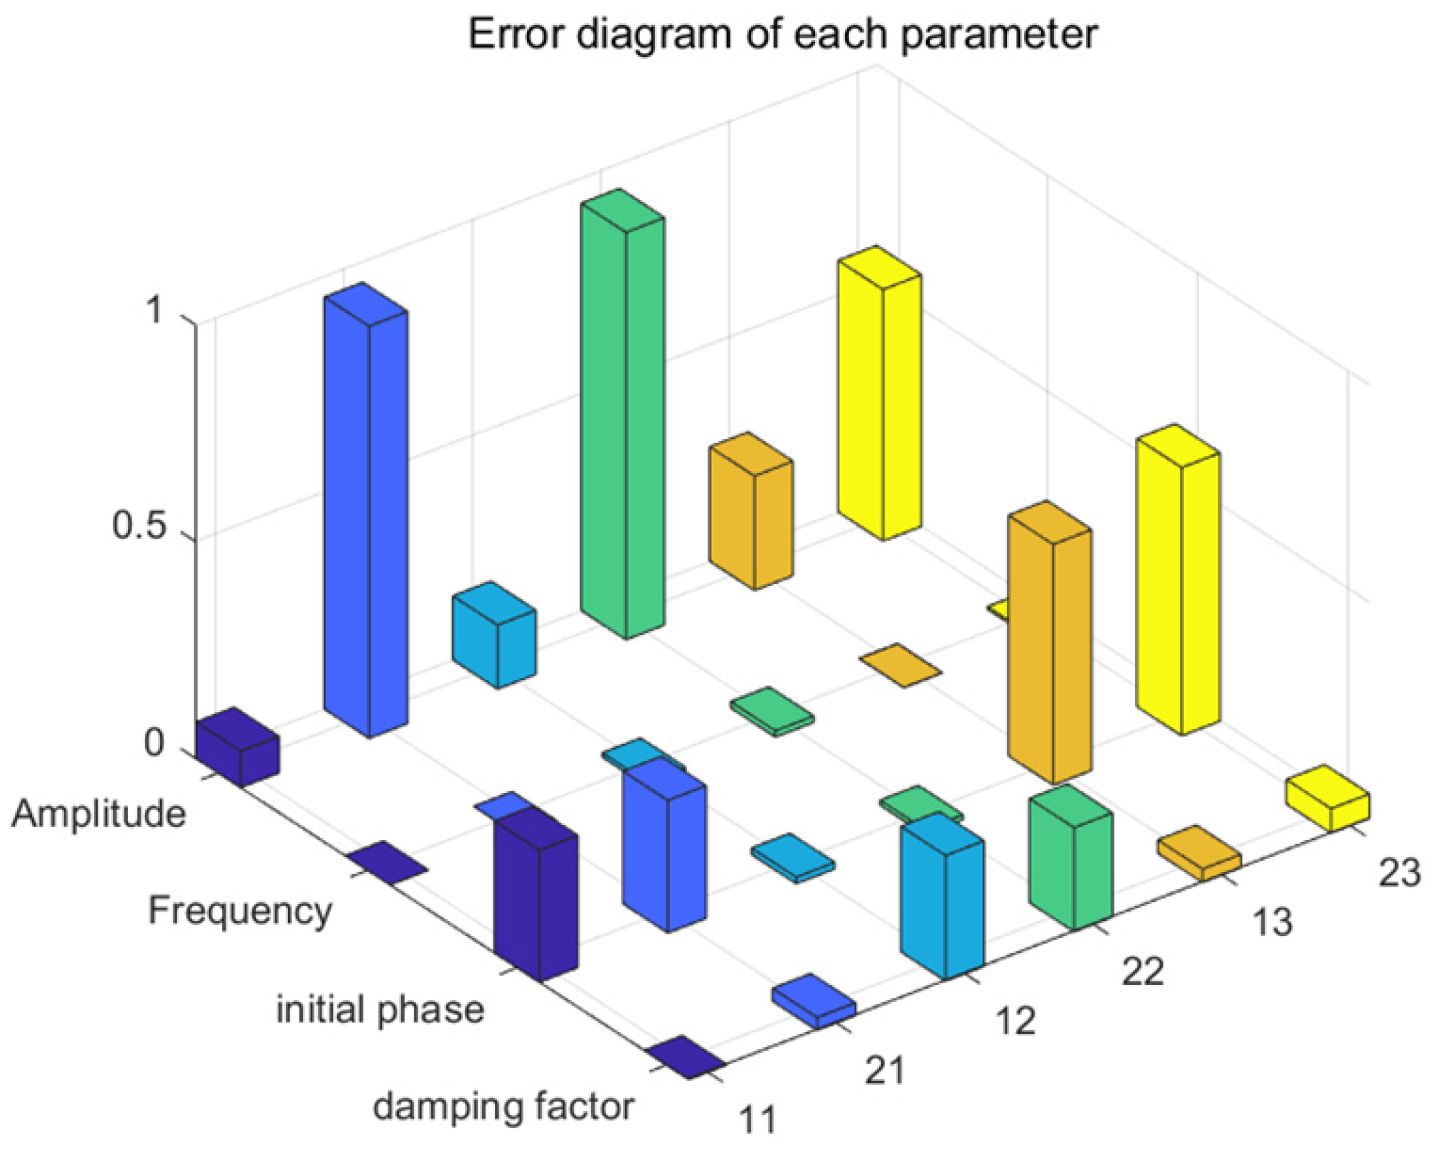
It can be seen from Table 3 that the average error of the amplitude identification of the proposed method is 1.39% and the average identification error of the frequency is 0.029%. The average error of amplitude identification of SVD + Prony is 5.09%, and the average error of frequency identification is 0.043%. It can be concluded that the identification results of the proposed method in frequency and amplitude are more accurate than those of SVD + Prony. The identification error results of each parameter of the two methods are shown in Figure 8.
In Figure 8, the 11 of the abscissa corresponds to the error of each parameter of the modal 1 of single component symplectic geometric mode decomposition combined with Prony in Table 3. The 21 of the abscissa corresponds to the error of each parameter of the modal 1 of SVD + Prony in Table 3, and others are similar. It can be seen from Figure 8 that the identification error of frequency is minimal, and the identification error of the damping factor is maximal. Among the fitting errors of the four parameters, the error of the proposed method is obviously smaller than that of SVD + Prony.
From the comprehensive simulation study of broadband oscillations, this paper derives the following critical conclusions:
The time-domain-based Prony algorithm provides comprehensive signal characterization, extracting not only spectral parameters (frequency and amplitude) comparable to FFT analysis, but also crucial time-domain features, including damping factors.
The proposed method presented in this paper significantly enhances the de-noising and separation effects of ISGMD by modifying the algorithm structure and integrating it with DTW, as illustrated in Figure 6 and Figure 7. Furthermore, the accuracy and superiority of the proposed method for parameter identification combined with Prony are demonstrated, as shown in Figure 8.
The denoising and the fitting effect of the method proposed in this paper are superior to the SVD in the simulation signal. The comprehensive evaluation shows that compared with the traditional Prony algorithm and the algorithm based on SVD denoising, this method has more advantages in harmonic identification accuracy.

6. Measurement Analysis

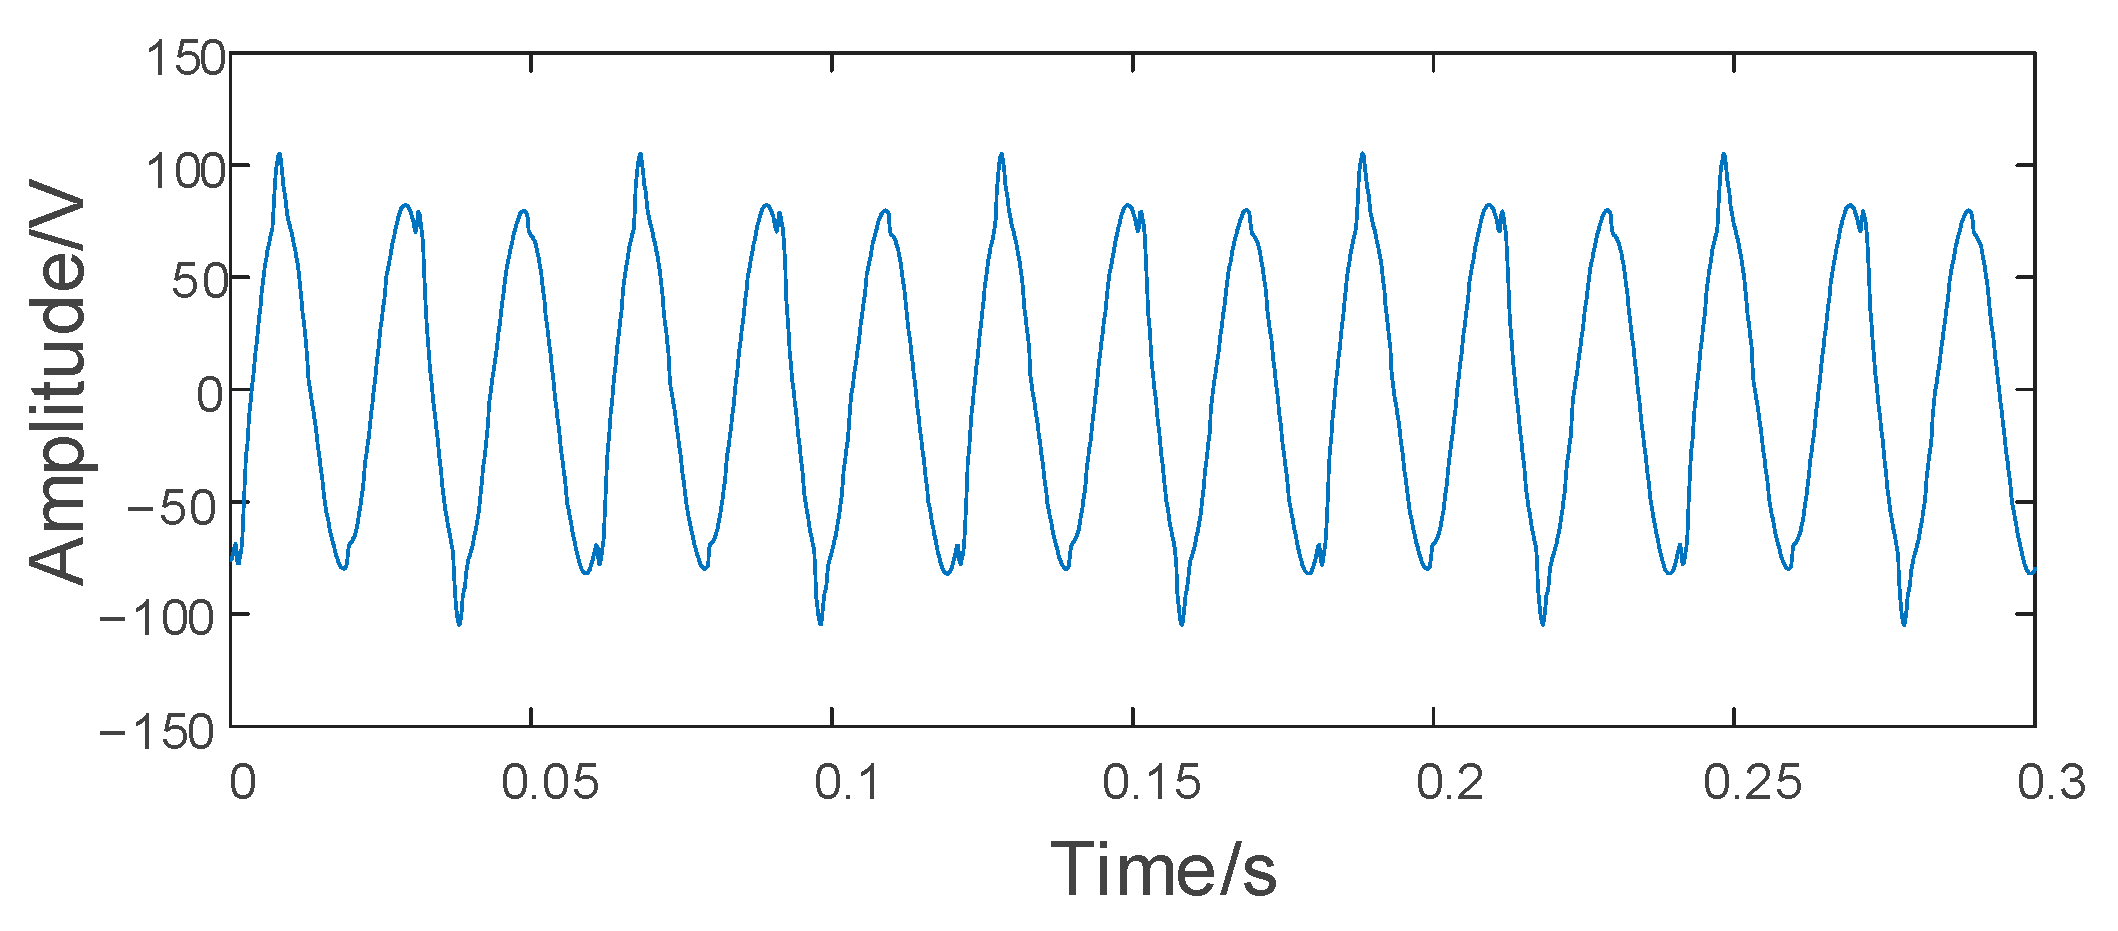
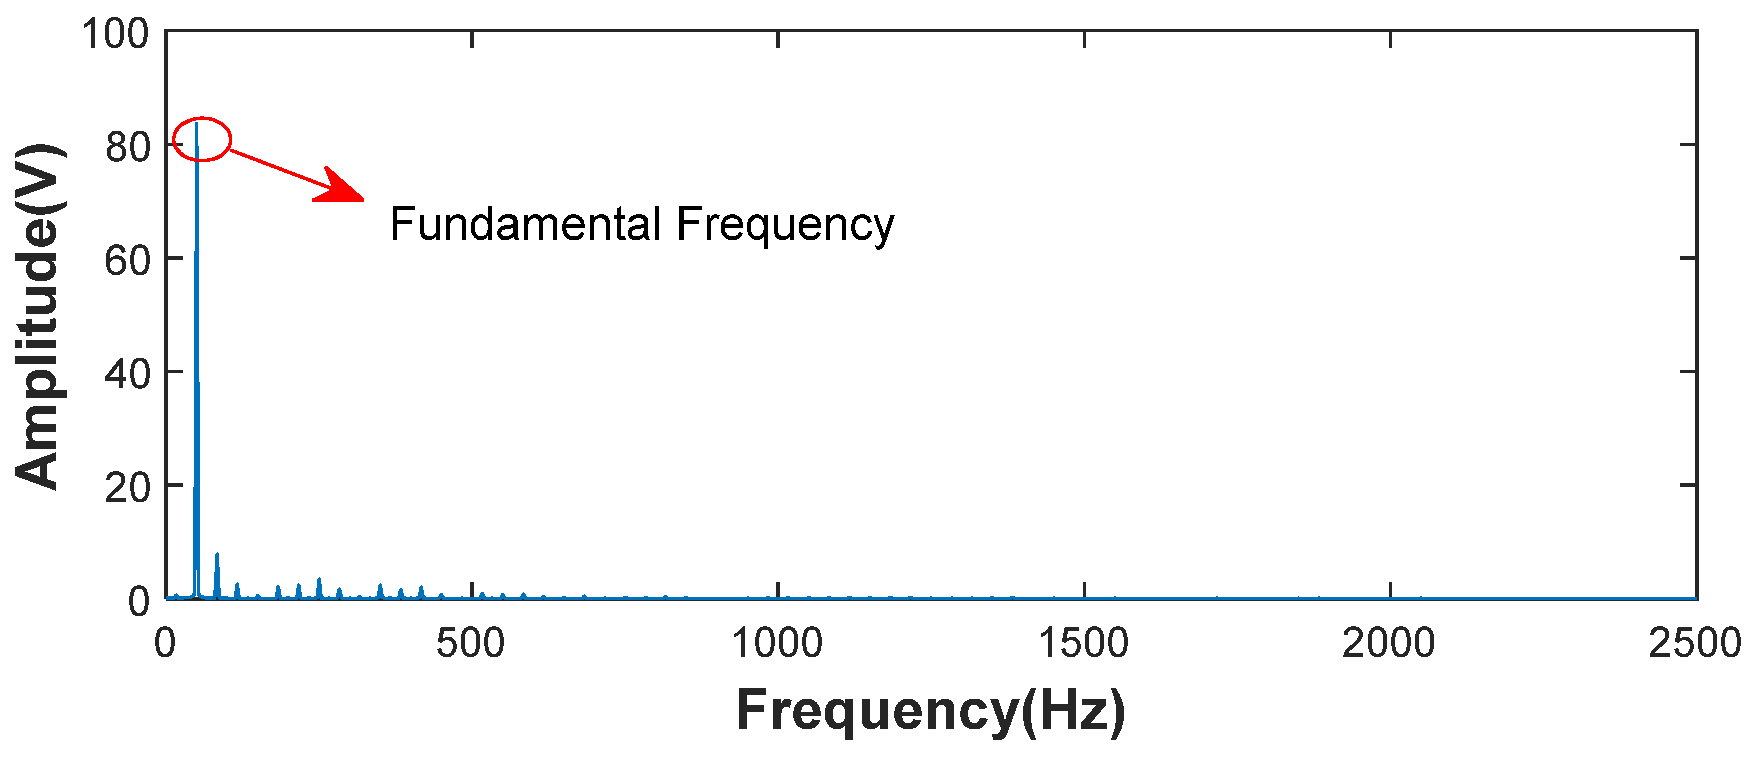
In order to further verify the superiority of the proposed algorithm, this paper uses a set of measured broadband oscillation data in the Yunnan power grid for analysis. From 2019 to 2023, several broadband oscillation events occurred in a certain area of the Yunnan power grid. Taking one of the broadband oscillation events as an example, this paper uses the method to analyze the oscillation mode of the broadband oscillation data, and compares it with other methods. The sampling frequency is 5000 Hz, the sampling number is 1500, and the FFT analysis is carried out first. The signal waveform and FFT analysis results are shown in Figure 9 and Figure 10.
According to the FFT analysis results, the oscillation mode components in the signal are basically in the frequency band near 500 Hz or less, and the distribution is more complex. Compared with the decomposition results of the simulation signal, the spectrum range of the measured signal is wider. In other words, there will be more complex effective components and noise content.
According to Fourier identification results, the amplitude and frequency information of major components are shown in Table 4.

6.1. Denoising Performance Analysis of Measurement Signal

Since the components of the measured signal are more complex, this paper only analyzes the effective component to ensure the accuracy in this paper according to Table 4. This way, the decomposition results are obtained.
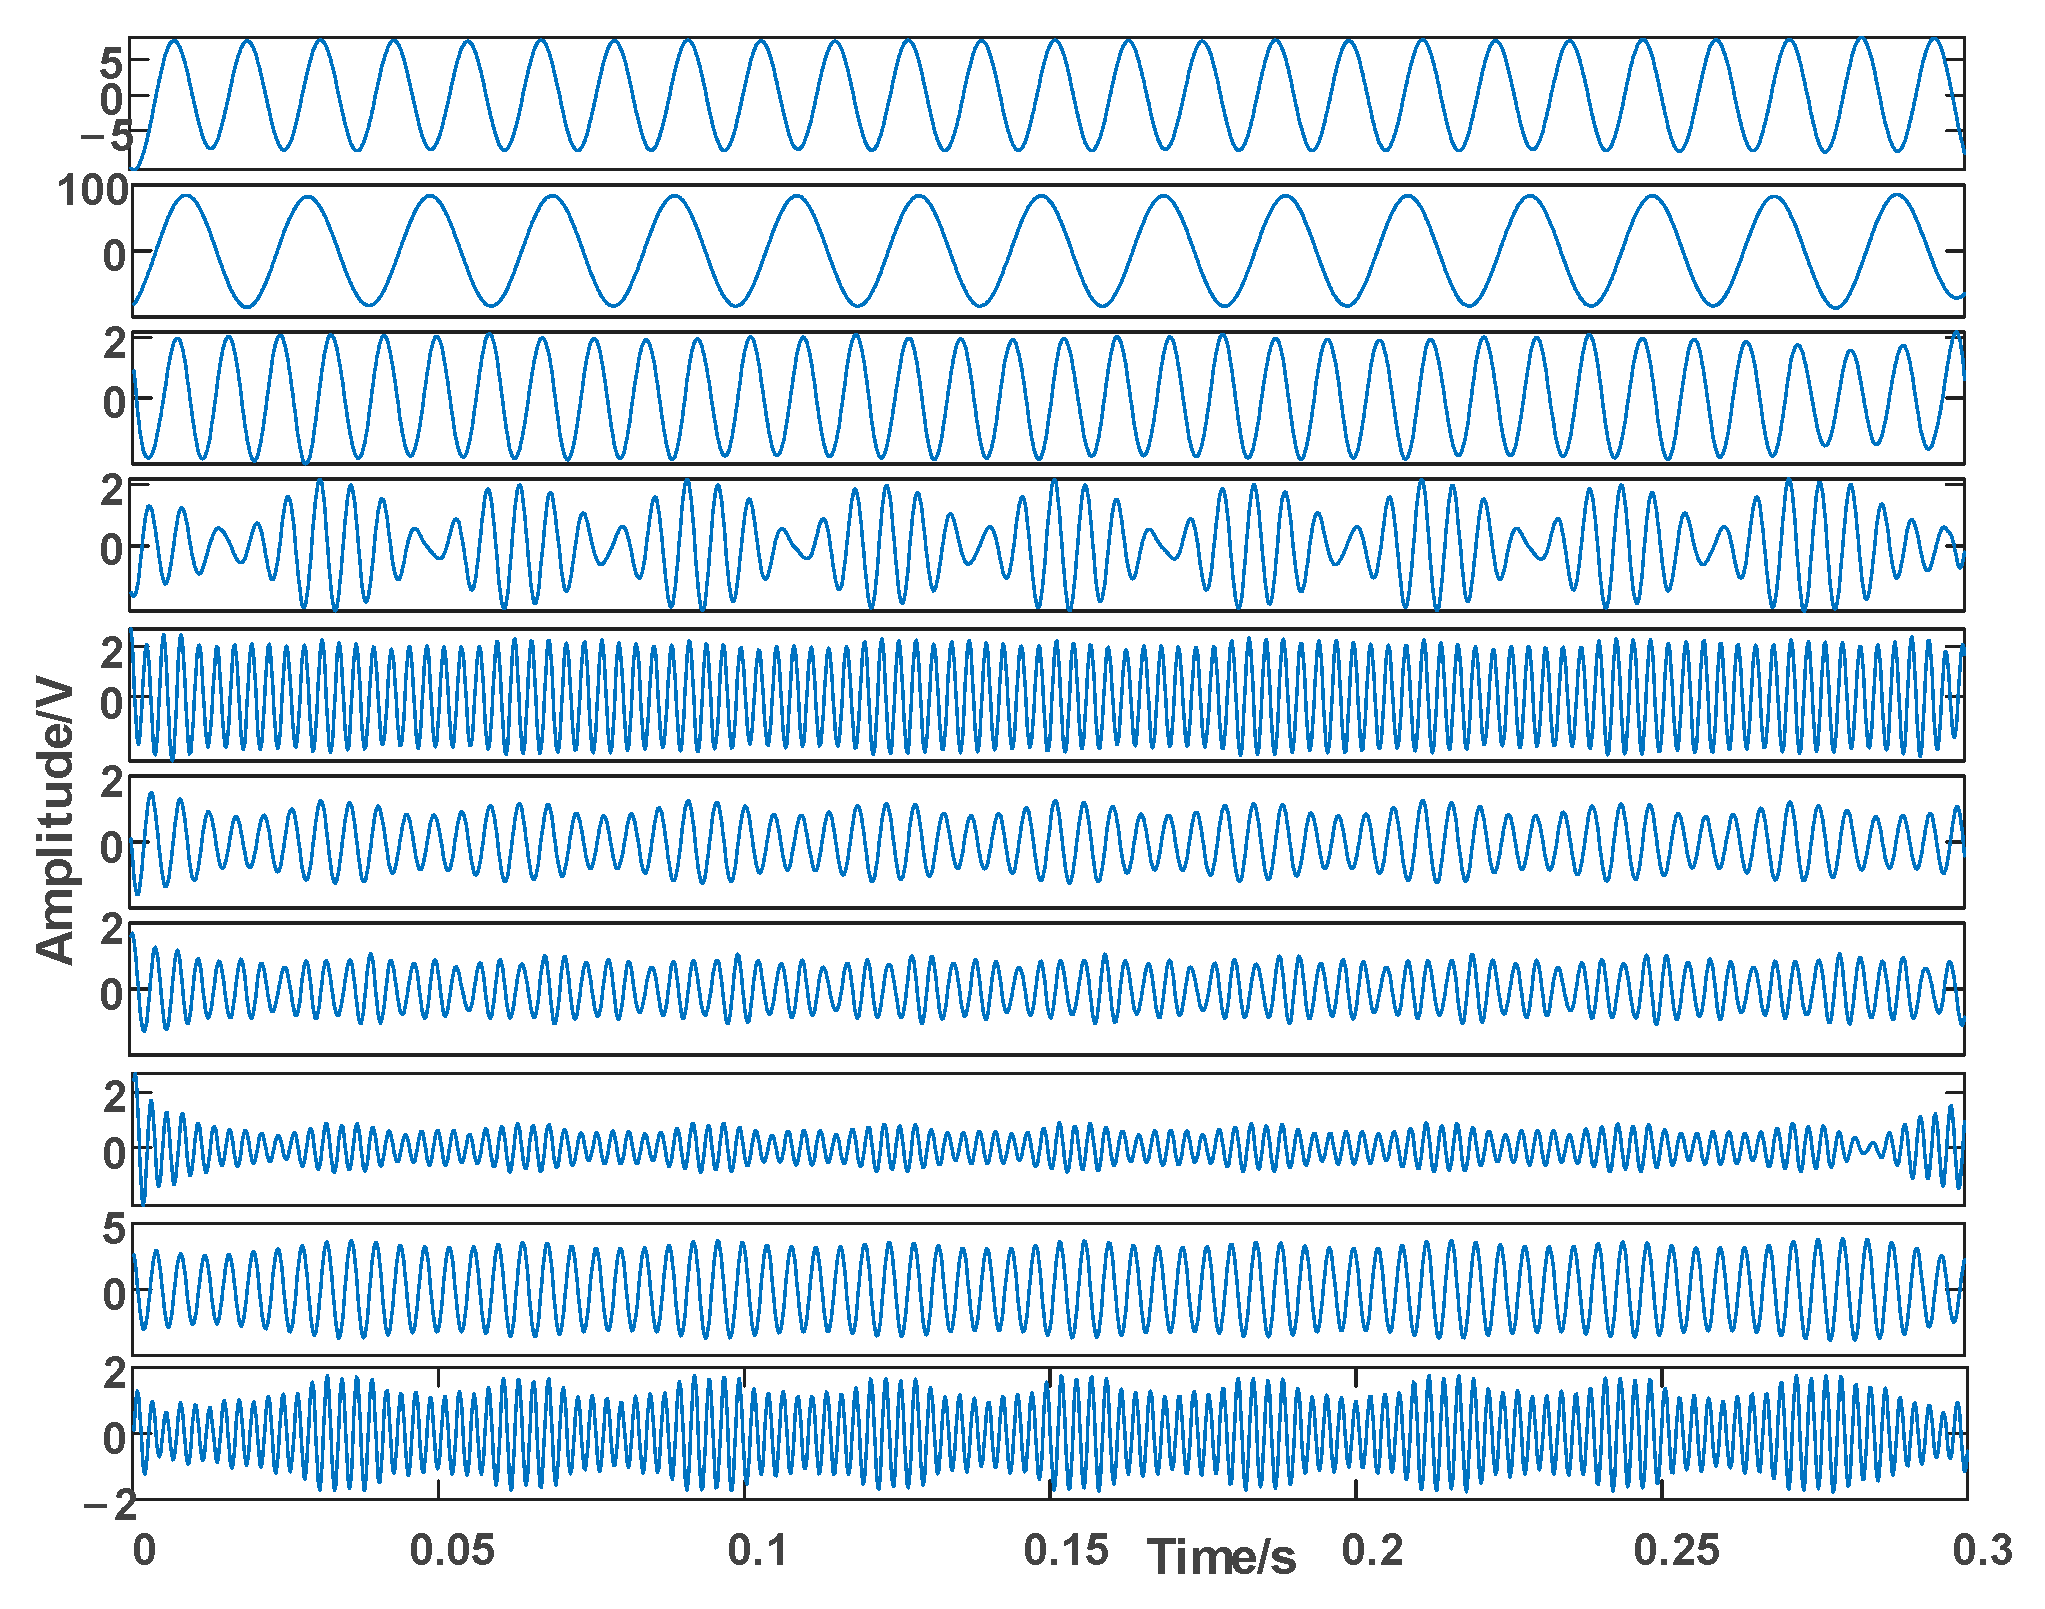
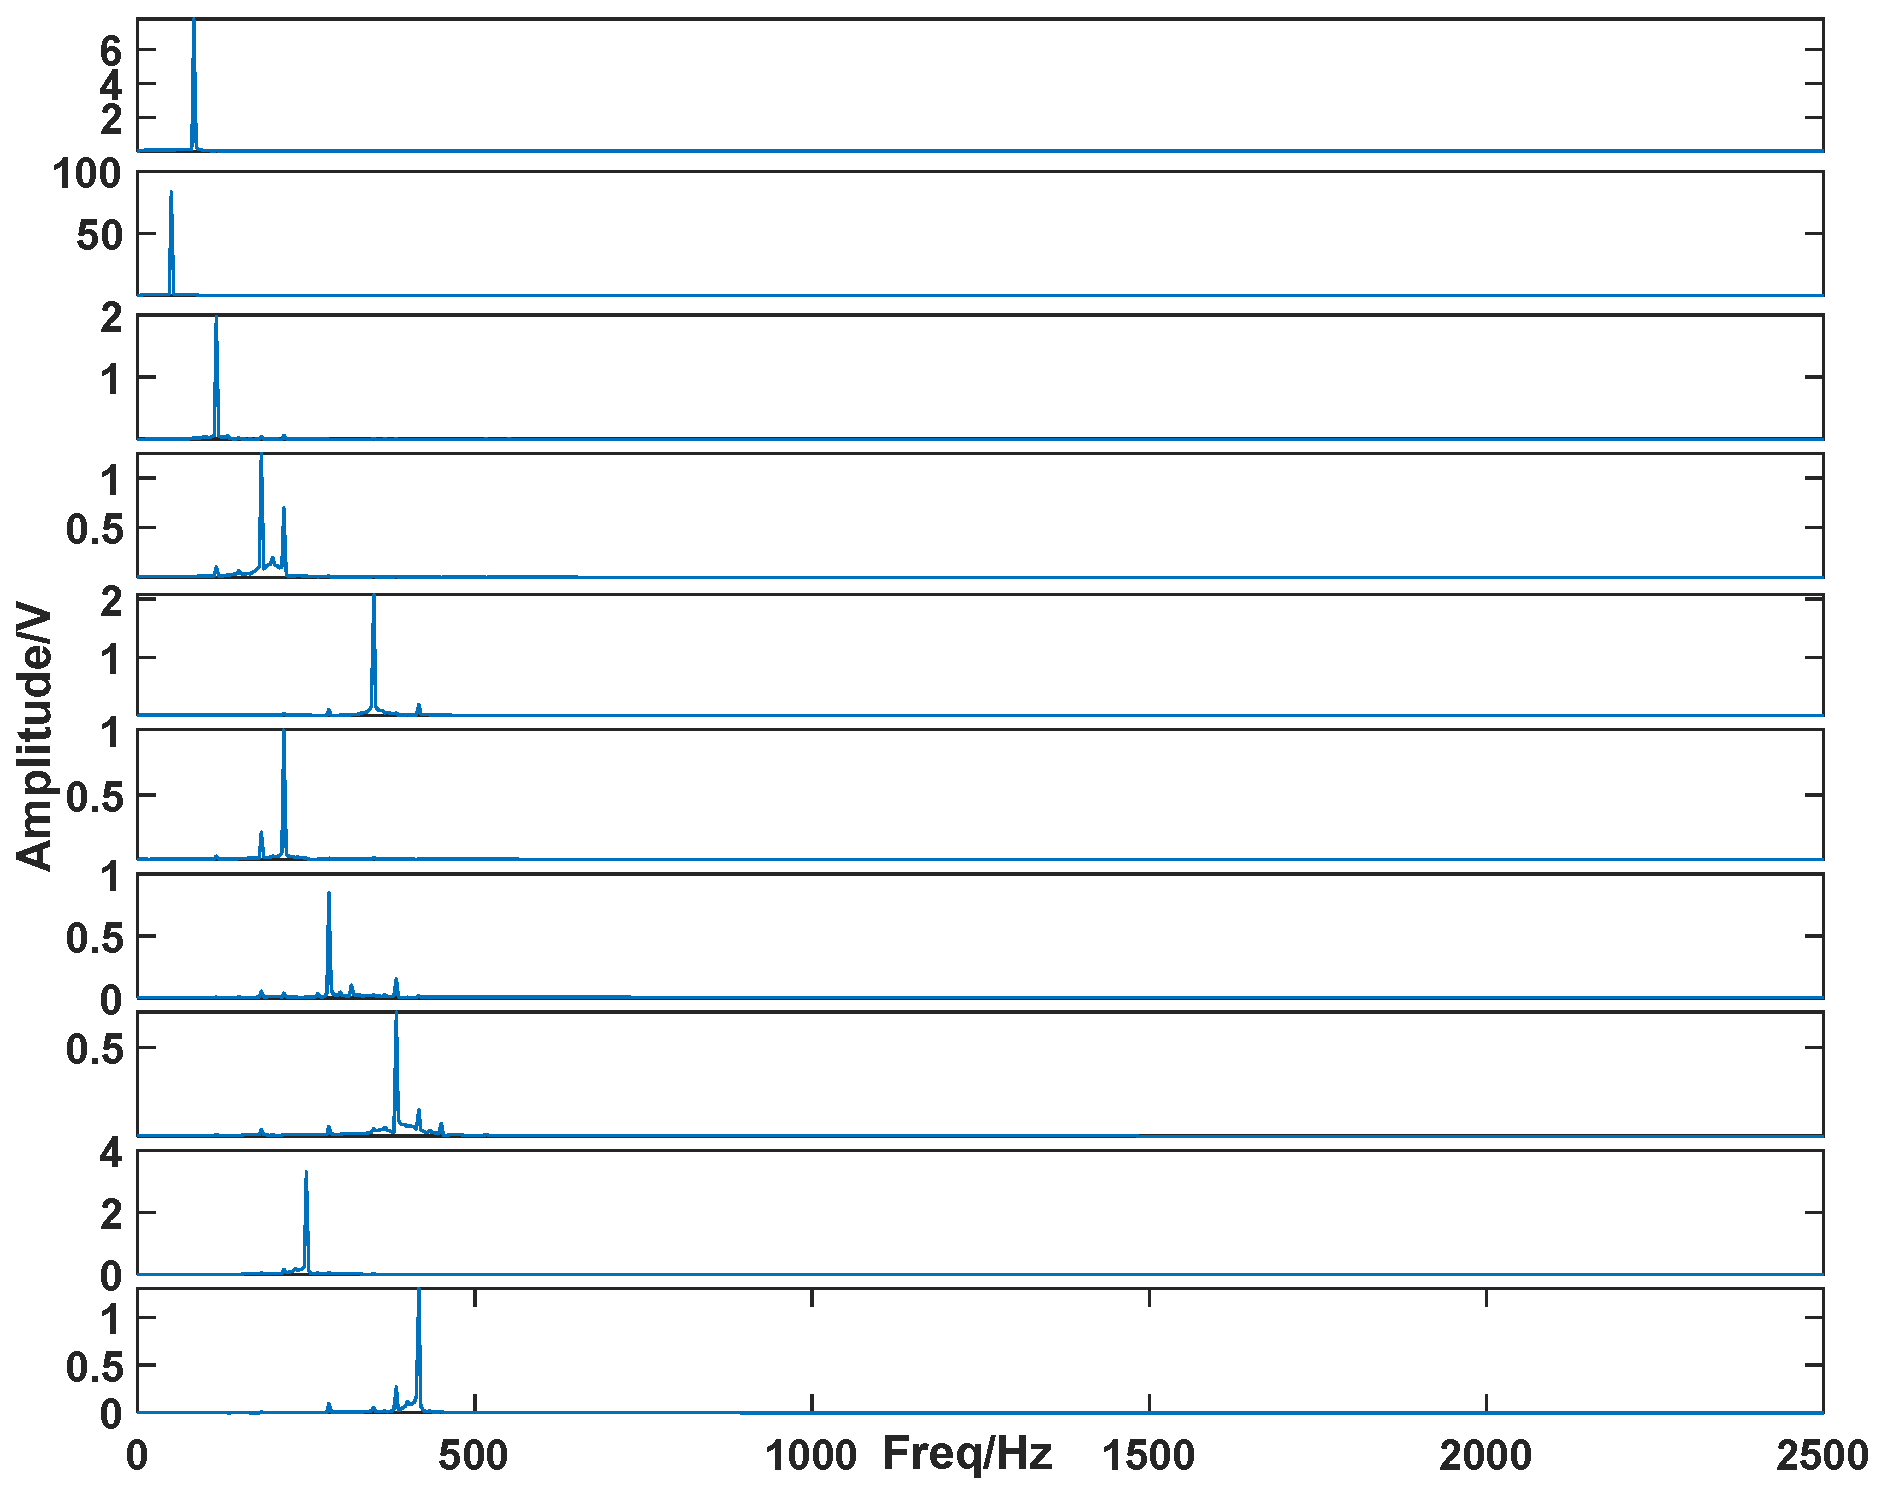
From Figure 11 and Figure 12, the real harmonic components are mainly distributed in the middle and low frequency bands, which is consistent with the analysis results of FFT. Among them, the dominant inter-harmonic component with a frequency of about 83 Hz is the main factor causing broadband oscillation, and the high-frequency noise component is mainly distributed in the range of 1000 to 2500 Hz. By screening out the high-frequency noise components, the signal contains ten effective modal components.

6.2. Detection Performance Analysis of Measurement Signal

In the case of the identification of the measured data, the Prony algorithm is usually disturbed by noise along with the high model order.
The measured data were decomposed using the method proposed in this paper, and the information of each component and the Fourier analysis results were obtained, as depicted in Figure 11 and Figure 12. It can be observed from Figure 12 that even for measured signals with complex conditions, the proposed method is still capable of separating the components effectively, demonstrating the practicality of its separation effect. This further indicates that the proposed method continues to exhibit a strong denoising effect on the measured data.
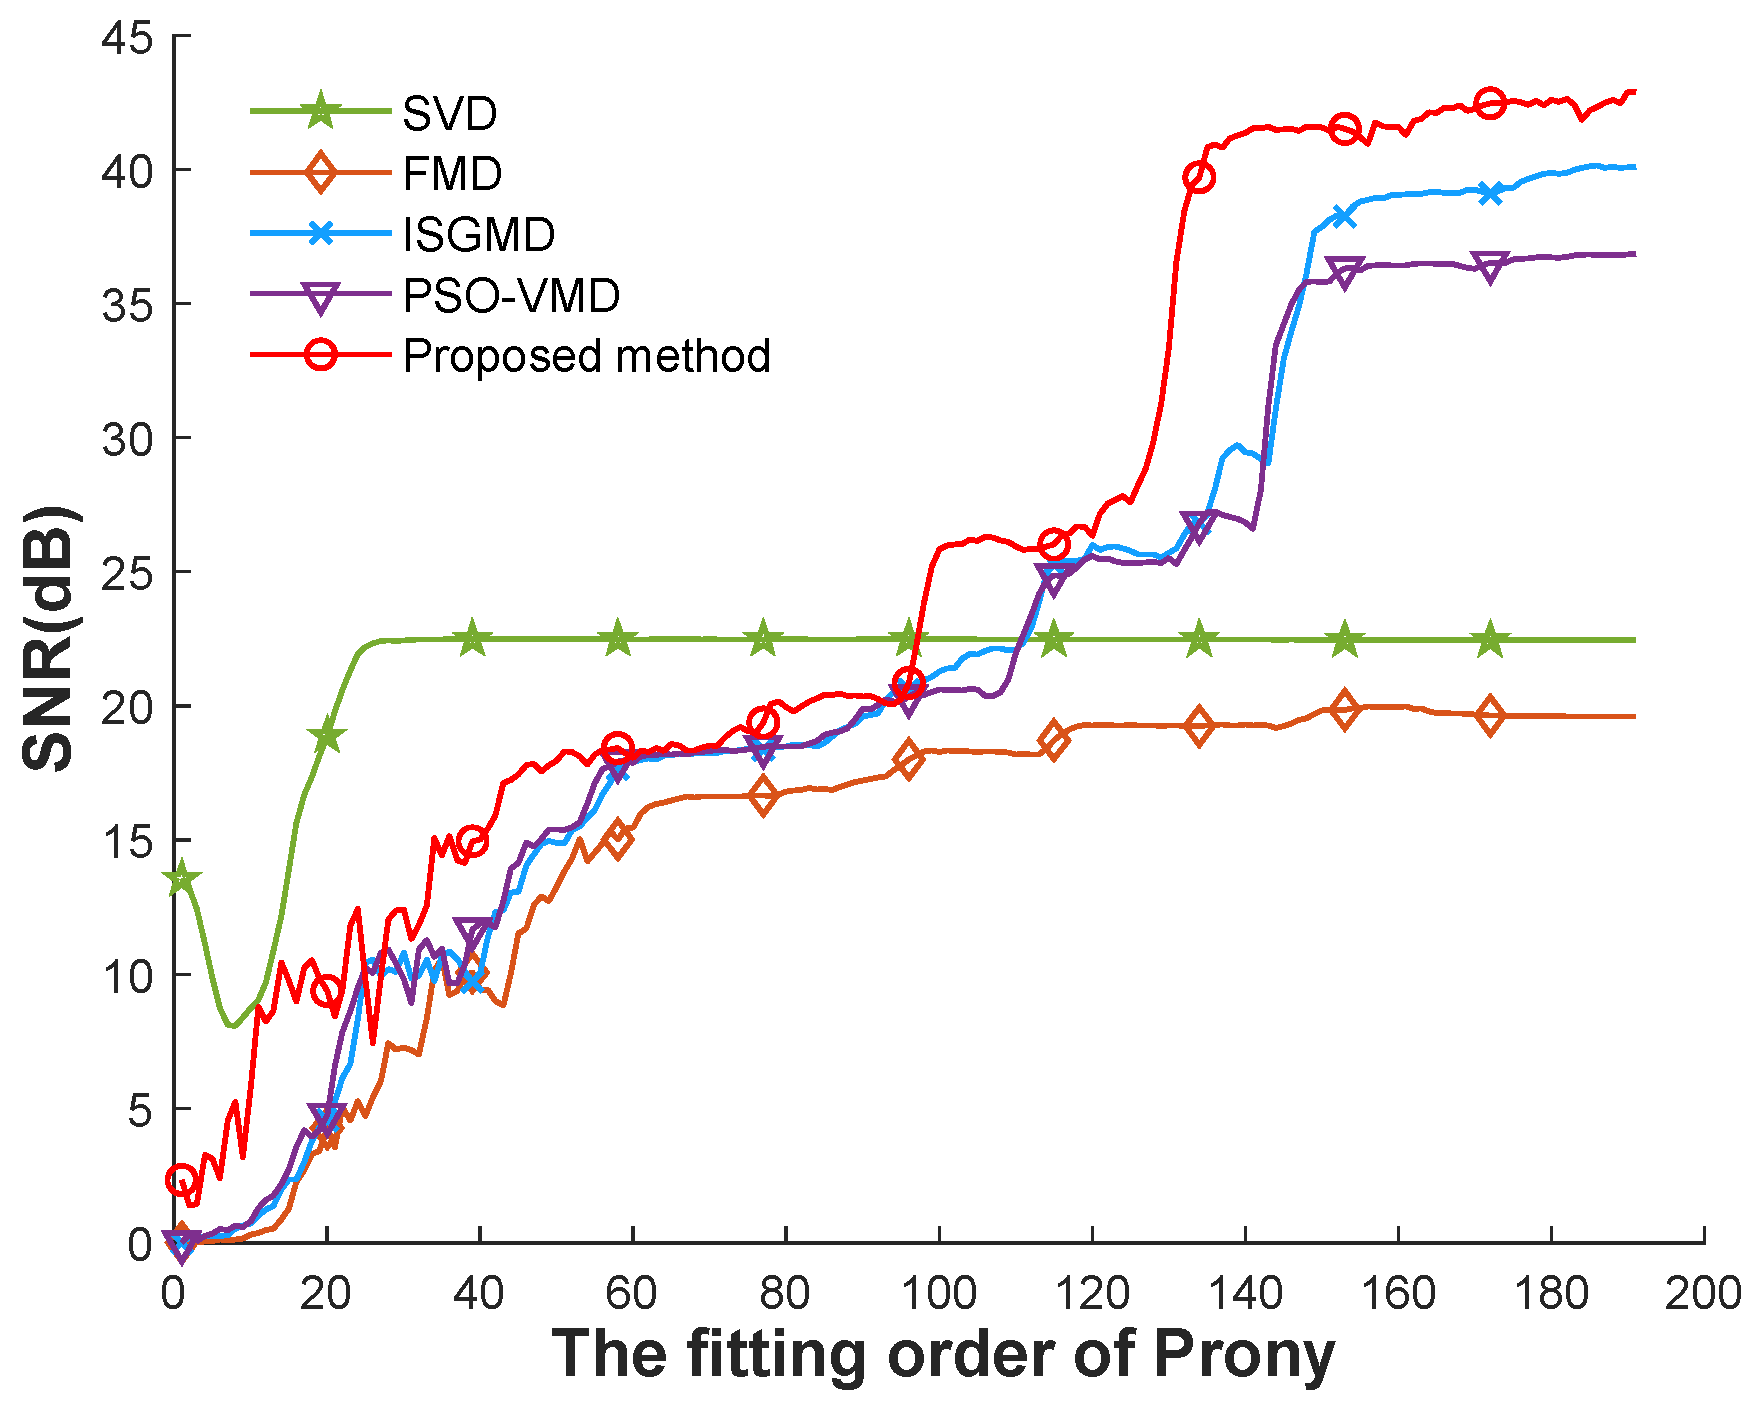
The Prony identification of the reconstructed measured signal, respectively, shows that the SNR of SVD + Prony increases rapidly with the increase in fitting order before 26.
In Figure 13, when the fitting order reaches 27, the fitting SNR stabilizes at about 22 dB. The SNR of SVD + Prony is always slightly better than that of the proposed method before the fitting order reaches 100. But when the fitting order reaches 120, the SNR of the proposed method increases rapidly. When the fitting order reaches 135, the fitting SNR stabilizes around 42 dB, which shows a better fitting effect than SVD + Prony.
According to Figure 13, SVD + Prony exhibits the fastest rising trend. At a fitting order of 27, SVD + Prony reaches the maximum fitting SNR of 22 dB and stabilizes at that level. As the fitting order increases to 100, the fitting SNR of the proposed method, PSO-VMD, and ISGMD begins to rise. By the time the fitting order reaches 150, the fitting SNR of all three methods gradually becomes stable. The SNR of the proposed method stabilizes at 42 dB, while PSO-VMD stabilizes at 36 dB, and ISGMD stabilizes as well. While SVD demonstrates a strong de-noising effect, its capability in Prony parameter identification is limited, suggesting a lack of detailed de-noising data. As illustrated by the SVD fitting curve in Figure 12, the fitting effect stabilizes at 22 dB rapidly.
By comparing the results of Figure 7 and Figure 13, it can be seen that the method proposed in this paper has a more obvious anti-interference ability to noise. While improving the signal fitting degree, it can also reduce the model order of identification.
After dynamic adjustment of order, the identification accuracy of the Prony algorithm is further improved. As can be seen from Table 5, the SNR of the reconstructed signal is 41.5783 dB, and the fitting effect is much better than that of the denoised signal based on SVD.
Then, according to the model order in Table 5, the original signal and the reconstructed signals denoised by the proposed method and SVD are identified. The identification results are shown in Table 6.
As can be seen from Table 6, method 1 represents the results of PSO-VMD + Prony, method 2 represents the results of this work, method 3 represents the results of ISGMD + Prony, and method 4 represents the results of SVD + Prony. The recognition results based on the SVD denoising algorithm are acceptable for the fundamental frequency components. But there are large deviations in the recognition results of other components. The average frequency identification error of SVD + Prony is 0.838%, and the average amplitude identification error is 44.76%. The identification results of the proposed method can recover the amplitude, frequency, initial phase, and damping factor of the signal well. The average identification error of the amplitude is 2.437%, and the average identification error of the frequency is 0.044%, which is better than the original data identification. The average frequency identification error of the original data is 0.0667%, and the average amplitude identification error is 4.38%. In addition, the above identification results can reflect the amplitude-frequency characteristics of the effective component in the signal shown in Figure 10 and Figure 11. That is, the oscillation mode components are concentrated around the middle and low frequency band, among which the inter-harmonic amplitude around 83 Hz is large and the damping factor is small, which is the main factor causing broadband oscillation.
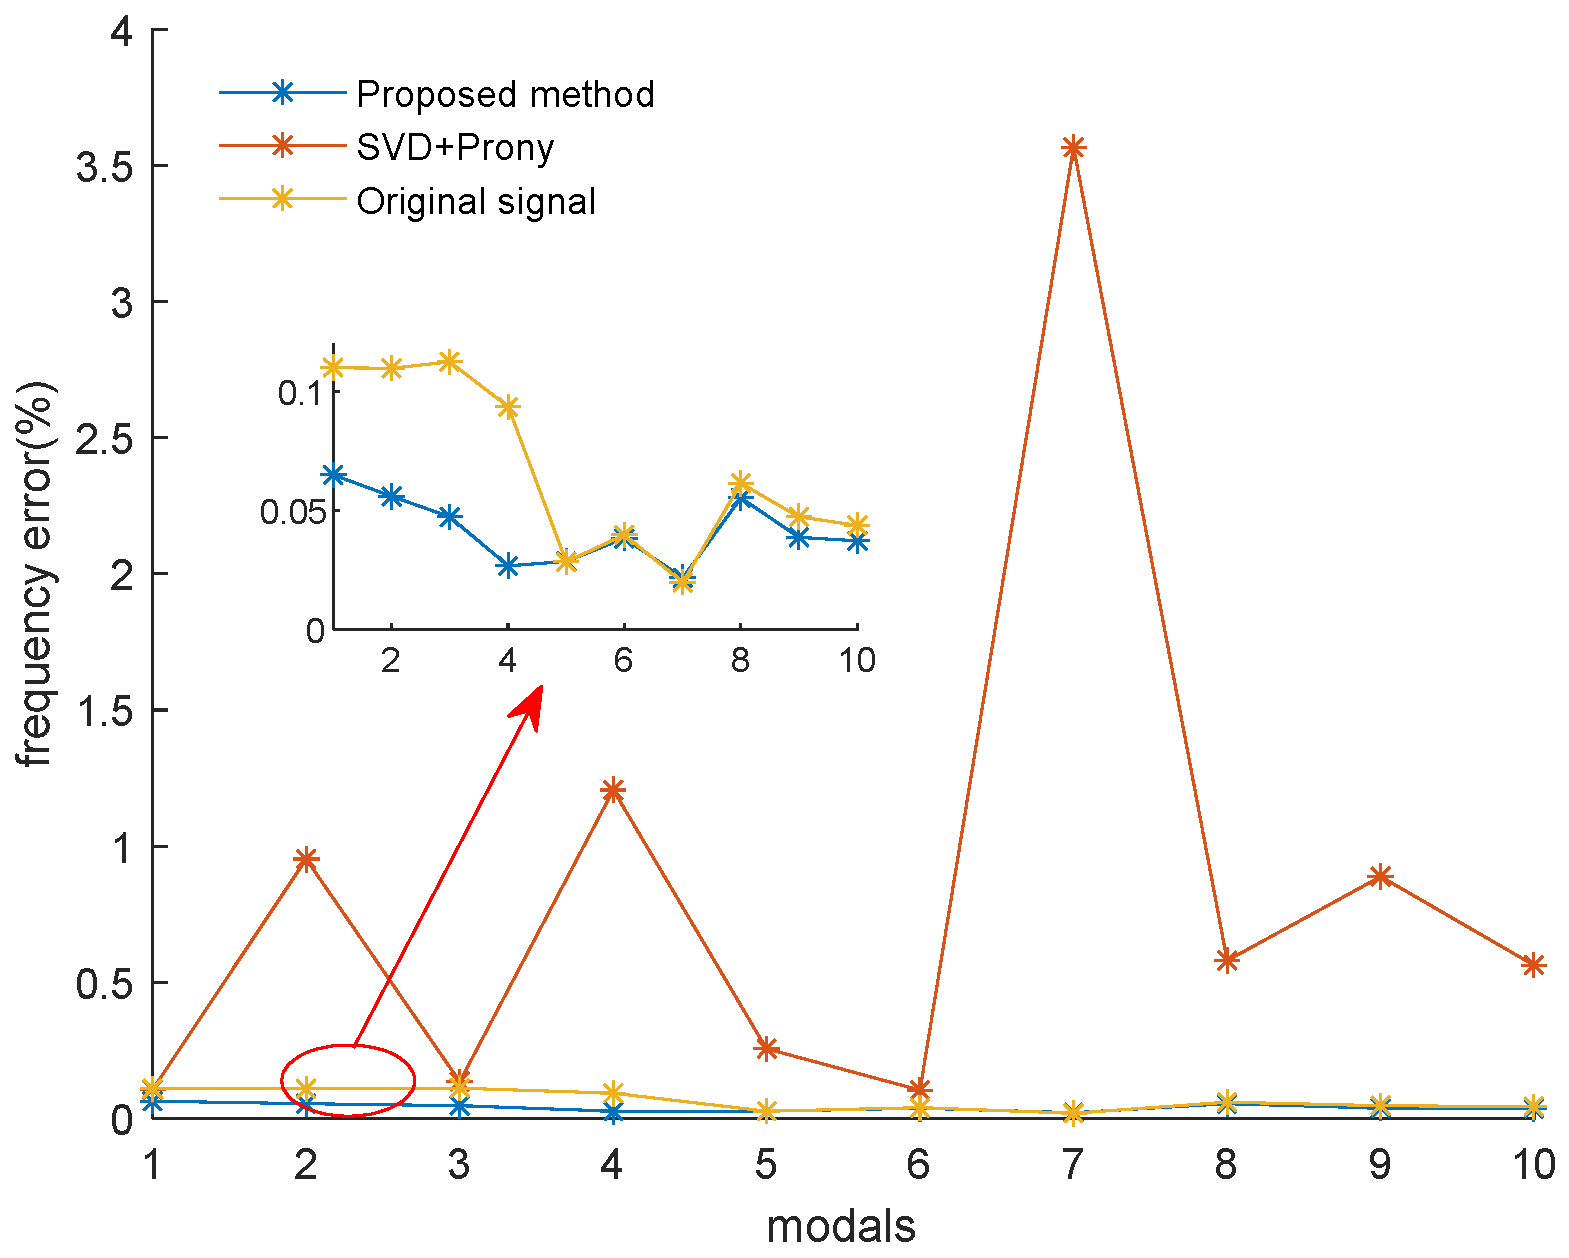
From Figure 14 and Figure 15, the frequency error of SVD + Prony is up to 3.56%, and the amplitude error is up to 91.74%. It can be seen that the frequency and amplitude errors of SVD + Prony are much higher than the errors of the proposed method and the original signal. The maximum frequency error of the proposed method is 0.065%, which is lower than the maximum frequency error of the original data of 0.11%. The maximum amplitude error of the proposed method is 6.22%, which is lower than the maximum amplitude error of the original data of 10.47%. Therefore, the advantages of this method in frequency and amplitude identification accuracy are verified.
In summary, as a commonly used broadband oscillation analysis method, the FFT transform results in spectrum leakage and the fence effect easily. Furthermore, the time-domain characteristics, such as the damping factor of the oscillation, cannot be obtained. Although the traditional Prony algorithm can achieve more accurate time-domain analysis results, the model order is too large, and the identification accuracy is greatly affected by the model order. The denoising effect of the SVD method is poor, and the error of component information identification is large when combined with Prony analysis. The proposed method demonstrates substantial noise robustness, effectively mitigating interference in signal identification. Consequently, it achieves superior performance in data characterization compared to conventional approaches.

7. Conclusions

The proliferation of renewable energy integration and power electronics advancements has led to increasingly prevalent broadband oscillation phenomena in modern power systems. This paper proposes a novel hybrid approach combining single-component symplectic geometric decomposition with Prony analysis, replacing conventional global analysis methods. As a phase-space-structure-preserving method, symplectic geometry analysis maintains original system characteristics while achieving enhanced noise suppression, with principal results indicating the following:
(1)
It should be noted that the algorithm design of this study is oriented towards the general analysis of broadband oscillations. Although the measured data sources are from the high-permeability areas of renewable energy, the method itself does not rely on a specific type of oscillation source.
(2)
The primary innovation is centered on a paradigm shift within the algorithm. While the traditional iterative loop judgment point of iterated symplectic geometry focuses on the residual component of the decomposition result in ISGMD, this paper proposes a new emphasis on assessing whether each decomposition component is uncoupled.
(3)
This paper verifies the effectiveness of the algorithm through simulation data and measured data. The final fitting SNR of the proposed algorithm in the simulation data is much higher than that of the original data, and almost twice that of the SVD method in the measured data.
(4)
The algorithm proposed in this paper demonstrates a slow increase in runtime as the data volume grows, while maintaining a relatively high convergence rate with no requirement for multiple iterations. Therefore, the proposed method exhibits practical feasibility in real-world applications.
In conclusion, when single-component symplectic geometry is carried out in this paper, the ending condition impacts the denoising effect. Therefore, further research can be carried out in this aspect to obtain a more stable denoise effect.

Author Contributions

Conceptualization, Z.G. and L.Y.; methodology, Z.G., R.Z., H.D. and C.G.; writing—original draft preparation, Z.G. and L.Y.; writing—review and editing, J.L. and C.L. All authors have read and agreed to the published version of the manuscript.

Funding

This research was funded by Yunnan Province joint fund key project (202201BE070001-15).

Data Availability Statement

The raw/processed data required to reproduce these findings are contained within the article.

Acknowledgments

We would like to express our sincere gratitude to Kunming University of Science and Technology, Qujing Bureau of Yunnan Province Ultra-High Voltage Transmission Company and Southwest Jiaotong University for their support.

Conflicts of Interest

Authors Zhan Gan, Rui Zhang, Hanlin Ding, Jinsong Li, Chao Li were employed by the company Qujing Bureau of Yunnan Province Ultra-High Voltage Transmission Company. The remaining authors declare that the research was conducted in the absence of any commercial or financial relationships that could be construed as a potential conflict of interest.

References

  1. Li, H.; Qiao, Y.; Lu, Z.; Zhang, B.; Teng, F. Frequency-Constrained Stochastic Planning Towards a High Renewable Target Considering Frequency Response Support From Wind Power. IEEE Trans. Power Syst. 2021, 36, 4632–4644. [Google Scholar] [CrossRef]
  2. Zong, H.; Lyu, J.; Wang, X.; Zhang, C.; Zhang, R.; Cai, X. Grey box aggregation modeling of wind farm for wideband oscillations analysis. Appl. Energy 2021, 283, 116035. [Google Scholar] [CrossRef]
  3. Cheng, Y.; Fan, L.; Rose, J. Real-world subsynchronous oscillation events in power grids with high penetrations of inverter-based resources. IEEE Trans. Power Syst. 2023, 38, 316–330. [Google Scholar] [CrossRef]
  4. Ying, Y.; Yang, X.; Wang, Z.; Gao, X.; Yu, H.; Xu, J.; Bao, W.; Ding, L. Drivetrain torsional vibration analysis and mitigation of grid-forming DFIG-based wind turbine generators. Int. J. Electr. Power Energy Syst. 2025, 170, 110882. [Google Scholar] [CrossRef]
  5. Chi, Y.; Tang, B.; Hu, J.; Tian, X.; Tang, H.; Li, Y.; Sun, S.; Shi, L.; Shuai, L. Overview of mechanism and mitigation measures on multi-frequency oscillation caused by large-scale integration of wind power. CSEE J. Power Energy Syst. 2019, 5, 433–443. [Google Scholar]
  6. Zhang, D.; Hu, J.; Ma, S.; He, Q.; Guo, Q. Impacts of PLL on the DFIG-based WTG’s electromechanical response under transient conditions:analysis and modeling. CSEE J. Power Energy Syst. 2016, 2, 30–39. [Google Scholar] [CrossRef]
  7. Shah, S.; Koralewicz, P.; Gevorgian, V.; Wallen, R.; Jha, K.; Mashtare, D.; Burra, R.; Parsa, L. Large-signal impedance-based modeling and mitigation of resonance of converter-grid systems. IEEE Trans. Sustain. Energy 2019, 10, 1439–1449. [Google Scholar] [CrossRef]
  8. Wang, C.; Zheng, W.; Wang, Z.; Dan, Y.; Ju, P. Partition-Based Network Equivalent Method for Power System Subsynchronous Oscillation Analysis. J. Mod. Power Syst. Clean. Energy 2024, 12, 313–320. [Google Scholar] [CrossRef]
  9. Liu, F.; Lin, S.; Ma, J.; Li, Y. Data-Driven Mode Identification Method for Broad-Band Oscillation of Interconnected Power System. IEEE Sens. J. 2022, 22, 15273–15283. [Google Scholar] [CrossRef]
  10. Zhang, F.; Cheng, L.; Gao, W.; Huang, R. Synchrophasors-based identification for subsynchronous oscillations in power systems. IEEE Trans. Smart Grid 2018, 10, 2224–2233. [Google Scholar] [CrossRef]
  11. Yang, X.; Zhang, J.; Xie, X.; Xiao, X.; Yang, W. Interpolated DFT-based identification of sub-synchronous oscillation parameters using synchrophasor data. IEEE Trans. Smart Grid 2019, 11, 2662–2675. [Google Scholar] [CrossRef]
  12. Wu, Q.; Huang, Y.; Li, C.; Gu, Y.; Zhao, H.; Zhan, Y. Small Signal Stability of Synchronous Motor-Generator Pair for Power System With High Penetration of Renewable Energy. IEEE Access 2019, 7, 166964–166974. [Google Scholar] [CrossRef]
  13. Fang, H.; Zhang, B.; Yu, F.; Zhao, B.; Ma, Z. A Pipelined Algorithm and Area-Efficient Architecture for Serial Real-Valued FFT. IEEE Trans. Circuits Syst. II Express Briefs 2022, 69, 4533–4537. [Google Scholar] [CrossRef]
  14. Yu, Y.; Zhao, W.; Li, S.; Huang, S. A Two-Stage Wavelet Decomposition Method for Instantaneous Power Quality Indices Estimation Considering Interharmonics and Transient Disturbances. IEEE Trans. Instrum. Meas. 2021, 70, 9001813. [Google Scholar] [CrossRef]
  15. Lee, W.; Jeong, T.; Lee, D.; Woo, K.; Lee, K.Y.; Yun, C.R.; Seo, C.; Oh, J.; Yun, C.R.; Seo, C.; et al. Fully Digital Phased Array Harmonic Radar for Detecting Concealed Electronic Devices. IEEE J. Microw. 2025, 5, 868–881. [Google Scholar] [CrossRef]
  16. Raj, V.A.; Nayak, S.G.; Thalengala, A. A hybrid framework for muscle artifact removal in EEG: Combining variational mode decomposition, stationary wavelet transform, and canonical correlation analysis. Cogent Eng. 2025, 12, 2514941. [Google Scholar] [CrossRef]
  17. Riaz, F.; Hassan, A.; Rehman, S.; Niazi, I.K.; Dremstrup, K. EMD-Based Temporal and Spectral Features for the Classification of EEG Signals Using Supervised Learning. IEEE Trans. Neural Syst. Rehabil. Eng. 2016, 24, 28–35. [Google Scholar] [CrossRef]
  18. Gao, Z.; Chang, Y.; Ren, F. The micro-shearing mechanism of the rock-concrete interface from acoustic emission using the improved Hilbert-Huang transform. Constr. Build. Mater. 2025, 489, 142301. [Google Scholar] [CrossRef]
  19. Chen, K.; Jin, T.; Mohamed, M.A.; Wang, M. An Adaptive TLS-ESPRIT Algorithm Based on an S-G Filter for Analysis of Low Frequency Oscillation in Wide Area Measurement Systems. IEEE Access 2019, 7, 47644–47654. [Google Scholar] [CrossRef]
  20. Shaikh, M.S.; Lin, H.; Xie, S.; Dong, X.; Lin, Y.; Shiva, C.K. An intelligent hybrid grey wolf-particle swarm optimizer for optimization in complex engineering design problem. Sci. Rep. 2025, 15, 18313. [Google Scholar] [CrossRef]
  21. Shaikh, M.S.; Hua, C.; Jatoi, M.A.; Ansari, M.M.; Qader, A.A. Application of grey wolf optimisation algorithm in parameter calculation of overhead transmission line system. IET Sci. Meas. Technol. 2021, 15, 218–231. [Google Scholar] [CrossRef]
  22. Cartiel, O.; Sainz, L.; Mesas, J.J.; Monjo, L. A Damping Margin Indicator for Compensator Design by the Positive-Mode-Damping Stability Criterion. IEEE Trans. Power Syst. 2025, 40, 3173–3184. [Google Scholar] [CrossRef]
  23. Sabo, A.; Wahab, N.I.A.; Othman, M.L.; Jaffar, M.Z.A.B.M.; Acikgoz, H.; Nafisi, H. Artificial Intelligence-Based Power System Stabilizers for Frequency Stability Enhancement in Multi-Machine Power Systems. IEEE Access 2021, 9, 166095–166116. [Google Scholar] [CrossRef]
  24. Gupta, A.K.; Verma, K. PMU-ANN based real time monitoring of power system electromechanical oscillations. In Proceedings of the 2016 IEEE 1st International Conference on Power Electronics, Intelligent Control and Energy Systems (ICPEICES), Delhi, India, 4–6 July 2016; pp. 1–6. [Google Scholar]
  25. Miao, Y.H.; Zhang, B.Y.; Li, C.H.; Lin, J.; Zhang, D.Y. Feature mode decomposition: New decomposition theory for rotating machinery fault diagnosis. IEEE Trans. Ind. Electron. 2023, 70, 1949–1960. [Google Scholar] [CrossRef]
  26. Guo, C.; Yang, L.; Dai, J.; Chen, B.; Yin, K.; Dai, J. A New Method for the Analysis of Broadband Oscillation Mode of New Energy Stations. Symmetry 2024, 16, 278. [Google Scholar] [CrossRef]
  27. Xiang, M.; Zhang, J.; Sun, Y.; Fan, J. A measurement-based dynamic harmonic model for single-phase diode bridge rectifier-type devices. IEEE Trans. Instrum. Meas. 2024, 73, 1501111. [Google Scholar]
  28. Huang, Y.; Yan, X.; Hu, Z.; Li, Z.; Zhang, Q. Quantized Exponential Hyperbolic Sine Robust Adaptive Filtering Algorithm. Circuits Syst. Signal Process 2025, 5, 12. [Google Scholar] [CrossRef]
  29. Ciotirnae, P.; Dumitrescu, C.; Chiva, I.C.; Semenescu, A.; Popovici, E.C.; Dranga, D. Method for noise reduction by averaging the filtering results on circular displacements using wavelet transform and local binary pattern. Electronics 2024, 13, 4119. [Google Scholar] [CrossRef]
  30. Barroso, R.H.; Zozaya Sahad, A.J. Improving the accuracy of the pencil of function method increasing its matrix polynomial degree. Mathematics 2025, 13, 315. [Google Scholar] [CrossRef]
  31. Li, Y.; Liang, X.; Yang, Y.; Xu, M.; Huang, W. Early Fault Diagnosis of Rotating Machinery by Combining Differential Rational Spline-Based LMD and K–L Divergence. IEEE Trans. Instrum. Meas. 2017, 66, 3077–3090. [Google Scholar] [CrossRef]
  32. Pan, H.; Yang, Y.; Li, X.; Zheng, J.; Cheng, J. Symplectic geometry mode decomposition and its application to rotating machinery compound fault diagnosis. Mech. Syst. Signal Process. 2019, 114, 189–211. [Google Scholar] [CrossRef]
  33. Wang, R.; Huang, W.; Hu, B.; Du, Q.; Guo, X. Harmonic Detection for Active Power Filter Based on Two-Step Improved EEMD. IEEE Trans. Instrum. Meas. 2022, 71, 9001510. [Google Scholar] [CrossRef]
  34. Biswas, M.; Hossain, M.S.; Ahmed Rupok, T.; Hossain, M.S.; Sukasem, C. The association of CYP2C19 LoF alleles with adverse clinical outcomes in stroke patients taking clopidogrel: An updated meta-analysis. Clin. Transl. Sci. 2024, 17, e13792. [Google Scholar] [CrossRef]
  35. Gao, J.; Xu, H.; Yang, Y.; Zhang, X.; Mao, X.; Dong, H. A multi-mode recognition method for broadband oscillation based on CS-OMP and adaptive VMD. Energies 2024, 17, 5821. [Google Scholar] [CrossRef]
Figure 1. Flow chart of outliers of components (* represents outliers, and here it represents extreme points).
Symmetry 17 01650 g001
Figure 2. Flow chart of dynamic warping time.
Symmetry 17 01650 g002
Figure 3. Comparison of the decomposition effect of SGMD and LOF-SGMD.
Symmetry 17 01650 g003
Figure 5. Spectrogram of the ideal signal and the added noise signal.
Symmetry 17 01650 g005
Figure 6. The denoising evaluation results of different evaluation indices for different noise contents.
Symmetry 17 01650 g006
Figure 7. Comparison of SNR by different methods.
Symmetry 17 01650 g007
Figure 8. Identification error results of SVD + Prony and the proposed method.
Symmetry 17 01650 g008
Figure 9. The measured signal waveform.
Symmetry 17 01650 g009
Figure 10. FFT analysis spectrum.
Symmetry 17 01650 g010
Figure 11. Decomposition of each modal waveform diagram.
Symmetry 17 01650 g011
Figure 12. Decomposition of each modal spectrum.
Symmetry 17 01650 g012
Figure 13. Comparison of signal fitting analysis.
Symmetry 17 01650 g013
Figure 14. Identification error results of frequency.
Symmetry 17 01650 g014
Figure 15. Identification error results of amplitude.
Symmetry 17 01650 g015
Table 1. Evaluation Indexes of Different Algorithms under Different Noise Levels.
0 dB5 dB15 dB
SNRRMSENCCSNRRMSENCCSNRRMSENCC
SVD11.38579.12790.964217.10494.72510.990421.59592.81750.9978
FMD−0.193734.59820.68494.576019.97880.86719.446411.40370.9475
ISGMD1.489128.52340.76235.752717.45900.886910.339710.29600.9562
PSO-VMD−0.177134.55490.69764.580319.98200.86247.976413.51560.9285
Proposed method denoising performance12.96697.60870.975218.42004.06120.992822.34662.58420.9971
Table 2. Evaluation Indexes of Different Algorithms under 15 dB Noise.
Model OrderSNR (dB)RMSENCC
SVD + Prony2529.61661.11900.9995
Proposed method denoising performance2531.35930.91560.9996
Table 3. Identification Result of Prony Algorithm of Example Signal.
Mode A (V)f (Hz) φ (rad) α
1Proposed method denoising performance45.084150.00021.0902−0.0197
SVD + Prony44.049149.99971.09150.0097
2Proposed method denoising performance14.147612.0102−0.77030.1597
SVD + Prony13.060112.0146−0.77380.1102
3Proposed method denoising performance8.735987.99921.4980−0.0010
SVD + Prony8.419487.99321.56140.0867
Table 4. FFT Identification Information of Measured Data.
Frequency (Hz)Amplitude (V)Frequency (Hz)Amplitude (V)
5083.65293502.38193
83.33337.91129183.3332.17834
2503.42412416.6672.02222
116.6672.59863283.3331.71047
216.6672.44238383.3331.64848
Table 5. Evaluation Indexes of Different Algorithms under 150 Model Order.
Evaluation IndexModel OrderSNR (dB)
this work15041.5783
SVD15022.4703
Table 6. Identification Result of Prony Algorithm of Measurement Signal.
Modal12345678910
Method
Amplitude (V)183.65297.911293.424122.598632.442382.381932.178342.022221.710471.64848
283.69767.96903.35942.70282.42392.53022.25872.03021.80841.6891
383.75497.89373.56122.53322.39042.63132.10832.04311.80551.7964
483.951310.07283.97784.98260.87932.98561.48620.56240.56990.7243
Frequency (Hz)15083.3333250116.667216.667350183.333416.667283.333383.333
249.967583.2867249.8818116.6358216.6052349.8658183.3728416.4367283.2233383.1901
349.944983.2417249.7186116.5578216.6055349.8611183.3693416.4111283.1988383.1650
449.947184.1276249.6608115.2586216.1113350.3675189.8726414.2450285.8541381.1682
Initial phase1/
20.4762−0.53500.59911.3313−1.55480.4644−0.9315−1.1713−0.6472−0.3681
30.4746−0.53680.62901.3430−1.55590.4681−0.9297−1.1501−0.6277−0.3467
40.4797−0.37400.6990−1.52221.12780.56881.52110.8542−0.44151.2737
Damping factor1/
2−0.0015−0.06520.1518−0.17130.0992−0.3952−0.2354−0.0019−0.3811−0.1677
3−0.0038−0.01580.01040.15910.1879−0.3919−0.0837−0.0398−0.3653−0.1950
40.0003−3.7667−0.3948−10.1811−4.44860.7131−76.6435−21.8343−11.3045−48.8654
Disclaimer/Publisher’s Note: The statements, opinions and data contained in all publications are solely those of the individual author(s) and contributor(s) and not of MDPI and/or the editor(s). MDPI and/or the editor(s) disclaim responsibility for any injury to people or property resulting from any ideas, methods, instructions or products referred to in the content.