Article

High-Efficiency Design of Mega-Constellation Based on Genetic Algorithm Coverage Optimization

1
College of Science, Inner Mongolia University of Technology, Hohhot 010051, China
2
School of Aerospace Engineering, Tsinghua University, Beijing 100084, China
3
Inner Mongolia Key Laboratory of New Energy and Energy Storage Technology, Hohhot 010051, China
4
Institute of Intelligent Systems, Inner Mongolia University of Technology, Hohhot 010051, China
*
Author to whom correspondence should be addressed.
These authors contributed equally to this work.
Symmetry 2025, 17(10), 1619; https://doi.org/10.3390/sym17101619
Submission received: 20 August 2025 / Revised: 19 September 2025 / Accepted: 24 September 2025 / Published: 1 October 2025
(This article belongs to the Section Mathematics)

Abstract

The design of mega-constellations poses a formidable challenge, as the selection of an optimal configuration directly governs system-level performance, while the computational efficiency of the design methodology remains a critical concern. To address this, this paper presents a high-efficiency, versatile optimization framework predicated on a genetic algorithm. The framework is architected to design diverse configurations, including Walker- δ and Rose constellations, and supports two distinct optimization objectives: the minimization of satellite count for prescribed performance requirements, or the maximization of coverage performance for a fixed number of satellites. To ensure computational tractability, the GA is holistically integrated with a rapid and accurate coverage analysis engine based on an area-adaptive uniform point distribution. The framework’s efficacy and validity are rigorously demonstrated through extensive simulations. The results exhibit strong consistency with the industry-standard Systems Tool Kit 11 software, with average deviations for key performance indicators—namely, coverage time ratio, average coverage multiplicity, and revisit time—controlled within 1%, 0.1, and 35 s, respectively. Moreover, when applied to a specific optimization task, the algorithm successfully identified a 181-satellite constellation that satisfied a given revisit requirement. The proposed method therefore constitutes an efficient, reliable, and automated tool for the design of complex mega-constellation architectures, promoting the diversified development of constellation configurations and enhancing the performance and resource optimization of satellite systems.

1. Introduction

Building an efficient, flexible, and reliable large-scale satellite constellation has become a key strategy for advancing space information acquisition and applications [1]. This approach serves as a critical response to the growing demand for multi-domain space services [2,3]. At the same time, the design of the constellation configuration directly impacts space coverage efficiency, resource allocation optimization, and the overall performance of the satellite system [4,5,6,7]. Furthermore, the trend toward diversification is becoming increasingly evident, with configurations such as star constellations, Walker-δ constellations, and Rose constellations, each offering distinct advantages in different application scenarios [8,9]. However, selecting the most suitable constellation configuration and optimizing its design according to specific mission requirements and constraints remains a significant challenge in satellite system design and operations.
The design of remote sensing, communication, and navigation constellations involves multi-disciplinary integration. For remote sensing constellations, the focus is on high spatio-temporal resolution and wide coverage [10,11], achieved by optimizing the number of satellites and orbital parameters to enable continuous monitoring of the Earth’s surface [12,13,14]. In communication constellations, the emphasis is on global coverage and high-speed data transmission [15,16], utilizing low Earth orbit (LEO) satellites to provide global Internet access with low latency [17]. The key to designing navigation constellations lies in high-precision time synchronization and location services [18,19,20], ensuring global positioning accuracy and reliability through the precise orbital configuration and signal structure design of multiple satellites [21,22].
The differences in the target missions and functions of various constellations make it challenging to reuse design methods, significantly increasing the overall design cycle. Therefore, it is essential to develop a versatile, efficient, and flexible algorithm to reduce the duration and complexity of designing constellation missions. This approach would ensure optimal resource allocation and performance while simultaneously meeting diverse requirements such as high spatiotemporal resolution, wide coverage, low-latency data transmission, and high-precision time synchronization and positioning services.
In evaluating the coverage performance indicators of satellite constellations, the literature [23] proposes a method based on low-density grid coverage analysis for optimizing fast-revisit constellations, which reduces the overall time required for constellation design optimization. The literature [24] introduced an improved grid-point simulation method to quickly assess the coverage performance of satellite constellations, addressing the issues of simulation step-size errors and long computation times associated with traditional grid-point simulation methods. In reference [25], to tackle the low efficiency of the traditional grid-point method in calculating constellation area coverage, sampling theory was introduced to reduce the number of grid points, thereby significantly improving computational efficiency. The literature [26] proposed an adaptive hierarchical grid structure based on hexagons and applied it to the rapid determination of points within spherical polygons, improving the determination efficiency. The literature [27] introduced an analytical model to calculate the intermittent coverage of the Earth by satellite constellations with repeated ground tracks.
In the design of specific parameters for constellation configuration, existing satellite constellation optimization methods mainly rely on empirical formulas and heuristic algorithms [28,29,30], which encounter challenges such as high computational demands, low efficiency, and difficulty in guaranteeing optimal solutions. This is especially true when dealing with complex constellation design problems that involve multiple objectives and constraints, where traditional methods often fail to meet practical requirements. Furthermore, the design of remote sensing, communication, and navigation constellations involves multi-disciplinary integration [31,32,33], making the optimization process even more complex. To overcome these limitations, recent years have seen researchers beginning to apply intelligent optimization algorithms, such as genetic algorithms, to constellation optimization design. The literature [34] combined genetic algorithms with sensitivity analysis to optimize small satellite orbits, addressing the issues of complexity, large computational load, and inefficiency in traditional orbit design methods. The literature [35,36,37] explored satellite constellation orbit optimization methods based on particle swarm optimization and ant colony algorithms, respectively. These studies designed fitness functions that considered multiple optimization objectives, such as the number of satellites, coverage area, and revisit time, and applied the algorithms to solve the optimization problems. The literature [38] combined genetic algorithms with semi-analytic methods to address the efficiency issues of traditional genetic algorithms in satellite orbit design optimization.
A core challenge in constellation design is determining how to achieve the optimal trade-off between coverage and resolution, given the constraints of limited budget and technical feasibility. This requires selecting the appropriate orbital altitude, inclination, field of view, number of satellites, and configuration.
Low Earth orbit (LEO) satellites offer high resolution but limited coverage [39], while geostationary satellites provide wide coverage at the expense of relatively lower resolution [40]. The orbital inclination determines the geographical area that the satellite can cover, while the field of view dictates the area that can be observed during a single pass [41]. Increasing the number of satellites can reduce the revisit cycle and improve data timeliness, but this also increases both the cost and operational complexity [42]. Additionally, the reliability of the constellation must be considered, including factors such as failure rates and redundancy design [43,44]. Therefore, it is crucial to strike a balance between high resolution and broad coverage, systematically weighing various factors through optimization algorithms to achieve the best technical performance.
To address the challenges of balancing computational efficiency with versatile applicability in large-scale constellation design, this paper proposes an innovative framework based on a genetic algorithm. The main contributions of this work are as follows:
(1)
A Versatile, Multi-Objective Optimization Framework: This paper develops a flexible GA-based model capable of integrating the disparate design requirements of remote sensing, communication, and navigation constellations. The framework supports dual optimization objectives, such as minimizing satellite count or maximizing performance, and can analyze various regional targets and payload configurations.
(2)
An Efficiently Integrated Fitness Evaluation Method: A key innovation is the holistic integration of the GA with a high-efficiency coverage analysis engine. By using a refined scattering strategy, the method in this paper establishes an accurate fitness evaluation baseline that significantly mitigates the computational bottleneck often encountered in prior GA applications to large-scale systems.
(3)
A Balanced Hybrid Evolutionary Strategy: The GA employs a balanced strategy combining elitism with multi-point crossover and mutation. This approach ensures the iterative search converges toward a near-optimal solution while effectively maintaining population diversity to avoid local optima and adhere to all mission constraints.

2. Methodology

2.1. Constellation Coverage Performance Analysis Method

2.1.1. Uniform Point Distribution Algorithm on the Earth’s Surface

Constellation coverage performance analysis involves calculating the distribution and coverage of satellites in space. By employing a scattering point method, the distribution of targets in space can be simulated, allowing for an analysis of the satellite’s coverage performance on the Earth’s surface. While the traditional latitude–longitude-based division or scattering strategy is easy to implement, it inevitably leads to unevenly sized units in different latitude regions, especially in high-latitude areas. This division results in a non-uniform point density, making the high-latitude regions appear denser than the low-latitude regions, as shown in Figure 1.
This inhomogeneity may introduce bias into the optimization results of constellation design, causing the system to favor coverage of high-latitude regions while relatively neglecting the coverage performance of low-latitude areas. Therefore, to ensure a balanced and accurate global coverage, an algorithm capable of achieving a uniform distribution of points across the target area is required before analyzing visibility.
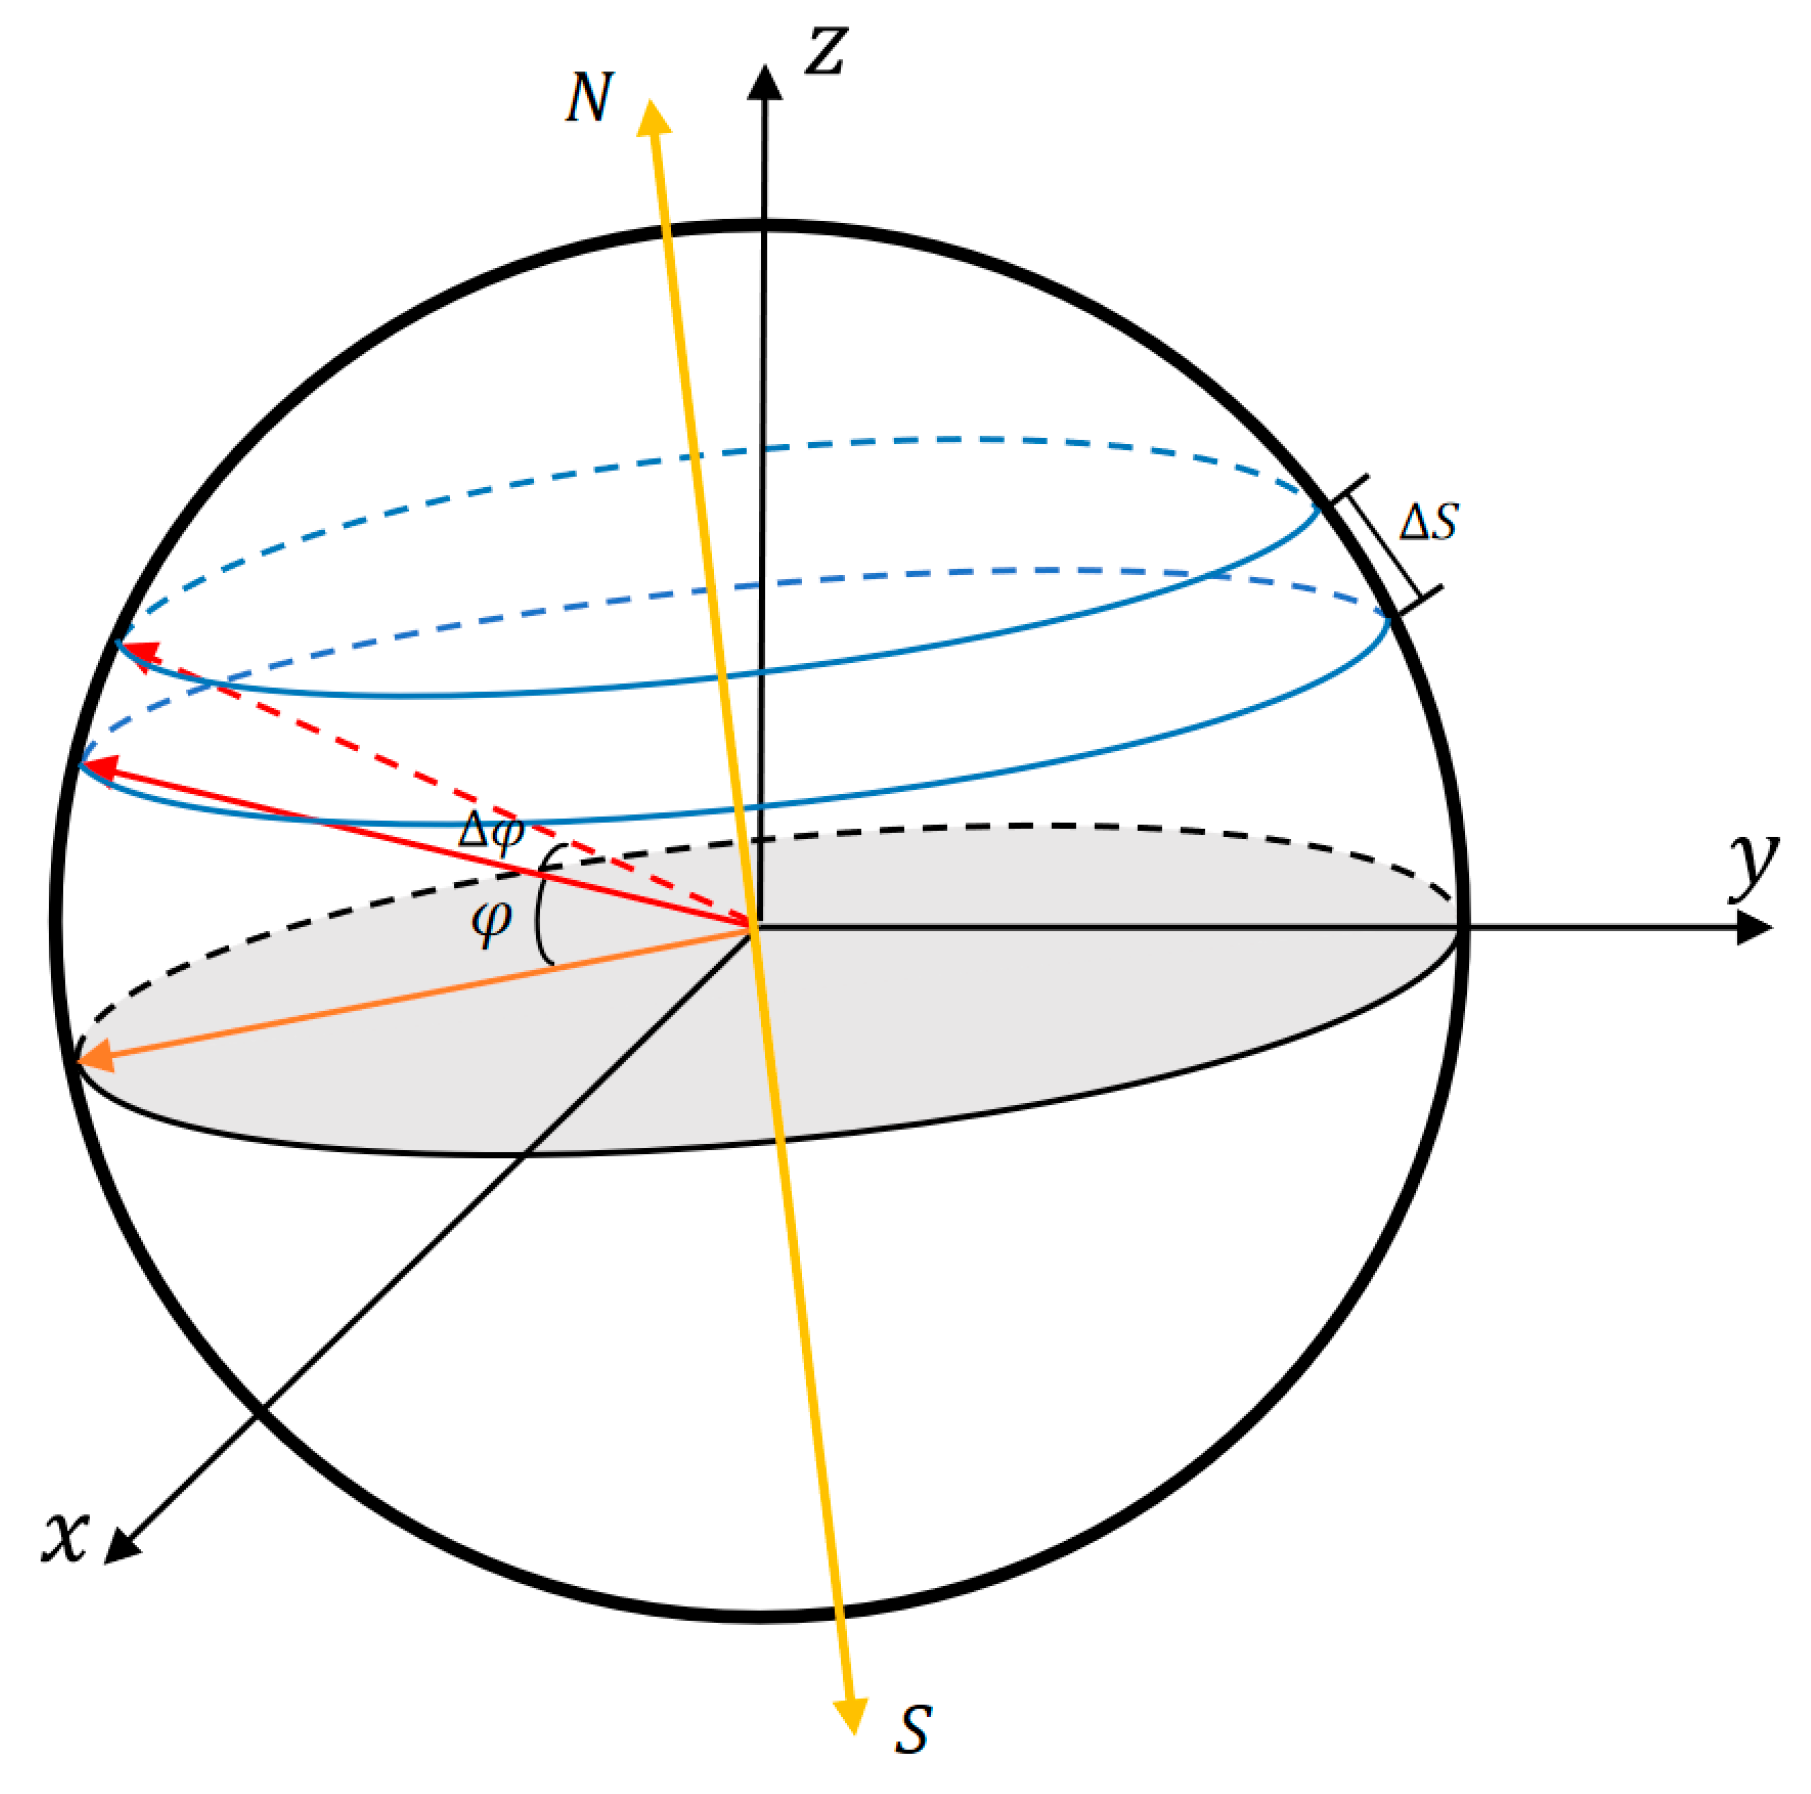
For a sphere, the area of a segment at a given latitude can be calculated using the following formula:
Δ S = ( Δ φ R e ) ( 2 π R e cos ( φ ) ) = 2 π Δ φ cos ( φ ) R e 2
In this formula, Δ S represents the area of the latitude segment, φ is the angle between the equatorial plane and the line connecting the center of the sphere to the lower latitude circle, Δ φ is the angle formed by the lines connecting the center of the sphere to the two boundary latitude circles, and R e is the radius of the sphere, as shown in Figure 2.
To achieve a uniform distribution of points in the target region, this paper proposes a random distribution function. Let X be a random variable uniformly distributed within the range of [−1, 1]. By mapping X to Y = a r c sin ( X ) , where Y represents latitude, a random distribution related to the latitude of the Earth’s surface can be obtained.
This mapping ensures that the number of points N Y within the specified latitude range Y Y m i n , Y m a x is proportional to the area of the Earth’s surface within that interval, i.e.,
N Y = n u m o f ( X [ sin ( Y min ) , sin ( Y max ) ] )
N Y sin ( Y max ) sin ( Y min ) Δ Y cos ( Y )
Since X is uniformly distributed, the distribution of Y ensures the uniform distribution with respect to the area on the sphere. This function is capable of generating a set of points that is consistent with the variation in the Earth’s surface area as a function of latitude as shown in Figure 3. Figure 3 illustrates the uniform distribution of scattered points across the globe, particularly in high-latitude regions, serving as a schematic representation of uniform point distribution that aligns with the Earth’s surface area variation with latitude.

2.1.2. Interaction Mechanism and Calculation Method Between Satellites and the Ground

Conical Mode
The conical field of view [45] is typically associated with sensors that are designed to detect or observe signals in a specific direction, such as the antennas of certain communication satellites. Under this conical field of view, the interaction between the satellite and the ground is depicted in Figure 4. It can be observed that the conical half-angle is represented by P , with E indicating the apex of the conical field of view, S representing any point on the ground, and r being the radius of the conical field of view.
Judgment: If s p < r , the target ground point is visible within the satellite’s field of view; if s p > r , the target ground point is outside the satellite’s field of view and is not visible.
If the distance from the satellite to the ground is H , the geocentric angle corresponding to the maximum visible range of the satellite is given by:
φ max = arccos R e ( R e + H )
As illustrated in Figure 5:
In the design of the communication link between the satellite and the ground target, the line-of-sight angle between the satellite and the ground target can be determined if the position R of the ground point T in the Earth-centered coordinate system, as well as the satellite’s position r ( t ) and velocity v ( t ) at a specific time relative to the Earth-centered coordinate system, are known [46]. If the line-of-sight angle between the satellite and the ground target exceeds the preset maximum threshold φ max , the satellite will not be able to observe the ground target directly. Conversely, if the line-of-sight angle is less than φ max , the satellite’s roll and pitch angles relative to the ground target must be further calculated. In general, the calculation of roll and pitch angles is not required for communication satellites in conical mode; therefore, this will be discussed in detail in the context of rectangular mode.
Rectangular Mode
The rectangular field of view pattern is commonly used in push-broom imaging satellites, such as multispectral imagers on Earth observation satellites, and is capable of providing continuous ground coverage images. The calculation of the rectangular field of view is similar to that of the conical field of view, and its interaction model is shown in Figure 6. From the diagram, the horizontal and vertical half-angles can be determined. Here, P represents the center of the rectangular field of view, and S represents any ground point.
By using a simple mathematical approach, if point S lies within the rectangular area a b c d , the target ground point is visible in the satellite’s field of view. If point S is outside the rectangular area a b c d , the target ground point is not visible within the satellite’s field of view.
Based on the operational mechanism of satellites using the rectangular imaging mode, satellite attitude control is required in most cases. By calculating the roll and pitch angles, it is possible to determine whether the satellite is within the permissible maneuvering range.
When calculating the roll and pitch angles required for satellite pointing to the imaging target, the necessary parameters include satellite orbit data provided by GPS and the coordinates of the ground imaging point in the Earth-centered, Earth-fixed (ECEF) coordinate system. The satellite orbit data provided by GPS consists of 13 pieces of information, specifically: the time of calculation, the six orbital elements, and the position and velocity in the WGS84 coordinate system. The detailed calculation steps for the roll and pitch angles are as follows:
(1)
Calculate the position rSAT, ECI and vSAT, ECI of the satellite in the J2000 inertial coordinate system.
(2)
Using the conversion matrix from the Earth-centered, Earth-fixed (ECEF) coordinate system to the J2000 inertial coordinate system, calculate the position rP, ECI of the imaging point in the J2000 inertial coordinate system:
r P , E C I = L E C I , E C F r P , E C F
where rP, ECI is the position vector of the ground imaging point in the Earth-centered, Earth-fixed (ECEF) coordinate system, and LECI,ECF is the transformation matrix from the ECEF coordinate system to the J2000 inertial coordinate system.
(3)
Using the method for calculating the relative positions of the satellite and the ground imaging point, the vector difference ΔrECI between the satellite and the ground imaging point is calculated in the J2000 inertial coordinate system, based on the satellite position rSAT, ECI and the ground imaging point position rP, ECI in the J2000 inertial coordinate system.
(4)
Using the conversion matrix from the J2000 inertial coordinate system to the satellite orbital coordinate system, the vector difference between the satellite and the ground imaging point is then calculated in the satellite orbital coordinate system as Δrorbit:
Δ r orbit = L o i Δ r E C I
(5)
Based on the vector difference Δrorbit in the satellite orbital coordinate system obtained in the previous section, the required roll angle φ and pitch angle θ for the satellite to point to the ground imaging point can be calculated.
Let
Δ r o r b i t = [ r ( x , o r b i t ) , r ( y , o r b i t ) , r ( z , o r b i t ) ] T
Then φ and θ are calculated as follows:
φ = arctan r y , orbit r z , orbit r y , orbit > 0 , r z , orbit > 0 φ π 2 , 0 π arctan r y , orbit r z , orbit r y , orbit > 0 , r z , orbit < 0 φ π , π 2 π arctan r y , orbit r z , orbit r y , orbit < 0 , r z , orbit < 0 φ π 2 , π arctan r y , orbit r z , orbit r y , orbit < 0 , r z , orbit > 0 φ 0 , π 2
θ = arcsin r x , orbit r orbit
among r orbit = r x , orbit 2 + r y , orbit 2 + r z , orbit 2 .
If the above calculation shows that the maneuvering range requirements are met, the satellite is visible; otherwise, the satellite is not visible.
Regional Target Visibility Estimation
After thoroughly exploring the interaction characteristics of both the conical and rectangular fields of view, this paper introduces a computational framework that integrates the unique imaging properties of multiple fields of view, enabling highly precise simulation of the satellite imaging process.
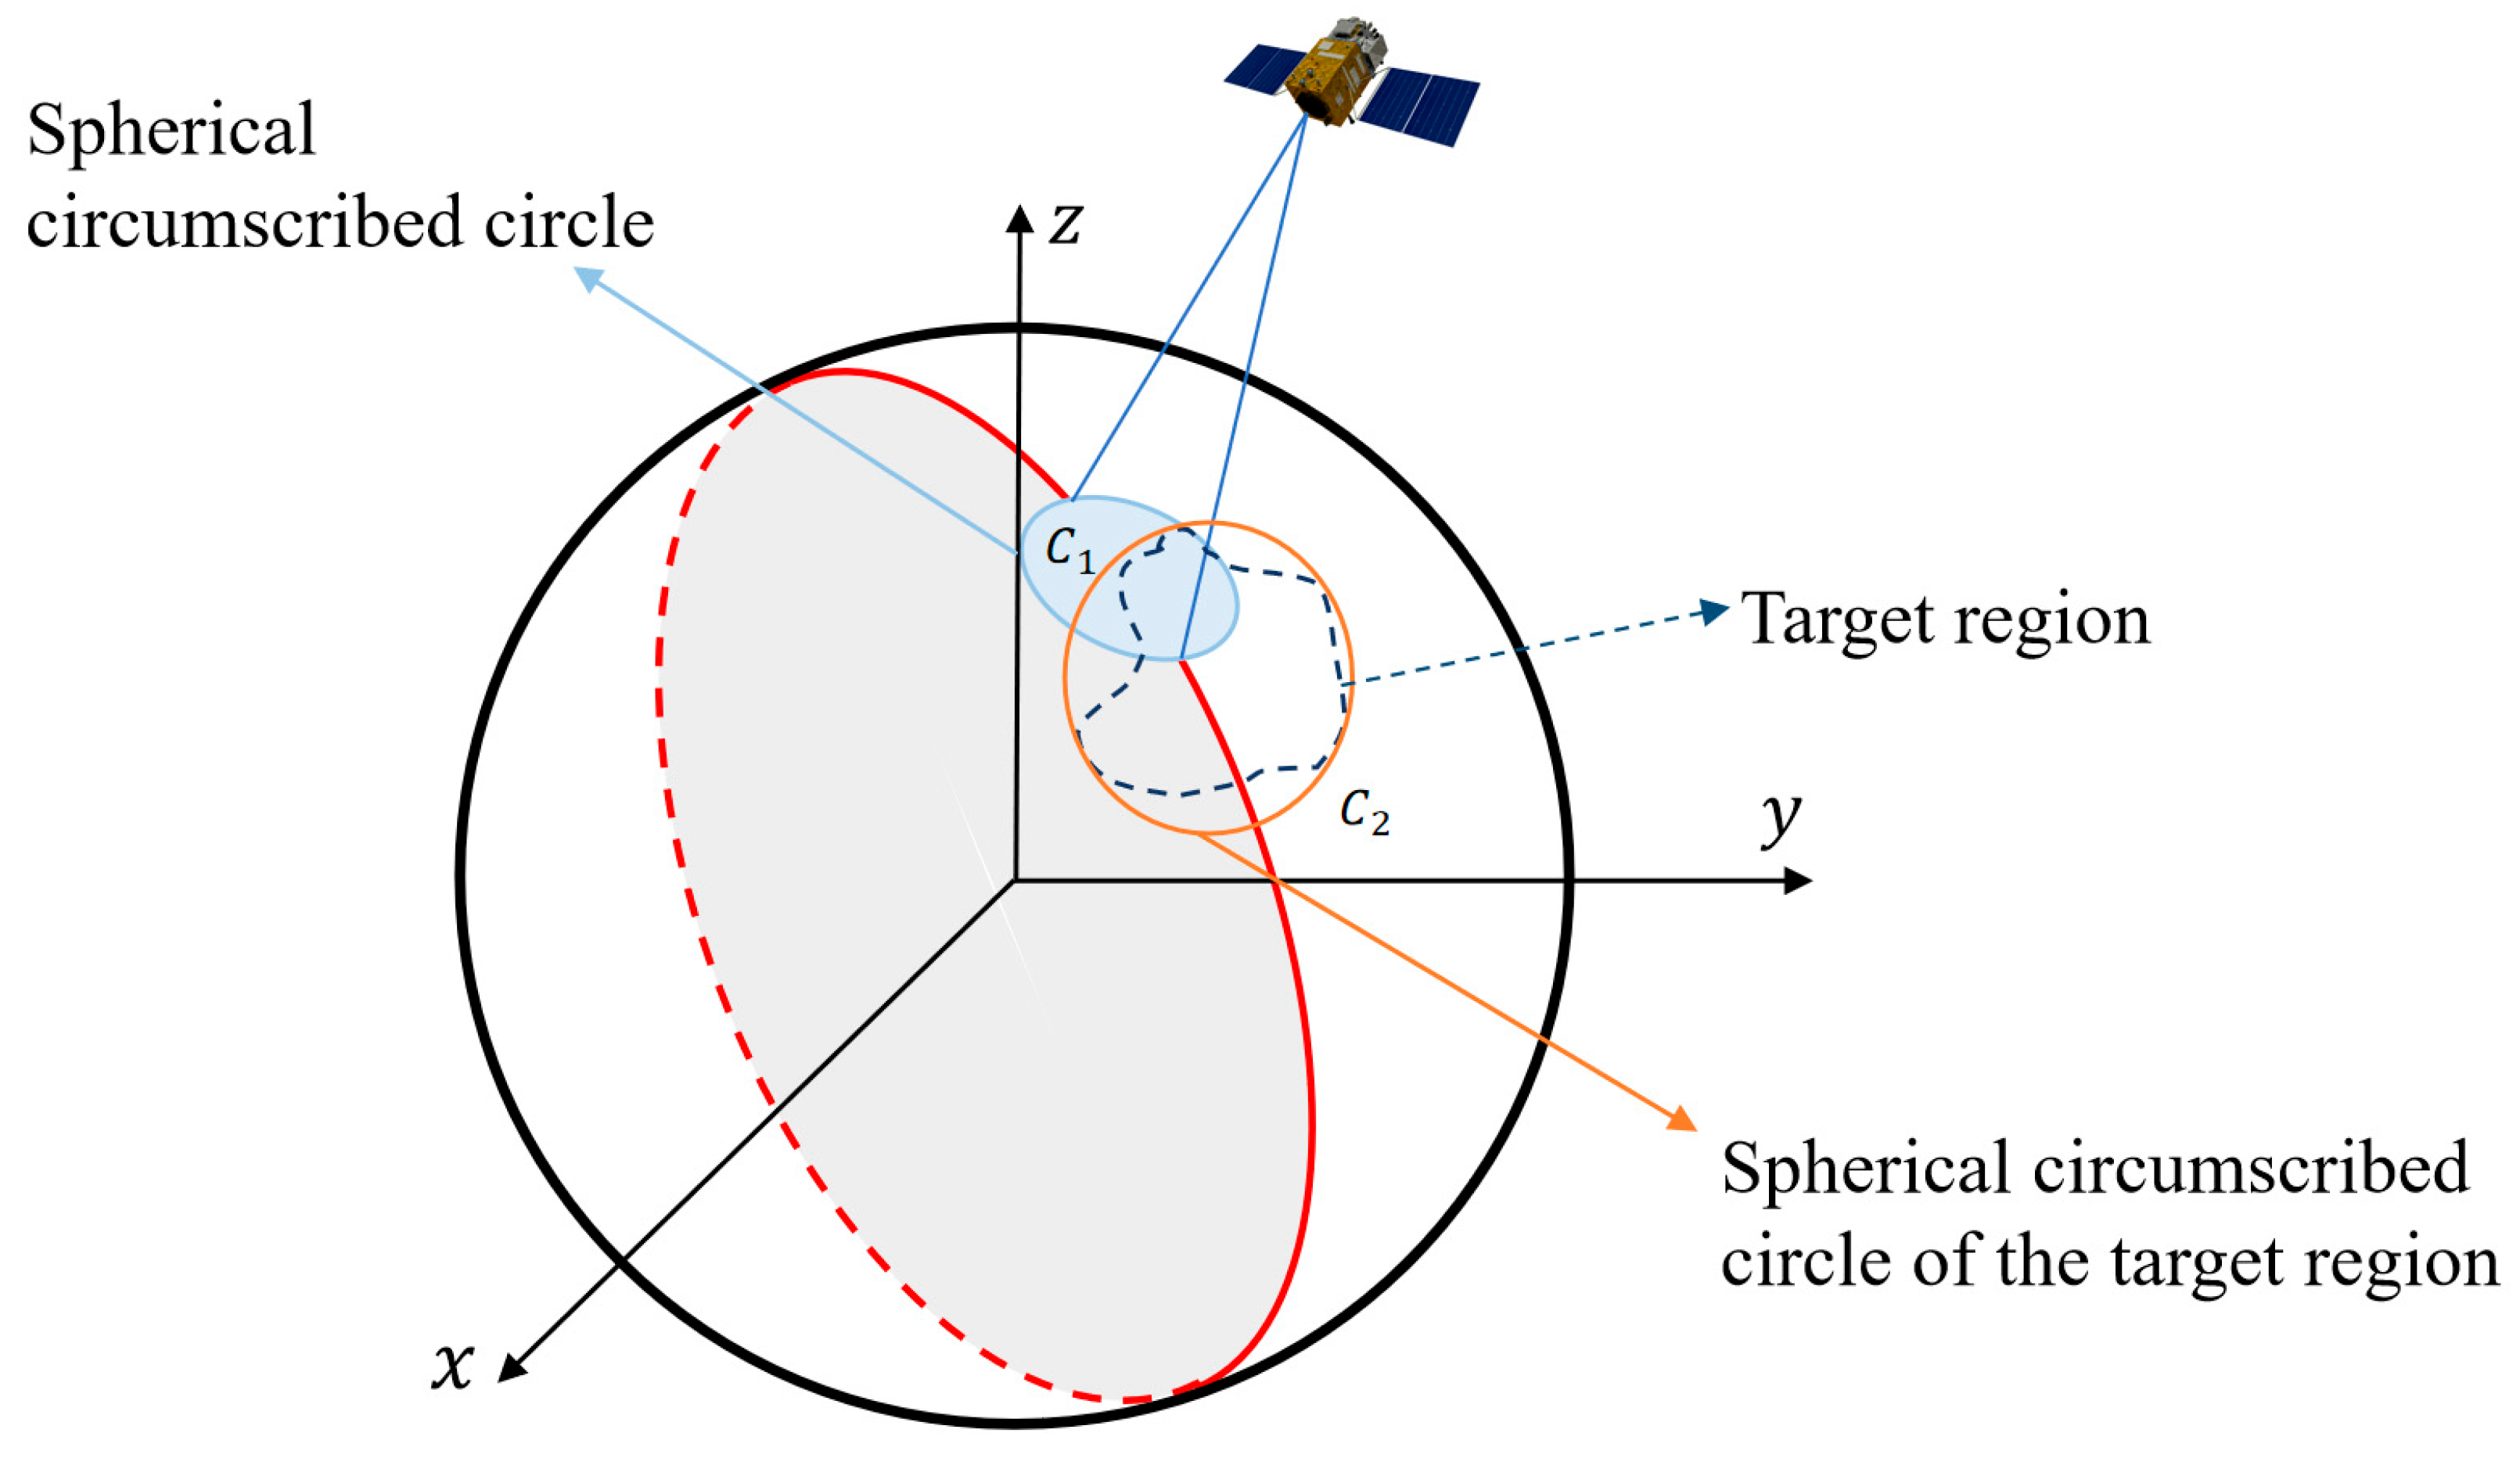
Firstly, a geometric modeling method is employed to determine the spherical circumscribed circle C 1 of the satellite’s field of view for any given geometric shape, ensuring the completeness of the field of view coverage. Next, a similar approach is applied to process the geometric boundary of the target region, constructing its spherical circumscribed circle C 2 , thereby providing an accurate geometric boundary for subsequent calculations, as shown in Figure 7.
On this basis, the method further calculates the intersection area between the spherical circumscribed circle of the satellite field of view and the spherical circumscribed circle of the target region using principles of spherical geometry. The key step in this process is determining the intersection lines of the two spherical circles through analytical geometry, and then calculating the time window during which the satellite field of view and the target region overlap.

2.1.3. Calculation of Constellation Coverage Performance

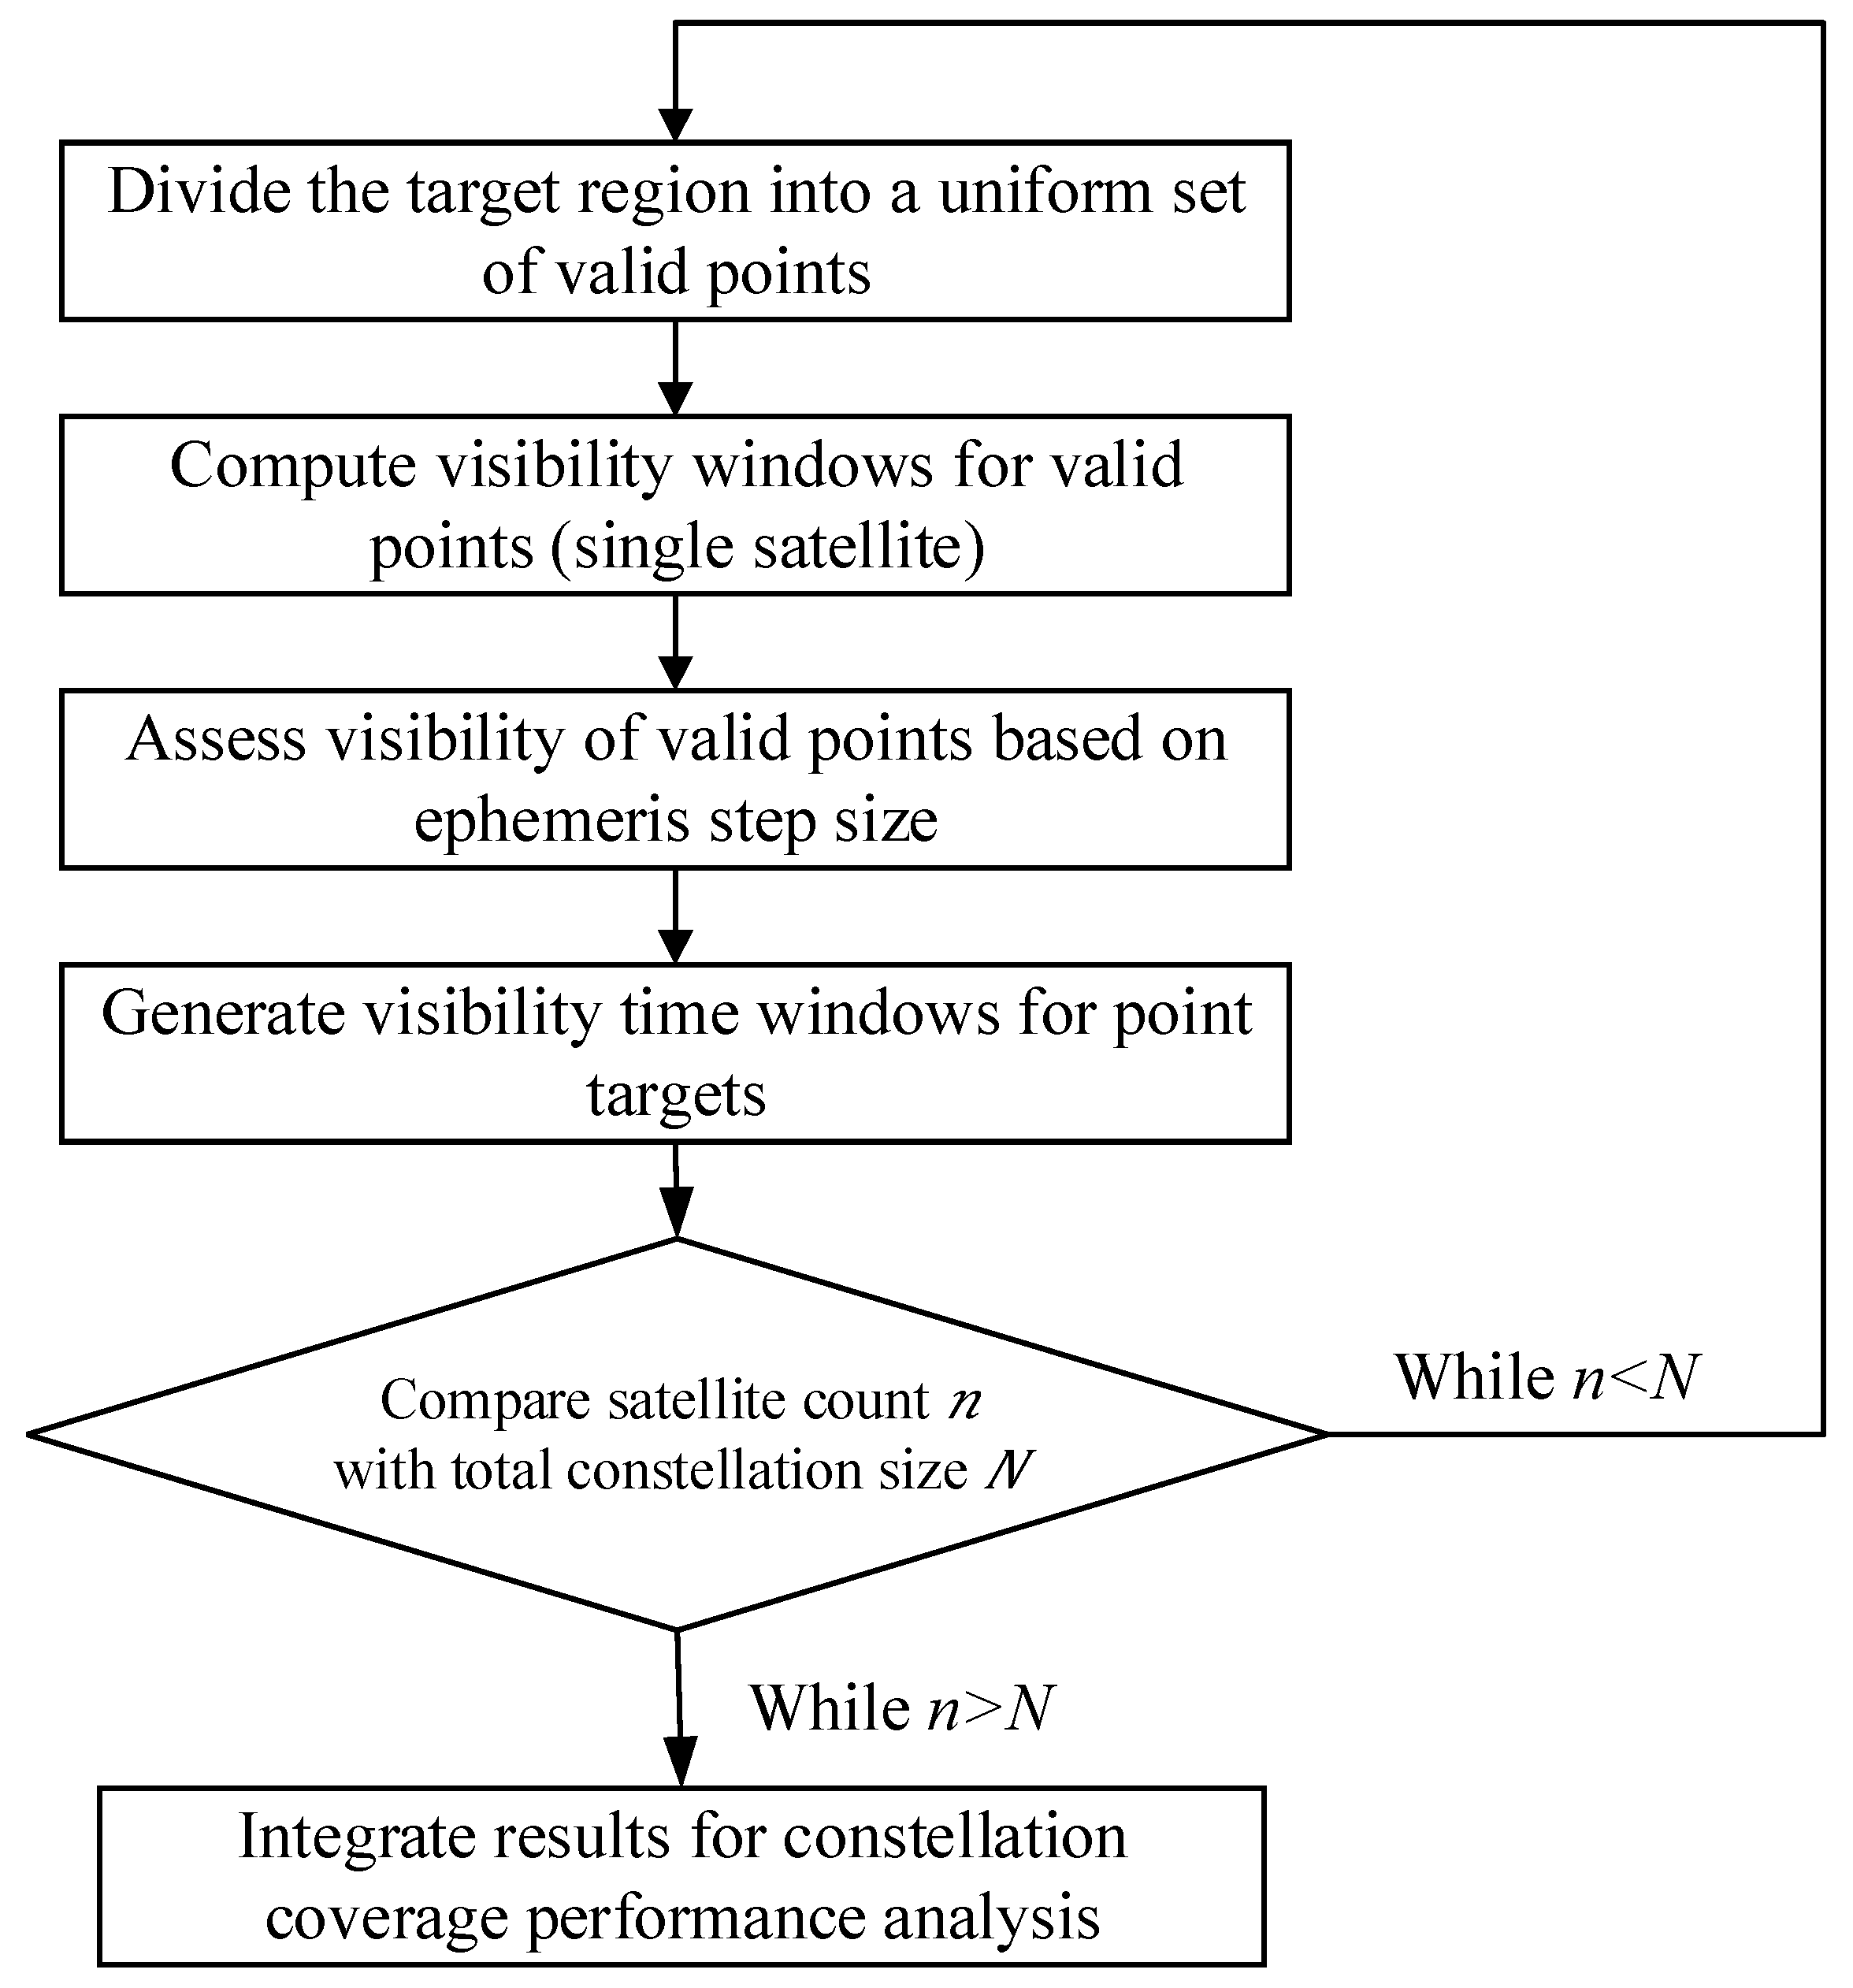
Using the visibility estimation method, the target area is evenly sampled. After transforming the regional target into an effective point set, the visibility window for each satellite in the constellation is calculated for each effective point. In this way, a systematic visibility dataset can be obtained for each satellite in the constellation, detailing its visibility to each point in the target area. This enables the analysis of the overall coverage performance of the constellation over the target area. The flowchart is shown in Figure 8.

2.2. Regional Coverage Constellation Optimization Design

2.2.1. Individual Characteristics of Constellation Design

In the process of constellation design optimization, achieving ideal results within a limited time frame is challenging due to the high degree of freedom in optimizing the parameters of each satellite. Therefore, in the genetic algorithm, this paper primarily adopts specific constellation configurations and optimizes the parameters of these configurations. In genetic algorithms, individual characteristics refer to the differences between individuals in a population. Thus, the configuration of a Walker constellation, when considered as a population for optimization, is fully defined by these three parameters: N (total number of satellites), N p (number of orbital planes), and F (phasing factor). This parameter is a dimensionless integer, ranging from 0 to ( N p 1 ), that defines the phasing relationship between satellites in adjacent orbital planes. Additionally, orbital parameters such as inclination (inc), semi-major axis (axis), eccentricity (e) and a vector f 0 that describes the initial relative position relationship, all of which describe the orbital characteristics of an individual satellite, should also be considered. These parameters collectively determine the uniqueness of the Walker constellation. Therefore, the aforementioned characteristic parameters N , N p , F , i n c , a x i s , e , f 0 constitute the individual characteristics of the Walker constellation within the population. The Rose constellation is a special case of the Walker constellation where the number of orbital planes equals the total number of satellites ( N p = N ), meaning there is one satellite per orbital plane. Therefore, the individual characteristics of the Rose constellation can be obtained as  N , N , F , i n c , a x i s , e , f 0 . In the context of the genetic algorithm, this complete set of characteristics is encoded as a “chromosome,” where each individual parameter (such as inclination or the number of satellites) represents a “gene.”
Based on this, the paper evaluates the adaptability of the constellation according to the methods outlined in Section 1, and optimizes the individual characteristics of the constellation through a genetic algorithm.

2.2.2. Fitness Calculation Algorithm Design

Based on the coverage performance of the integrated constellation and the optimization objectives provided as input, the final adaptive weight and survival threshold are determined. Given the design functionality of the current algorithm, the optimization objectives are categorized into two types: (1) “minimizing the number of satellites while meeting performance requirements,” and (2) “optimizing performance given a fixed number of satellites.” Performance requirements are often expressed as “the percentage of successful revisits at a specific revisit time, with coverage equal to zero.” The following outlines the fitness calculation algorithms for these two distinct optimization objectives:
Minimizing the Number of Satellites for Given Performance Requirements
The performance requirement is defined as the minimum number of satellites needed to achieve continuous revisiting of the entire target area at time t . This requirement ensures that the constellation configuration provides uninterrupted coverage of the target region for a specified period, thereby meeting the specific observational needs. Consequently, constellation configurations that fail to meet this performance requirement should have their competitiveness reduced in the genetic process; in other words, configurations leading to revisit times greater than t should be eliminated. However, to ensure that the genetic algorithm can still receive useful guidance, a penalty mechanism is introduced in the fitness calculation for individuals that are close to, but do not fully meet, the performance requirements. This penalty reflects the gap between the individual’s performance and the ideal requirements.
Since the number of satellites is a key variable in the optimization process, the design of the fitness function should reflect the optimization objective related to the number of satellites. The fitness function can be expressed as follows:
s c o r e = N μ ( 1 χ )
where N represents the number of satellites, μ is the penalty coefficient, and χ denotes the success rate of each effective point in achieving the revisit goal. In this way, the fitness function not only considers the optimization of the number of satellites but also, by imposing penalties on individuals that fail to fully meet the performance requirements, ensures that the algorithm prioritizes revisit success while striving for the minimum number of satellites.
Optimizing Performance for a Given Number of Satellites
Given the number of satellites, it is assumed that, under a certain satellite count requirement, the success rate of revisiting the entire target area for at least t time periods is maximized. This may lead to some parts of the constellation meeting the revisit goal while others do not. To guide the constellation population toward maximizing the revisit success rate, this paper introduces a penalty mechanism for the point sets that fail to achieve the revisit goal. By adjusting the fitness function, this mechanism encourages the constellation configuration to evolve in a direction that can meet the revisit objectives. Therefore, the fitness function can be designed as follows:
s c o r e = μ ( 1 χ )
where μ is the penalty coefficient and χ represents the success rate of each effective point in achieving the revisit goal. In this way, the fitness function not only considers the revisit success rate of each effective point but also penalizes the points that fail to meet the revisit goal. This ensures that the constellation configuration places greater emphasis on the global revisit performance during the optimization process, thereby improving the overall revisit success rate of the entire constellation.
Recording the Optimal Individual
After a new generation is generated, each individual within it is ranked in descending order according to its fitness value. During this process, the best-performing individual from each generation is recorded and compared with the best individual from the current generation. If the optimal individual of the current generation outperforms the recorded best individual in terms of fitness, it is retained as the new optimal individual. Conversely, if the optimal individual of the current generation has a lower fitness than the recorded best individual, it is recorded for use in subsequent iterations.
Selection, Crossover, and Mutation
To accelerate convergence toward the optimal solution, this paper introduces an innovative selection mechanism. This mechanism employs a hybrid, multi-part strategy to form the new generation: a direct selection strategy known as elitism is employed, where the top 20% of individuals with the highest fitness are preserved and carried over to the next generation. Next, 60% of the population is generated through crossover and mutation, with parents for this process selected via the roulette wheel method. Finally, the remaining 20% consists of newly created random individuals to ensure genetic diversity. Parent selection for the aforementioned reproduction process is conducted via the roulette wheel method. This method, also known as the proportional selection operator, is based on assigning a selection probability to each individual according to its fitness value. Specifically, the higher the fitness, the greater the probability of being selected. Assuming the population size is n and the fitness of individual i is F i , the detailed implementation steps of the roulette selection method are as follows:
(1)
The probability of individual i being selected to inherit into the next generation population is calculated as:
P i = F i i = 1 n F i
This represents the production probability.
(2)
Calculate the cumulative probability for individual i :
Q i = j = 1 i P j
(3)
Generate a random number r within the interval [0, 1];
(4)
If r < Q 1 , then individual 1 is selected; otherwise, select individual k such that Q k 1 r Q k .
This describes the roulette selection method. By combining the preservation of the optimal individual with the roulette selection mechanism, this approach facilitates the retention of the best individuals, thereby accelerating the convergence toward the optimal solution.
At the same time, a multi-point crossover strategy is employed, where gene exchange at specific positions of the chromosome is determined based on a preset crossover probability. Conceptually, this means an offspring chromosome (a new constellation design) can be formed by inheriting a subset of its genes—such as the number of satellites ( N ) and orbital planes ( N p )—from one parent, while inheriting a complementary subset of genes—such as orbital inclination (inc) and the phasing factor ( f 0 )—from the other. This process of creating novel combinations of parameters increases randomness and helps the algorithm avoid local optima, while still maintaining the best individuals.
Similarly, a multi-point mutation strategy is applied. If the randomly generated floating-point number exceeds the preset mutation probability, the gene undergoes a random value change. Conversely, if the random floating-point number is smaller than the mutation probability, no mutation is performed. The multi-point mutation strategy aims to expand the algorithm’s search space by introducing random variations at multiple gene locations, thereby improving the likelihood of finding the global optimal solution.

3. Simulation and Discussion

3.1. Analysis for Different Target Regions

The constellation configuration (250/25/10/6878.14 km/45°) is adopted to evaluate the coverage performance over different target regions, progressing through the sequence of “quadrilateral target region—hexagonal target region—irregular target region.” The latitude and longitude coordinates of the boundary points for these differently shaped target regions are provided in Table 1. The quadrilateral target region serves as the starting point for analysis, with its regular boundary and ease of processing making it an ideal choice for simulating satellite coverage of regular building areas or ground stations. Its symmetry and regularity facilitate a preliminary evaluation of coverage performance. Next, the hexagonal target region, serving as an intermediate step, enhances coverage analysis due to its superior tessellation efficiency and its ability to adapt to complex terrain boundaries. Finally, the irregular target region represents the diversity and complexity of real-world terrain. Therefore, fine-grained analysis of this region is essential in the constellation coverage performance evaluation to ensure that satellite signals effectively cover areas with intricate terrain. Other parameter settings are shown in Table 2.

3.1.1. Quadrilateral Target Region

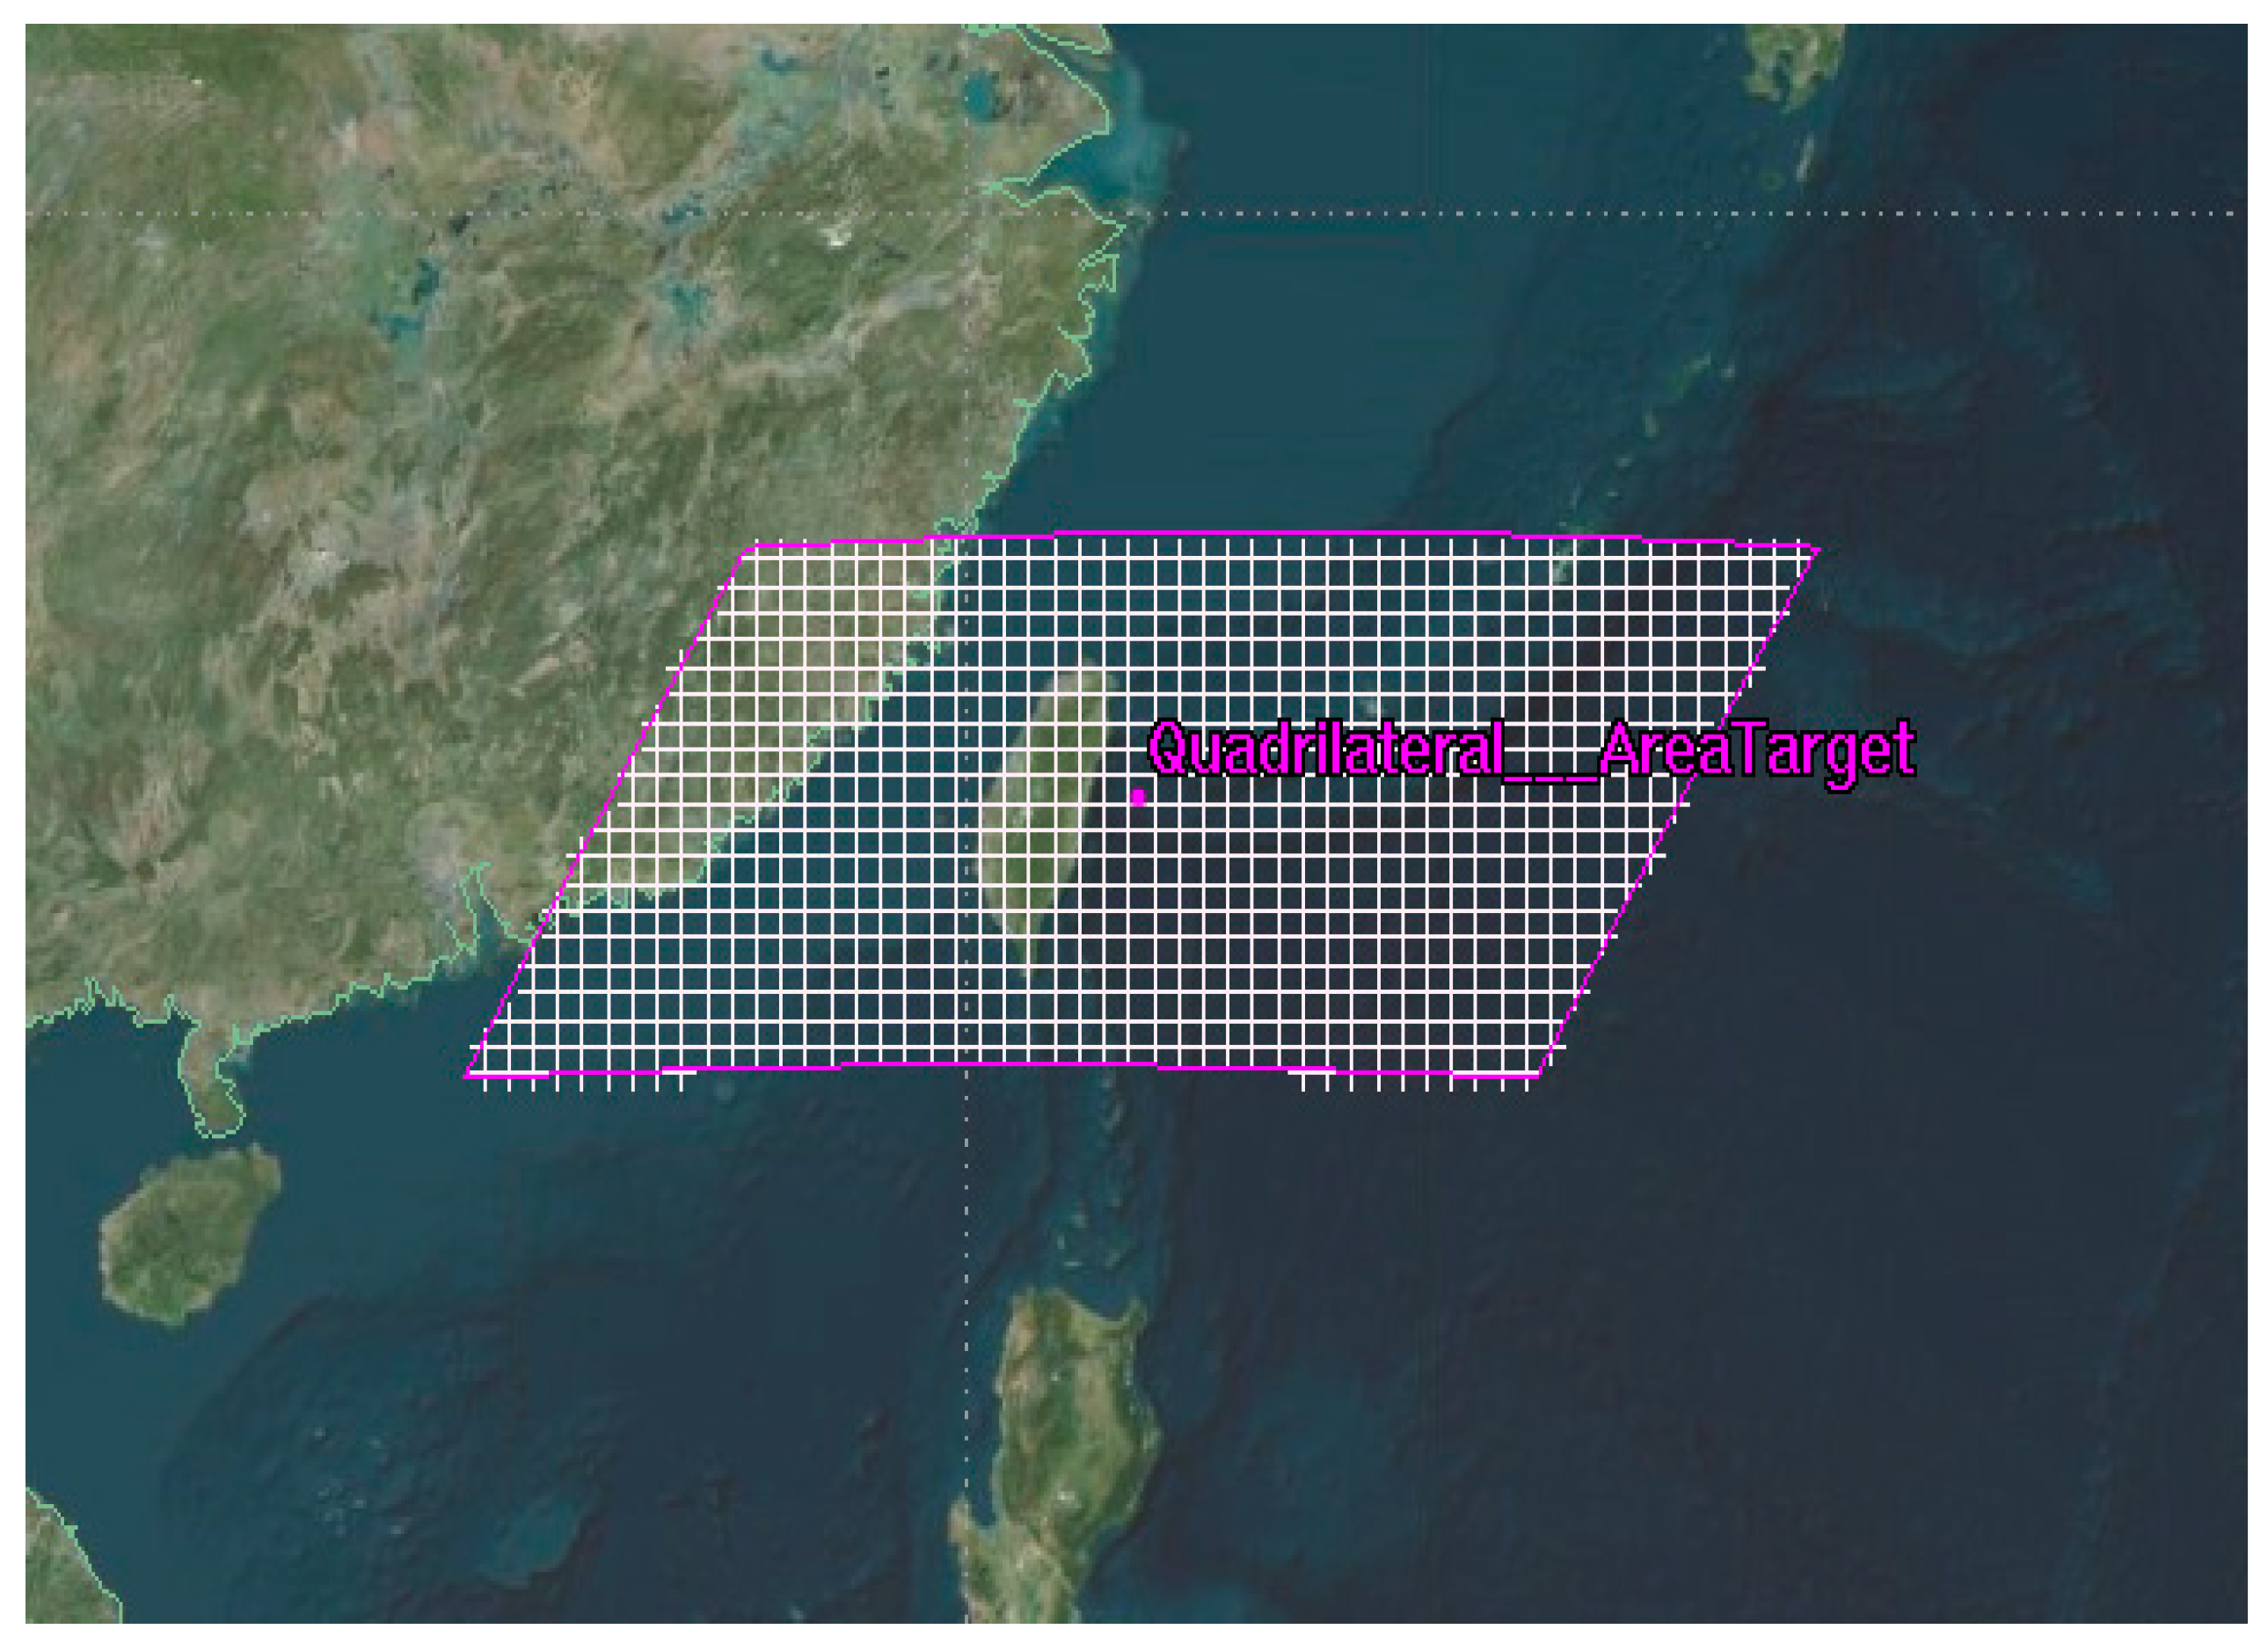
The location of the arbitrarily divided quadrilateral target region is shown in Figure 9.
Based on the algorithm presented in this paper, the coverage time ratio, average coverage multiplicity, and revisit time interval for the quadrilateral target region are compared with the results obtained from the industry-standard simulation software Systems Tool Kit (STK), as shown in Figure 10a–c. The minimum, average, and maximum values displayed in the legend represent the respective minimum, average, and maximum values of the corresponding indicators within the current latitude range.
Based on the analysis of Figure 10a–c, it can be observed that the coverage time ratio for the quadrilateral region, as shown in Figure 10a, first increases and then decreases with latitude, reaching its peak value between latitudes 23° and 24°, with a maximum coverage time ratio of 45%. The average difference between the algorithm’s calculated results and those from STK was only 0.53%. In Figure 10b, the average coverage multiplicity for the quadrilateral region increases with latitude, with the difference between the algorithm’s results and STK’s results averaging 0.01. In Figure 10c, the revisit time intervals for the quadrilateral region show a trend of initially decreasing, then increasing, and finally steadily decreasing with latitude, peaking between latitudes 22° and 23°. The maximum difference between the algorithm’s calculations and STK’s results was within 1 min, with an average difference of 9.63 s. After comparing these multiple indices, it can be concluded that the results obtained from the proposed algorithm are largely consistent with those obtained from STK for the quadrilateral region.

3.1.2. Hexagonal Target Region

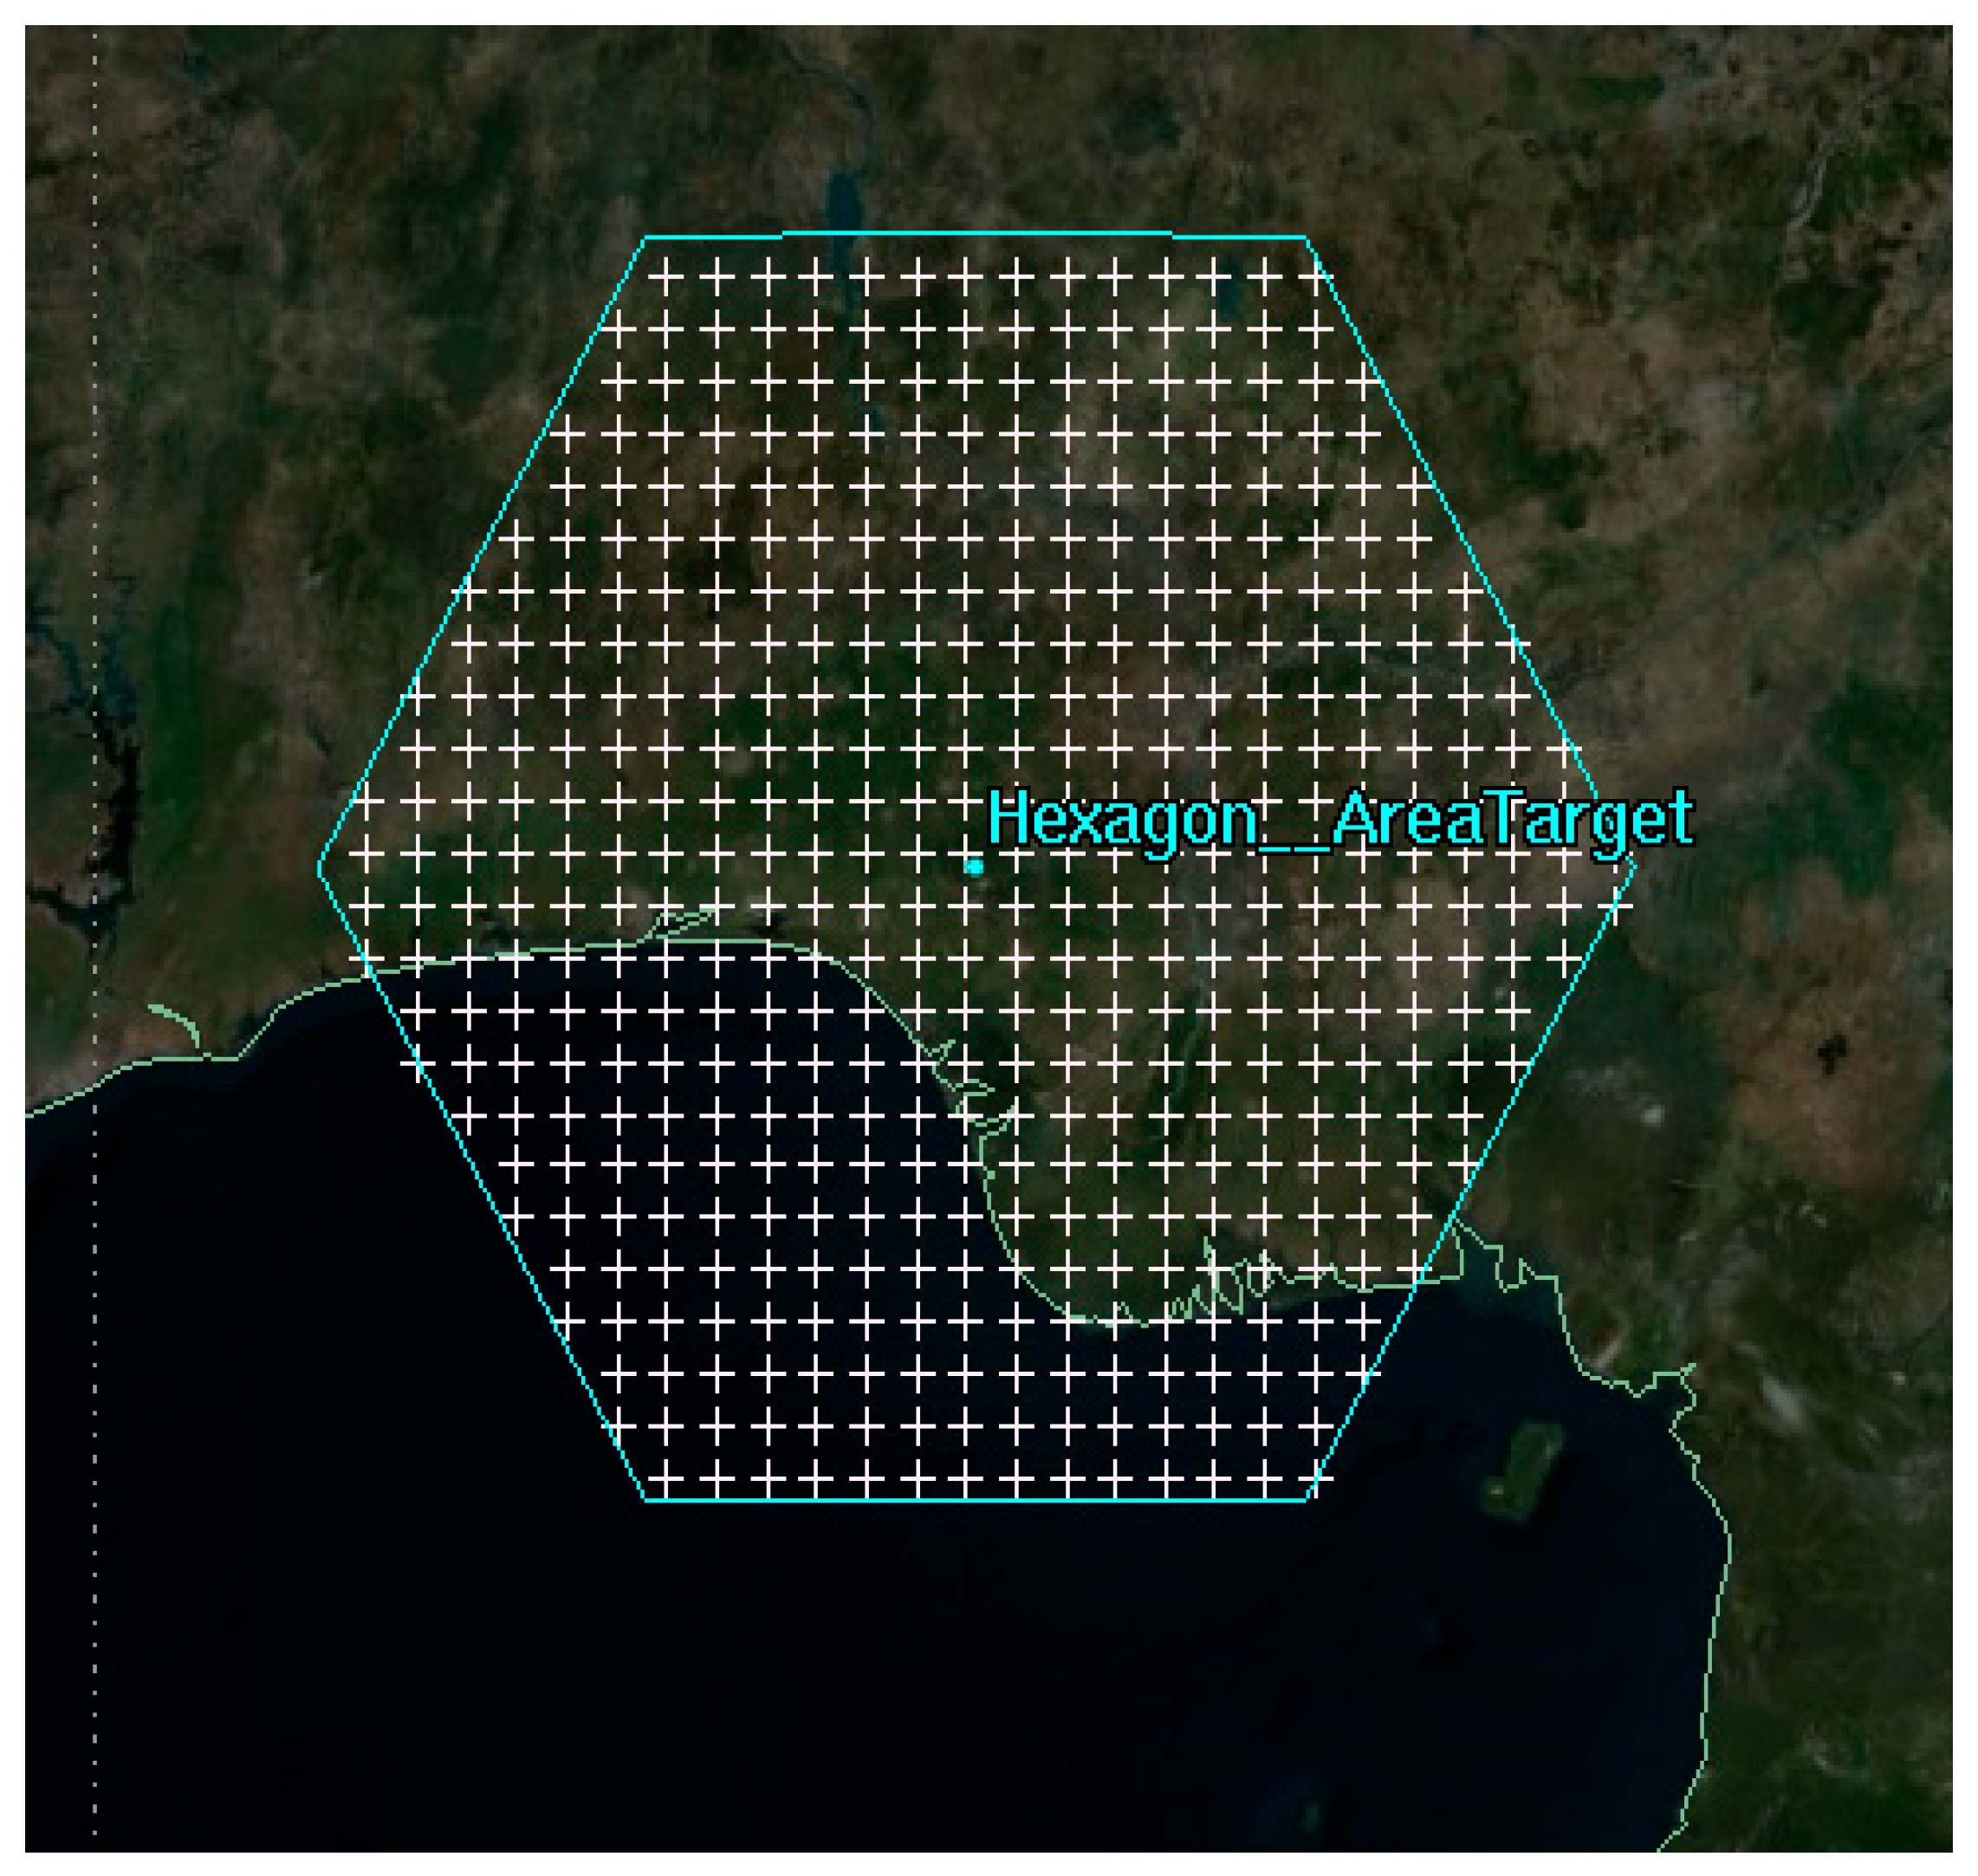
The position of the arbitrarily divided hexagonal target region is shown in Figure 11.
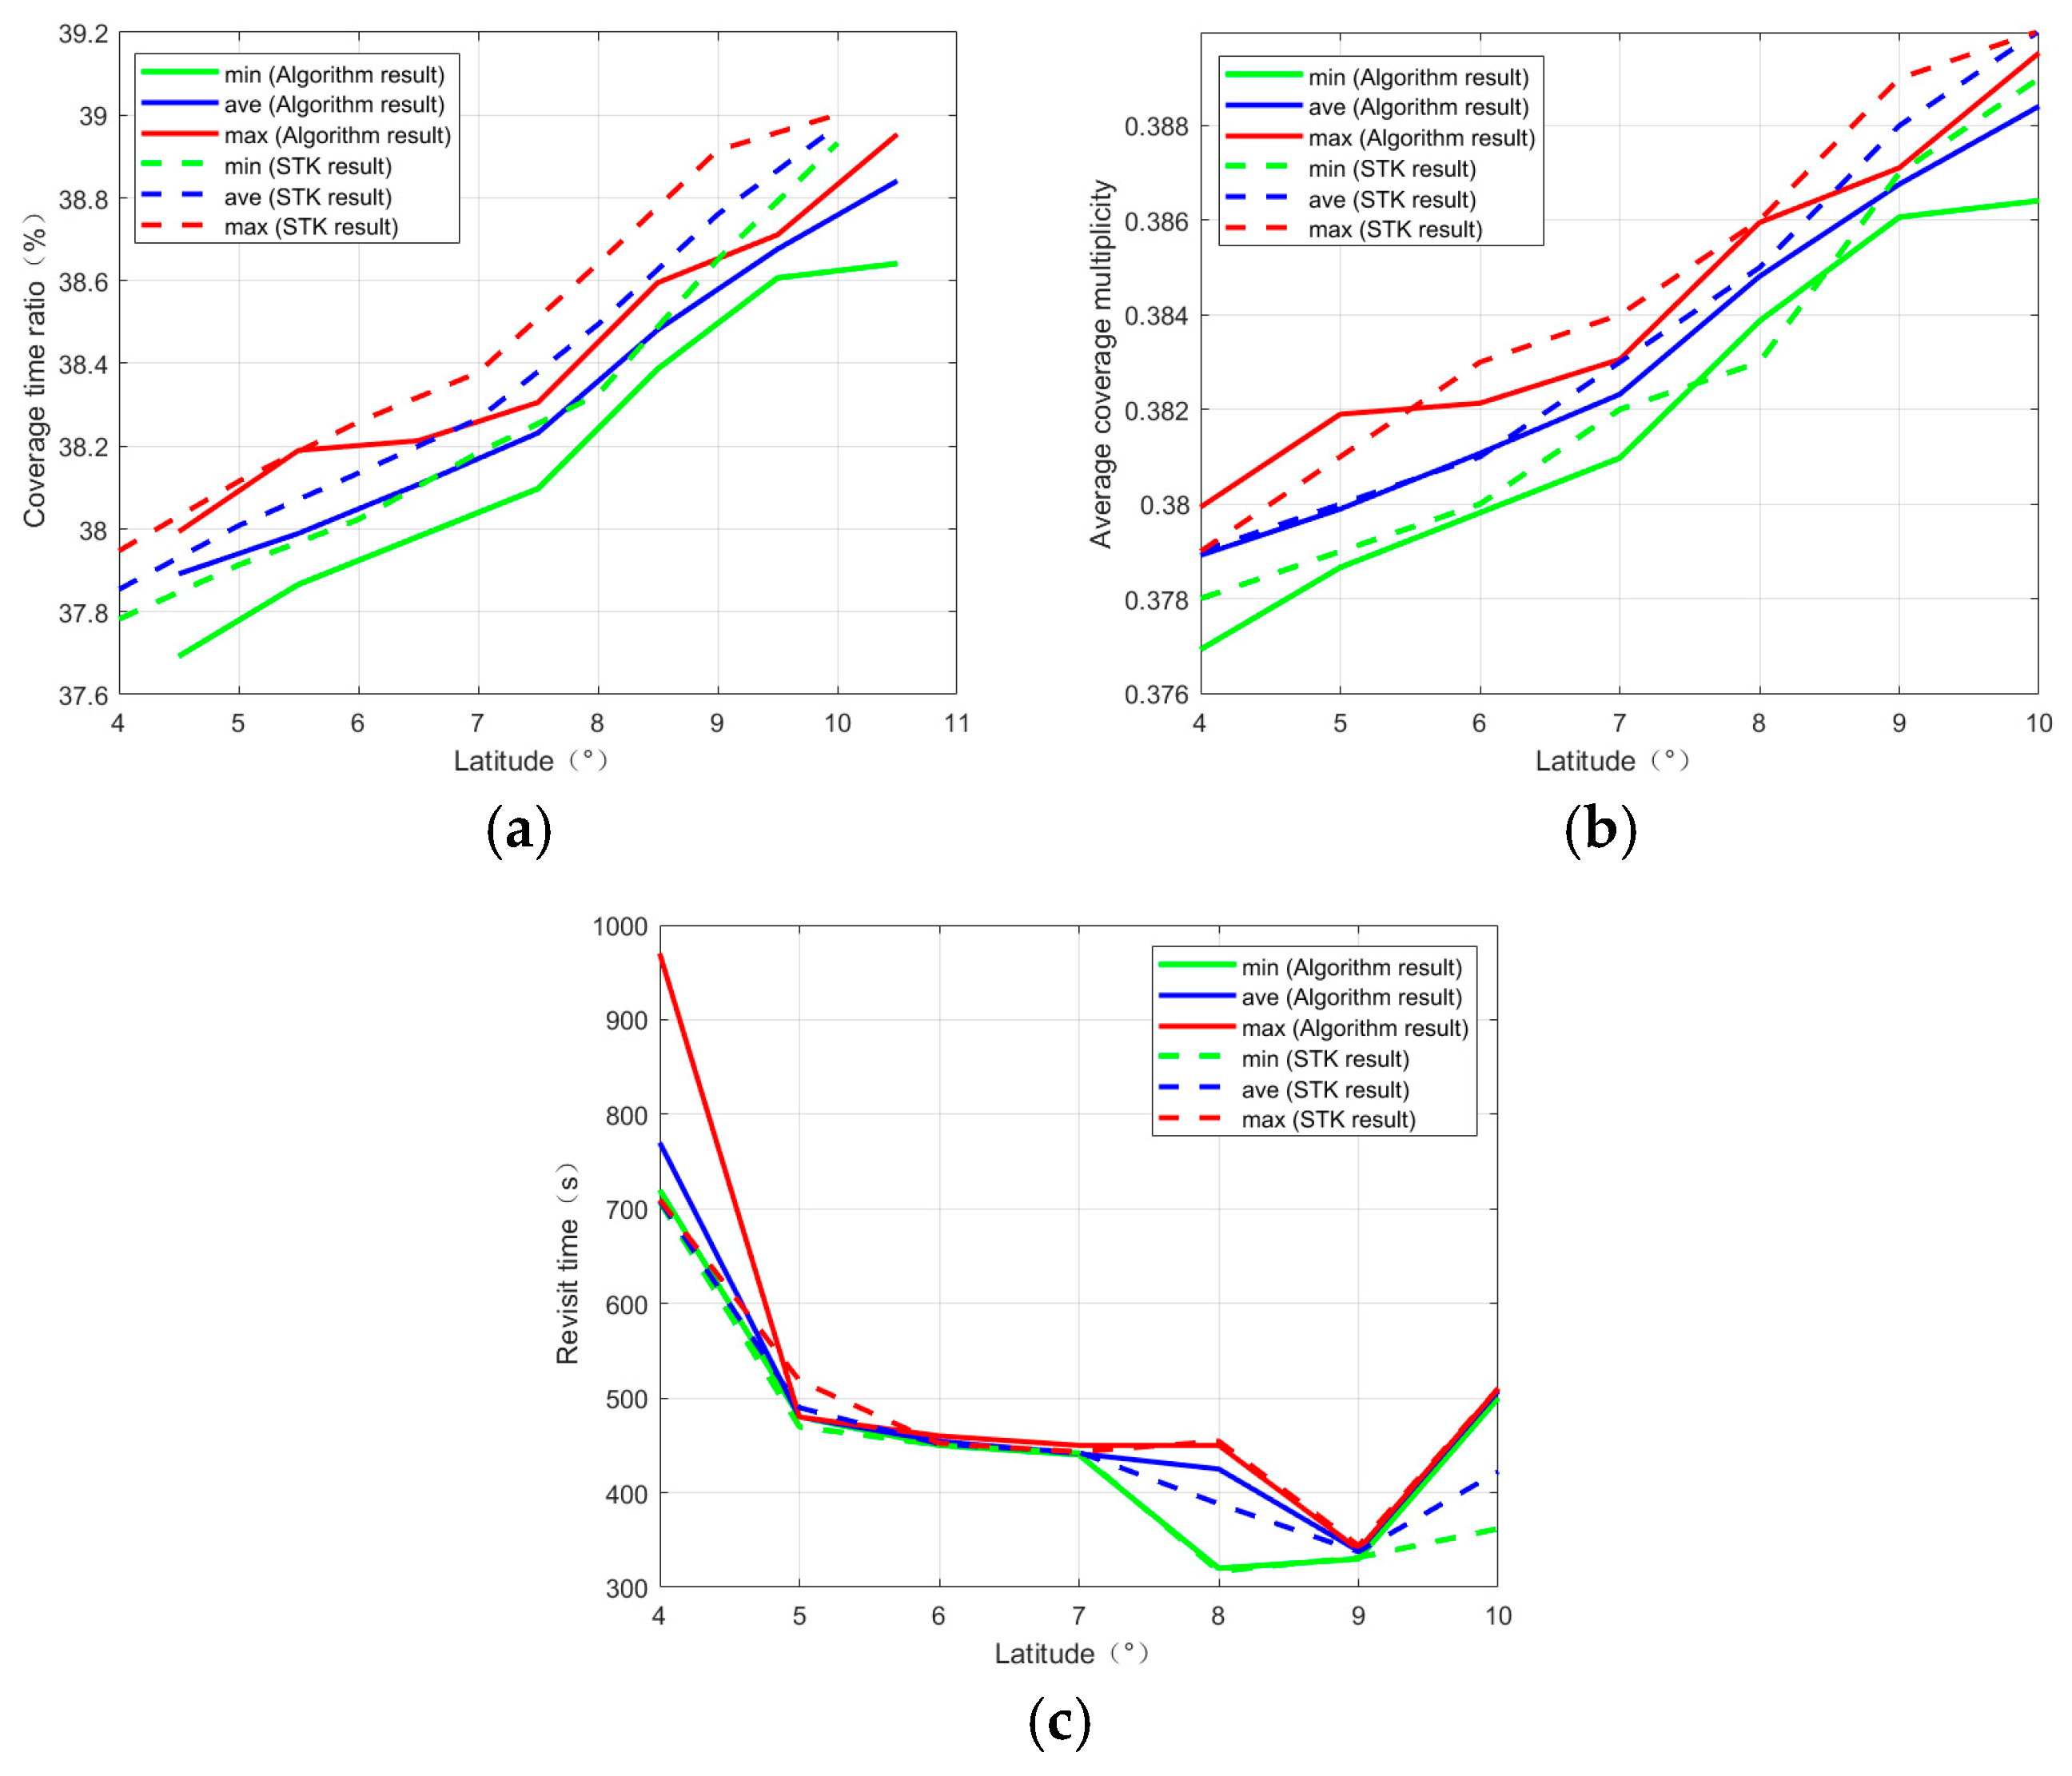
Through the algorithm calculations, the comparison diagrams of coverage time ratio, average coverage multiplicity, and revisit time interval for the hexagonal target region can be obtained, as shown in Figure 12a–c. These figures illustrate the variations in the coverage time ratio with latitude, the average coverage multiplicity with latitude, and the revisit time interval with latitude, respectively. The legend indicates the minimum, average, and maximum values of the corresponding indicators within the current latitude range.
Based on the analysis of Figure 12a–c, it can be observed that the coverage time ratio for the hexagonal region in Figure 12a shows an increasing trend with latitude, with the average difference between the algorithm’s results and the STK results being only 0.07%. In Figure 12b, the average coverage multiplicity for the hexagonal region increases with latitude. The difference between the algorithm’s calculations and the STK results only varies to the third decimal place, with an average difference of 0.001. In Figure 12c, the revisit time interval for the hexagonal region shows an initial decrease with latitude between 5° and 8°, followed by a decrease and then an increase between 8° and 9°. The maximum difference between the algorithm’s results and STK results was 4.3 min, with the average difference being less than 32.77 s. After comparing these multiple indicators, it can be concluded that the algorithm’s calculated values are generally consistent with those obtained using STK for the hexagonal target region.

3.1.3. Irregular Target Region

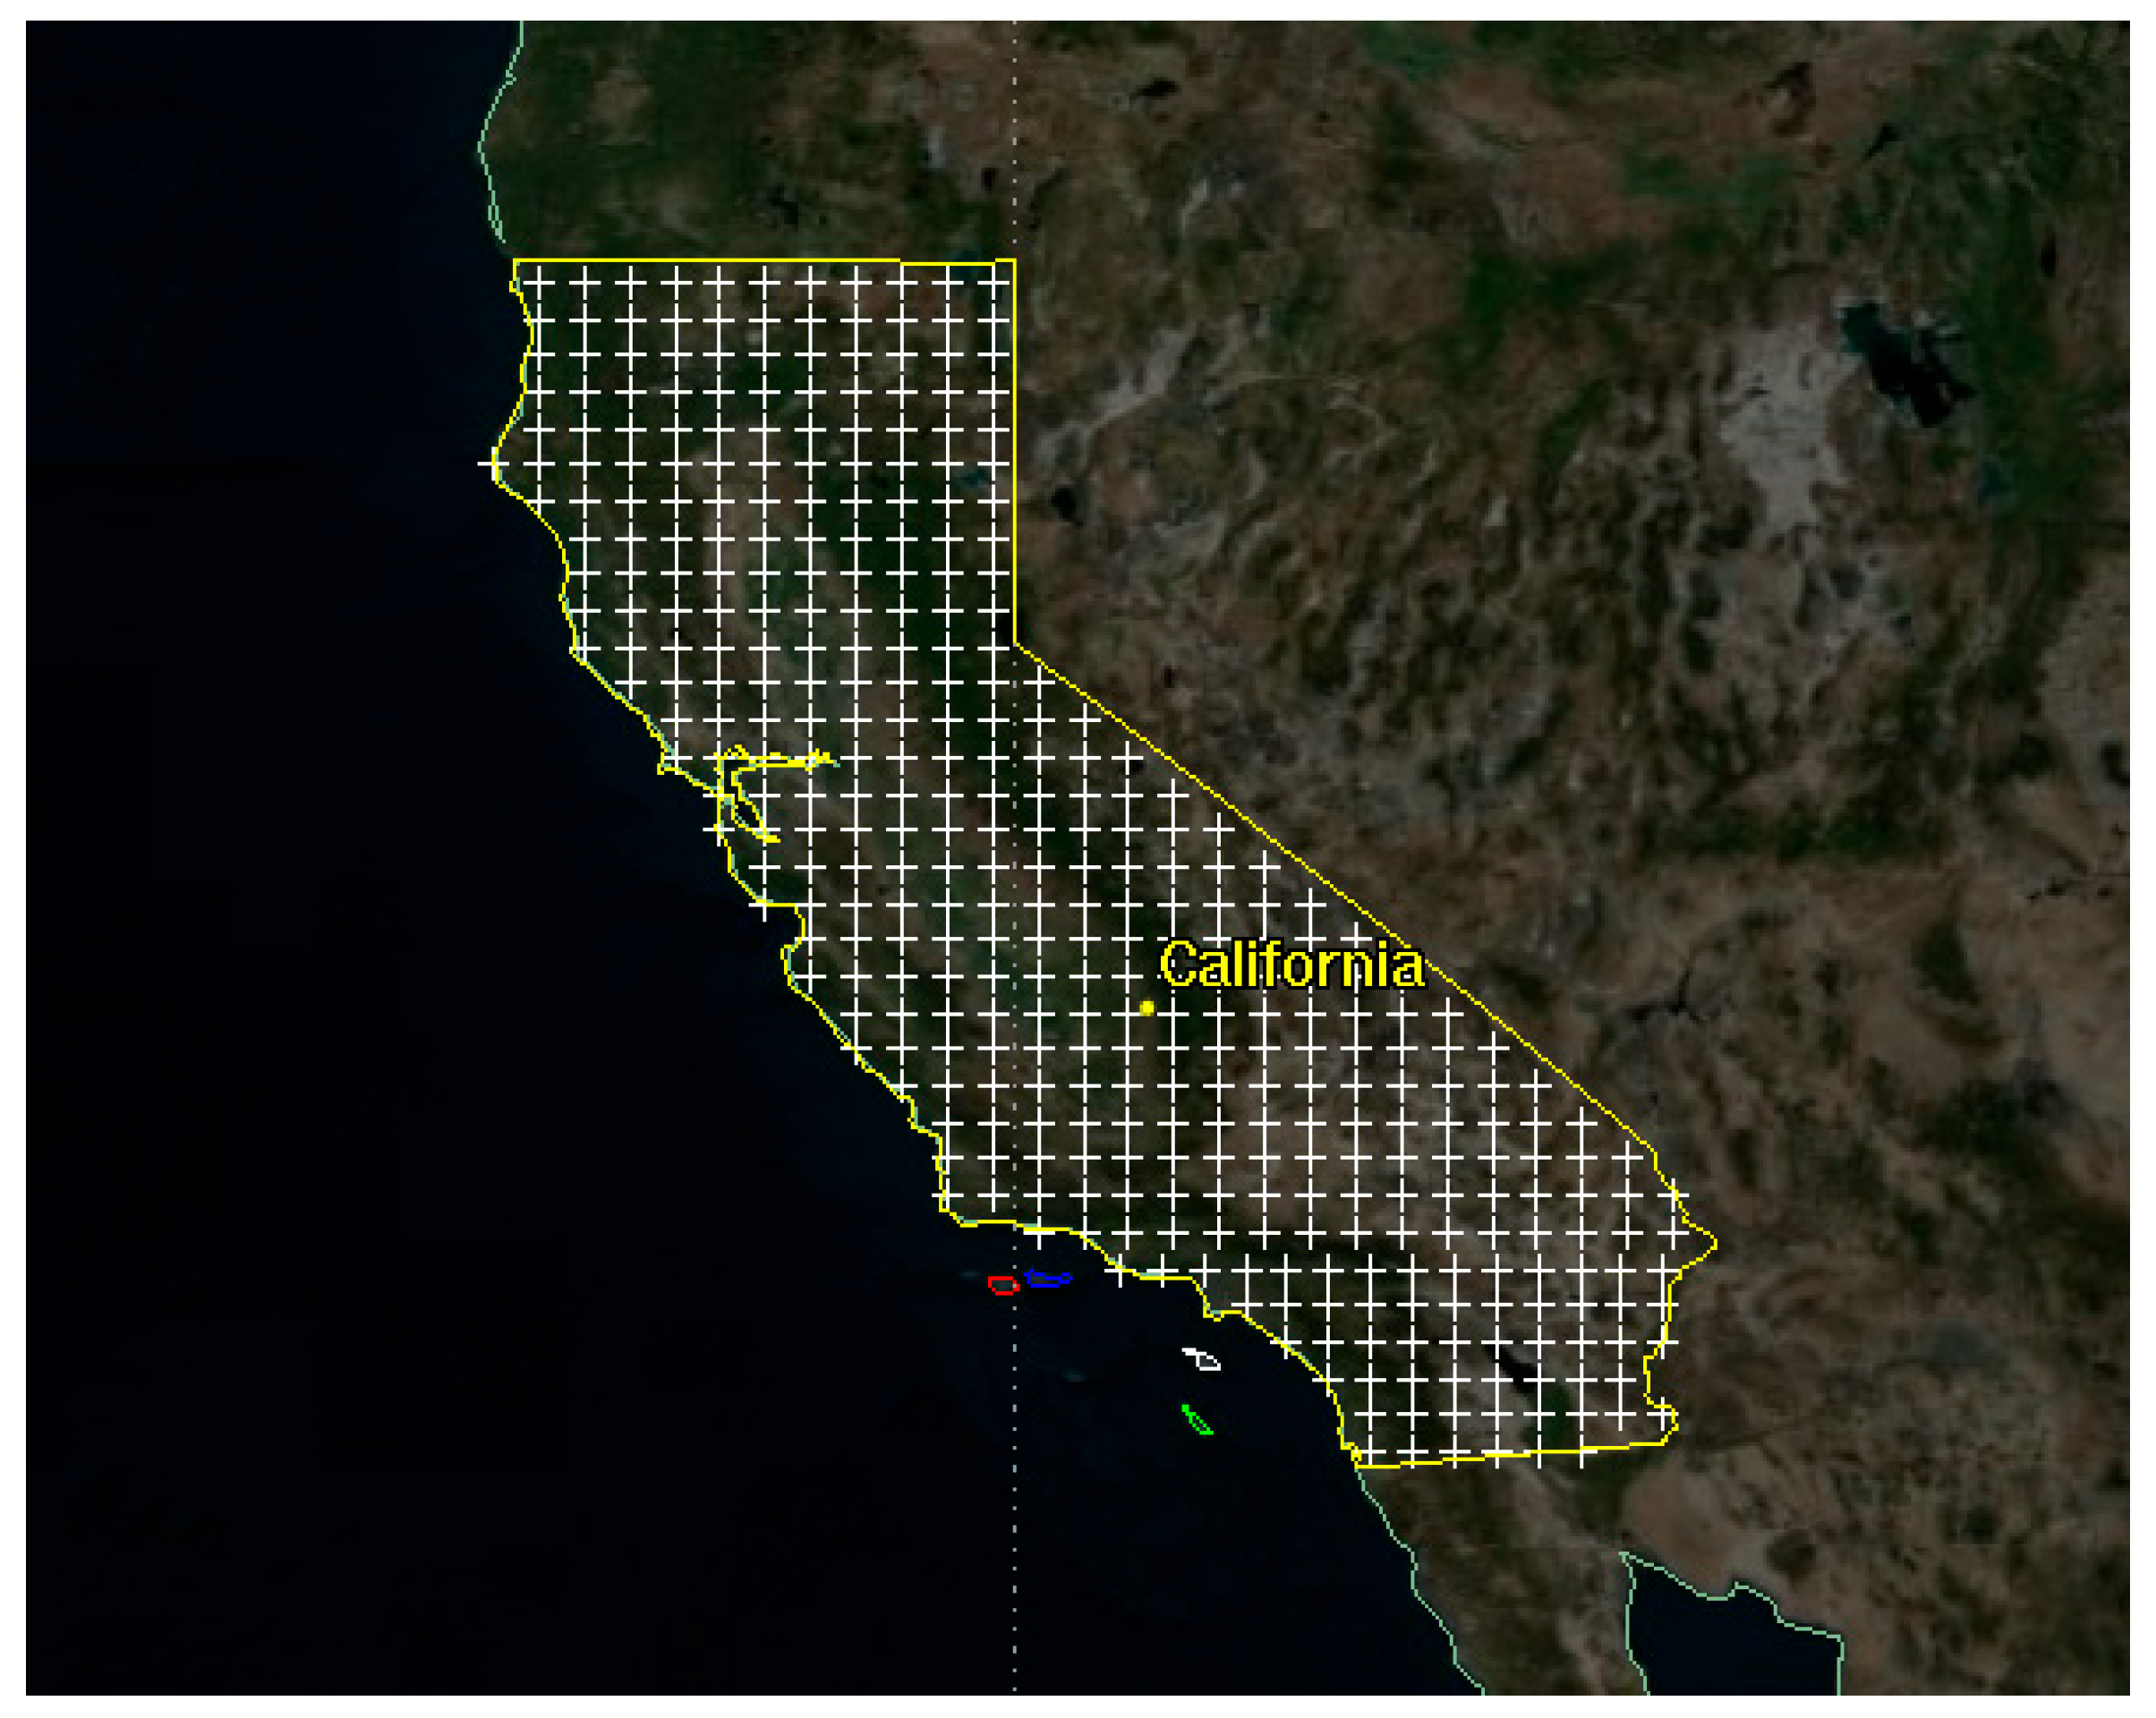
In this paper, California, USA, is used as a case study. Its geographical location is shown in Figure 13.
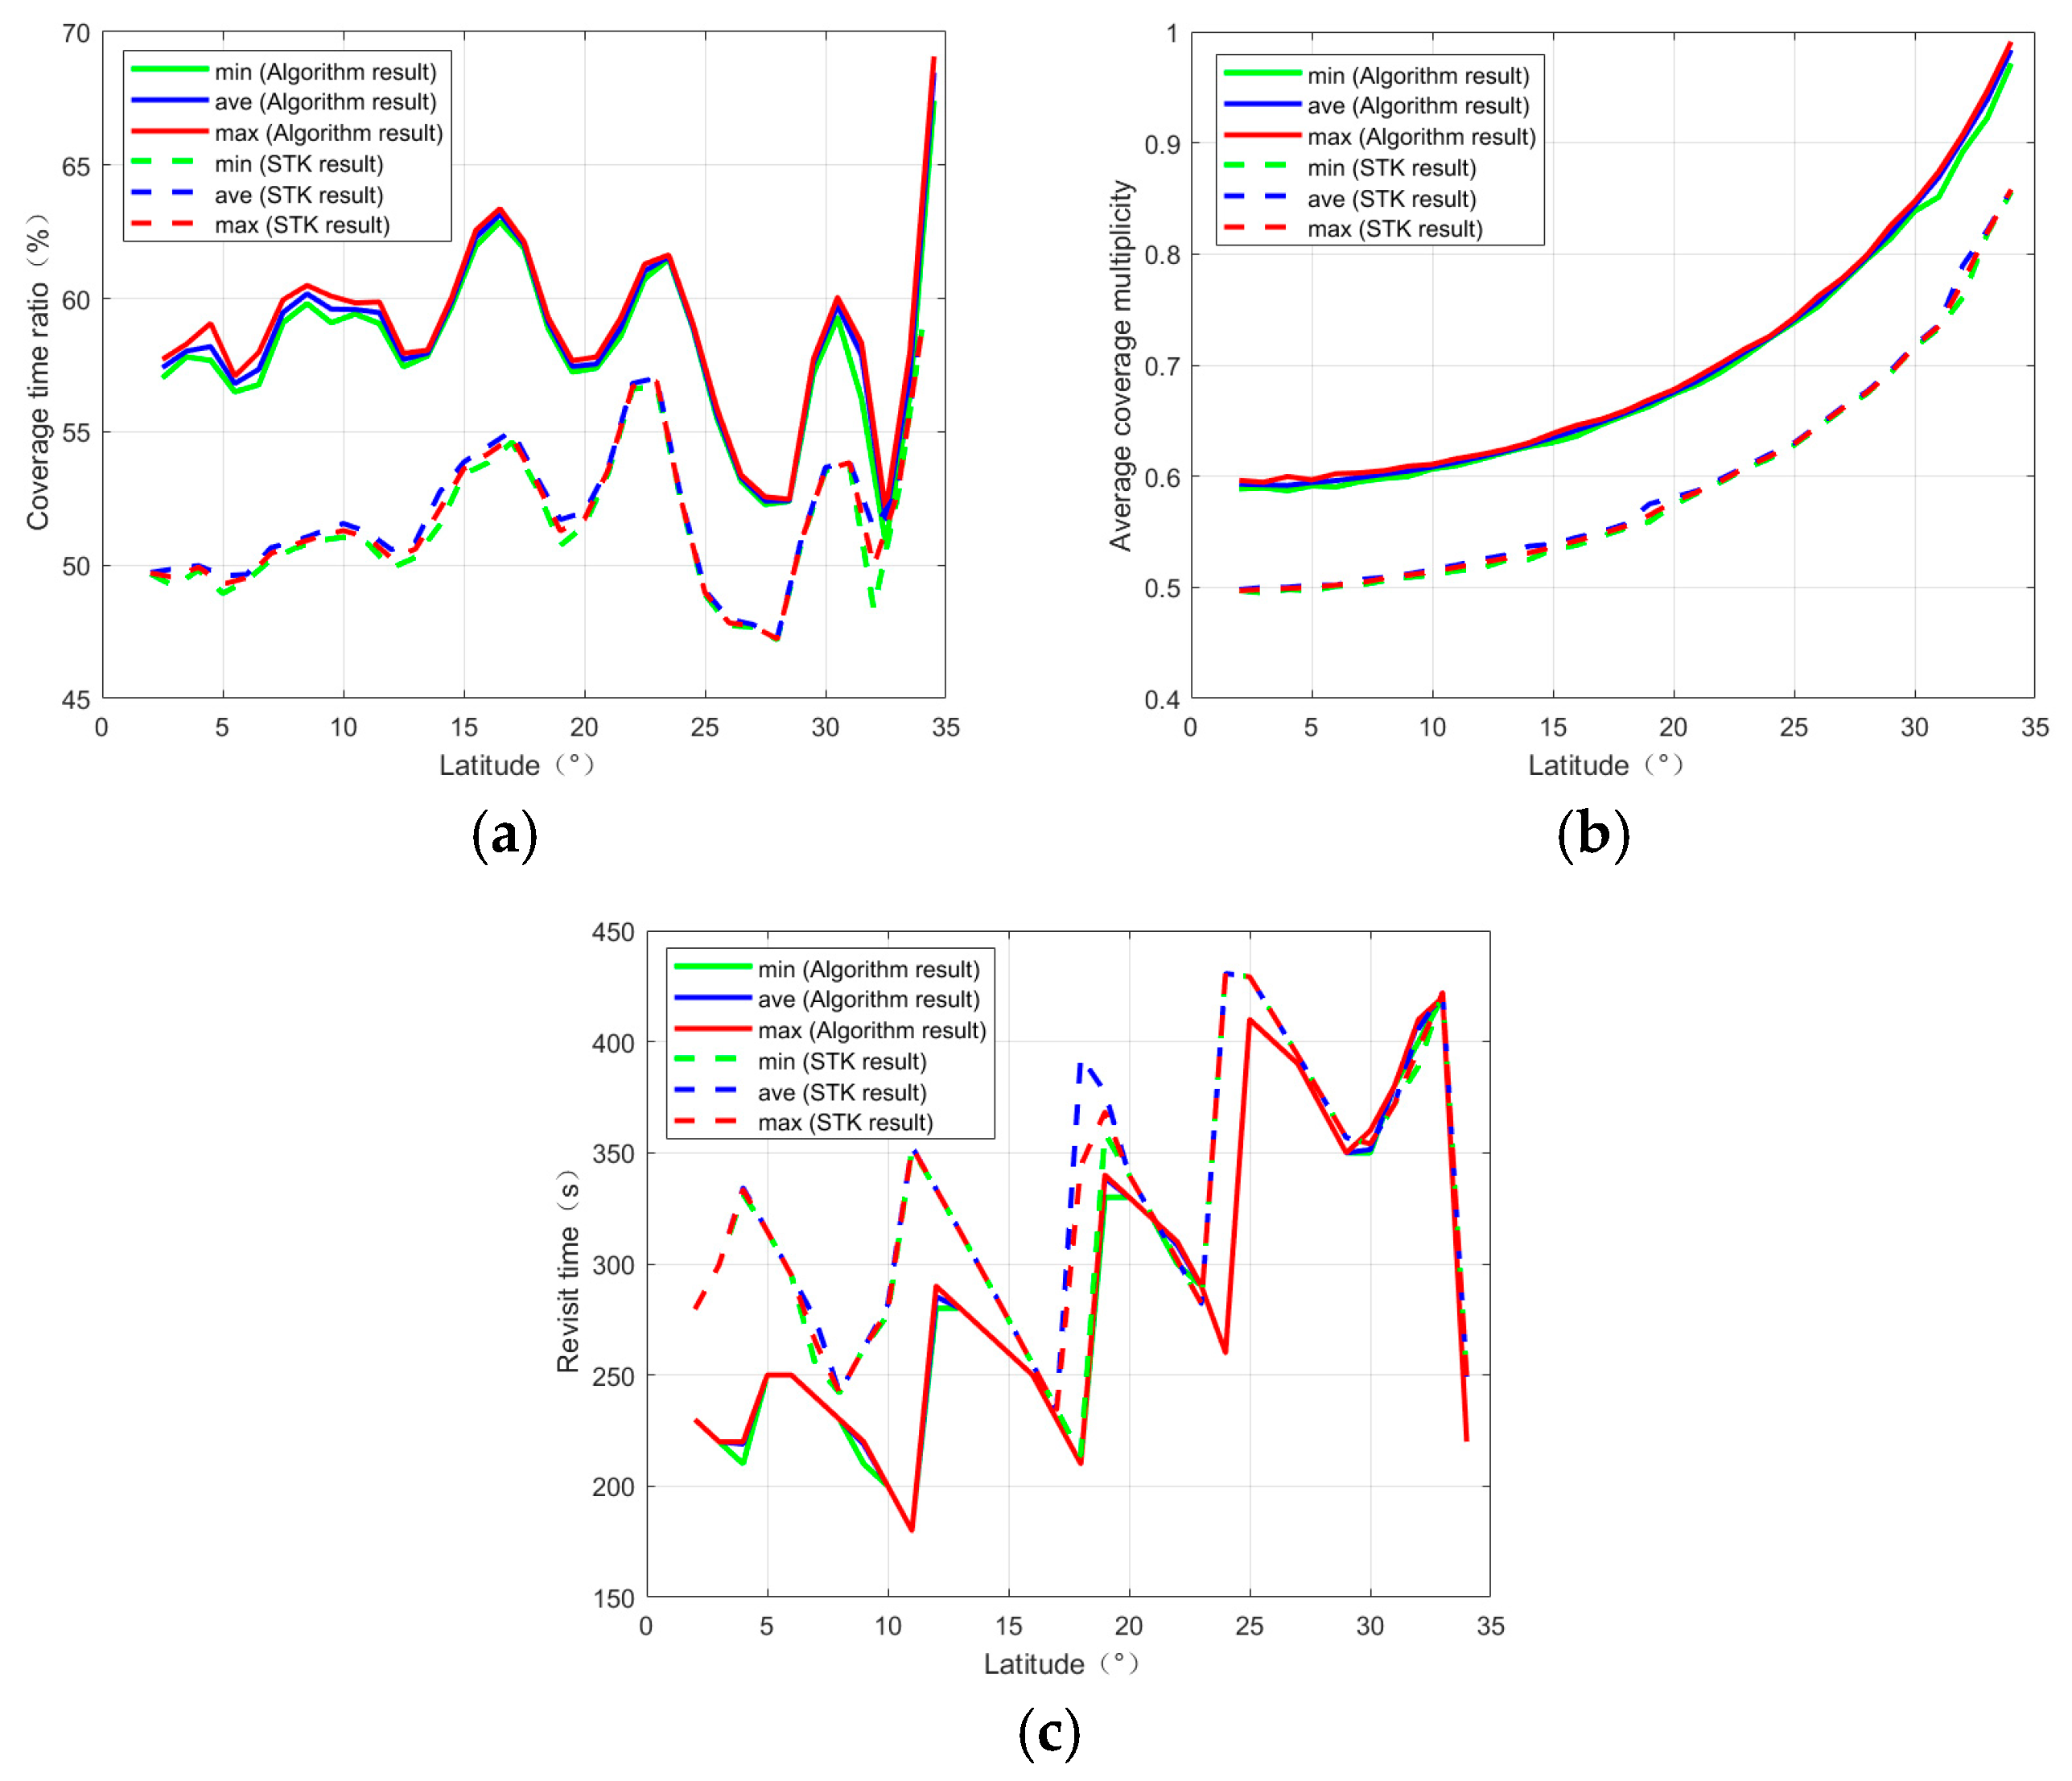
Using the algorithm presented in this paper, the ratio of coverage time, average coverage multiplicity, and revisit time interval for irregular target regions are calculated and compared with the results obtained from STK, as shown in Figure 14a–c.
As shown in the analysis of Figure 14a–c, the coverage time ratio for the irregular region in Figure 14a increases with latitude, displaying a relatively gradual rise in the latitude range of 39.5–40.5°, after which it continues to increase. The difference between the algorithm’s calculated results and those from STK is 1.73%. In Figure 14b, the average coverage multiplicity for the irregular region increases with latitude. The algorithm yields a value of 1.25, while STK calculates a peak value of 1.31, with the average difference between the algorithm and STK results being 0.04. Figure 14c illustrates that the revisit time interval for the irregular region decreases with latitude in a step-like fashion, increases slightly in the 38–39° latitude range, and then continues to decrease. The average difference between the algorithm’s and STK’s calculated results is 12.73 s. After comparison, the results from the proposed algorithm are found to be generally consistent with those obtained from STK in the irregular target region.

3.2. Analysis for Different Payloads

The constellation configuration (250/25/10/6878.14 km/45°) was used to demonstrate and analyze the coverage performance of satellites carrying different payloads. The first island chain was chosen as the irregular target region, with its location information shown in Figure 15, and the latitude and longitude of the boundary division regions provided in Table 3. Other parameter settings remain the same as those in Table 2.

3.2.1. Electronic Payload

The satellite carries an electronic payload, using a simple conical sensor with a half-cone angle of 45°. Based on the algorithm presented in this paper, the coverage time ratio, average coverage multiplicity, and revisit time interval for the first island chain region are calculated and compared with the STK results, as shown in Figure 16a–c. The legend displays the minimum, average, and maximum values of the corresponding indicators within the current latitude range.
As seen from the analysis of Figure 16a–c, the coverage time ratio for the irregular region in Figure 16a shows an increasing trend up to a latitude of 17°, followed by fluctuations within a coverage time ratio range of 36–45%. The difference between the calculated results of the algorithm and the STK results is 0.59%. In Figure 16b, the average coverage multiplicities for the irregular region increase with latitude. The difference between the algorithm and STK results varies in three decimal places, with an average difference of 0.001. In Figure 16c, the revisit time interval for the irregular region shows a peak between latitudes 3° and 4°, followed by fluctuations between 300 and 500. The average difference between the algorithm and STK results is 27.07 s. After comparison, the calculated values from the proposed algorithm are in good agreement with those from STK when the satellite is equipped with an electronic payload.

3.2.2. Visible Light Payload

The satellite is equipped with a visible light payload, utilizing a rectangular sensor with a horizontal half-field of view of 45° and a vertical half-field of view of 45°. Through the calculation of the proposed algorithm, the average coverage time ratio, average coverage multiplicity, and revisit time interval for the first island chain region can be obtained and compared with the STK calculation results, as shown in Figure 17a–c.
As shown in the analysis of Figure 17a–c, the coverage time ratio of the irregular region in Figure 17a fluctuates between 52% and 64% before latitude 33°, and then increases. The average difference between the results obtained by the algorithm and those calculated by STK is 6.78%. In Figure 17b, the coverage multiplicity of the irregular region increases with latitude, with the average difference between the algorithm and STK results being 0.1. In Figure 17c, the revisit time interval for the irregular region exhibits a sawtooth-like increasing trend. At latitude 17°, there is a slight discrepancy between the algorithm’s results and the STK results, after which the revisit time fluctuates between 300 and 500. The average difference between the algorithm’s results and the STK results is 38.05 s. Upon comparison, the values calculated by the proposed algorithm are generally consistent with those obtained from STK when the payload is visible light.

3.3. Analysis for Different Optimization Objectives

3.3.1. Minimizing the Number of Satellites for Given Performance Requirements

Considering the cost of satellite launches and aiming to avoid excessive investment and resource waste, the maximum number of satellites is limited to 400. The goal is to achieve a constellation design with the minimum number of satellites while meeting the given coverage performance requirements, specifically a coverage interval time of 300 s and the first island chain region as the coverage area. The parameter settings are shown in Table 4.
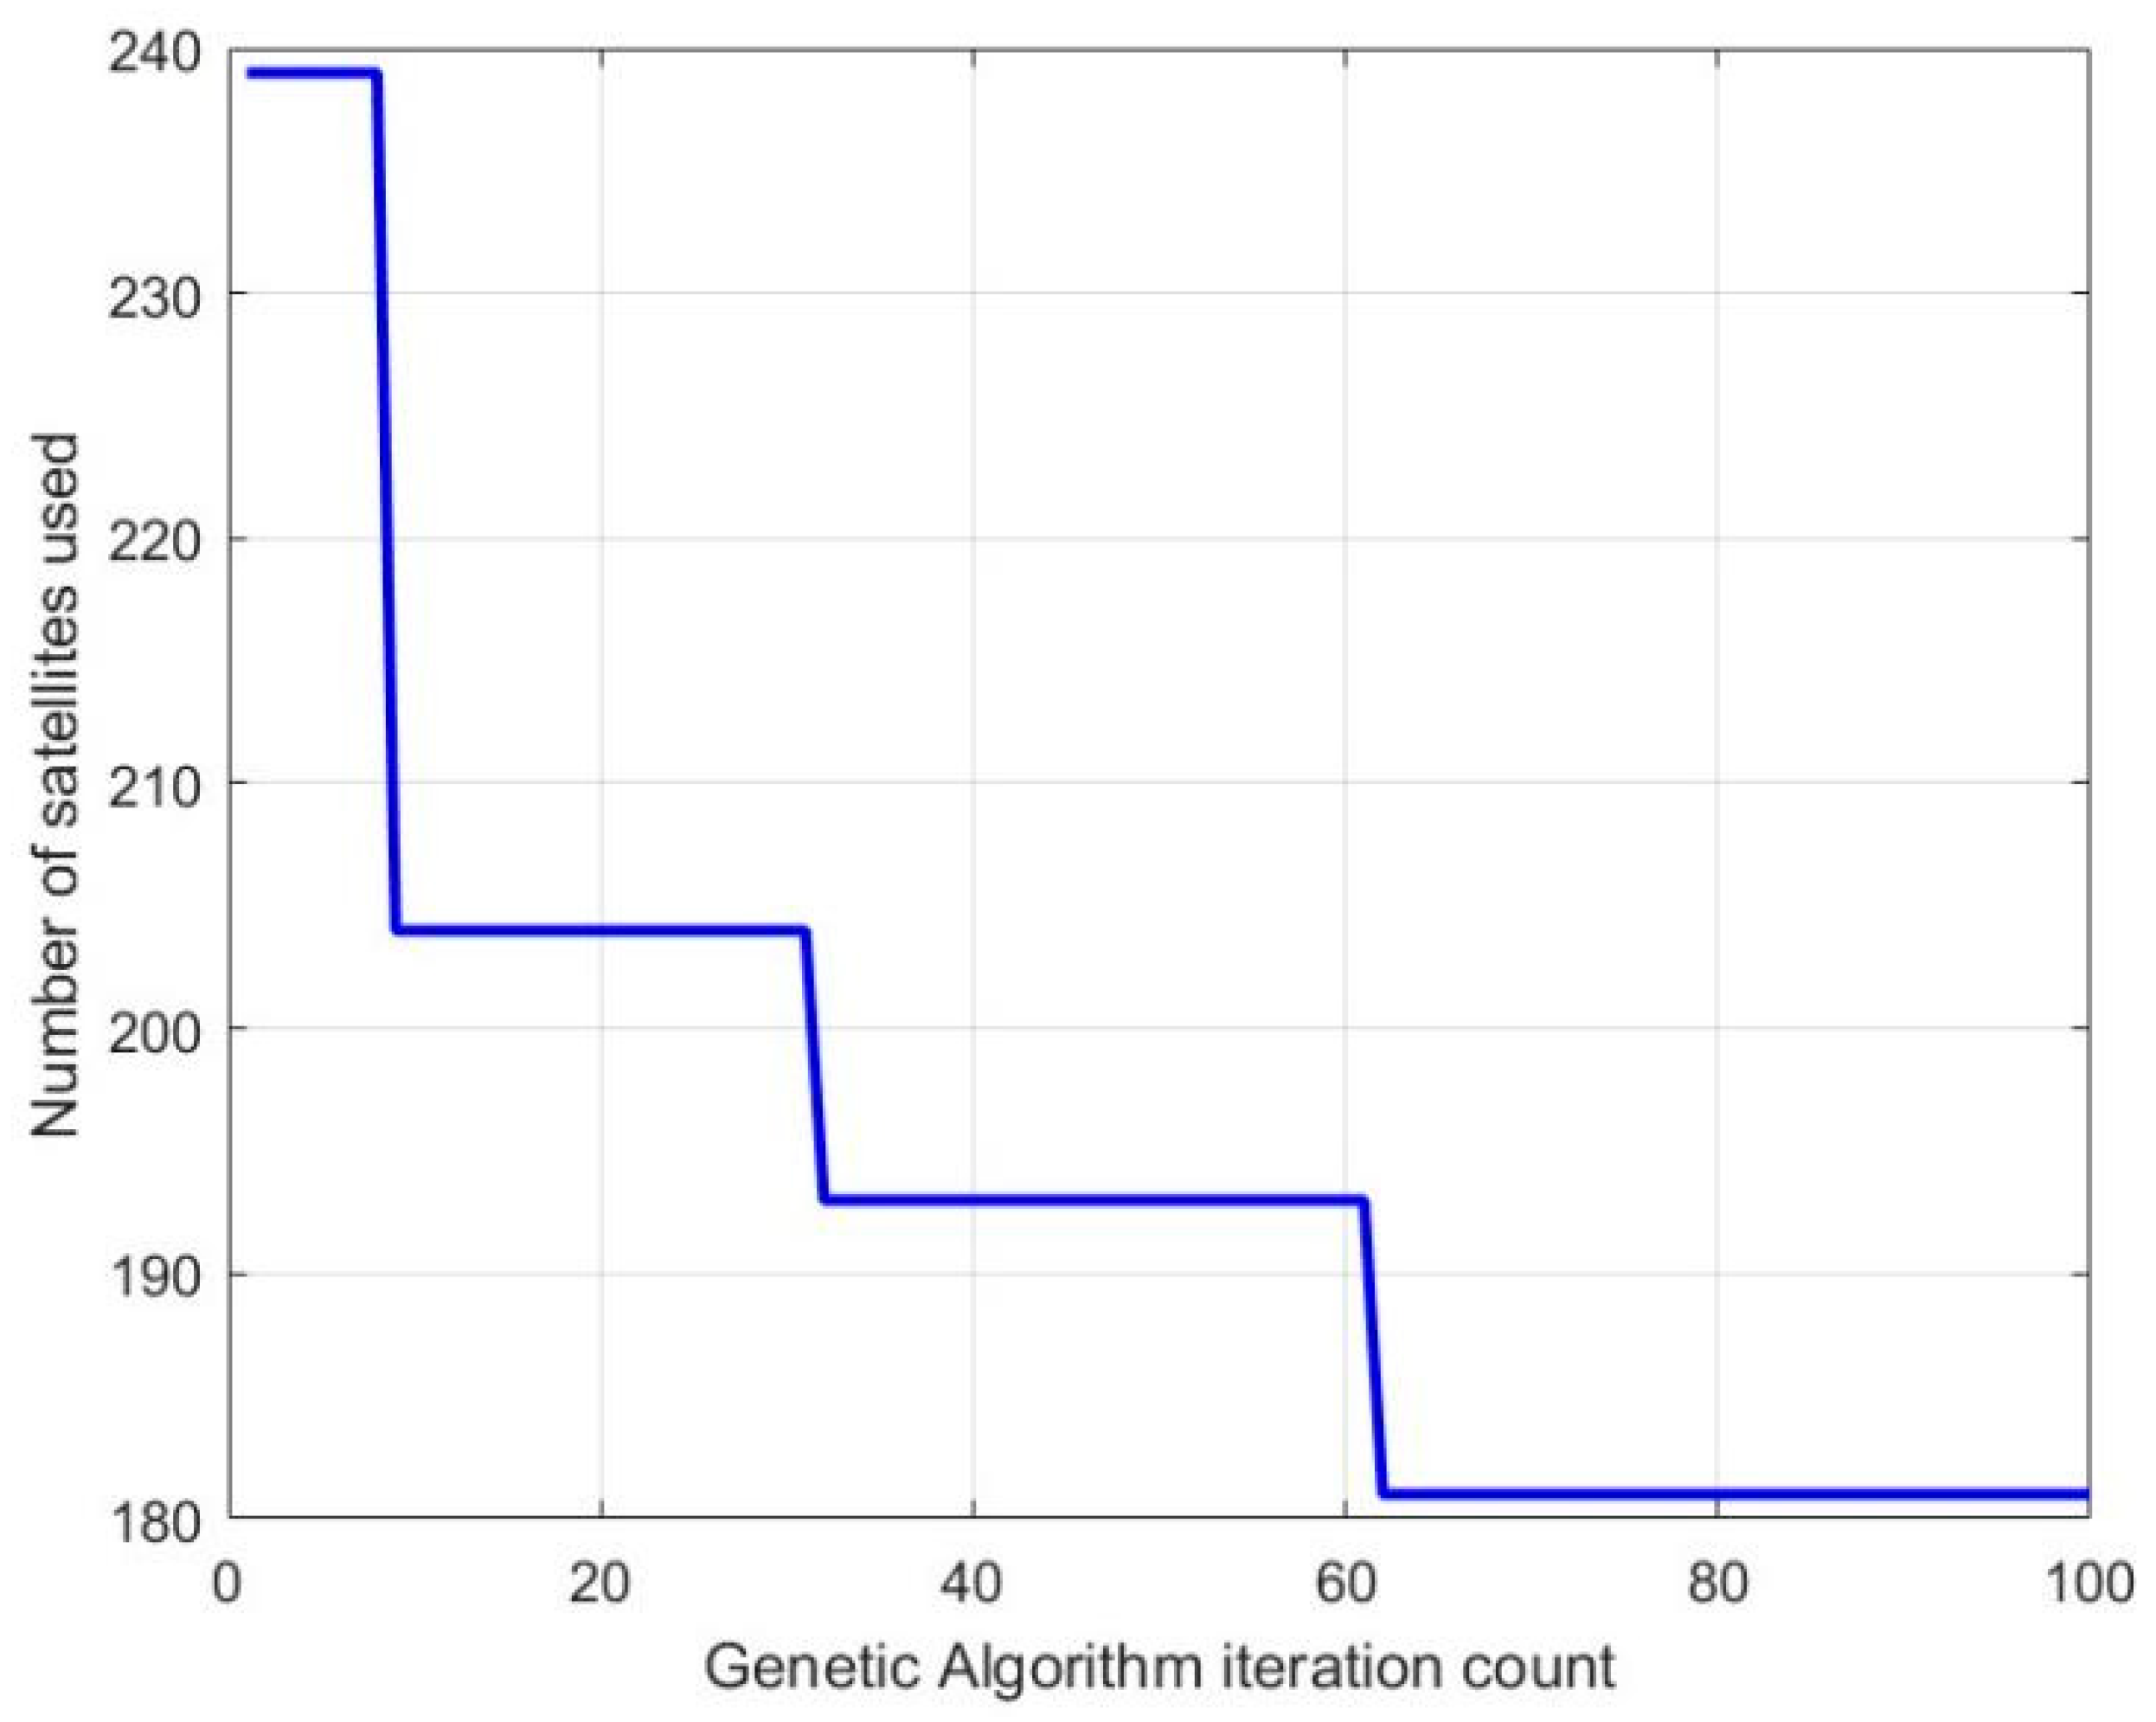
Based on the algorithm presented in this paper, the variation in the number of satellites in use as the number of iterations of the genetic algorithm decreases is shown in Figure 18. As observed, the number of satellites in use decreases step by step with each iteration. Since this is a typical optimization problem, the algorithm does not converge to a single optimal solution during the iterative process due to the diversity and complexity of possible solutions. Therefore, as the number of iterations increases, the number of satellites used tends toward a local optimal solution.
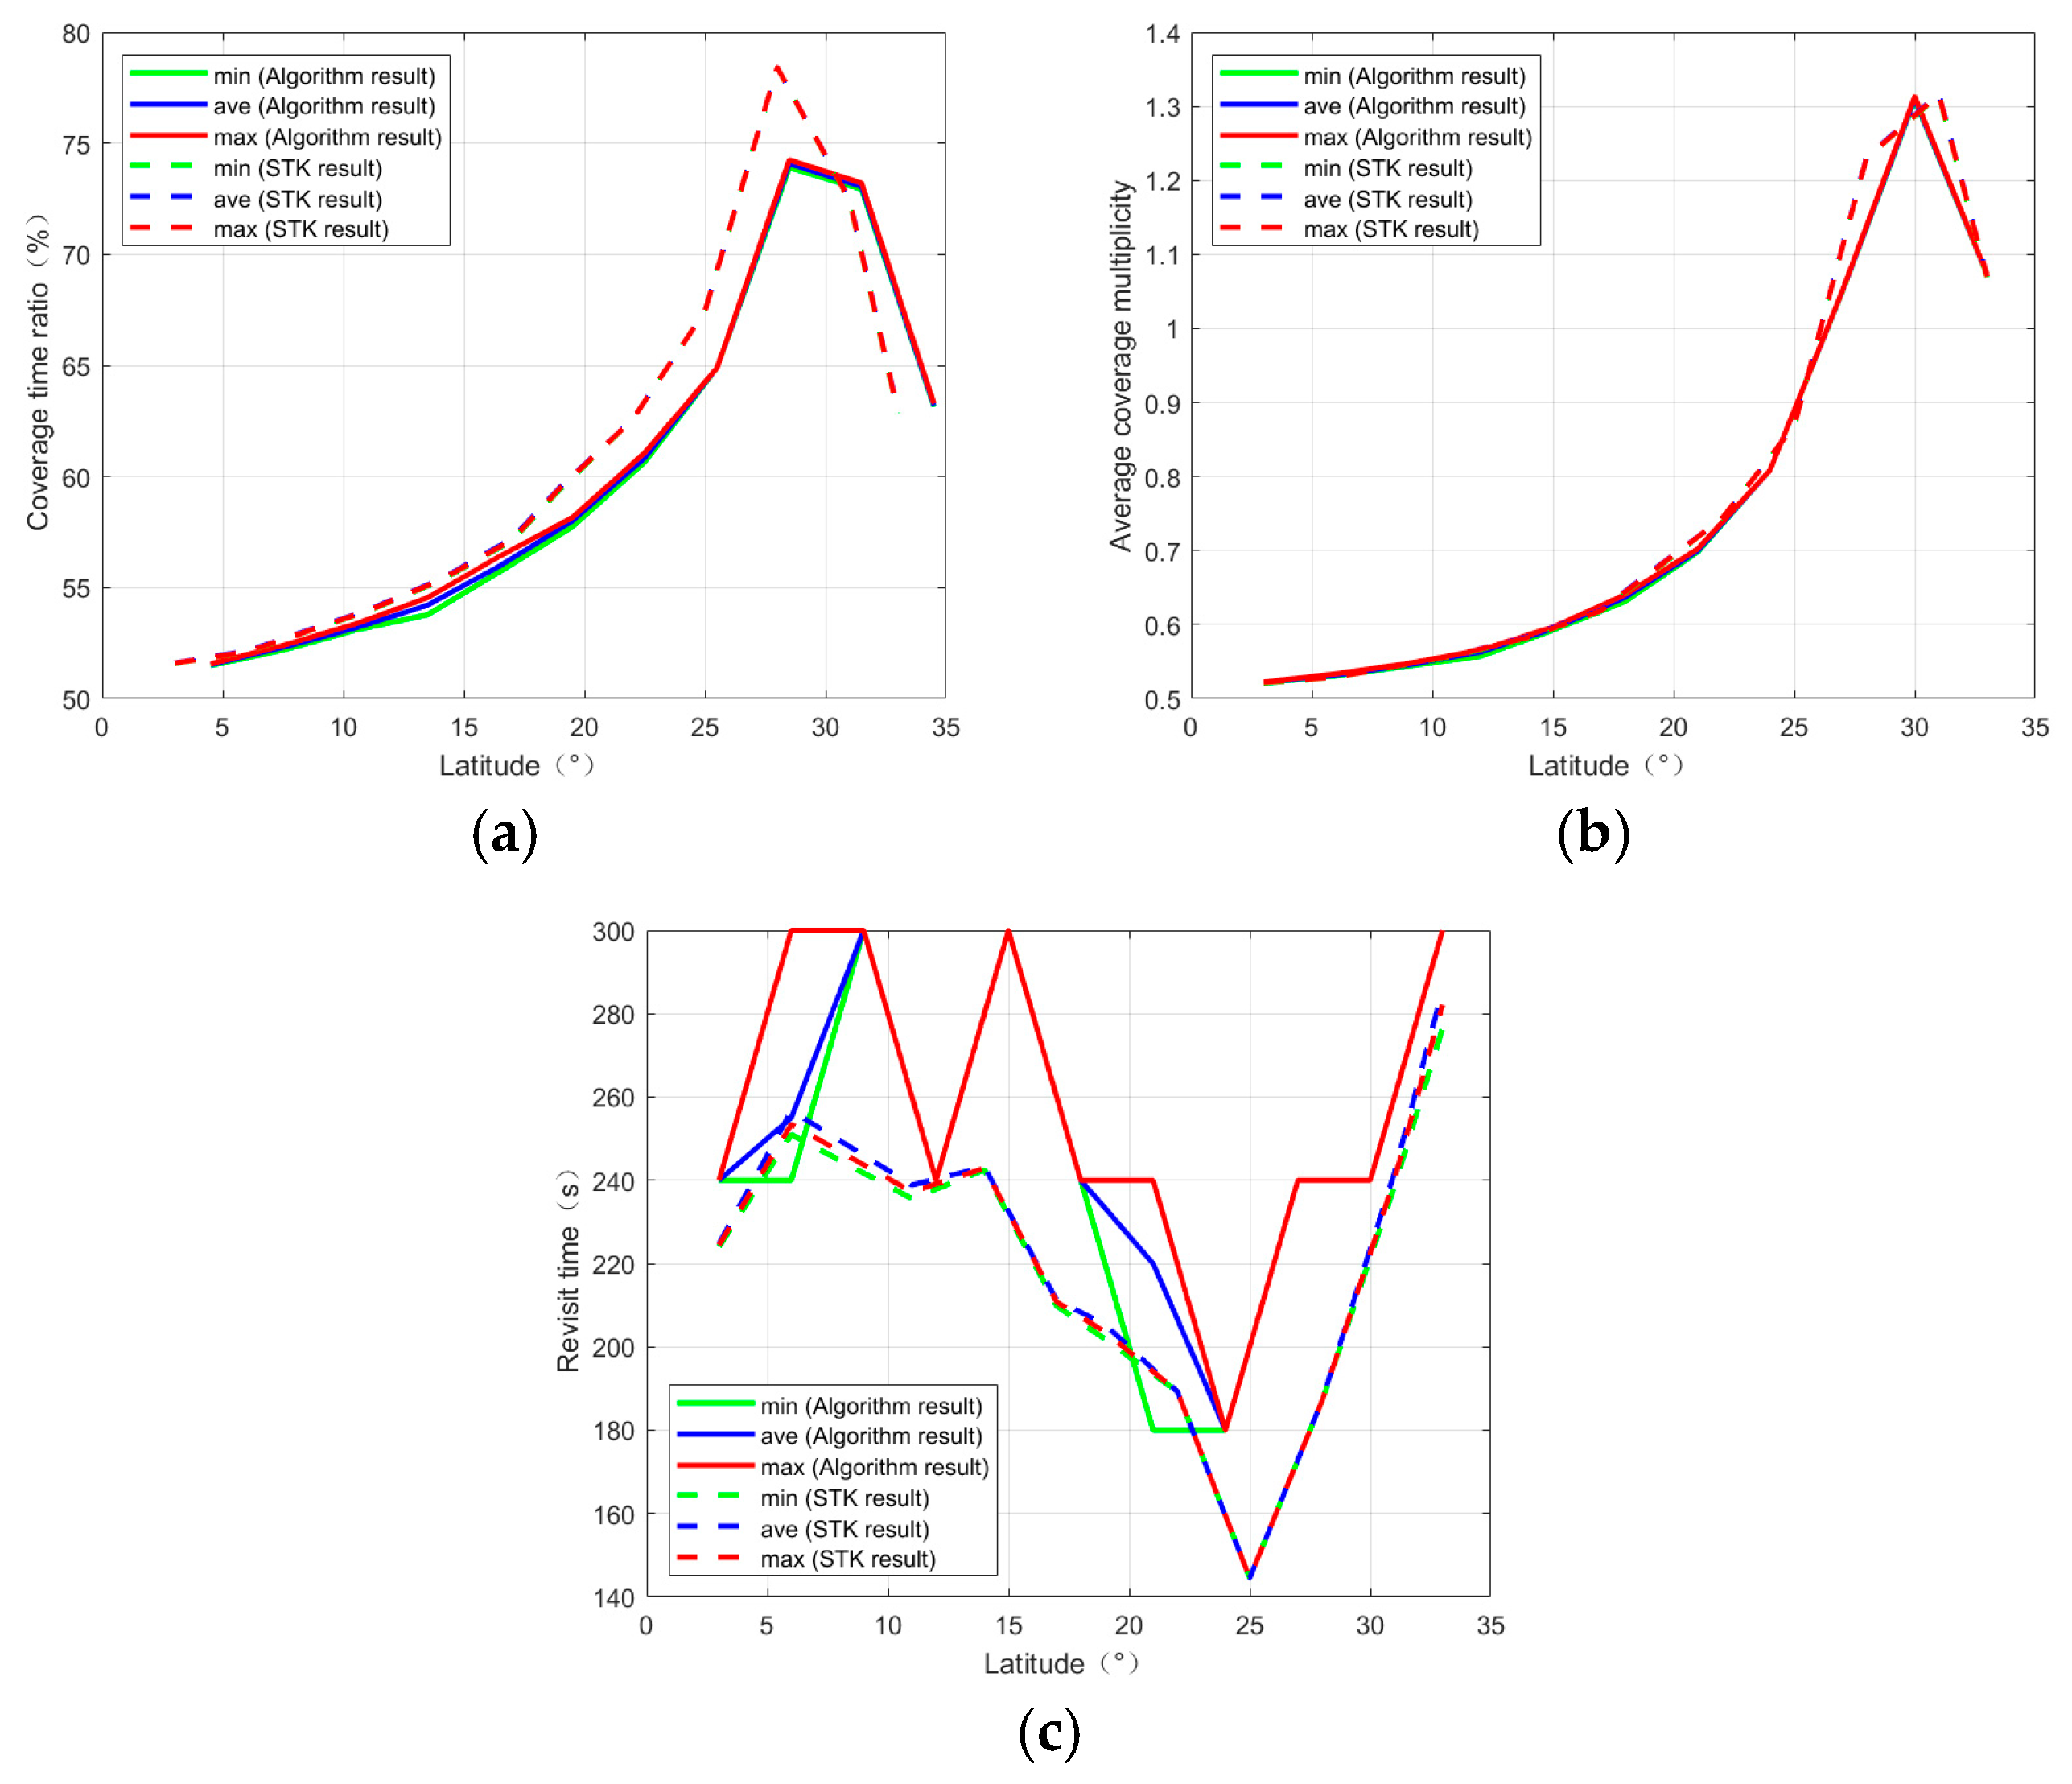
The coverage time ratio, average coverage multiplicity, and revisit time interval for the optimization target, which minimizes the number of satellites required to meet the given performance criteria, are shown in Figure 19a–c.
The optimal constellation configuration after optimization is: (181, 181, 19, 0.577704, 6.978 × 10⁶), where the parameters are defined as follows: 1 satellite per orbital plane, 181 orbital planes, a phase factor of 19, an orbital inclination of 0.577704 rad (approximately 33.1°), and an orbital semi-major axis of approximately 6978 km.
As shown in the analysis of Figure 19a–c, Figure 19a demonstrates that the coverage time ratio for the optimization target with the minimum number of satellites required for a given performance first increases, reaching a peak at latitude 28°, and then gradually decreases. The average difference between the algorithm-calculated optimized constellation parameters and the STK results is 1.3%. In Figure 19b, for the average coverage multiplicity of the optimization target, the multiplicity first increases, peaks at latitude 30°, and then gradually decreases. The average difference between the optimized constellation parameters calculated by the algorithm and the STK results is 0.04. In Figure 19c, for the revisit time interval of the optimization target, the calculated results from the algorithm and STK show numerical differences due to different scatter methods, but both meet the coverage performance requirement of a revisit interval within 300 s, with an average difference of 33.18 s. Therefore, by comparing the results with STK, it can be concluded that the optimized constellation configuration is reasonable.

3.3.2. Optimizing Performance for a Given Number of Satellites

The target is set with the number of satellites required to be 500. Based on this condition, the average coverage multiplicity is taken as the evaluation parameter for coverage performance, with the requirement that the coverage interval time be 0 s, i.e., full coverage. The other parameters are the same as those in Table 4. The optimal constellation configuration with the best coverage performance is obtained through algorithm analysis.
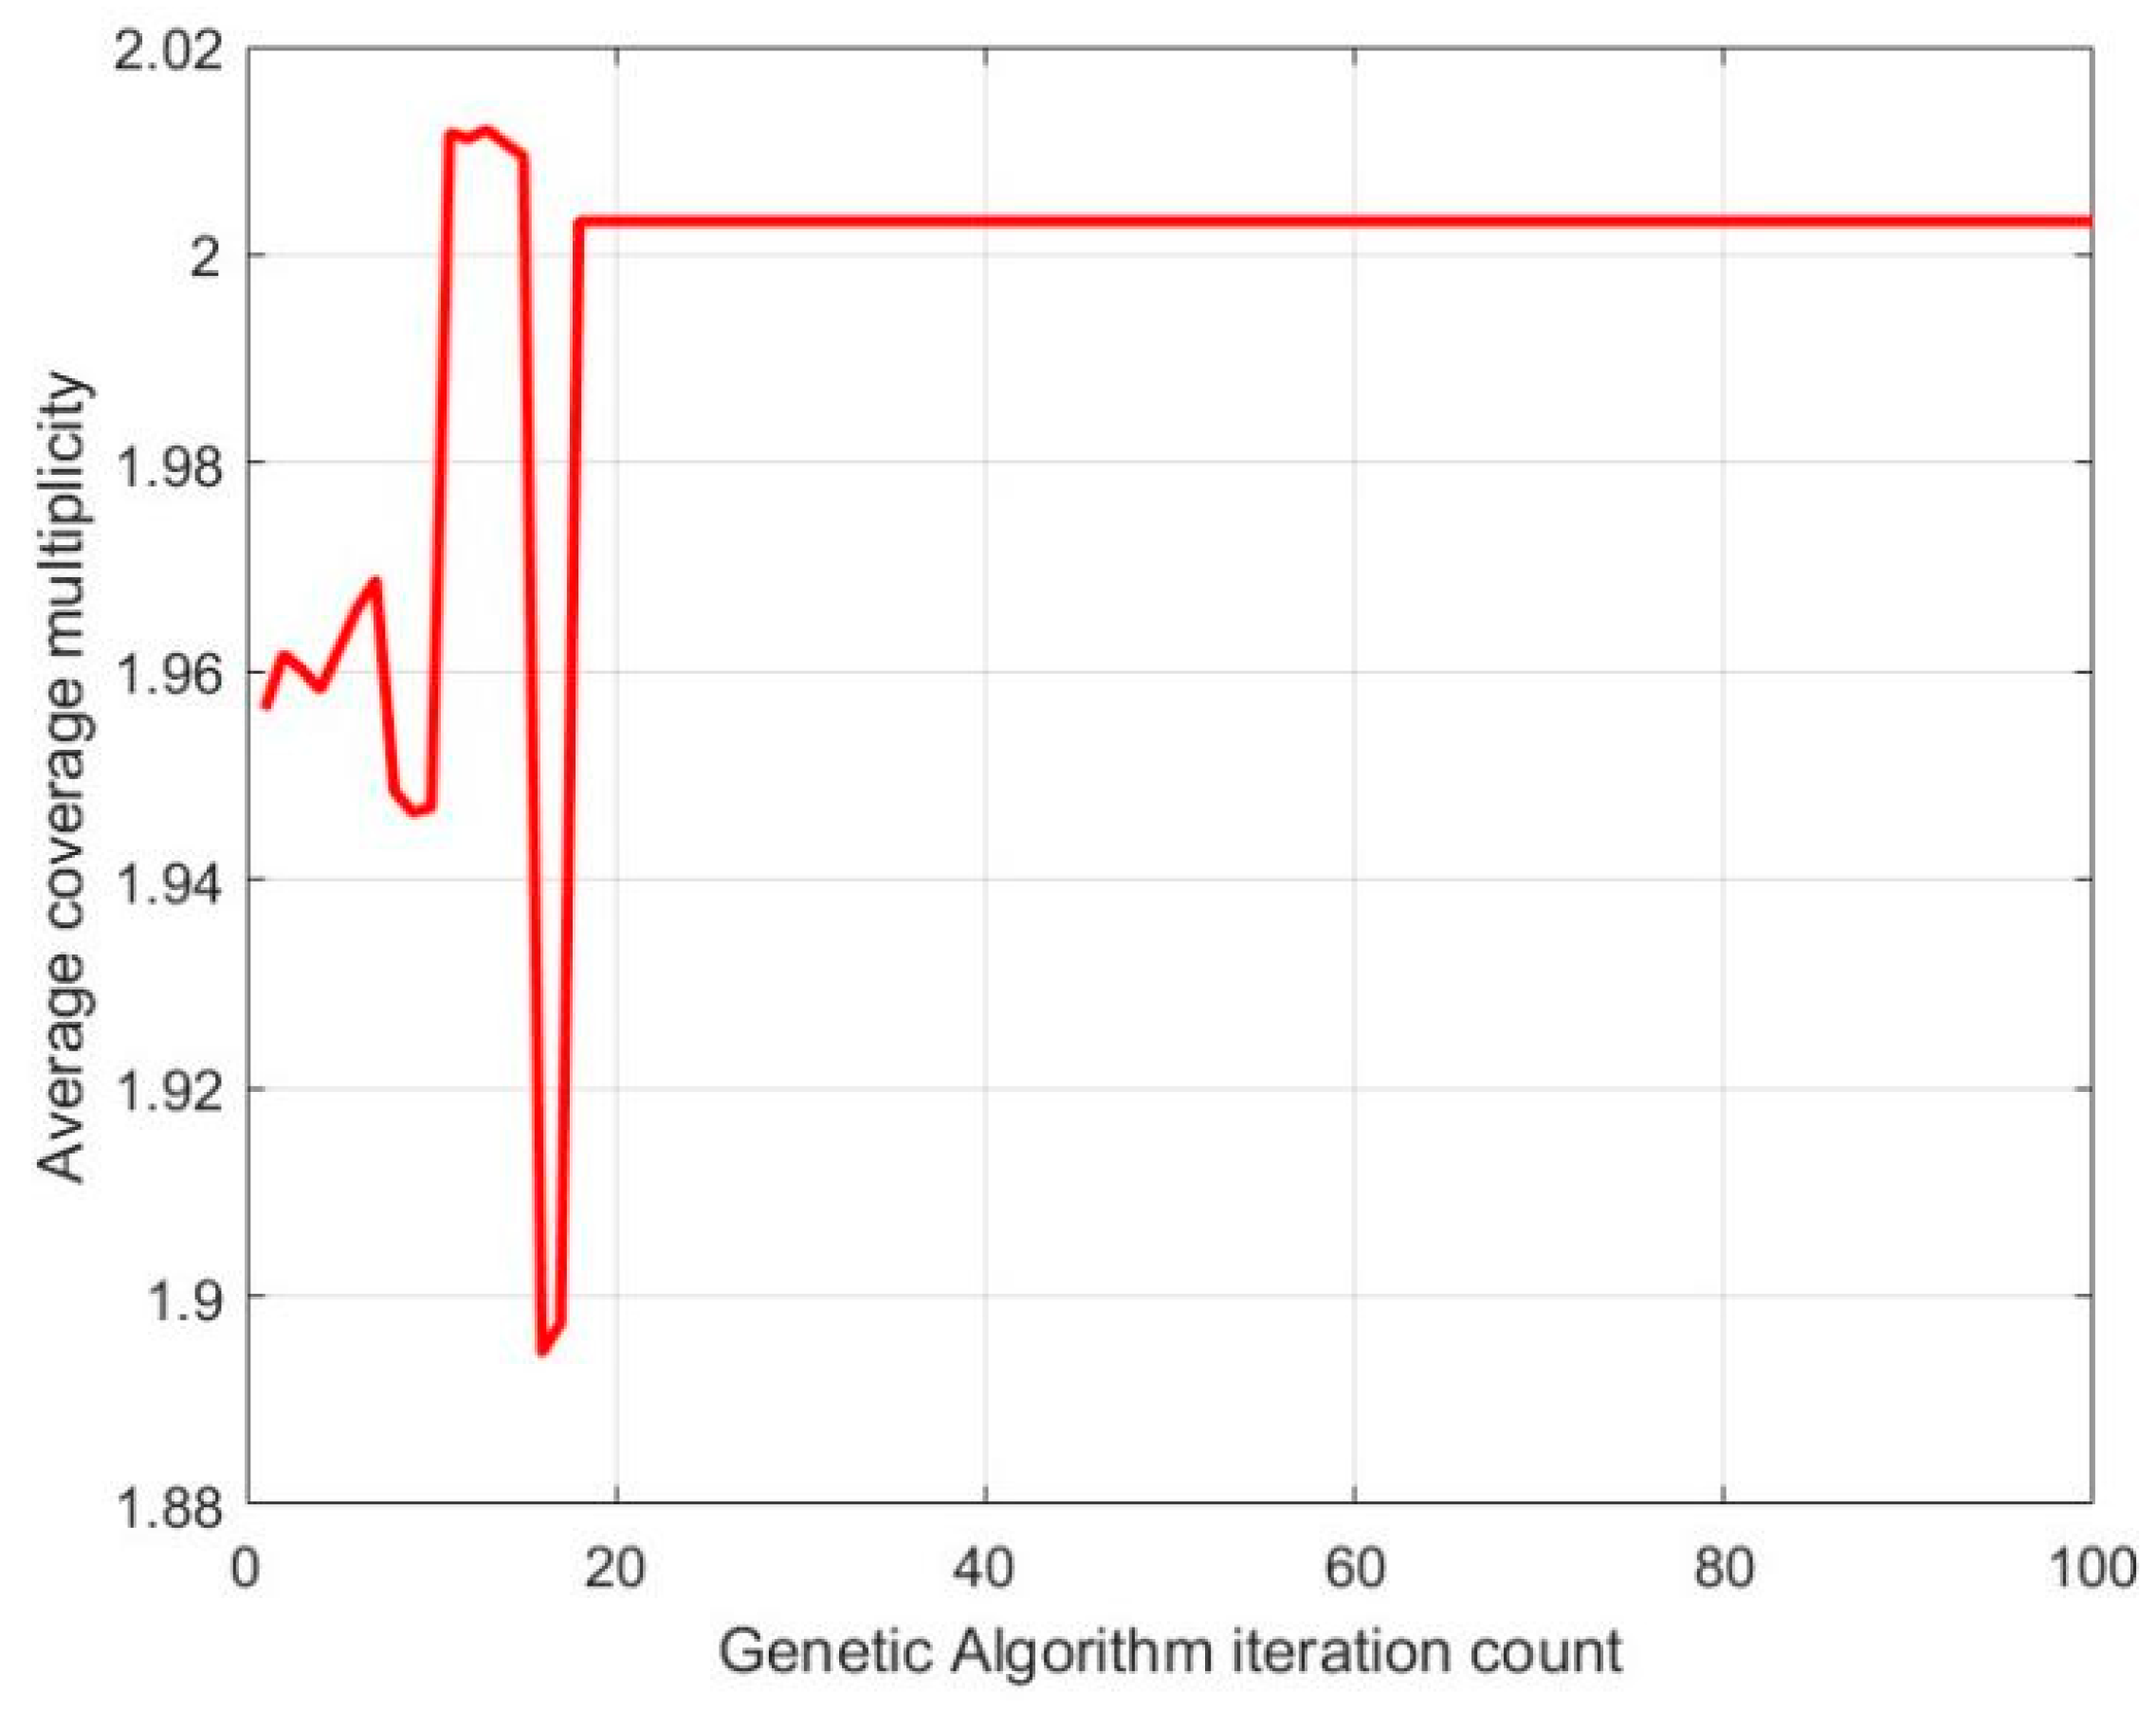
As shown in Figure 20, the average coverage multiplicity is gradually optimized with the number of iterations of the genetic algorithm. From the analysis of the figure, it can be observed that as the number of iterations increases, the average coverage multiplicity is optimized and gradually stabilizes after some fluctuations. In this example, the average coverage multiplicity stabilizes at 2.00323 after 18 iterations, achieving the optimal constellation configuration.
The coverage time ratio, average coverage multiplicity, and revisit time intervals for the optimization target with optimal performance, given the number of satellites, are shown in Figure 21a–c.
After analysis and optimization, the optimal constellation configuration is determined as (500, 25, 2, 0.551524, 6.978 × 10⁶), where the parameters are as follows: 20 satellites per orbital plane, 25 orbital planes, a phase factor of 2, an orbital inclination of 0.551524 radians (approximately 31.6°), and an orbital semi-major axis of approximately 6978 km.
Based on the analysis of Figure 21a–c, the coverage time ratio of the optimization target with the given number of satellites, shown in Figure 21a, remains at 100% until a latitude of 20°, then decreases to 99.1% between latitudes 20° and 25°, and rises back to 100% between latitudes 25° and 30°, maintaining this coverage level. The overall coverage time ratio stays above 99%, with an average difference of 0.21% between the optimized constellation parameters and the STK results. As for the average coverage multiplicity, Figure 21b shows that it first increases to a peak at latitude 27° and then gradually decreases, with an average difference of 0.08 between the results from the algorithm and STK. For the revisit time interval, Figure 21c illustrates slight numerical differences between the algorithm and STK results due to different scatter modes; however, both results follow the same trend, with an average difference of 8 s. Furthermore, the optimized constellation configuration successfully meets the target requirement of 500 satellites, thereby demonstrating the rationality and reliability of this optimal constellation design scheme.

4. Conclusions

This paper, based on the orbital dynamics model and constellation configuration requirements, considers a variety of observational constraints and supports two optimization objectives: “minimum number of satellites required for a given performance” and “optimal performance for a given number of satellites.” The utility of the framework was demonstrated through these objectives: when tasked with minimizing the satellite count for a given performance requirement (a 300 s revisit time), the algorithm successfully identified a 181-satellite constellation that met the criteria. Conversely, when optimizing for the best performance with a fixed number of 500 satellites, the algorithm converged on a configuration that achieved full coverage with an average multiplicity of over 2.0. To evaluate performance, an algorithm that divides the Earth’s surface and distributes points evenly was used to calculate parameters such as the coverage time ratio, average coverage multiplicity, and revisit time interval. The strong consistency of these results with the industry-standard software STK—with average differences for these indicators controlled within 1%, 0.1, and 35 s, respectively—serves as a crucial validation of our model’s accuracy and the algorithm’s effectiveness in achieving its optimization goals. The primary contribution of this work is therefore the establishment of an independent and sovereign computational framework that overcomes the accessibility limitations associated with proprietary commercial software. In comparison to prior studies that often focus on a single optimization goal, the primary improvement of the proposed framework lies in its versatility and computational efficiency, making it well-suited for modern mega-constellation design. Finally, the genetic algorithm is employed to optimize the constellation configuration, and its outputs provide critical quantitative inputs for broader strategic considerations, serving as a foundation for subsequent optimizations focused on constellation economics, while also informing space debris mitigation strategies and policy-making on sustainable space use.

Author Contributions

Conceptualization, Y.G.; Methodology, X.G., Y.Z. and Y.G.; Software, X.G. and Y.Z.; Validation, X.G. and Y.Z.; Formal analysis, X.G. and Y.Z.; Investigation, X.G., Y.Z. and L.G.; Resources, L.G. and Y.G.; Data curation, X.G. and Y.Z.; Writing—review and editing, X.G., Y.Z., L.G. and Y.G.; Visualization, X.G.; Supervision, L.G. and Y.G.; Project administration, Y.G.; Funding acquisition, Y.G. All authors have read and agreed to the published version of the manuscript.

Funding

This research was funded by the National Natural Science Foundation of China Grant No. 12302057 and the Research Support Fund of Yunfeng Gao Grant No. DC2300000680 and the Hohhot Collaborative Innovation Project No. XTCX2023-09.

Data Availability Statement

The original contributions presented in this study are included in the article. Further inquiries can be directed to the corresponding author.

Acknowledgments

Yunfeng Gao acknowledges financial support provided by the National Natural Science Foundation of China Grant No. 12302057 and the Research Support Fund of Yunfeng Gao Grant No. DC2300000680.

Conflicts of Interest

The authors declare no conflicts of interest.

References

  1. Tao, H.; Zhu, Q.; Che, X.; Li, X.; Man, W.; Zhang, Z.; Zhang, G. Impact of Mega Constellations on Geospace Safety. Aerospace 2022, 9, 402. [Google Scholar] [CrossRef]
  2. Ravishankar, C.; Gopal, R.; Benammar, N.; Zakaria, G.; Huang, X. Next generation global satellite system with mega-constellations. Int. J. Satell. Commun. Netw. 2021, 39, 6–28. [Google Scholar] [CrossRef]
  3. Yang, K.; Amongin, S. Assessing the Principle of Equitable Access versus Non-Appropriation in the Era of Mega-Constellations. Aerospace 2024, 11, 842. [Google Scholar] [CrossRef]
  4. Klinkrad, H. Large satellite constellations and related challenges for space debris mitigation. J. Space Saf. Eng. 2017, 4, 59–60. [Google Scholar] [CrossRef]
  5. Wang, J.; Chi, J.; He, S.; Song, X. The Development Status and Implications of Mega-Constellations in Low Earth Orbit. Chin. Space 2024, 6, 39–45. [Google Scholar]
  6. Zhang, C.; Jin, J.; Kuang, L.; Yan, J. LEO constellation design methodology for observing multi-targets. Astrodynamics 2018, 2, 121–131. [Google Scholar] [CrossRef]
  7. Zhang, Y.; Yang, H.; Liang, G.; Chen, Y.; Liu, Z.; Hu, J. Efficient design of constellation for Low-Earth-Orbit object revisit observations. Aerosp. Sci. Technol. 2025, 166, 110633. [Google Scholar] [CrossRef]
  8. Del Portillo, I.; Cameron, B.G.; Crawley, E.F. A technical comparison of three low earth orbit satellite constellation systems to provide global broadband. Acta Astronaut. 2019, 159, 123–135. [Google Scholar] [CrossRef]
  9. Gao, Z.; Yao, H.; Zhang, L.; Shi, Y.; Wang, F.; Tao, Y. Architecture Design and Key Technologies of Low-Orbit Mega-Constellation System. Integr. Inf. Netw. Heaven Earth 2024, 5, 43–52. [Google Scholar]
  10. Zhang, B.; Wu, Y.; Zhao, B.; Chanussot, J.; Hong, D.; Yao, J.; Gao, L. Progress and challenges in intelligent remote sensing satellite systems. IEEE J. Sel. Top. Appl. Earth Obs. Remote Sens. 2022, 15, 1814–1822. [Google Scholar] [CrossRef]
  11. Kestilä, A. Small Satellite Remote Sensing Constellation for Fast Polar Coverage. J. Small Satell. 2016, 5, 419–434. [Google Scholar]
  12. Ke, Z.; Huang, S.; Li, Y.; Qiao, K.; Teng, F.; Ruan, H.; Wang, X.; Wei, C.; Ma, X. The Current Status and Key Technologies of Low-Orbit Large-Scale Remote Sensing Constellations. Space Return Remote Sens. 2023, 44, 93–101. [Google Scholar]
  13. Kang, L.; Tian, J.; Jiang, B. Challenges and Reflections on Remote Sensing Satellite Application Technology in the Era of Mega-Constellations. J. Remote Sens. 2024, 28, 1658–1666. [Google Scholar]
  14. Wang, H.; Dai, J.; Zhan, Y.; Zhang, Q. Reflections on the Construction of Commercial Remote Sensing Constellations in China. Satell. Appl. 2023, 9, 24–26. [Google Scholar]
  15. Tianyu, S.; Min, H.; Chaoming, Y. Low-Orbit Large-Scale Communication Satellite Constellation Configuration Performance Assessment. Int. J. Aerosp. Eng. 2022, 2022, 4918912. [Google Scholar]
  16. Cui, W.; Wang, B.; Gan, X.; Gao, Y.; Li, N. Design of the five layers large-scale low-orbit communication constellation TT&C system. J. Phys. Conf. Ser. 2022, 2290, 012096. [Google Scholar]
  17. Shen, J.; Liu, H.; Rao, J.; He, Q.; Ben, L.; Wang, Z.; Xiong, Y. LEO Satellite Opportunity Signal Positioning Management for Communication and Navigation Symbiosis. Telecommun. Sci. 2023, 39, 122–128. [Google Scholar]
  18. Yang, H.; Zhang, Y.; Li, S.; Bai, X. Rapid Determination of Low-Earth-Orbit Occultation-Event Windows. J. Guid. Control Dyn. 2024, 47, 979–985. [Google Scholar] [CrossRef]
  19. Grewal, M.S. Global navigation satellite systems. Wiley Interdiscip. Rev. Comput. Stat. 2011, 3, 383–384. [Google Scholar] [CrossRef]
  20. Reid, T.G.; Neish, A.M.; Walter, T.; Enge, P.K. Broadband LEO constellations for navigation. Navig. J. Inst. Navig. 2018, 65, 205–220. [Google Scholar] [CrossRef]
  21. Peng, P.; Fan, X.; Xu, W.; Kang, G.; Hua, Y.; Xu, C. Low-Orbit Constellation Design and Application for Navigation Augmentation. Shanghai Aerosp. (Chin. Engl.) 2021, 38, 8. [Google Scholar]
  22. Li, B.; Ge, H.; Ge, M.; Nie, L.; Shen, Y.; Schuh, H. LEO enhanced Global Navigation Satellite System (LeGNSS) for real-time precise positioning services—ScienceDirect. Adv. Space Res. 2019, 63, 73–93. [Google Scholar] [CrossRef]
  23. Ma, Y.; Zheng, J.; Li, M. Optimization Design of Revisit Constellations Based on Low-Density Grid Coverage Analysis. J. Space Sci. 2020, 40, 8. [Google Scholar]
  24. Han, C.; Deng, L.; Xu, J. Improved Grid Point Simulation Method for Constellation Coverage Performance Assessment. J. Comput. Simul. 2005, 22, 4. [Google Scholar]
  25. Qin, R.; Dai, G.; Wang, M.; Peng, L. An Efficient Sampling Grid Point Method for Calculating Constellation Area Coverage. Appl. Res. Comput. 2015, 32, 5. [Google Scholar]
  26. Li, J.; Wang, W. Adaptive Hierarchical Grid Based on Hexagons and its Application to Point-in-Spherical-Polygon Judgment. J. Softw. 2022, 33, 13. [Google Scholar]
  27. Xiangyue, H.E.; Haiyang, L.I. Analytical solutions for Earth discontinuous coverage of satellite constellation with repeating ground tracks. Chin. J. Aeronaut. 2022, 35, 275–291. [Google Scholar] [CrossRef]
  28. Ballard, A.H. Rosette Constellations of Earth Satellites. Aerosp. Electron. Syst. IEEE Trans. 1980, AES-16, 656–673. [Google Scholar] [CrossRef]
  29. Turner, A. Constellation Design Using Walker Patterns. In Proceedings of the AIAA/AAS Astrodynamics Specialist Conference and Exhibit, Monterey, CA, USA, 5–8 August 2002. [Google Scholar]
  30. Lang, T. Low Earth orbit satellite constellations for continuous coverage of the mid-latitudes. In Proceedings of the Astrodynamics Conference, San Diego, CA, USA, 29–31 July 1996. [Google Scholar]
  31. Ma, D.M.; Hong, Z.C.; Lee, T.H.; Chang, B.J. Design of a micro-satellite constellation for communication. Acta Astronaut. 2013, 82, 54–59. [Google Scholar] [CrossRef]
  32. Mortari, D.; De Sanctis, M.; Lucente, M. Design of Flower Constellations for Telecommunication Services. Proc. IEEE 2011, 99, 2008–2019. [Google Scholar] [CrossRef]
  33. Mai, Y.; Palmer, P. Fast Algorithm for Prediction of Satellite Imaging and Communication Opportunities. J. Guid. Control Dyn. 2001, 24, 1118–1124. [Google Scholar] [CrossRef]
  34. Jing, W.; Gao, Y.; Wu, Z.; Ye, X. Optimization Design of Small Satellite Orbits for Observation Missions. J. Comput. Simul. 2015, 32, 5. [Google Scholar]
  35. Fakoor, M.; Bakhtiari, M.; Soleymani, M. Optimal design of the satellite constellation arrangement reconfiguration process. Adv. Space Res. 2016, 58, 372–386. [Google Scholar] [CrossRef]
  36. Meng, B.; Han, C. Optimal Design of Hybrid Satellite Constellations Based on an Improved Particle Swarm Optimization Algorithm. Shanghai Aerosp. 2010, 27, 36–39+50. [Google Scholar] [CrossRef]
  37. Wei, J.; Cen, Z. Optimal Design of Regional Coverage Satellite Constellations Based on Ant Colony Algorithm. J. Commun. 2006, 27, 62–66. [Google Scholar]
  38. Savitri, T.; Kim, Y.; Jo, S.; Bang, H. Satellite Constellation Orbit Design Optimization with Combined Genetic Algorithm and Semianalytical Approach. Int. J. Aerosp. Eng. 2017, 2017, 17. [Google Scholar] [CrossRef]
  39. Maral, G.; Deridder, J.J. Basic concepts of low Earth orbit satellite systems for communications. NASA STI/Recon Tech. Rep. N 1991, 92, 11248. [Google Scholar]
  40. Liu, H.; Wang, H. Orbit Determination of Satellite on the Middle-High Earth Orbit Based on GPS. Chin. J. Space Sci. 2005, 25, 293–297. [Google Scholar]
  41. Ganz, A.; Gong, Y. Performance study of low Earth-orbit satellite systems. IEEE Trans. Commun. 1994, 42, 1866–1871. [Google Scholar] [CrossRef]
  42. Matossian, M.G. Improved candidate generation and coverage analysis methods for design optimization of symmetric multisatellite constellations. Acta Astronaut. 1997, 40, 561–571. [Google Scholar] [CrossRef]
  43. Yang, H.; Zhang, Y.; Bai, X.; Li, S. Real-time satellite constellation scheduling for event-triggered cooperative tracking of space objects. IEEE Trans. Aerosp. Electron. Syst. 2024, 60, 2169–2182. [Google Scholar] [CrossRef]
  44. Lewis, H.G.; Radtke, J.; Rossi, A.; Beck, J.; Oswald, M.; Anderson, P.; Virgili, B.B.; Krag, H. Sensitivity of the space debris environment to large constellations and small satellites. J. Br. Interplanet. Soc. 2017, 70, 105–117. [Google Scholar]
  45. Zhang, Z.; E, Z.; Huang, L.; Li, J. Semi-Analytical algorithm for computing satellite-area target visibility. J. Tsinghua Univ. (Sci. Technol.) 2022, 62, 573–580. [Google Scholar]
  46. E, Z.; Li, J. Fast simulation algorithm for area target visibility using remote sensing satellites. J. Tsinghua Univ. (Sci. Technol.) 2019, 59, 699–704. [Google Scholar]
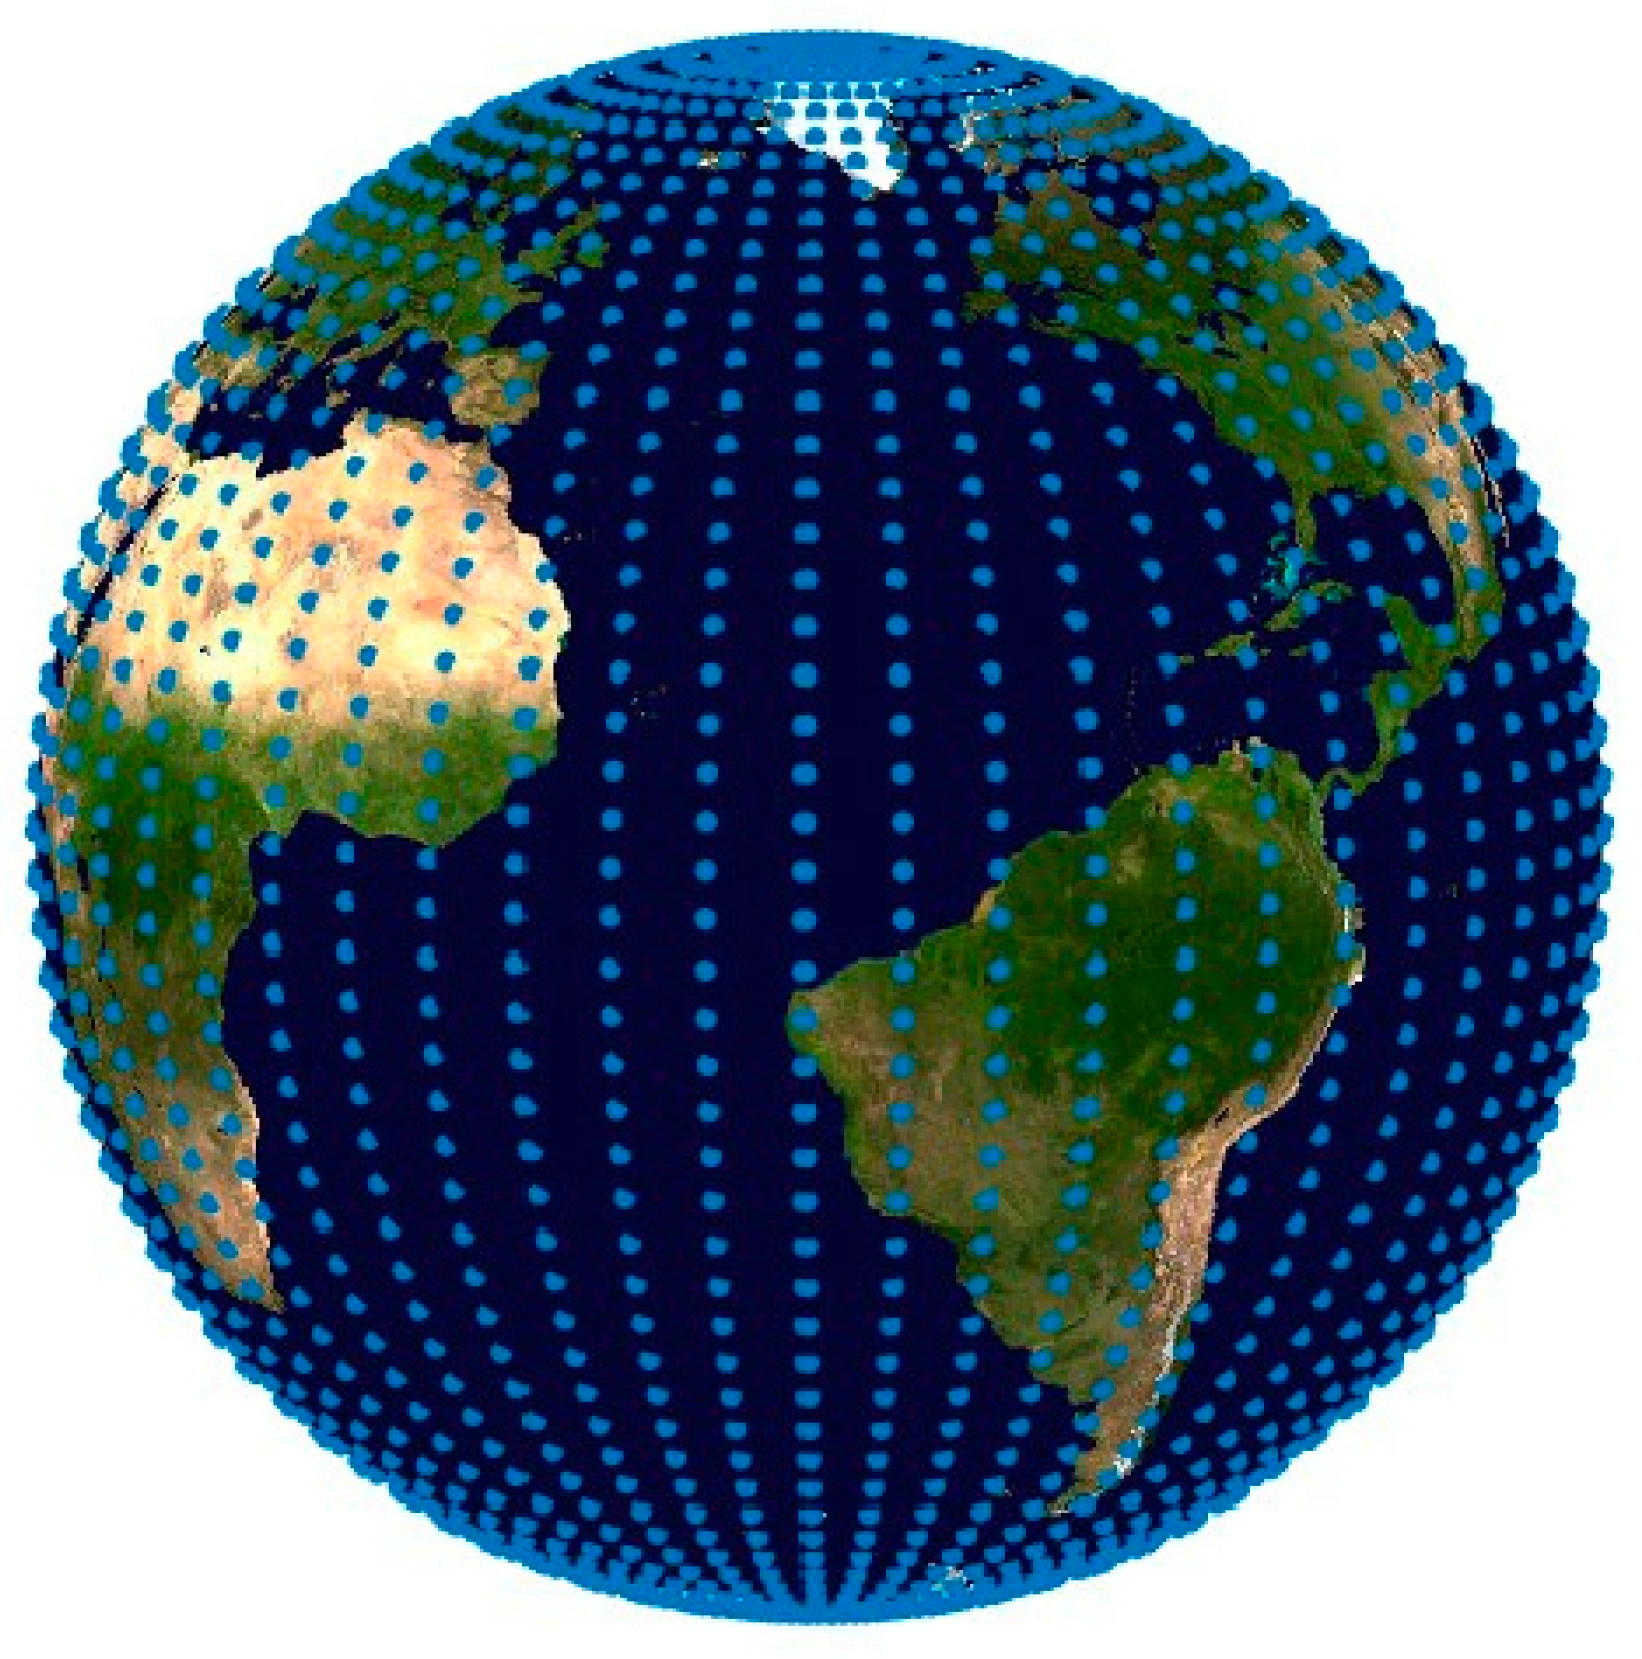
Figure 1. Traditional uniform point distribution on longitude–latitude sphere.
Symmetry 17 01619 g001
Figure 2. Schematic diagram of latitude band area calculation.
Symmetry 17 01619 g002
Figure 3. Spherical uniform point distribution algorithm (area-latitude adaptive).
Symmetry 17 01619 g003
Figure 4. Interaction pattern between satellite conical field of view and ground.
Symmetry 17 01619 g004
Figure 5. Schematic diagram of satellite–Earth relative positions.
Symmetry 17 01619 g005
Figure 6. Interaction pattern between satellite rectangular field of view and ground.
Symmetry 17 01619 g006
Figure 7. Interaction pattern between satellite arbitrary field of view and target area.
Symmetry 17 01619 g007
Figure 8. Flowchart of constellation coverage performance calculation.
Symmetry 17 01619 g008
Figure 9. Quadrilateral-boundary target area.
Symmetry 17 01619 g009
Figure 10. Comparative analysis of coverage performance metrics for quadrilateral boundary target regions: (a) Coverage time ratio; (b) Average coverage multiplicity; (c) Revisit time interval.
Symmetry 17 01619 g010
Figure 11. Hexagonal-boundary target area.
Symmetry 17 01619 g011
Figure 12. Comparative analysis of coverage performance metrics for hexagonal boundary target regions: (a) Coverage time ratio; (b) Average coverage multiplicity; (c) Revisit time interval.
Symmetry 17 01619 g012
Figure 13. Irregular-boundary target area.
Symmetry 17 01619 g013
Figure 14. Comparative analysis of coverage performance metrics for irregular boundary target regions: (a) Coverage time ratio; (b) Average coverage multiplicity; (c) Revisit time interval.
Symmetry 17 01619 g014
Figure 15. First Island Chain region.
Symmetry 17 01619 g015
Figure 16. Comparative analysis of 45° conical FOV coverage characteristics versus latitude: (a) Coverage time ratio; (b) Average coverage multiplicity; (c) Revisit time interval.
Symmetry 17 01619 g016
Figure 17. Comparative analysis of rectangular FOV coverage characteristics versus latitude for visible-light payload: (a) Coverage time ratio; (b) Average coverage multiplicity; (c) Revisit time interval.
Symmetry 17 01619 g017
Figure 18. Decreasing trend of satellite number with GA iteration rounds.
Symmetry 17 01619 g018
Figure 19. Comparative analysis of coverage performance versus latitude under minimum satellite constellation constraint: (a) Coverage time ratio; (b) Average coverage multiplicity; (c) Revisit time interval.
Symmetry 17 01619 g019
Figure 20. Progressive optimization of average coverage multiplicity with GA iterations.
Symmetry 17 01619 g020
Figure 21. Latitudinal comparison of coverage performance optimization under satellite number constraint: (a) Coverage time ratio; (b) Average coverage multiplicity; (c) Revisit time interval.
Symmetry 17 01619 g021
Table 1. Boundary point coordinates of boundary points for differently shaped target regions.
IdxQuadrilateral-Boundary Target AreaHexagonal-Boundary Target AreaIrregular-Boundary Target Area
Latitude (°)Longitude (°)Latitude (°)Longitude (°)Latitude (°)Longitude (°)
126.48117.1010.283.3641.72−124.14
220.86113.406.821.3640.21−124.36
320.86127.443.353.3638.90−123.70
426.48131.143.357.3638.03−123.01
5 6.829.3637.20−122.41
6 10.287.3636.29−121.89
7 35.20−120.82
8 34.54−120.58
9 34.38−119.84
10 34.14−119.19
11 34.00−118.51
12 33.70−118.30
13 32.69−117.24
14 32.52−117.13
15 32.72−114.58
16 33.00−114.46
17 33.65−114.51
18 34.29−114.10
19 34.99−114.63
20 39.04−119.99
21 41.99−120.01
22 41.99−123.81
Table 2. Parameter settings for simulation experiments.
Simulation ParametersSet Values
Cone Field of View of the Payload (°)45
Simulation Start Time1 January 2024, 00:00:00
Simulation End Time2 January 2024, 00:00:00
Time Step for Calculation (s)10
Longitude and Latitude Point Step (°)1
Table 3. Geographic coordinates of First Island Chain boundary points.
Latitude (°)Longitude (°)
32.81120.86
30.17122.04
26.62120.99
21.82114.87
20.17106.91
9.39101.65
5.77102.57
1.42105.14
2.61110.20
6.82116.12
14.12120.33
23.07121.25
24.58121.78
26.49126.98
31.10130.60
34.71128.42
34.71121.32
Table 4. Parameter settings for simulation experiments.
Simulation ParameterSet Value
Cone Field of View of the Payload (°)45
Simulation Start Time1 January 2024, 00:00:00
Simulation End Time2 January 2024, 00:00:00
Time Step for Calculation (s)60
Grid Point Spacing in Latitude and Longitude (°)3
Genetic Algorithm Population Size50
Genetic Algorithm Iteration Count100
Disclaimer/Publisher’s Note: The statements, opinions and data contained in all publications are solely those of the individual author(s) and contributor(s) and not of MDPI and/or the editor(s). MDPI and/or the editor(s) disclaim responsibility for any injury to people or property resulting from any ideas, methods, instructions or products referred to in the content.