Abstract
In fresh produce cold chain last-mile delivery, the highly dispersed customer base leads to exorbitant delivery costs, posing the greatest challenge for cold chain enterprises. Achieving a symmetrical balance between cost-efficiency, environmental sustainability, and service quality is a fundamental pursuit in logistics system optimization. This paper proposes integrating the crowd-shipping logistics model—characterized by internet platform sharing and flexibility—into the delivery service. It incorporates and extends features such as cold chain delivery, mixed fleets using gasoline and diesel vehicles (GDVs), electric vehicles (EVs), partial charging strategies for EVs, and time-of-use electricity pricing into the crowd-shipping model. A joint delivery mode combining traditional professional delivery (using GDVs and EVs) with crowd-shipping is proposed, creating a symmetrical collaboration between centralized fleet management and distributed social resources. The challenges associated with utilizing occasional drivers (ODs) are analyzed, along with the corresponding compensation decisions and allocation-related constraints. A route optimization model is constructed with the objective of minimizing total cost. To solve this model, an Improved Whale Optimization Algorithm (IWOA) is proposed. To further enhance the algorithm’s performance, an adaptive variable neighborhood search is embedded within the proposed algorithm, and four local search operators are applied. Using a case study of 100 customer nodes, the joint delivery mode with OD participation reduces total delivery costs by an average of 24.94% compared to the traditional professional vehicle delivery mode, demonstrating a more symmetrical allocation of logistical resources. The experiments fully demonstrate the effectiveness of the joint delivery model and the proposed algorithm.
1. Introduction
Transportation, particularly road freight, contributes 14% to global greenhouse gas emissions, with road transport accounting for 75% of this share [1]. This issue is especially significant in fresh produce cold chain logistics. To maintain the freshness of perishable goods like refrigerated yogurt and frozen foods, cold chain transport requires a low-temperature environment throughout the journey, resulting in energy consumption and carbon emissions 30% higher than conventional vehicles [2]. The widespread use of gasoline and diesel vehicles (GDVs), along with refrigerant usage and fuel combustion, are key factors increasing energy consumption and environmental costs. As living standards rise and the fresh produce e-commerce market expands (55% of US consumers are projected to buy groceries online by the end of 2024 [3]; China’s cold chain logistics market revenue is expected to reach CNY 581.6 billion in 2024 [4] and CNY 630.2 billion by 2026 [5]), the conflict between economic development and carbon reduction in fresh produce cold chain logistics becomes increasingly prominent [6].
Promoting electric vehicles (EVs) is crucial for clean energy transition [7]. However, EVs face route optimization challenges due to limited range, insufficient charging infrastructure, and high purchase costs, which restrict their large-scale independent deployment. This makes route planning difficult, as delivery routes must be efficiently planned within the limited range, considering charging station distribution and time-of-use electricity pricing. Consequently, logistics companies often adopt mixed fleets of EVs and traditional GDVs, leveraging EVs’ environmental benefits and lower operating costs while relying on GDVs for long-distance or complex routes.
In fresh produce cold chain logistics, “last-mile” delivery faces challenges like dispersed customers and strict timeliness and freshness requirements, leading to high delivery costs. The sharing economy offers a solution through the “crowd-shipping” model. This model, based on digital platforms, integrates and utilizes idle social transportation capacity to flexibly complete last-mile delivery tasks during predetermined trips in exchange for low compensation [8]. Platforms like Amazon Flex, Walmart Spark, Meituan Crowd-shipping, and Dada effectively mobilize social delivery resources, enhancing responsiveness and flexibility, and addressing cold chain last-mile pain points. To cope with surging demand and capacity pressure, collaboration between occasional drivers (ODs) and enterprise-owned professional fleets (including mixed fleets) is becoming key to improving delivery efficiency and quality.
However, a significant research gap persists. The existing literature often treats the challenges of mixed fleets, crowd-shipping, and cold chain logistics in isolation, leading to oversimplified models. Studies on mixed GDV/EV fleets frequently overlook the integration of crowd-shipping resources, while research on crowd-shipping typically assumes homogeneous vehicles and neglects critical EV constraints, such as partial charging under time-varying electricity costs. Furthermore, the intricate costs of continuous refrigeration and product spoilage unique to cold chains are seldom incorporated jointly with these elements.
This disjunction fails to capture the complex synergies and trade-offs inherent in real-world last-mile delivery. Our work directly bridges this gap by proposing a unified optimization framework that concurrently coordinates a professional mixed fleet with a crowd-shipping network. The model holistically integrates partial charging strategies, time-of-use pricing, refrigeration costs, and product perishability, providing a comprehensive solution that moves beyond the current siloed approach.
This paper combines and extends the features of cold chain distribution, mixed fleet, EV partial charging strategies, and time-of-use electricity pricing within a crowd-shipping model. The core concepts of this study are intrinsically linked to the principle of symmetry in systems engineering and optimization. Firstly, the problem inherently seeks a symmetrical balance between multiple, often competing, objectives: minimizing economic cost and maintaining product quality (freshness). Secondly, the proposed solution—a hybrid system integrating professional fleets (GDVs and EVs) with a crowd-shipping network—establishes structural symmetry between centralized, planned logistics and decentralized, opportunistic resources. This symbiotic relationship ensures system resilience and flexibility. Furthermore, the algorithmic solution (IWOA) employs symmetric and asymmetric search patterns (through its adaptive variable neighborhood search) to navigate the complex solution space efficiently, mirroring the balance between intensive local search (exploitation) and broad global search (exploration). Thus, this work contributes to the field of symmetry by applying its principles to achieve harmonious and efficient coordination in a complex, real-world logistics system.
The main contributions of this paper are:
(1) Integrated crowd-shipping and mixed fleet model: A novel integration framework for ODs and professional fleets (GDVs and EVs) under partial charging and time-of-use pricing in cold chain optimization
(2) Precise EV operational modeling: Advanced EV routing optimization that accounts for battery thresholds, partial charging flexibility, and dynamic energy costs to enhance operational feasibility.
(3) Hybrid metaheuristic with adaptive search: Developed an Improved Whale Optimization Algorithm integrating adaptive variable neighborhood search and specialized operators for complex mixed-fleet routing.
The rest of the paper is organized as follows: In Section 2, the related work is reviewed. Section 3 presents the formulation for model construction. In Section 4, the proposed IWOA is described in detail. Section 5 discusses simulation experiments, including a comparison of experimental results and a comparative analysis of algorithms. Finally, Section 6 summarizes the study and explores possible extensions.
2. Literature Review
There are three types of literature related to this study: (1) cold chain distribution vehicle routing problems, (2) crowd-shipping vehicle routing problems, and (3) heterogeneous fleet vehicle routing problems.
2.1. Cold Chain Distribution Vehicle Routing Problem
The cold chain distribution vehicle path optimization problem, vital to logistics, aims to balance product timeliness, quality, and energy use. Early studies combined Vehicle Routing Problem with Time Windows (VRPTW) with penalty costs for perishability [9]. As sustainability grows in importance, researchers have integrated economic, environmental, and social goals. Leng et al. [10] created a model minimizing costs, waiting times, and environmental harm. Wei et al. [11] included fuel costs and time limits, strengthening the energy consumption model.
Product quality has emerged as a key focus. Liu et al. [12] examined the trade-offs among costs, freshness, and emissions. Mousavi et al. [13] developed a stochastic algorithm for reducing quality loss in perishable product transport. Temperature control is crucial for energy efficiency. Hsu and Chen [14] explored multi-temperature zone distribution. Chen et al. [15] introduced a time-dependent refrigeration cost model, showing traffic and carbon taxes’ impact on energy use.
Carbon emission costs are now integral to decision making. Zhang et al. [2] created a low-carbon routing model using an enhanced ant colony algorithm. Zulvia et al. [16] used a multi-objective algorithm for green vehicle routing with dynamic times. Multi-depot and multi-vehicle type scenarios are emerging trends. Chen et al. [17] used the variable neighborhood search for multi-compartment loading. Song et al. [18] improved the artificial fish swarm algorithm for heterogeneous fleets. Wang et al. [19] proposed a collaborative multi-depot model for cost reduction.
In recent years, the hybrid scheduling of electric and fuel-powered refrigerated vehicles has become an emission reduction hotspot. Song et al. [20] validated the environmental advantages of electric models for short-distance delivery through urban–rural customer distribution experiments. However, existing research still exhibits significant limitations: most models oversimplify charging facility availability and charging time constraints, while failing to adequately integrate social transportation resources to address last-mile delivery volatility.
2.2. Crowd-Shipping Vehicle Routing Problem
Crowd-shipping logistics provides an innovative pathway to overcome last-mile delivery bottlenecks by integrating fragmented social transportation resources. Archetti et al. [21] pioneered the concept of the crowd-shipping vehicle routing problem, enabling companies to outsource partial demands to opportunistic drivers, significantly reducing fixed fleet sizes. Subsequently, scholars progressively expanded model complexity: Macrina et al. [22] incorporated customer and driver time window constraints while enabling single-driver multi-task delivery; Dahle et al. [23] explored dynamic pickup–delivery scenarios involving collaboration between professional and ODs. Notably, interdisciplinary research merging crowd-shipping with green logistics has recently emerged. Macrina et al. [24] first demonstrated that integrating ODs into mixed fleets (fuel/electric vehicles) simultaneously reduces operational costs and pollution emissions; Niu et al. [25] utilized Beijing’s empirical data to prove that crowd-shipping decreases empty mileage and CO2 emissions. Concurrently, incentive mechanism design has become critical. Cao et al. [26] proposed distance-proportional compensation formulas with professional driver fairness constraints; Le et al. [27] optimized task allocation efficiency by predicting driver acceptance rates through compensation threshold models. In practical applications, Guido et al. [28] validated environmental benefits of combining trucks, cargo bikes, and crowd-shipping in Turin case studies; and Macrina et al. [29] further developed a bi-objective integer programming model (cost minimization and emission minimization) to quantify crowd-shipping’s contribution to sustainability.
However, crowd-shipping cold chain research remains nascent. Qi and Zhu [30] proposed a two-echelon hybrid open-close cold chain routing model solved by an adaptive large neighborhood search algorithm. Despite significant progress, the existing literature predominantly assumes homogeneous vehicles and overlooks charging constraints for electric ODs, failing to address mixed fleet coordination needs in cold chain scenarios. Moreover, dynamic routing optimization models exhibit response latency in real-time operations.
2.3. Mixed Fleet Vehicle Routing Problem
The mixed fleet vehicle routing problem enhances system flexibility by coordinating vehicles with varying capacities, energy consumption profiles, and operating costs. Early research focused on fuel-powered vehicle heterogeneity is as follows: Subramanian et al. [31] developed a hybrid algorithm (iterative local search and set partitioning) that reduced total costs by 9.3% in 360-node tests, demonstrating that vehicle type matching enhances resource utilization; Koç et al. [32] revealed the cost penalty of homogeneous fleets through Pareto frontier analysis—heavy-duty fleets increased costs by 22.46%–28.58%, light-duty fleets by 19.88%, and medium-duty fleets by 2.49%, all underperforming heterogeneous solutions. With the proliferation of electric vehicles (EVs), mixed fleets (fuel + electric) have emerged as a new pathway for emission reduction. Goeke and Schneider [33] integrated energy consumption models for both vehicle types, incorporating dynamic variables like road gradient and load weight; and Hiermann et al. [34] further incorporated charging station constraints to synchronize EV fleet sizing and routing. Recent algorithmic innovations accelerate complex scenario applications: Macrina et al. [35] developed an iterative local search algorithm supporting partial charging strategies for EVs; Ren et al. [36] established a dual-objective hybrid energy model (environmental benefits + customer satisfaction), improving variable neighborhood search efficiency by 40%. Chen et al. [37] further advanced mixed fleet routing by incorporating hybrid energy modes and partial charging strategies, demonstrating significant cost savings in clustered customer scenarios through Dantzig–Wolfe decomposition.
In cold chain logistics, heterogeneous fleet research faces unique challenges: Li et al. [38] designed a branch-and-price algorithm for mixed electric/fuel refrigerated vehicle routing with time windows; Bac and Erdem [39] optimized EV charging schedules by integrating multi-depot operations, time-of-use electricity pricing, and split deliveries. Notably, fleet renewal strategies impact long-term emission reduction: Jiang et al. [40] proposed a shared mixed fleet sizing method to minimize redundant vehicle investments.
However, prior research on heterogeneous fleets exhibit critical limitations that our work explicitly addresses. First, the majority of existing models overlook the potential for cold chain-specific collaboration with ODs, treating professional fleets and crowd-shipping resources as separate domains. Second, and more significantly, they fail to jointly optimize the unique cost structures of cold chain logistics—namely, product spoilage and continuous refrigeration costs—with the operational complexities of a mixed GDV/EV fleet, which includes partial charging strategies under time-of-use electricity pricing. Furthermore, while recent advances have effectively integrated optimization with prediction and control in dynamic systems [41,42], the literature on mixed fleet routing has predominantly overlooked the holistic optimization of this complex set of static logistical constraints that are unique to the last-mile delivery problem. This siloed approach, as highlighted in the introduction, neglects the complex synergies and trade-offs inherent in the integrated problem. Our work aims to fill this comprehensive gap by proposing a unified model that concurrently tackles cold chain perishability, time-varying energy costs, partial charging, and crowd-shipping compensation within a single optimization framework, thereby advancing the practical application potential of mixed fleets in fresh product distribution.
3. Problem Formulation and Model Development
3.1. Problem Description
Consider a scenario where a crowd-shipping platform within a network diagram (e.g., Figure 1) utilizes a professional fleet and capable ODs to manage mixed delivery requests from the depot. The professional mixed fleet comprises GDVs and EVs. The number of customers, locations, demands, and service time windows are all predefined.
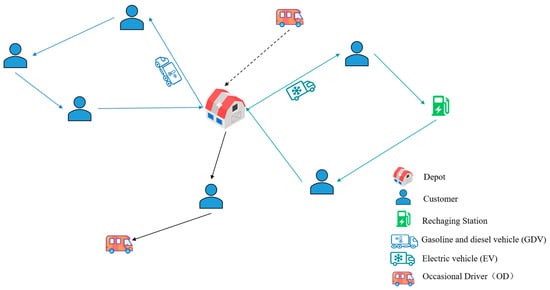
Figure 1.
Cold chain distribution network.
A realistic energy consumption model is employed to construct the mathematical model. This model accounts for fixed costs, damage costs, refrigeration costs, penalty costs, and energy consumption (transportation costs for GDVs and charging costs for EVs). Furthermore, the ODs have their own destinations. This enables us to model the routing problem for ODs while maintaining the structure of the generic formulation and incorporating professional mixed vehicles. Consequently, a new term, namely, compensation for ODs, is added to the objective function. The optimization algorithm is designed to minimize the total cost of the model, yielding a best-found solution vehicle configuration and routing scheme.
3.2. Model Foundations
3.2.1. Assumptions
(1) EVs have a limited range, whereas GDVs have a larger range, which is considered sufficient to fulfill the distribution tasks during the planning period;
(2) EVs are fully charged when departing from the depot. If they have insufficient power on the way to distribution, they can go to the recharging station to recharge;
(3) ODs are fuel-powered vehicles; (This assumption is made to simplify the model for non-professional drivers, avoiding the complexities of range anxiety and charging behavior that could deter participation, and to align with the current reality where the majority of private vehicles are fuel-powered.)
(4) Professional vehicles will not return to the depot until the last customer is served. After serving the last customer, ODs will return to their respective destinations.
The assumption that professional vehicles only return to the depot after completing all assigned routes reflects a common practice in full truckload delivery operations, maximizing daily utilization and minimizing empty runs. For ODs, concluding their trip at their personal destination is a core incentive of the crowd-shipping paradigm.
3.2.2. Notation
The mathematical notation used throughout the model formulation is summarized in Table 1.

Table 1.
Model notation definition.
3.3. Electric Vehicle Charging Metrics
3.3.1. Partial Charging Strategies
EVs consume battery charge proportionally with distance travel, requiring charging upon reaching a task point if either: (1) the battery level falls below 20% of maximum capacity (safe charge), or (2) the remaining charge is insufficient to reach the nearest charging station. The charging quantity is then determined by the power requirements of the remaining tasks—charging to 80% of maximum capacity if the required power exceeds the EV’s capacity, otherwise charging precisely to the required capacity.
Figure 2 illustrates this with 12 customers (C1–C12), 4 stations (R1–R4), and a depot (D). E1 serves C1 and C2 without charging. E2, after delivering to C5, charges at R1 to the required level for serving C3, C4, and C6. E3 charges once at R4 and twice at R3, demonstrating that stations can be used multiple times. R2 is available but is not used in the depicted solution. Battery charge percentages along routes indicate state upon arrival/departure.
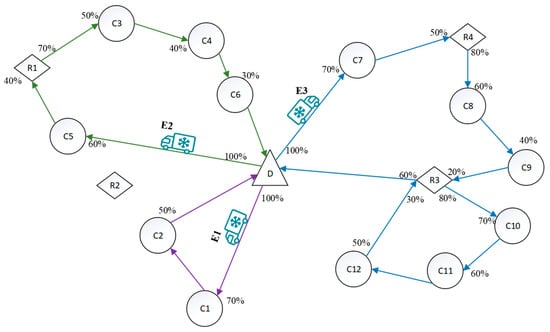
Figure 2.
Schematic diagram of electric vehicle charging.
3.3.2. Time-of-Use Electricity Pricing
This paper uses time-of-use electricity pricing data from policies issued by China’s Jiangsu Provincial Development and Reform Commission in 2023 [43]. Equation (1) and Figure 3 show the relationship between EV charging prices and time periods, where is the charging price at time t (the unit is CNY/kWh).
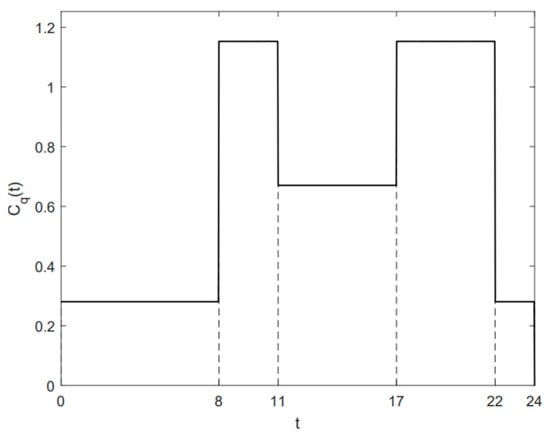
Figure 3.
Time-of-use electricity pricing function.
3.4. Cost Analysis
The mathematical models for calculating the following costs are adapted from foundational works in the literature [2,10,11,27].
(1) Fixed costs: The single-use cost incurred by a depot for dispatching each vehicle includes routine maintenance costs and driver wages. This component of the cost is independent of the vehicle’s travel time and distance, and it typically remains constant.
The first and second terms in (2) represent the aggregate fixed costs associated with all GDVs and EVs, respectively, when departing from the depot.
(2) Transportation costs: Transportation costs in (3) are related to the fuel consumption of GDVs and are typically proportional to vehicle mileage.
(3) Charging costs: When an EV has insufficient remaining power, it will either proceed to a nearby charging station to recharge or return to the depot. The charging cost in (4) is calculated as the product of the charging amount at the station and the EV’s electricity cost per unit. The total charging cost is a nonlinear function of the continuous time variable. To linearize this, we employ a time discretization strategy, segmenting the planning horizon into fixed intervals with constant electricity prices.
(4) Damage costs: Perishable products tend to degrade significantly over time, which affects their quality. To model the change in freshness of these products, the freshness decay function proposed in the literature is employed [44]. The exponential term introduces a nonlinearity into the objective function. In this function:
represents the freshness of the cold chain product at time t;
, the initial freshness, is set to a fixed value of 1 in this study, indicating that the product starts with 100% freshness when it leaves the depot;
denotes the freshness decay coefficient.
Given the brief duration that the refrigerated compartment door is open during service at customer points, the model does not differentiate between the cargo damage that occurs while the vehicle is in route and that which occurs during service stops.
In (5), the first term represents the cost of damage incurred by GDVs during delivery to customer , the second term for EVs, and the third term for ODs.
(5) Refrigeration Costs: Cold chain products are perishable. To maintain product freshness, refrigerated trucks consume refrigerants to preserve a low-temperature environment, incurring refrigeration costs. These costs cover the refrigerants used during both product transportation and unloading. In (6), refrigeration costs are assigned as follows: the first term corresponds to GDVs, the combined second and third terms correspond to EVs, and the fourth term corresponds to ODs.
The decomposition of EV refrigeration cost into two components reflects their operational distinction from GDVs. Whereas GDVs have sufficient range, EVs require mid-route charging, during which the refrigeration system continues operating and accruing costs. Consequently, the second term quantifies refrigeration during transit, and the third term during charging, enabling a precise operational cost comparison across the mixed fleet.
(6) Supplementary costs: Willing ODs visit the depot to serve customers in their assigned delivery areas. Orders from a customer cluster can be accepted by ODs if the supplementary distance they traverse to serve this cluster is less than times the distance from the depot to their ultimate destination. In (7), the logistics company’s reimbursement to ODs for customer service is proportionate to the supplementary costs arising from detours.
(7) Penalty Costs: In real scenarios, fresh products may be delivered earlier or later than the customer’s time window. When the vehicle arrives at the customer at a time outside of the time window in which the customer can receive the service, a certain time window penalty cost will be incurred, as in (8). Where the coefficient of the time penalty function is set to be greater than the coefficient , as delayed deliveries cause constant penalty costs to compensate for the customer’s waiting time.
3.5. Mathematical Model
Our mathematical model is defined as follows:
Constraints:
The model’s constraints are partitioned by vehicle type: professional vehicles (10)–(30) and ODs (31)–(38). For professional vehicles: (10)–(11) ensure nodal flow conservation, maintaining route continuity, while load (12)–(15) govern vehicle capacity by tracking load weight changes between nodes and enforcing maximum capacity limits. Timing constraints (16)–(22) manage the complex temporal aspects of the operation: constraint (16) calculates GDV arrival times at customer points; (17) determines EV timing with considerations for recharging scenarios; (18)–(19) define departure times from customer sites and charging stations; and (20)–(21) detail travel time calculations between nodes. EV-specific energy management is addressed through (22)–(26), which ensure a full initial charge, calculate power consumption between nodes, maintain a minimum 20% charge safety buffer, exempt unloading operations from power consumption, and regulate the charging process. Structural requirements are enforced through (27)–(30), ensuring all professional vehicle routes start and end at the depot, each customer is visited exactly once, and defining the decision variables. For ODs: (31) enforces flow conservation, (32)–(33) impose load limits, (34)–(36) manage time constraints, (37) restricts detour distance, and (38) defines decision variables.
The model structure ensures that a feasible solution exists using only the professional fleet, guaranteeing the non-emptiness of the overall constraint set for the defined problem.
4. Improved Whale Optimization Algorithm
The proposed optimization model for integrated cold chain crowd-shipping with time-of-use electricity costs is a Mixed-Integer Nonlinear Programming (MINLP) model. Nonlinearities arise from the exponential freshness decay function and time-dependent charging costs, making exact solutions computationally prohibitive for real-world instances due to non-convexity. To enhance tractability, the model is reformulated into a Mixed-Integer Linear Program (MILP) via piecewise linear approximation of the freshness decay and time discretization of electricity pricing. Despite linearization, the problem remains NP-hard for large-scale instances, necessitating a metaheuristic approach.
This paper introduces an Improved Whale Optimization Algorithm (IWOA). The original Whale Optimization Algorithm (WOA), inspired by humpback whales’ foraging behavior, offers simple implementation and few parameters but suffers from slow convergence and local optima stagnation in complex problems [45,46,47,48]. The IWOA enhances the WOA by integrating an adaptive variable neighborhood search (VNS), improving both global exploration and local exploitation capabilities.
The computational complexity of the IWOA is governed by three main components: population initialization, the main iterative loop including position updates, and the adaptive VNS procedure. This structure ensures effective navigation of the complex solution space inherent in the underlying rich VRP—which incorporates time-of-use electricity pricing, perishability, and crowd-shipping, and is strongly NP-hard. The IWOA achieves a superior balance between exploration (via encircling and random search mechanisms) and exploitation (through bubble-net attack behavior and VNS), reducing premature convergence and improving solution quality compared to algorithms that emphasize one search aspect over the other. The analytical procedure of the IWOA is illustrated in Figure 4.
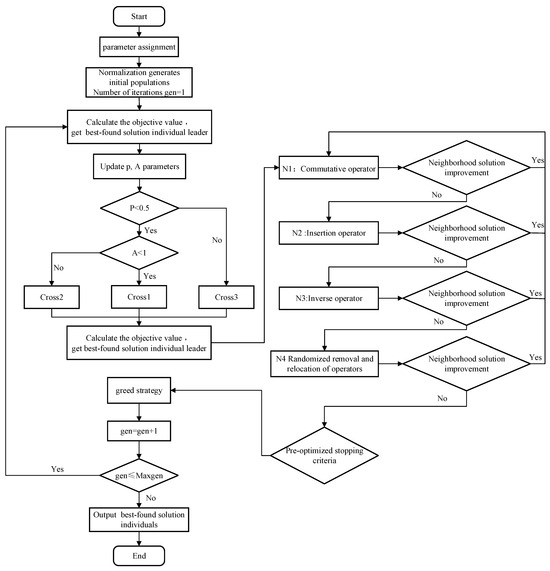
Figure 4.
Improved Whale Optimization Algorithm Flowchart.
4.1. Encoding and Decoding
The algorithm employs positive integer encoding. Each whale individual represents a feasible solution, with its length being the sum of the number of customer points and the total number of vehicles. For instance, when serving 5 customer points with 2 GDVs, 1 EV, and 1 OD, the customers are numbered 1 to 5, the GDVs are numbered 6 and 7, the EV is numbered 8, and the OD is numbered 9. A whale individual generated according to the initial solution generation rule is encoded as {6, 5, 3, 7, 2, 8, 4, 9, 1}. This indicates that GDV6 serves customer points 5 and 3 in sequence, GDV7 serves customer point 2, EV8 serves customer point 4, and OD9 serves customer point 1. Finally, charging stations are inserted into each route based on the EV’s power constraints to obtain the final delivery solution.
4.2. Generate Initial Solution
First, a random sequence generates the initial population. After that, the location coding of the whales is repaired: (1) Ensure that the first node in the coding is a vehicle node: if the first node in the location coding is not a vehicle node, swap the first node with the first vehicle node in the coding; (2) Ensure that every vehicle satisfies the capacity constraints: for each vehicle exceeding the capacity constraints, attempt to move the node with the smallest demand in its route to the route of another vehicle that still has available capacity; and (3) OD detour repair: randomly select the demand points of ODs that do not satisfy the constraint and insert them into the routes of other non-ODs. Then, check whether there is a customer that does not satisfy the power constraint, and if so, insert the nearest charging station to the previous customer into the distribution route.
4.3. Individual Whale Position Update
The traditional whale optimization algorithm is not suitable for solving discrete optimization problems. Therefore, it is necessary to adapt the algorithm by integrating the model’s characteristics and considering the position update mechanisms of whale individuals. Additionally, introducing the crossover operation from genetic algorithms can help complete the position update of whale individuals.
Assuming that the current best whale individual is , the current whale individual is , then the update formula for the current whale individual is as follows:
In (39), is the third crossover mode of crossover operation for two whale individuals; and p is a random number from 0 to 1.
In (40), is the first crossover mode of crossover operation for two whale individuals; is the second crossover mode of crossover operation for two whale individuals; and A is a random number from 0 to 2.
The parameter p controls the choice between exploitation and exploration, while A further refines the exploitation strategy by switching between local and global search.
The first crossover method is shown in Figure 5, with individual shown in the top row and individual shown in the middle row. The crossover steps are as follows:
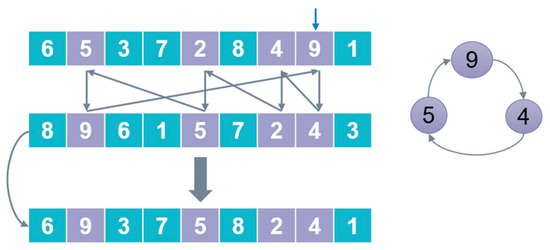
Figure 5.
The first crossover method .
Step 1: First, randomly select an element at a position in the individual whale (element 9 at position 8), secondly, find the element (element 4) at the position in the individual whale , then go back to the individual whale to find the position of the element (element 4 at position 7), and then find the element (element 2) at the position in the individual whale . Repeat the previous work until a loop is formed (Figure 5 right diagram), the positions of all the elements in the loop are the final selected positions (positions 2, 5, 7, and 8).
Step 2: Use the selected element in the whale (9, 5, 2, 4)—put them in the positions selected in Step 1 and supplement with the remaining elements from the whale to construct whale (bottom row in Figure 5).
The second crossover method is shown in Figure 6, with individual shown in the top row and individual shown in the middle row. The crossover steps are as follows:
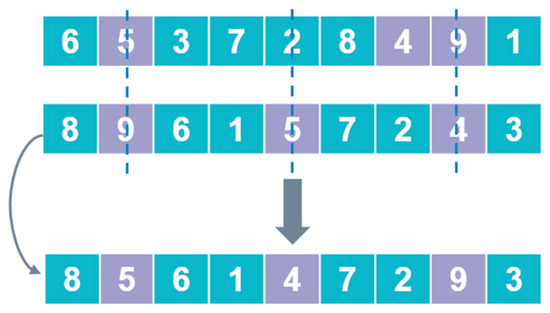
Figure 6.
The second crossover method .
Step 1: Randomly select a set of position indices (in this example, positions 2, 5, and 8, marked with dashed lines in Figure 6) and extract the elements at these positions from (elements 9, 5, and 4). Then, determine the order in which these elements appear in the leader individual (element 5 appears first at position 2, followed by element 4 at position 7, then element 9 at position 8).
Step 2: Keep the unselected elements in the individual whale unchanged and fill the selected positions in sequence with the elements obtained in Step 1 (i.e., position 2 receives 5, position 5 receives 4, and position 8 receives 9). The resulting offspring is shown in the bottom row of Figure 6.
The third crossover method :
Step 1: Randomly select the elements at two positions in the whale individual and swap their positions, as shown in Figure 7.
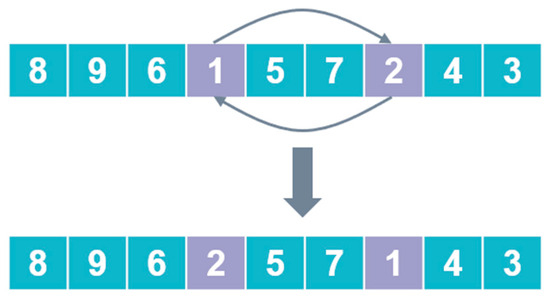
Figure 7.
The third crossover method : switching operations section.
Step 2: The modified new individual and the whale individual are subjected to the operation.
4.4. Charging Station Insertion Operator
If the current power is not enough to fulfill the remaining tasks or it is less than 20% upon reaching the next demand point, charging stations are added after the current demand point. In order to avoid vehicles visiting charging stations that are too far away, the charging station with the shortest distance is inserted before the vehicle falls below the safety threshold, provided that the power constraint is satisfied.
4.5. Local Search Strategy
The WOA is known to be susceptible to falling into local optima. To counteract this issue, the variable neighborhood search (VNS) algorithm, introduced by Mladenović and Hansen in 1997, is integrated [49]. VNS, a powerful metaheuristic for solving combinatorial and global optimization problems, systematically explores multiple neighborhoods and incorporates perturbation phases to effectively escape local optima. By enhancing the WOA with the VNS, the resulting algorithm benefits from the robust exploration capabilities of the VNS, which helps in overcoming the limitations of the WOA and leads to improved optimization performance.
4.5.1. Variable Neighborhood Search
In this paper, VNS is used for the local search operation, with the best-found solution s from each iteration of the WOA serving as the initial solution for the VNS.
Given the initial solution s, defines m neighborhood structures, denoted as . The graphical illustration of the variable neighborhood search algorithm is shown in Figure 8.

Figure 8.
Neighborhood search process.
When the search in the current neighborhood fails to find a better solution than the current one, the algorithm jumps to the next neighborhood to continue the search. Conversely, if an improved solution is found within the current neighborhood, the algorithm resets to the first neighborhood to restart the search, as shown by the green solid line.
4.5.2. Neighborhood Search Operators
N1 Commutative Operator: Randomly selects two different positional indexes and exchanges the elements at these positions.
N2 Insertion Operator: Randomly removes an element, keeps the others unchanged, and inserts the removed element into a random position.
N3 Inverse Operator: Randomly reverses the order of a segment.
N4 Random Removal and Relocation Operator: Randomly selects 20% of elements from different positions in the original sequence, removes them, and inserts them sequentially into random positions.
4.5.3. Adaptive Mechanisms
The Adaptive Mechanisms section describes a dynamic neighborhood search strategy that adjusts the search count according to the algorithm’s iteration phase. Initially, the search count is set low to accelerate population convergence. If the best-found solution does not improve after a local search, both the neighborhood search count and the consecutive unchanging count increase. Conversely, if the solution improves, these counts reset. The process continues until the consecutive unchanging count hits the maximum preset value, at which point the algorithm stops and outputs the best-found solution.
4.6. Greedy Strategy
This paper also incorporates the destruction and repair principles from the large-scale neighborhood search method. Initially, destruction is applied to indiscriminately remove multiple nodes from the current solution. Subsequently, the repair operator, which employs the greedy heuristic insertion algorithm by Popke and Pisinger is used to reinsert the removed nodes into the disrupted solution [50]. The algorithm traverses each node, attempting insertion into different vehicle routing positions and calculating the resulting objective function value change. If a more favorable insertion point is identified (i.e., one that reduces the objective function value), the best-found solution insertion vehicle and location are updated.
5. Simulation Experiment and Result Analysis
5.1. Experimental Setup
The benchmark instances employed in this computational study are synthetic, a common and necessary practice in the field due to the current absence of public real-world datasets for cold chain distribution problems that integrate the specific complexities of mixed fleets, partial charging strategies, and crowd-shipping with occasional drivers. Consequently, this study develops a new dataset based on prior studies. To ensure the representativeness and validity of our experiments, these instances were meticulously constructed based on well-established and widely recognized frameworks from the operations research literature.
Framework and charging station locations: The charging station locations in this study are adapted from the electric vehicle routing problem (EVRP) dataset by Schneider et al. [51]—which builds upon the Solomon benchmark—via a linear transformation to align with the spatial and logistical context of our problem.
Customer time windows are adapted from Solomon’s benchmark [52], with modifications to tighten time windows reflecting the urgent freshness requirements of cold chain logistics, informed by the approaches in [51,53]. The earliest departure time from the depot is uniformly set to 7:30 a.m. to align with typical urban distribution operations.
ODs destinations: The study refers to Martin-Santamaria et al. [54] to set the destination coordinates of ODs. The specific number of ODs available for each instance is assigned based on the scale configurations defined in Table 2.

Table 2.
Scale configurations.
The dataset comprises 15 instances spanning three dimensions:
Scale: Defined by customer count, charging stations, and ODs;
Distribution type: Solomon’s spatial patterns (Random/R, Clustered/C, Mixed/RC);
Base cases: C101, C201, R101, R201, RC101.
Naming convention: [Base cases]—[Customer Count].
For example, in C101-100: C101 indicates the geographical distribution is based on the clustered distribution case C101, and 100 indicates there are 100 customers (which, according to Table 2, corresponds to the medium scale configuration: 20 charging stations and 50 ODs).
The experimental parameter settings are shown in Table 3.

Table 3.
The experimental parameters of the simulation.
All algorithms were programmed using MATLAB R2019b, the operating system is Windows 11, the computer has 16 GB of RAM, and the CPU is an Intel(R) Core (TM) i7-13700H at 2.40 HHz.
To ensure fairness and reproducibility, all algorithms were configured with parameters established through preliminary experiments and common practices in the metaheuristics literature. The population size was set to 100 for all population-based algorithms (IWOA, WOA, GA, BSO, GWO), and a maximum of 200 iterations was set as the common stopping criterion. The random number generator seed was fixed using MATLAB’s rng(1) command to ensure reproducible results.
The key parameter settings for each algorithm are specified as follows:
- -
- IWOA: Convergence parameter (A) randomly generated in the range [0,2] to regulate exploitation intensity; initial VNS count: 5; maximum stagnation count: 10; destruction proportion: 20%.
- -
- WOA and GWO: Convergence parameter (A) varying randomly between 0 and 2.
- -
- GA: Crossover rate: 0.8; mutation rate: 0.1.
- -
- SA: Initial temperature: 100; cooling rate: 0.95; reannealing interval: 100.
- -
- BSO: Number of idea clusters: 5; replacement probability: 0.2; probability of selecting one cluster: 0.4.
These parameter choices remained consistent across all experimental evaluations to ensure a fair and consistent comparison.
5.2. Analysis of Model Effectiveness
To verify the effectiveness of the constructed model and the proposed algorithm, this paper selects the C101-100 instance for simulation analysis. This instance features 100 customer points, 20 charging stations, a sufficient number of professional vehicles, and 50 ODs. The coordinate points are shown in Figure 9, where both the horizontal and vertical axes represent geographical coordinates in kilometers.
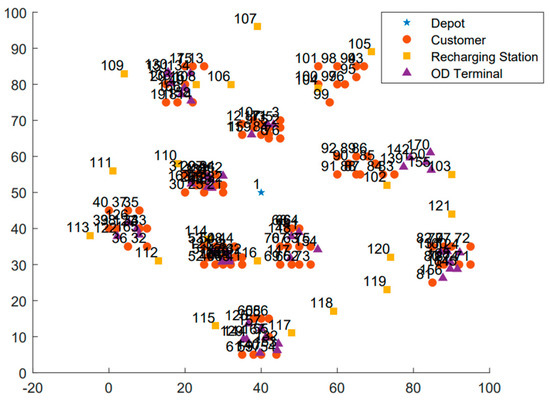
Figure 9.
C101-100 example diagram.
5.2.1. Joint Distribution Mode with the Participation of ODs
The convergence of the proposed IWOA is first verified through experimentation on the C101-100 instance. The proposed IWOA is compared with five established metaheuristics: the Whale Optimization Algorithm (WOA) for its simplicity and bubble-net foraging mechanism; the Genetic Algorithm (GA) for its evolutionary operators of selection, crossover, and mutation; Simulated Annealing (SA) for its metallurgy-inspired probabilistic hill-climbing trajectory; the Brain Storm Optimization (BSO) algorithm for its brainstorming-like clustering and idea-generation process; and the Grey Wolf Optimizer (GWO) for its social hierarchy-inspired swarm hunting intelligence.
Figure 10 shows the evolution trajectories of six algorithms under the best-found solution. As illustrated, the proposed IWOA can converge within 200 iterations. Thanks to its strong local search capability, the algorithm can obtain high-quality solutions in fewer iterations. The results indicate that the proposed algorithm’s convergence speed is faster than that of other benchmark algorithms.
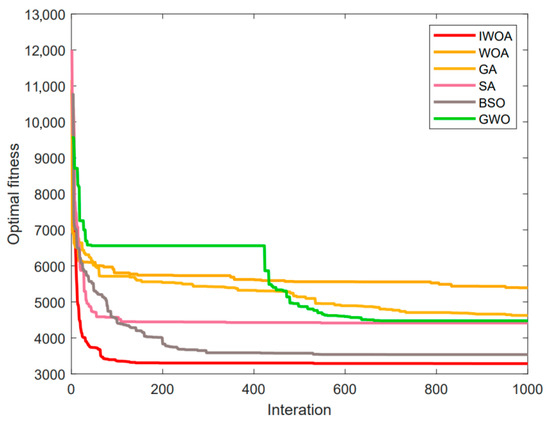
Figure 10.
Evolutionary trajectories of the six algorithms.
Figure 11 illustrates the joint ODs distribution scheme optimized by the IWOA. The total cost of this scheme is CNY 3285.55, and the detailed distribution plan is presented in Table 4. In this scheme, the depot is represented by serial number 0, customers are represented by serial numbers 1–100, charging stations are represented by serial numbers 101–120, and ODs are represented by serial numbers 121–170.
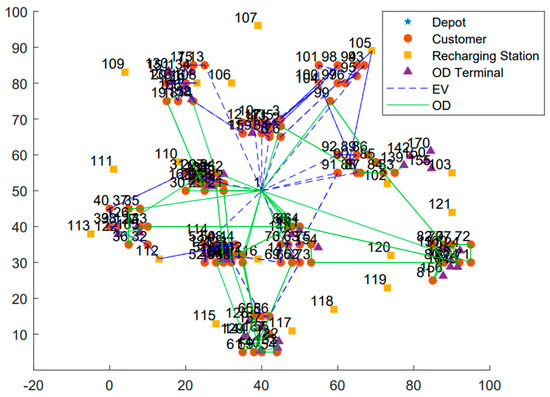
Figure 11.
Diagram of routing results under the joint distribution model.

Table 4.
The joint distribution solution of C101-100 obtained by the IWOA.
As shown in Figure 11, the routing solution utilizes multiple vehicle types with distinct visual representations: all EV routes are shown in blue dashed lines (including EV1: 0-75-96-94-100-103-4-6-7-0; EV2: 0-21-30-39-37-38-31-111-43-49-50-51-52-0; etc., as detailed in Table 4). GDVs are represented by magenta dotted lines, and ODs by solid green lines. The complete routing details for all vehicles are provided in Table 4.
5.2.2. Traditional Professional Vehicle Distribution Model
Figure 12 illustrates the distribution scheme of the professional vehicle fleet optimized by the IWOA, with a total cost of CNY 4171.80. The detailed distribution plan is presented in Table 5.
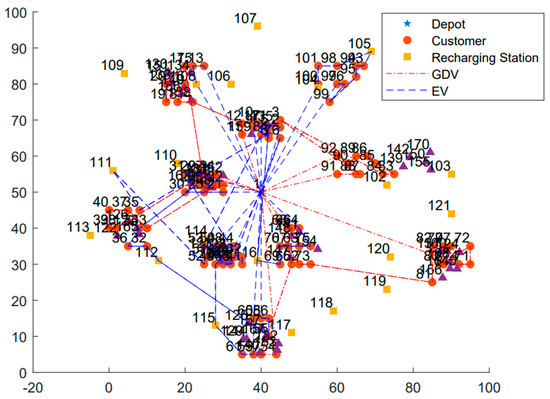
Figure 12.
Routing result diagram in traditional distribution mode.

Table 5.
The traditional distribution solution of C101-100 obtained by the IWOA.
5.2.3. Comparison of the Two Modes
Table 5 compares the combined distribution model with the traditional distribution mode. Compared to the traditional distribution model using professional vehicles, the joint distribution model with OD participation achieves a 21.24% reduction in total cost, which is given by .
The number of professional vehicles used is reduced from 13 to 6, with ODs handling nearly half of the goods volume. As shown in Table 6, the joint distribution model enables the complete replacement of GDVs by ODs, demonstrating its feasibility and advantages. In the selected case, C101-100, which features a centralized customer point distribution with 100 delivery points, the high fuel consumption of GDVs makes it feasible for only EVs and ODs to conduct distribution. The experimental parameters are realistic and the examples are representative.

Table 6.
Comparison results of the two models.
To further substantiate this conclusion and validate the general applicability of the joint distribution model’s advantages, a comparative analysis of computational outcomes across multiple scenarios was conducted. As summarized in Table 7, the joint distribution model, which integrates ODs, achieves a significant reduction in the total cost for all tested instances when compared to the traditional model reliant solely on professional vehicles. The average cost reduction reaches 24.94%. This result robustly indicates that the previously mentioned cost saving of 21.24% is not an isolated case but represents compelling evidence for the consistent effectiveness of the proposed model.

Table 7.
Cost comparison across instances.
The total cost data (CNY) for the traditional model are derived from IWOA optimization runs on the identical instances, under a configuration that uses only the professional fleet (GDVs and EVs) and excludes OD participation.
5.3. Comparison of Algorithm Performance
To evaluate the performance of the IWOA, it is compared with five other heuristic algorithms: GA, SA, BSO, GWO, and WOA. Experimental instances, including C101, C201, R101, R201, and RC101, are solved to compare the results of the six algorithms across different scales. Each experiment is run thirty times, and the results are presented in Table 8, Table 9 and Table 10, including statistical metrics such of the best value, average value, gap, standard deviation, and computation time, .

Table 8.
Results of small-scale arithmetic for 25 customer sites.

Table 9.
Results of medium-scale arithmetic for 100 customer sites.

Table 10.
Results of large-scale arithmetic for 200 customer sites.
As shown in Figure 13, the IWOA yields better best solutions than other benchmark algorithms across all 15 instances. Additionally, the average value obtained by the IWOA is no worse than the best solutions from other algorithms in 14 instances, with the sole exception of the C101-200 instance where the best solution found by the BSO algorithm (4535.90 CNY) is lower than the average value of IWOA (4599.41 CNY). This indicates that the proposed algorithm demonstrates stronger search capabilities when addressing the problem.
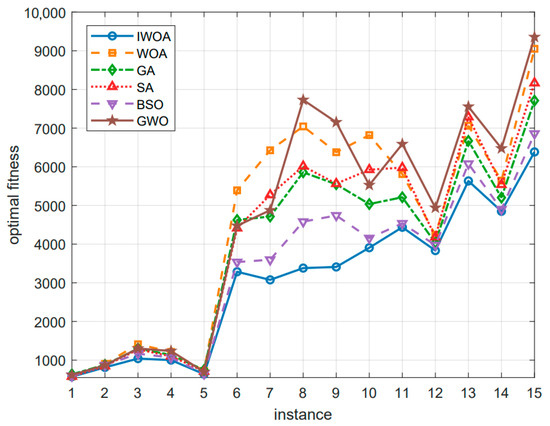
Figure 13.
Variation in best-found solution for each instance.
From the changes in the standard deviation values in Figure 14, it can be seen that the performance of the algorithm proposed in this paper is stable. Although in some cases, the running time of this algorithm may be longer than that of other algorithms, the computation time remains within an acceptable range. Overall, the IWOA proposed in this paper can solve problems within a reasonable computation time.
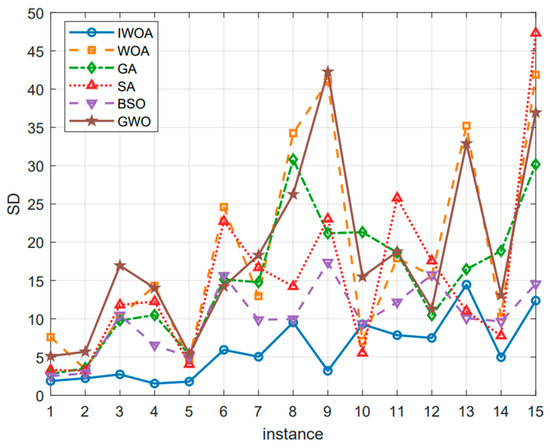
Figure 14.
Variation in standard deviation across instances.
The experimental results (Table 8, Table 9 and Table 10 and Figure 13 and Figure 14) serve as empirical validation of the algorithm’s scalability and efficiency. The computation time (t/s) increases at a manageable, polynomial rate with problem size (from small 25-customer instances to large 200-customer ones), demonstrating its practical applicability to large-scale problems. Furthermore, the consistently lower objective values and standard deviations across all instances indicate that the IWOA not only finds better solutions but does so more reliably than its counterparts.
5.4. Sensitivity Analysis of Crowd-Shipping Key Parameters
To further explore the managerial implications of crowd-shipping participation in cold chain distribution, this study conducts a sensitivity analysis on two key parameters influencing crowd-shipping costs:
Key Parameter One: The flexibility of ODs, represented by detour factor ().
Key Parameter Two: The payment for ODs, represented by the cost per unit distance ().
To evaluate the impact of these parameters, we solved the example R101-25 using all combinations of the following values: = 0.4, 0.5, 0.6, 0.7, and 0.8, = 1, 1.2, and 1.4. The best solution for each combination was obtained using the IWOA with a population size of 100, 200 iterations, and 30 independent runs. The corresponding routing diagrams are presented in Figure 15, Figure 16, Figure 17, Figure 18 and Figure 19.

Figure 15.
Fixed , best-found solution routing diagram with parameter variations.

Figure 16.
Fixed , best-found solution routing diagram with parameter variations.

Figure 17.
Fixed , best-found solution routing diagram with parameter variations.

Figure 18.
Fixed , best-found solution routing diagram with parameter variations.

Figure 19.
Fixed , best-found solution routing diagram with parameter variations.
The resulting costs are summarized in Table 11.

Table 11.
Cost analysis of changes in ODs’ compensation rates and detour factors.
When the ODs’ detour factor is held constant, the total distribution cost generally increases as the unit compensation rate rises—with the exception of the case where . When the crowd-shipping unit compensation rate is fixed, the total cost exhibits fluctuations as changes. Among all the combinations, the value of the combination and is the smallest. These optimal combinations are highlighted in bold in Table 11.
5.5. Discussion of Results
The experimental results presented in Section 5.2, Section 5.3 and Section 5.4 provide substantial insights into the performance of our proposed model and algorithm. Several important observations merit further discussion.
First, the significant cost reduction (averaging 24.94% across all tested instances) achieved by the joint distribution model with ODs’ participation demonstrates the practical value of integrating crowd-shipping resources into cold-chain logistics. This result substantiates that the initial finding of 21.24% cost saving in the C101-100 case is not an outlier but reflects the consistent effectiveness of our approach across diverse customer distribution patterns (clustered, random, and mixed). The cost efficiency primarily stems from two factors: (1) the replacement of high-cost professional vehicles with more economical ODs for certain delivery tasks, and (2) the improved vehicle utilization rates through optimal resource allocation. The complete replacement of GDVs by EVs and ODs in the C101-100 case further confirms the environmental and economic benefits of our approach.
Second, the superior performance of the IWOA across all tested instances, especially in large-scale problems, highlights its effectiveness in handling complex routing constraints. The algorithm’s ability to maintain solution quality while achieving faster convergence can be attributed to the adaptive variable neighborhood search mechanism, which effectively balances exploration and exploitation. The stable performance (low standard deviation) across multiple runs further demonstrates the robustness of our algorithm. It is also noted that on some large-scale instances (e.g., C101-200), the performance gap, while still favorable, shows increased variability. This suggests that the algorithm’s parameters may benefit from further calibration for extremely large problem sizes, presenting an opportunity for future research. While formal statistical significance testing was not conducted as part of this study, the consistent outperformance of the IWOA across diverse instances and scales, coupled with its lower average costs and standard deviations, provide strong empirical evidence of its effectiveness.
Third, sensitivity analysis reveals important managerial implications: the detour factor () and OD compensation cost per unit distance () significantly impact the total cost. The best-found solution combination (, ) suggests that logistics platforms should focus on recruiting ODs with moderate flexibility while maintaining competitive compensation rates to ensure service quality and driver participation.
Furthermore, the successful application of our model to different customer distribution patterns (random, clustered, and mixed) confirms its versatility and practical applicability in various urban logistics scenarios.
These findings collectively contribute to both theoretical and practical aspects of green logistics and crowd-shipping optimization, providing valuable insights for logistics enterprises seeking to implement sustainable and cost-effective distribution strategies.
6. Conclusions
This study addresses the critical challenge of high delivery costs in fresh produce cold chain last-mile logistics by proposing and optimizing a novel joint delivery model. The model embodies the principle of symmetry by creating a balanced, hybrid system that integrates crowd-shipping utilizing ODs with professional mixed fleets (comprising GDVs and EVs), while incorporating essential real-world operational constraints: cold chain requirements, EV partial charging strategies, and time-of-use electricity pricing.
Our key contributions and findings are as follows:
(1) Cost-Effective Joint Delivery Model: We propose and validate a framework where ODs collaborate with professional mixed fleets. Case studies demonstrate that this joint model significantly reduces total delivery costs by an average of 24.94% compared to traditional professional fleet-only delivery, primarily by optimizing vehicle utilization and leveraging flexible ODs.
(2) Comprehensive EV Operational Modeling: The model precisely incorporates the operational realities of mixed fleets, specifically EV range limitations managed through partial charging strategies and the impact of time-of-use electricity pricing on charging costs and route planning, leading to more realistic and applicable solutions.
(3) Effective Metaheuristic Solution: To solve the complex resulting vehicle routing problem, we developed the Improved Whale Optimization Algorithm (IWOA). The IWOA integrates adaptive variable neighborhood search and specialized local search operators. Experimental comparisons with other heuristic algorithms confirm its superior stability, efficiency, and effectiveness in optimizing routes for this challenging scenario.
(4) Practical Parameter Insights: Sensitivity analysis of key crowd-shipping parameters provides valuable guidance for logistics enterprises, identifying best-found solution compensation and operational settings within reasonable ranges to maximize cost savings and operational feasibility.
In summary, this research advances the application of crowd-shipping within cold chain logistics by applying concepts of systemic symmetry to successfully integrate ODs with mixed GDV/EV fleets under practical constraints. The achieved balance between cost and service goals, facilitated by the symmetrical collaboration of heterogeneous resources, offers a viable and cost-effective solution for enterprises.
This study has several limitations. Our model assumes deterministic conditions and does not incorporate real-world uncertainties such as limited charging station capacity, stochastic OD availability, traffic congestion, or variable perishability rates. Future research could enhance practicality by integrating these stochastic elements, using robust or stochastic optimization approaches. Exploring methods like Fuzzy Dynamic Bayesian Networks for scenario deduction could be a promising alternative [55]. Additionally, a comprehensive sensitivity analysis of the IWOA’s parameters (e.g., neighborhood counts, destruction/repair rates) using design of experiments or automated tuning techniques would be a valuable direction to further validate and refine the algorithm’s performance.
Author Contributions
Conceptualization, F.L. and H.B.; methodology, F.L. and Y.X.; software, F.L. and Z.G.; validation, Y.X., Z.G. and S.M.; formal analysis, F.L.; investigation, Y.X. and Z.G.; resources, H.B.; data curation, F.L. and Y.X.; writing—original draft preparation, F.L.; writing—review and editing, H.B. and S.M.; visualization, Z.G.; supervision, H.B.; project administration, H.B.; funding acquisition, H.B. All authors have read and agreed to the published version of the manuscript.
Funding
This research was funded by the National Key R&D Program of China, grant number 2020YFB1712802; Research Program of Social Science of Qinhuangdao, grant number 2024LX026; and Science and Technology Research and Development Plan Project of Qinhuangdao, grant number 202401A143.
Data Availability Statement
The datasets analyzed during the current study are available from the corresponding author on reasonable request.
Conflicts of Interest
The authors declare no conflicts of interest.
References
- Dekker, R.; Bloemhof, J.; Mallidis, I. Operations Research for green logistics–An overview of aspects, issues, contributions and challenges. Eur. J. Oper. Res. 2012, 219, 671–679. [Google Scholar] [CrossRef]
- Zhang, L.Y.; Tseng, M.L.; Wang, C.H.; Xiao, C.; Fei, T. Low-carbon cold chain distribution using ribonucleic acid-ant colony optimization algorithm. J. Clean. Prod. 2019, 233, 169–180. [Google Scholar] [CrossRef]
- Keyes, D. The Online Grocery Report: Coronavirus is Accelerating US Online Grocery Shopping Adoption—Here are the Market Stats, Trends and Companies to Know; Business Insider: New York, NY, USA, 2021. [Google Scholar]
- Dai, J.; Che, W.; Lim, J.J.; Shou, Y. Service innovation of cold chain distribution service providers: A multiple-case study in China. Ind. Mark. Manag. 2020, 89, 143–156. [Google Scholar] [CrossRef]
- iiMedia.cn. 2023–2024 China Fresh E-commerce Operation Big Data and Development Prospect Research Report. Available online: https://www.iimedia.cn/c400/92930.html (accessed on 21 August 2025).
- Xie, D.; Qiu, Y.; Huang, J. Multi-objective optimization for green logistics planning and operations management: From economic to environmental perspective. Comput. Ind. Eng. 2024, 189, 109988. [Google Scholar] [CrossRef]
- Bi, H.; Gu, Y.; Lu, F.; Mahreen, S. Site selection of electric vehicle charging station expansion based on GIS-FAHP-MABAC. J. Clean. Prod. 2025, 507, 145557. [Google Scholar] [CrossRef]
- Alnaggar, A.; Gzara, F.; Bookbinder, J.H. Crowdsourced delivery: A review of platforms and academic literature. Omega 2021, 98, 102139. [Google Scholar] [CrossRef]
- Hsu, C.I.; Hung, H.C.; Li, H. Vehicle routing problem with time-windows for perishable food delivery. J. Food Eng. 2007, 80, 465–475. [Google Scholar] [CrossRef]
- Leng, L.; Zhang, C.; Zhao, Y.; Wang, W.; Zhang, J.; Li, G. Biobjective low-carbon location-routing problem for cold chain logistics: Formulation and heuristic approaches. J. Clean. Prod. 2020, 273, 122801. [Google Scholar] [CrossRef]
- Wei, C.; Gao, W.; Hu, Z.; Yin, Y.-Q.; Pan, S.-D. Assigning customer-dependent travel time limits to routes in a cold-chain inventory routing problem. Comput. Ind. Eng. 2019, 133, 275–291. [Google Scholar] [CrossRef]
- Liu, A.; Zhu, Q.; Xu, L.; Lu, Q.; Fan, Y. Sustainable supply chain management for perishable products in emerging markets: An integrated location-inventory routing model. Transp. Res. Part E Logist. Transp. Rev. 2021, 150, 102319. [Google Scholar] [CrossRef]
- Mousavi, R.; Bashiri, M.; Nikzad, E. Stochastic production routing problem for perishable products: Modeling and a solution algorithm. Comput. Oper. Res. 2022, 142, 105725. [Google Scholar] [CrossRef]
- CIHsu, W.T. Chen. Optimizing fleet size and delivery scheduling for multi-temperature food distribution. Appl. Math. Model. 2014, 38, 1077–1091. [Google Scholar]
- Chen, J.X.; Liao, W.Z.; Yu, C.W. Route optimization for cold chain logistics of front warehouses based on traffic congestion and carbon emission. Comput. Ind. Eng. 2021, 161, 16. [Google Scholar] [CrossRef]
- Zulvia, F.E.; Kuo, R.J.; Nugroho, D.Y. A many-objective gradient evolution algorithm for solving a green vehicle routing problem with time windows and time dependency for perishable products. J. Clean. Prod. 2020, 242, 118428. [Google Scholar] [CrossRef]
- Chen, J.; Dan, B.; Shi, J. A variable neighborhood search approach for the multi-compartment vehicle routing problem with time windows considering carbon emission. J. Clean. Prod. 2020, 277, 123932. [Google Scholar] [CrossRef]
- Song, M.; Li, J.; Han, Y.; Han, Y.; Liu, L.; Sun, Q. Metaheuristics for solving the vehicle routing problem with the time windows and energy consumption in cold chain logistics. Appl. Soft Comput. 2020, 95, 106561. [Google Scholar] [CrossRef]
- Wang, Y.; Zhang, J.; Guan, X.; Xu, M.; Wang, Z.; Wang, H. Collaborative multiple centers fresh logistics distribution network optimization with resource sharing and temperature control constraints. Expert Syst. Appl. 2021, 165, 113838. [Google Scholar] [CrossRef]
- Song, L.Y.; Zhao, S.; Bian, Q.; Du, P.; Shen, P.J. Fresh food distribution route optimization of mixed fleets in urban and rural areas under low carbon perspective. J. Transp. Syst. Eng. Inf. Technol. 2023, 23, 250–261. [Google Scholar]
- Archetti, C.; Savelsbergh, M.; Speranza, M.G. The vehicle routing problem with occasional drivers. Eur. J. Oper. Res. 2016, 254, 472–480. [Google Scholar] [CrossRef]
- Macrina, G.; Di Puglia Pugliese, L.; Guerriero, F.; Laganà, D. The vehicle routing problem with occasional drivers and time windows. In Optimization and Decision Science: Methodologies and Applications: ODS, Sorrento, Italy, 4–7 September 2017; Springer International Publishing: Cham, Switzerland, 2017; Volume 47, pp. 577–587. [Google Scholar]
- Dahle, L.; Andersson, H.; Marielle Christiansen, M.; Speranza, G. The pickup and delivery problem with time windows and occasional drivers. Comput. Oper. Res. 2019, 109, 122–133. [Google Scholar] [CrossRef]
- Macrina, G.; Guerriero, F. The green vehicle routing problem with occasional drivers. In New Trends in Emerging Complex Real Life Problems: ODS, Taormina, Italy, 10–13 September 2018; Springer: Berlin/Heidelberg, Germany, 2018; Volume 2018, pp. 357–366. [Google Scholar]
- Niu, Y.; Yang, Z.; Chen, P.; Xiao, J. Optimizing the green open vehicle routing problem with time windows by minimizing comprehensive routing cost. J. Clean. Prod. 2018, 171, 962–971. [Google Scholar] [CrossRef]
- Cao, L.; Ye, C.; Cheng, R.; Wang, Z.-K. Memory-based variable neighborhood search for green vehicle routing problem with passing-by drivers: A comprehensive perspective. Complex Intell. Syst. 2022, 8, 2507–2525. [Google Scholar] [CrossRef]
- Le, T.V.; Ukkusuri, S.V.; Xue, J.; Van Woensel, T. Designing pricing and compensation schemes by integrating matching and routing models for crowd-shipping systems. Transp. Res. Part E Logist. Transp. Rev. 2021, 149, 102209. [Google Scholar] [CrossRef]
- Perboli, G.; Rosano, M.; Wei, Q. A simulation-optimization approach for the management of the on-demand parcel delivery in sharing economy. IEEE Trans. Intell. Transp. Syst. 2021, 23, 10570–10582. [Google Scholar] [CrossRef]
- Macrina, G.; Pugliese, L.D.P.; Guerriero, F. Crowd-shipping: A new efficient and eco-friendly delivery strategy. Procedia Manuf. 2020, 42, 483–487. [Google Scholar] [CrossRef]
- Qi, C.; Zhu, L. Low Carbon Path Optimization of Two-Level Hybrid Cold Chain for Group Purchase Consi-dering Satisfaction. Comput. Eng. Appl. 2024, 60, 337–347. [Google Scholar]
- Subramanian, A.; Penna, P.H.V.; Uchoa, E.; Ochi, L.S. A hybrid algorithm for the heterogeneous fleet vehicle routing problem. Eur. J. Oper. Res. 2012, 221, 285–295. [Google Scholar] [CrossRef]
- Koç, Ç.; Bektaş, T.; Jabali, O.; Laporte, G. The fleet size and mix pollution-routing problem. Transp. Res. Part B Methodol. 2014, 70, 239–254. [Google Scholar] [CrossRef]
- Goeke, D.; Schneider, M. Routing a mixed fleet of electric and conventional vehicles. Eur. J. Oper. Res. 2015, 245, 81–99. [Google Scholar] [CrossRef]
- Hiermann, G.; Puchinger, J.; Ropke, S.; Hartl, R.F. The electric fleet size and mix vehicle routing problem with time windows and recharging stations. Eur. J. Oper. Res. 2016, 252, 995–1018. [Google Scholar] [CrossRef]
- Macrina, G.; Di Puglia Pugliese, L.; Guerriero, F.; Laporte, G. The green mixed fleet vehicle routing problem with partial battery recharging and time windows. Comput. Oper. Res. 2019, 101, 183–199. [Google Scholar] [CrossRef]
- Ren, X.; Huang, H.; Feng, S.; Liang, G. An improved variable neighborhood search for bi-objective mixed-energy fleet vehicle routing problem. J. Clean. Prod. 2020, 275, 124155. [Google Scholar] [CrossRef]
- Chen, Z.; Chen, Q.; Xue, C.; Chao, Y. PHEV Routing with Hybrid Energy and Partial Charging: Solved via Dantzig–Wolfe Decomposition. Mathematics 2025, 13, 2239. [Google Scholar] [CrossRef]
- Li, D.; Chen, Y.; Zhang, Z. A branch-and-price algorithm for electric vehicle routing problem with time windows and mixed fleet. Syst. Eng.-Theory Pr. 2021, 41, 995–1009. [Google Scholar]
- Bac, U.; Erdem, M. Optimization of electric vehicle recharge schedule and routing problem with time windows and partial recharge: A comparative study for an urban logistics fleet. Sustain. Cities Soc. 2021, 70, 102883. [Google Scholar] [CrossRef]
- Jiang, Y.S.; Wu, J.Y.; Hu, L. Hybrid Fleet Size Optimization Considering Vehicle Relocation and Staff Allocation. J. Transp. Syst. Eng. Inf. Technol. 2021, 21, 145–152. [Google Scholar]
- Nguyen, T.H.; Bui, D.Q.; Dao, P.N. An efficient Min/Max Robust Model Predictive Control for nonlinear discrete-time systems with dynamic disturbance. Chaos Solitons Fractals 2024, 180, 114551. [Google Scholar] [CrossRef]
- Zhang, A.; Li, T.; Zheng, Y.; Li, X.; Abdullah, M.G.; Dong, C. Mixed electric bus fleet scheduling problem with partial mixed-route and partial recharging. Int. J. Sustain. Transp. 2022, 16, 73–83. [Google Scholar] [CrossRef]
- Jiangsu Development & Reform Commission. Notice on Further Clarifying the Relevant Policies Regarding Electricity Prices for Electric Vehicle Charging and Switching Facilities in Jiangsu Province. Notice on Further Clarification of Electricity Pricing for EV Charging and Swapping Facilities in Jiangsu Province. Available online: https://fzggw.jiangsu.gov.cn/art/2023/9/28/art_84097_11085479.html (accessed on 21 August 2025).
- Wang, S.; Tao, F.; Shi, Y.; Wen, H. Optimization of vehicle routing problem with time windows for cold chain distribution based on carbon tax. Sustainability 2017, 9, 694. [Google Scholar] [CrossRef]
- Mirjalili, S.; Lewis, A. The whale optimization algorithm. Adv. Eng. Softw. 2016, 95, 51–67. [Google Scholar] [CrossRef]
- Lu, F.; Du, Z.; Wang, Z.; Wang, L.; Wang, S. Towards enhancing the crowdsourcing door-to-door delivery: An effective model in Beijing. J. Ind. Manag. Optim. 2025, 21, 2371–2395. [Google Scholar] [CrossRef]
- Lu, F.; Yan, T.; Bi, H.; Feng, M.; Wang, S.; Huang, M. A bilevel whale optimization algorithm for risk management scheduling of information technology projects considering outsourcing. Knowl.-Based Syst. 2022, 235, 107600. [Google Scholar] [CrossRef]
- Ling, Y.; Zhou, Y.; Luo, Q. Lévy flight trajectory-based whale optimization algorithm for global optimization. IEEE Access 2017, 5, 6168–6186. [Google Scholar] [CrossRef]
- Mladenović, N.; Hansen, P. Variable neighborhood search. Comput. Oper. Res. 1997, 24, 1097–1100. [Google Scholar] [CrossRef]
- Ropke, S.; Pisinger, D. An adaptive large neighborhood search heuristic for the pickup and delivery problem with time windows. Transp. Sci. 2006, 40, 455–472. [Google Scholar] [CrossRef]
- Schneider, M.; Stenger, A.; Goeke, D. The electric vehicle-routing problem with time windows and recharging stations. Transp. Sci. 2014, 48, 500–520. [Google Scholar] [CrossRef]
- Solomon, M.M. Algorithms for the vehicle routing and scheduling problems with time window constraints. Oper. Res. 1987, 35, 254–265. [Google Scholar] [CrossRef]
- Shi, J.; Mao, H.; Zhou, Z.; Zheng, L. Adaptive large neighborhood search algorithm for the Unmanned aerial vehicle routing problem with recharging. Appl. Soft Comput. 2023, 147, 110831. [Google Scholar] [CrossRef]
- Martin-Santamaria, R.; López-Sánchez, A.D.; Delgado-Jalon, M.L.; Colmenar, J.M. An efficient algorithm for crowd logistics optimization. Mathematics 2021, 9, 509. [Google Scholar] [CrossRef]
- Lu, F.; Meng, F.; Bi, H. Scenario deduction of explosion accident based on fuzzy dynamic Bayesian network. J. Loss Prev. Process Ind. 2025, 96, 105613. [Google Scholar] [CrossRef]
Disclaimer/Publisher’s Note: The statements, opinions and data contained in all publications are solely those of the individual author(s) and contributor(s) and not of MDPI and/or the editor(s). MDPI and/or the editor(s) disclaim responsibility for any injury to people or property resulting from any ideas, methods, instructions or products referred to in the content. |
© 2025 by the authors. Licensee MDPI, Basel, Switzerland. This article is an open access article distributed under the terms and conditions of the Creative Commons Attribution (CC BY) license (https://creativecommons.org/licenses/by/4.0/).