4.2. The EfficientNetV2-S and 5KCV Model Assessment
In our research, we performed a test on the Kaggle platform. The setup featured an Intel i7 12th Generation i7-1270P processor running at a speed of 2.20 GHz and was supported by 16 GB of RAM. We implemented Python version 3 alongside the TensorFlow library, a popular DL framework created by Google. TensorFlow is widely used for constructing and implementing DL and ML models, especially in DL and AI. Furthermore,
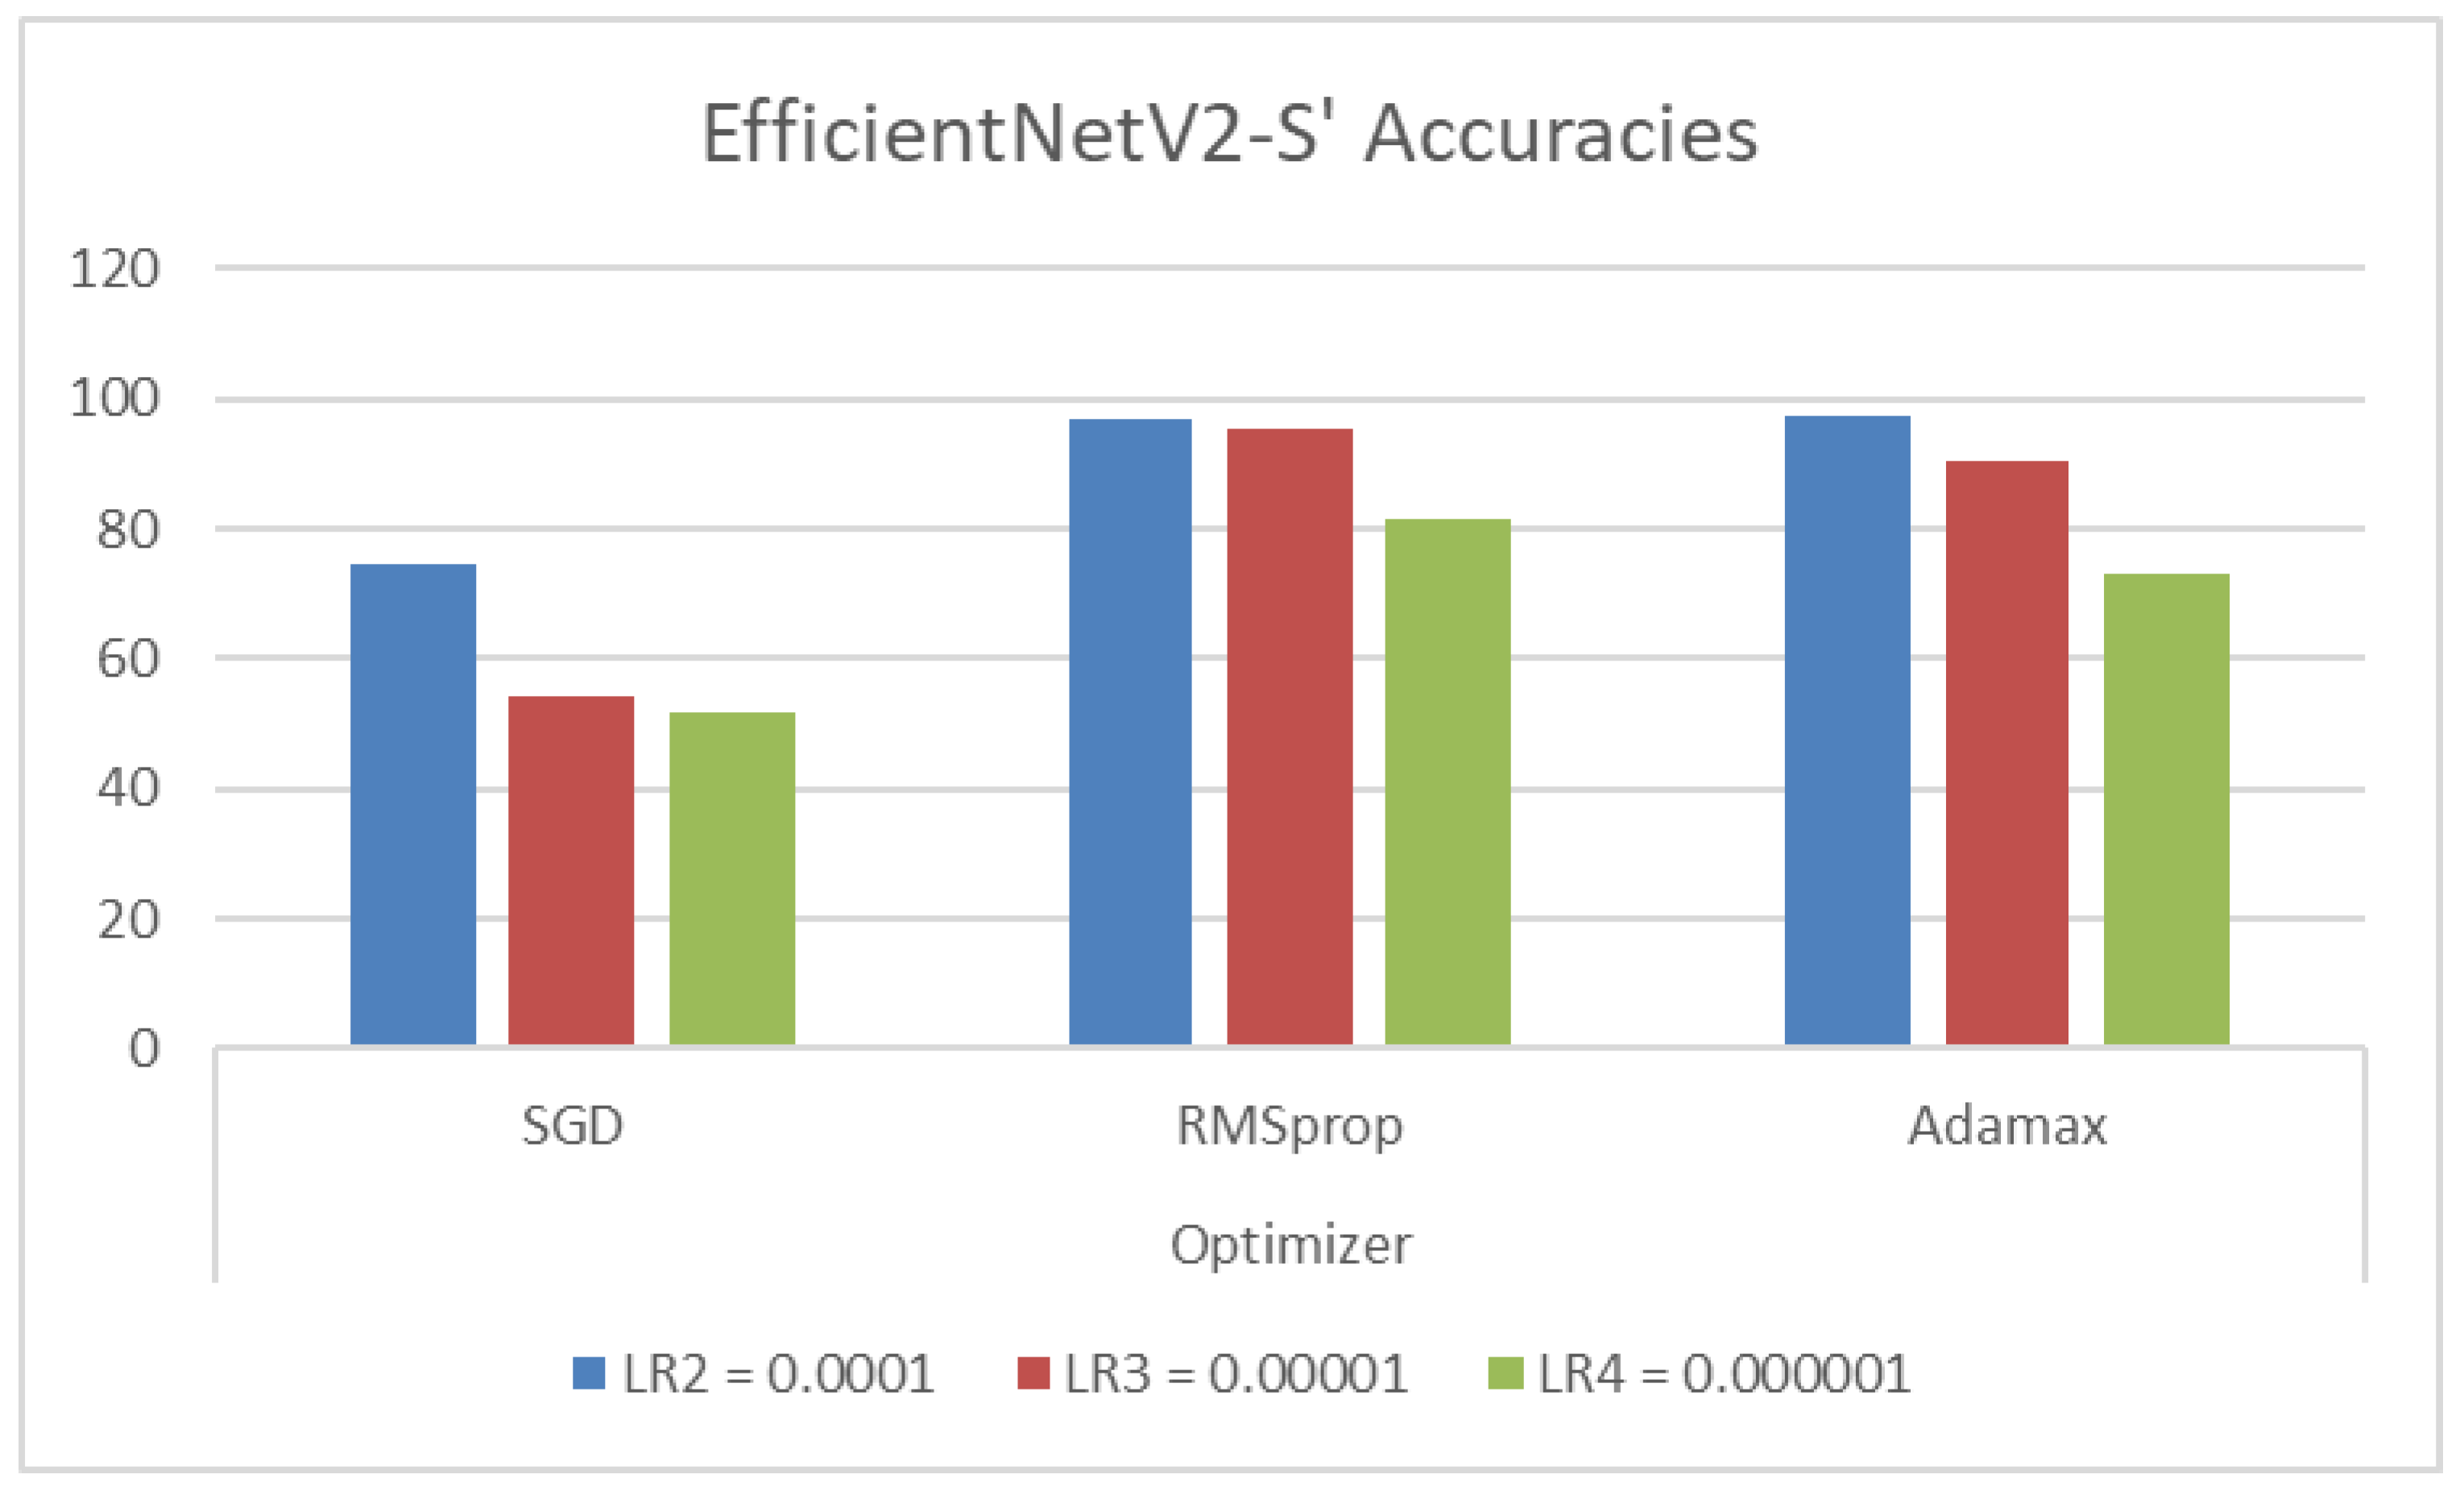
Table 6 contains the hyperparameters utilized in our study and their respective values. The EfficientNetV2-S models utilized the Adamax optimizer during training with samples from the C-NMC_Leukemia dataset. During the training phase, modifications were applied to the initial weights of the models to enhance their effectiveness on this dataset. The training employed a constant learning rate set at 0.0001. While the training was limited to 30 epochs, an early stopping feature was integrated to observe the validation loss and terminate the training process as needed.
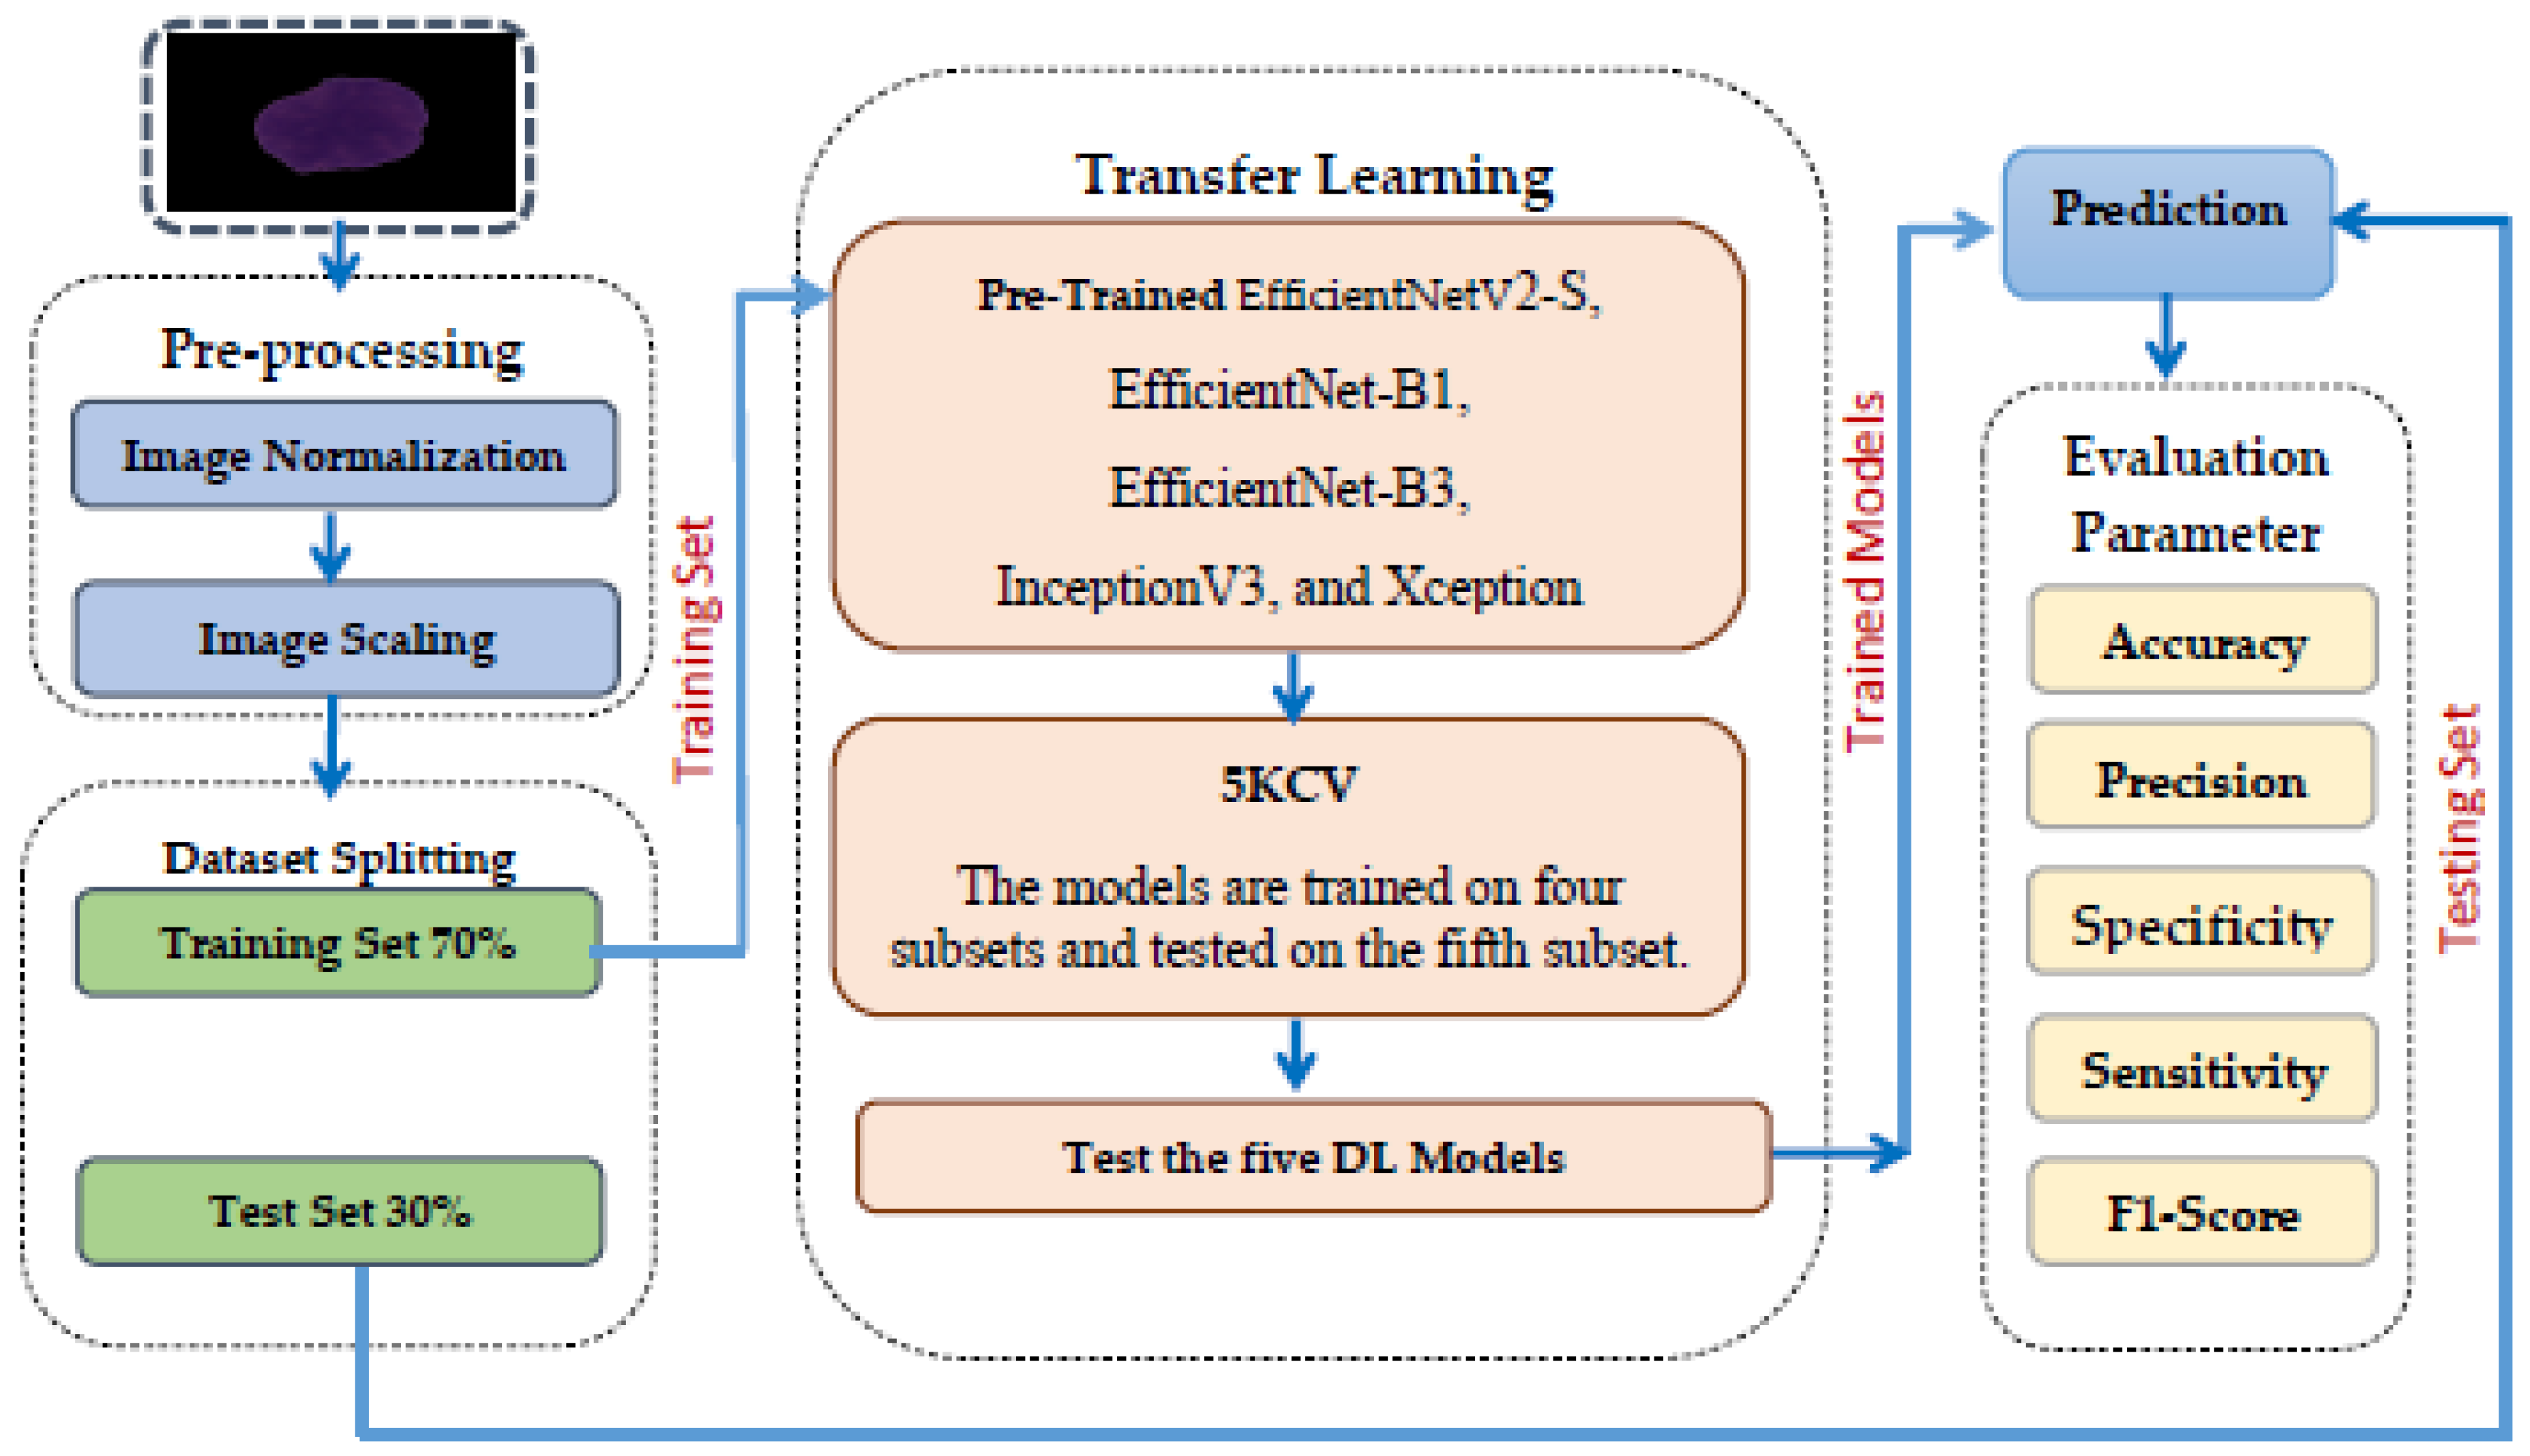
We divided the C-NMC_Leukemia dataset into two groups: a training set comprising 70% of all images (7264 images) and a testing set with the remaining 30% (3397 images). Finally, we evaluated the proposed model based on the criteria detailed in Equations (22)–(28).
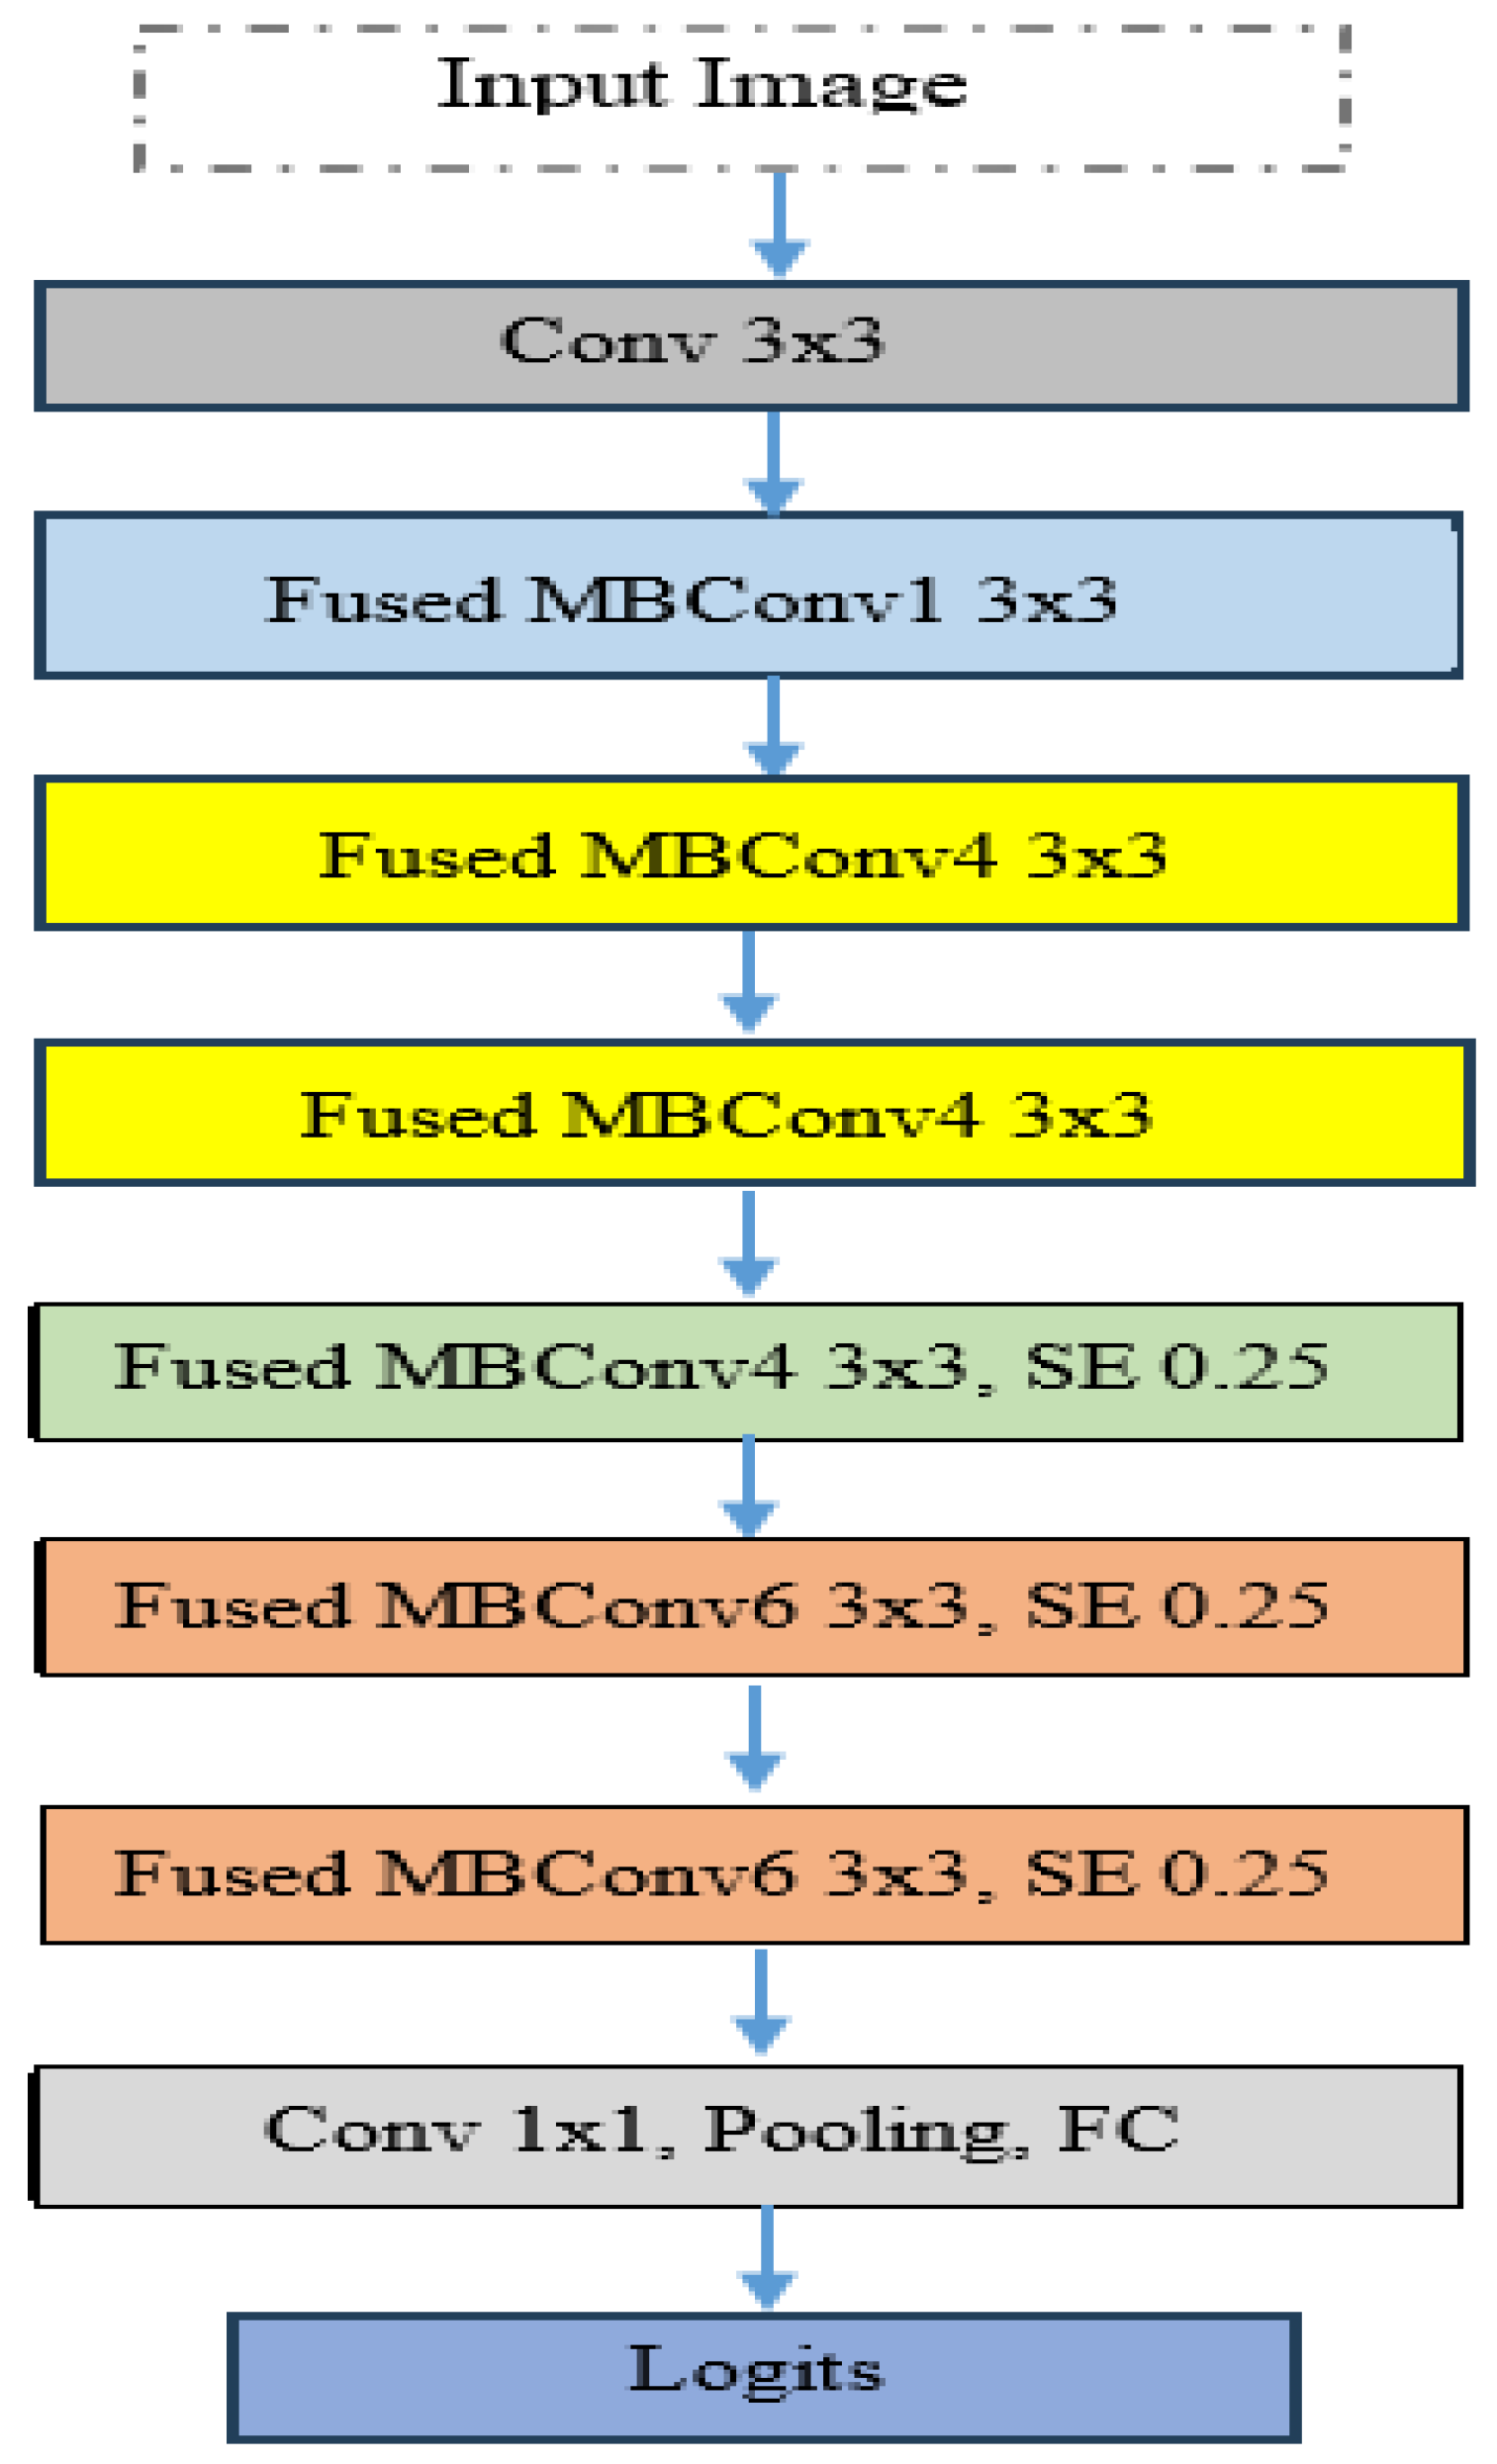
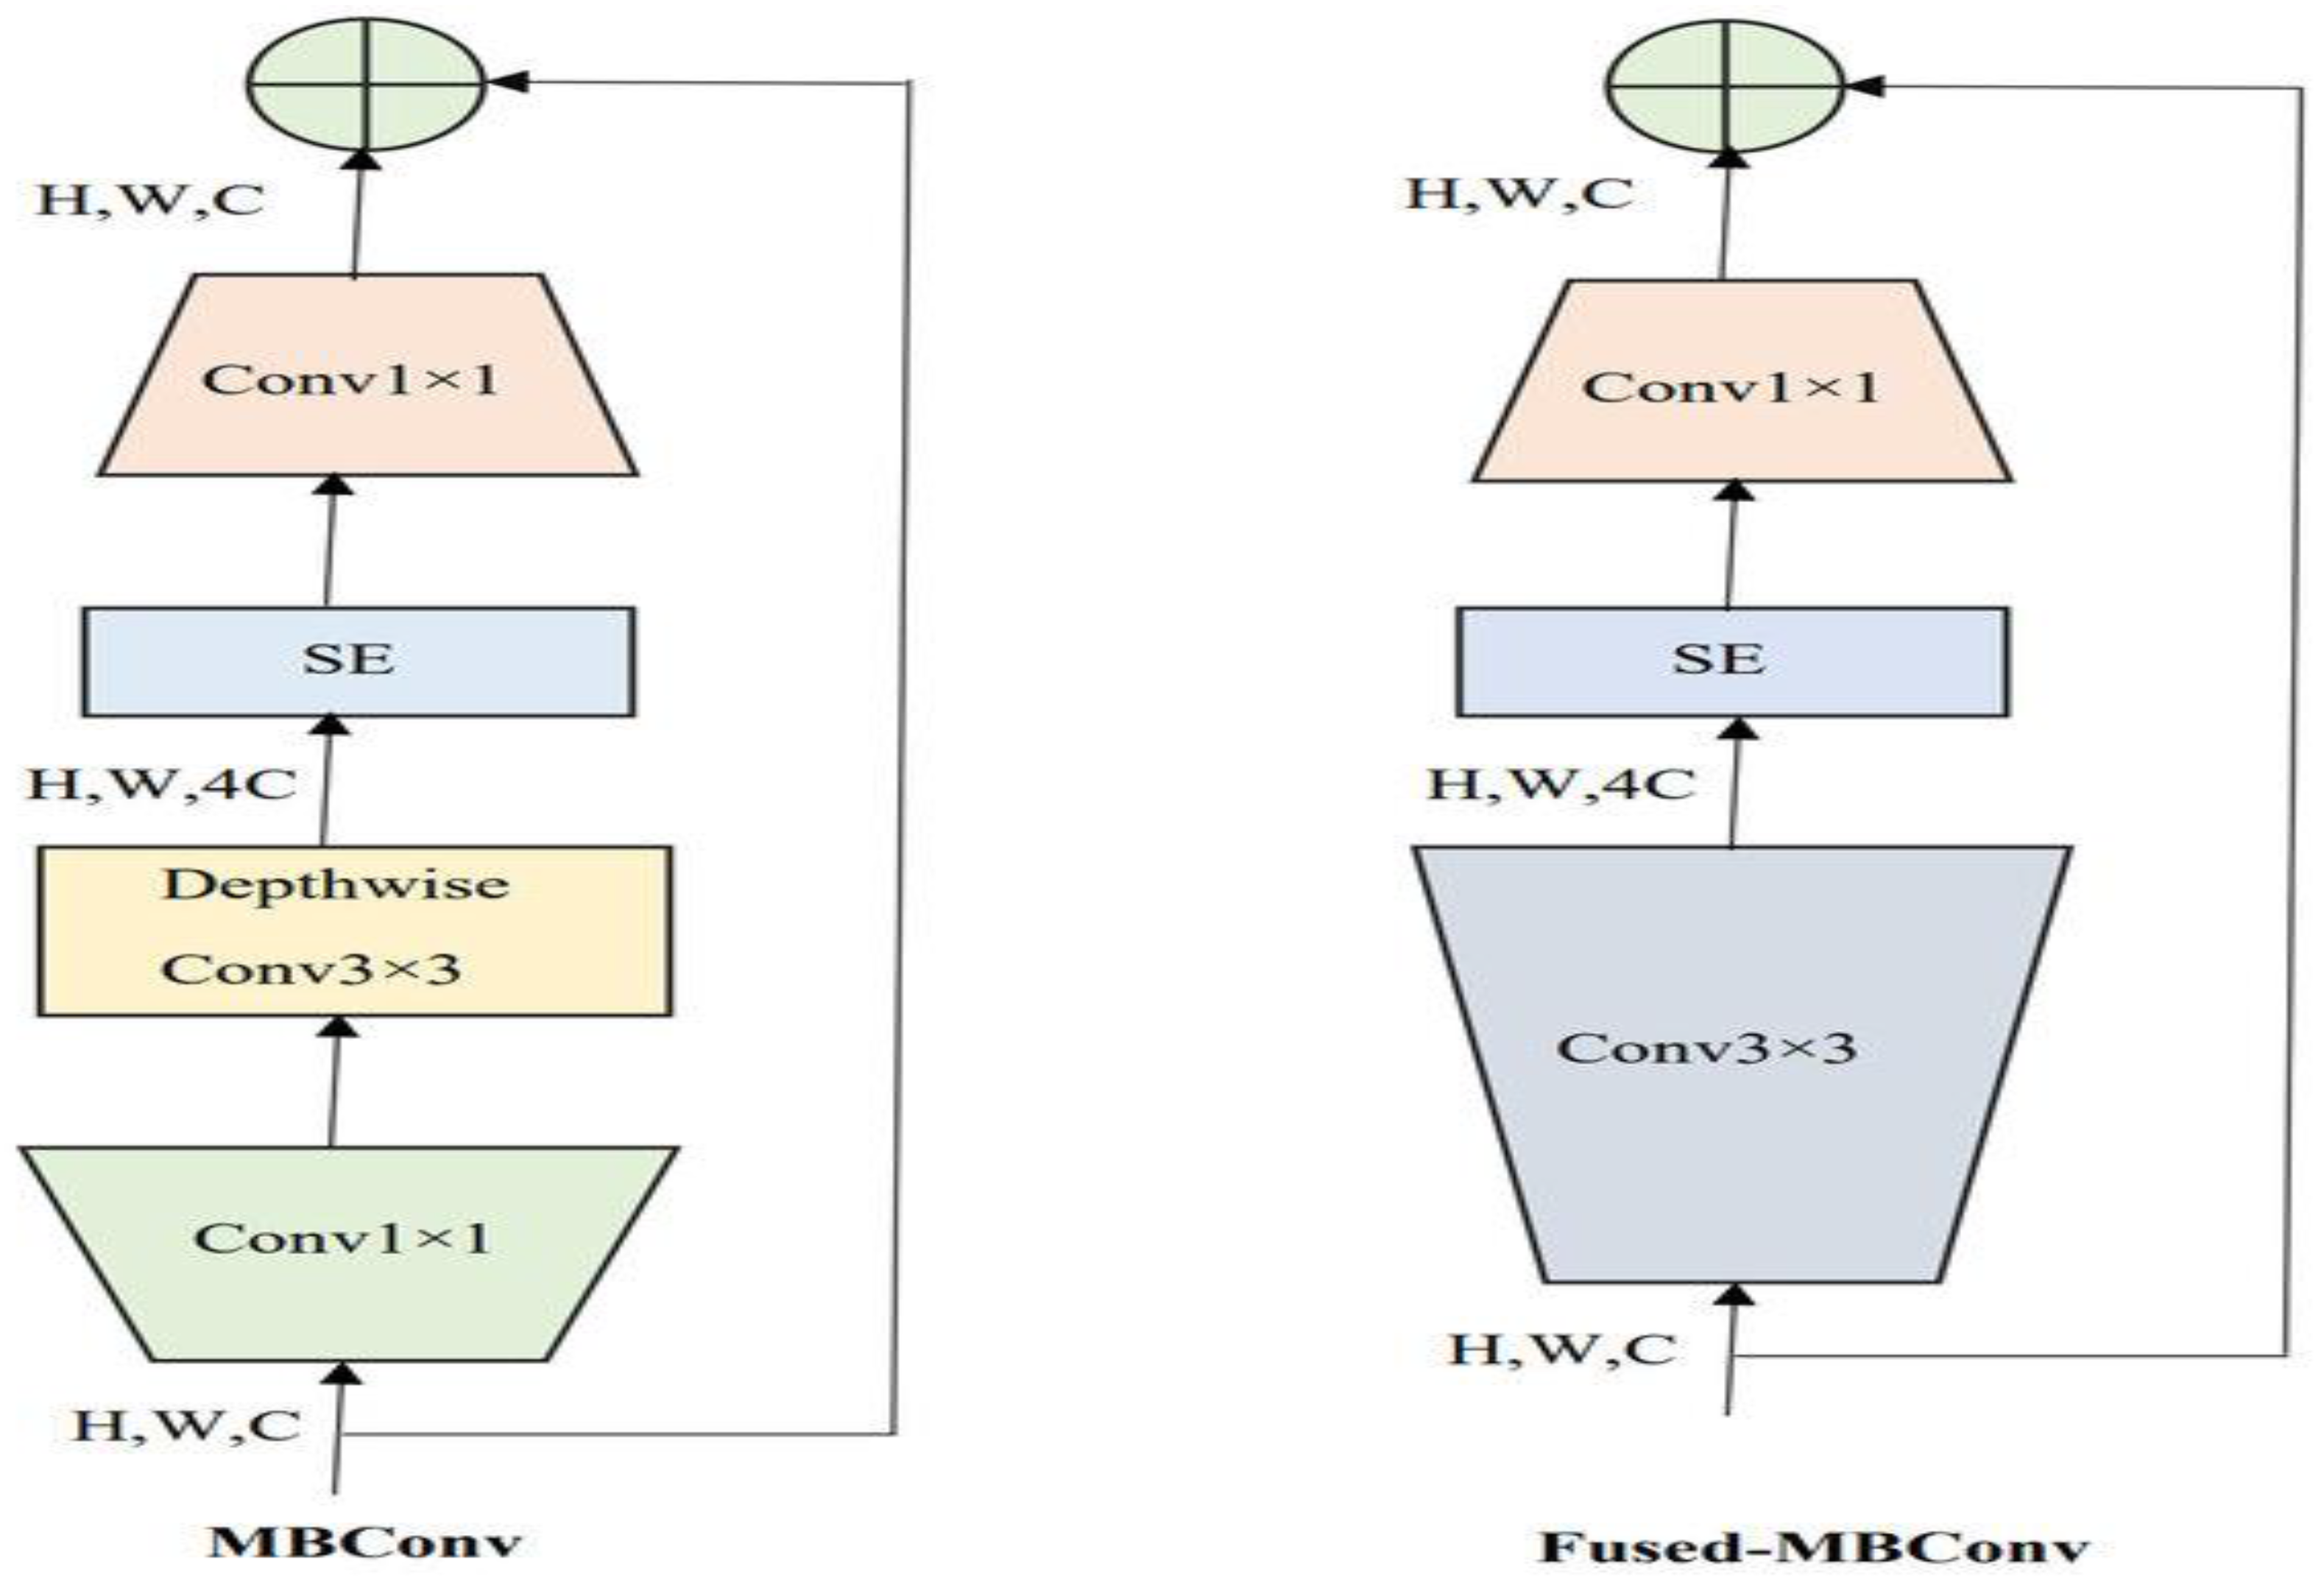
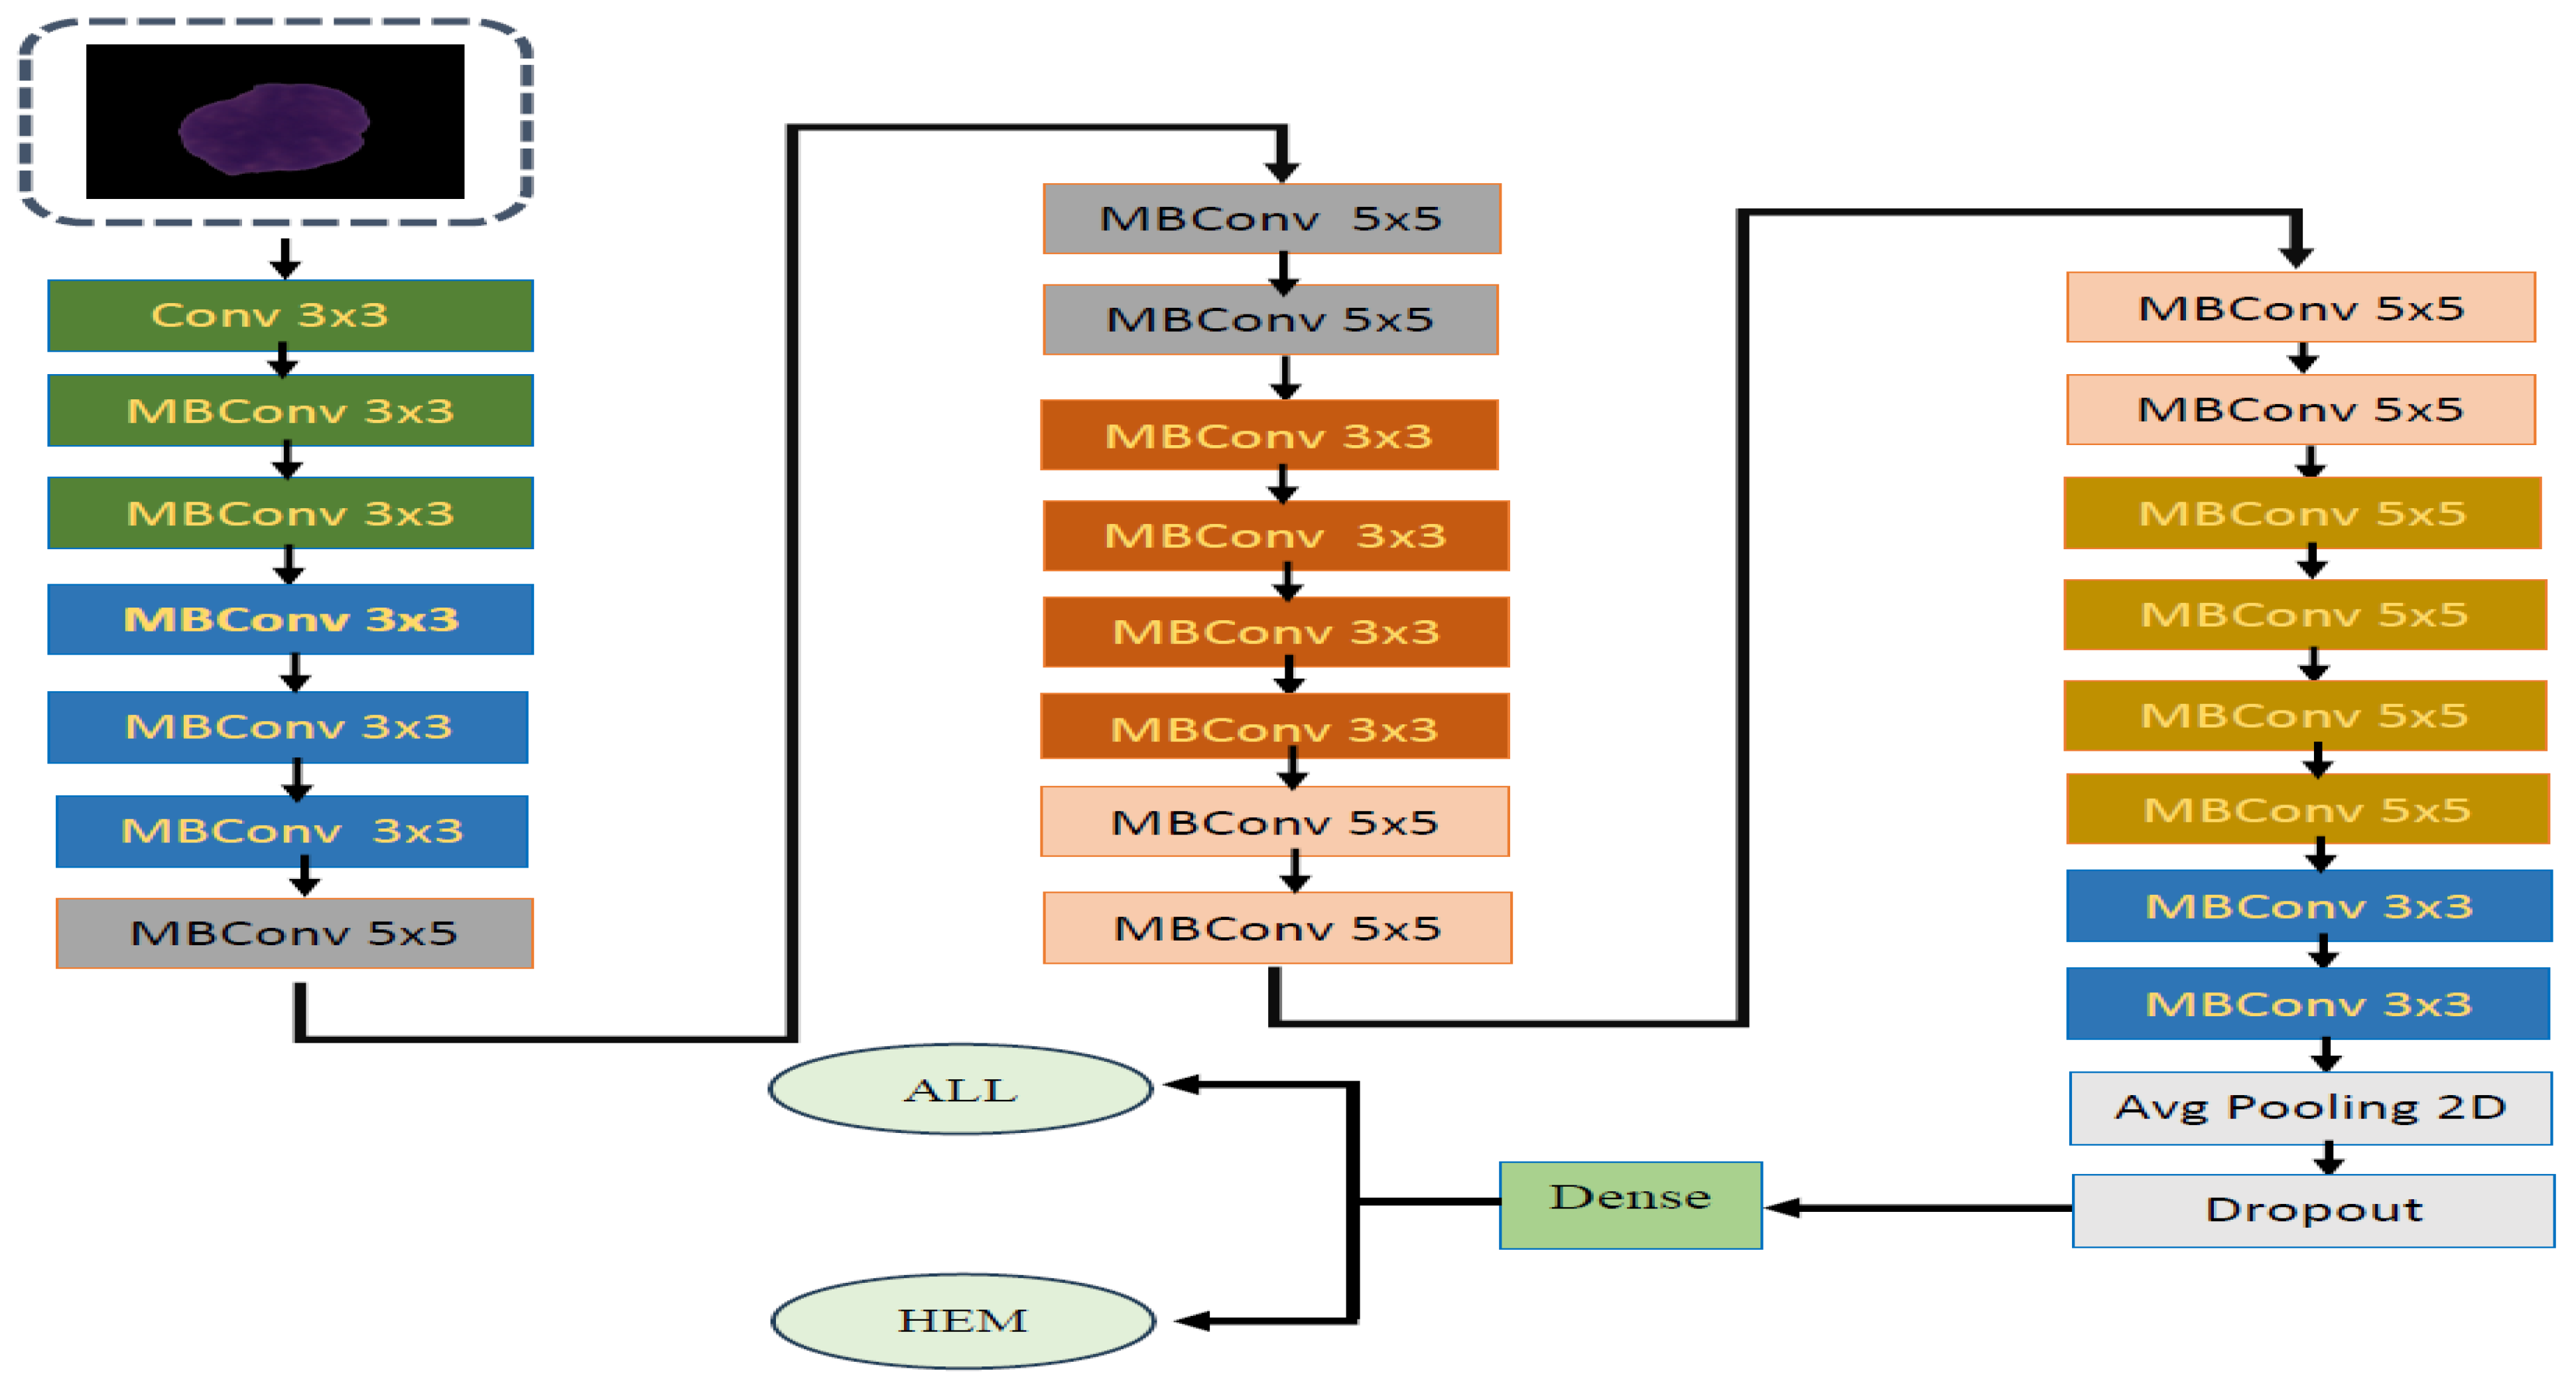
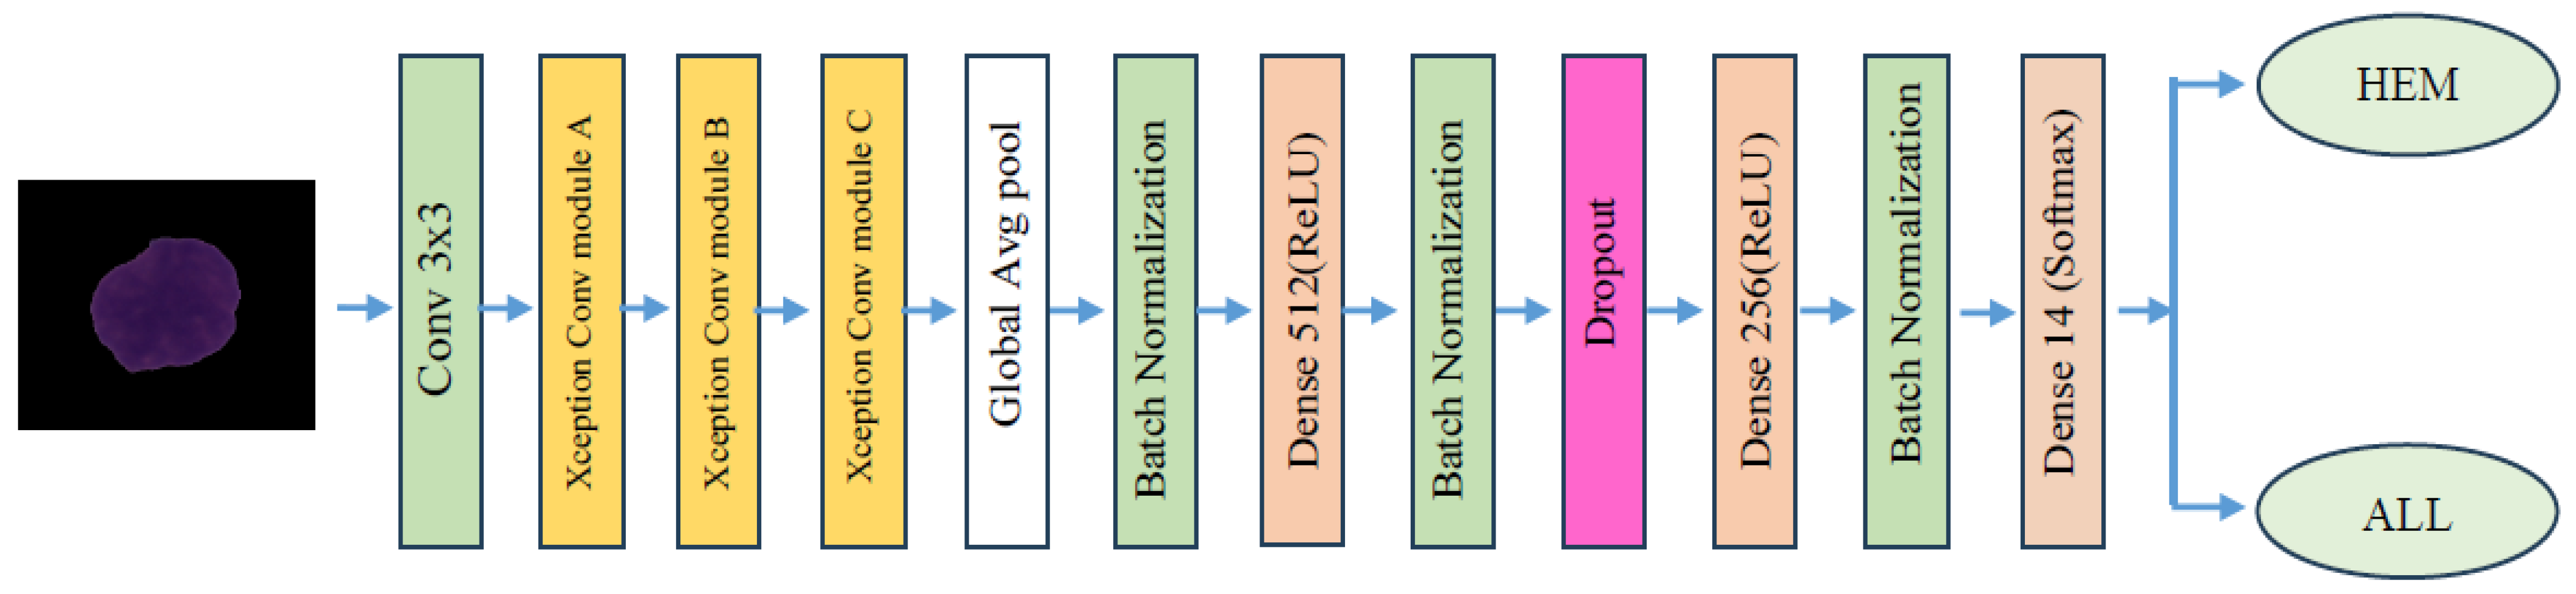
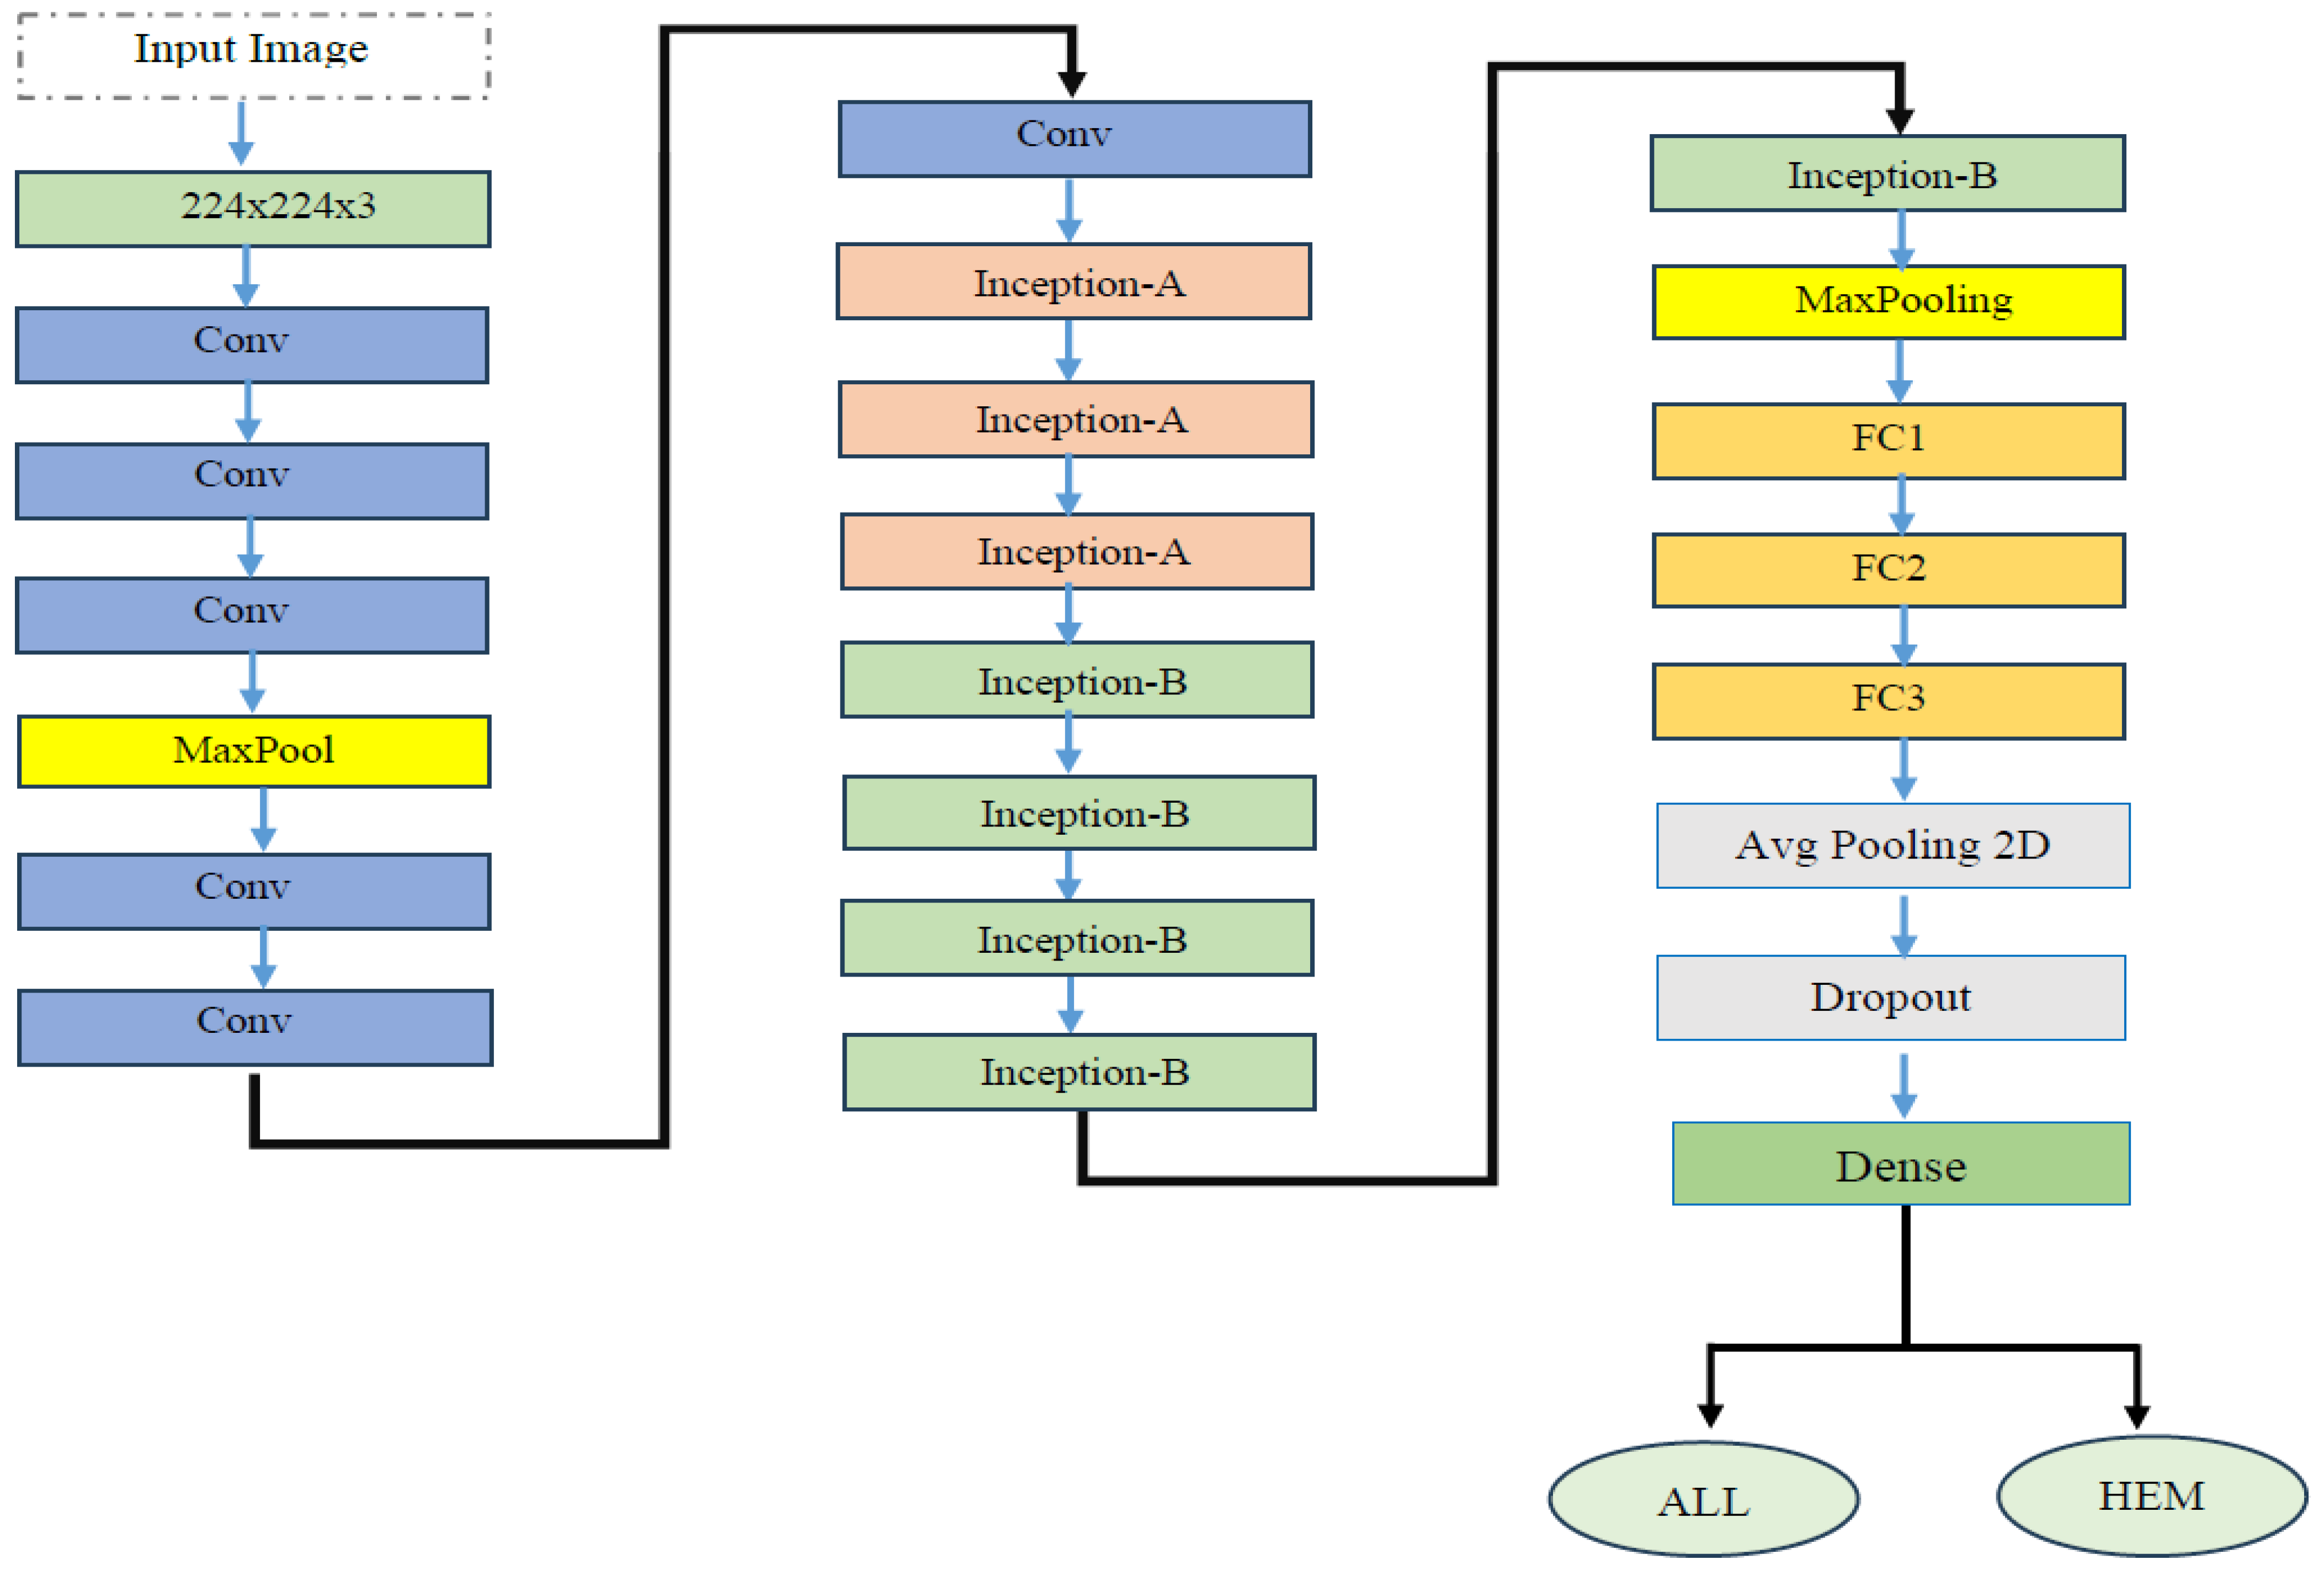
In the experiment, we identified ALL using the C-NMC_Leukemia dataset. Our approach involved developing a binary classification model utilizing the EfficientNetV2-S architecture to automate ALL detection. To improve the model’s efficiency, we integrated the 5KCV technique. Furthermore, we compared the performance of the EfficientNetV2-S model with four other DL models: EfficientNet-B1, EfficientNet-B3, InceptionV3, and Xception.
The main objective of this experiment was to identify ALL, aiming to enhance patient outcomes, streamline the diagnostic process, and significantly reduce patient time and expenses. The results from utilizing EfficientNetV2-S, EfficientNet-B1, EfficientNet-B3, InceptionV3, and Xception in conjunction with 5KCV are outlined in
Table 7,
Table 8,
Table 9,
Table 10 and
Table 11 and
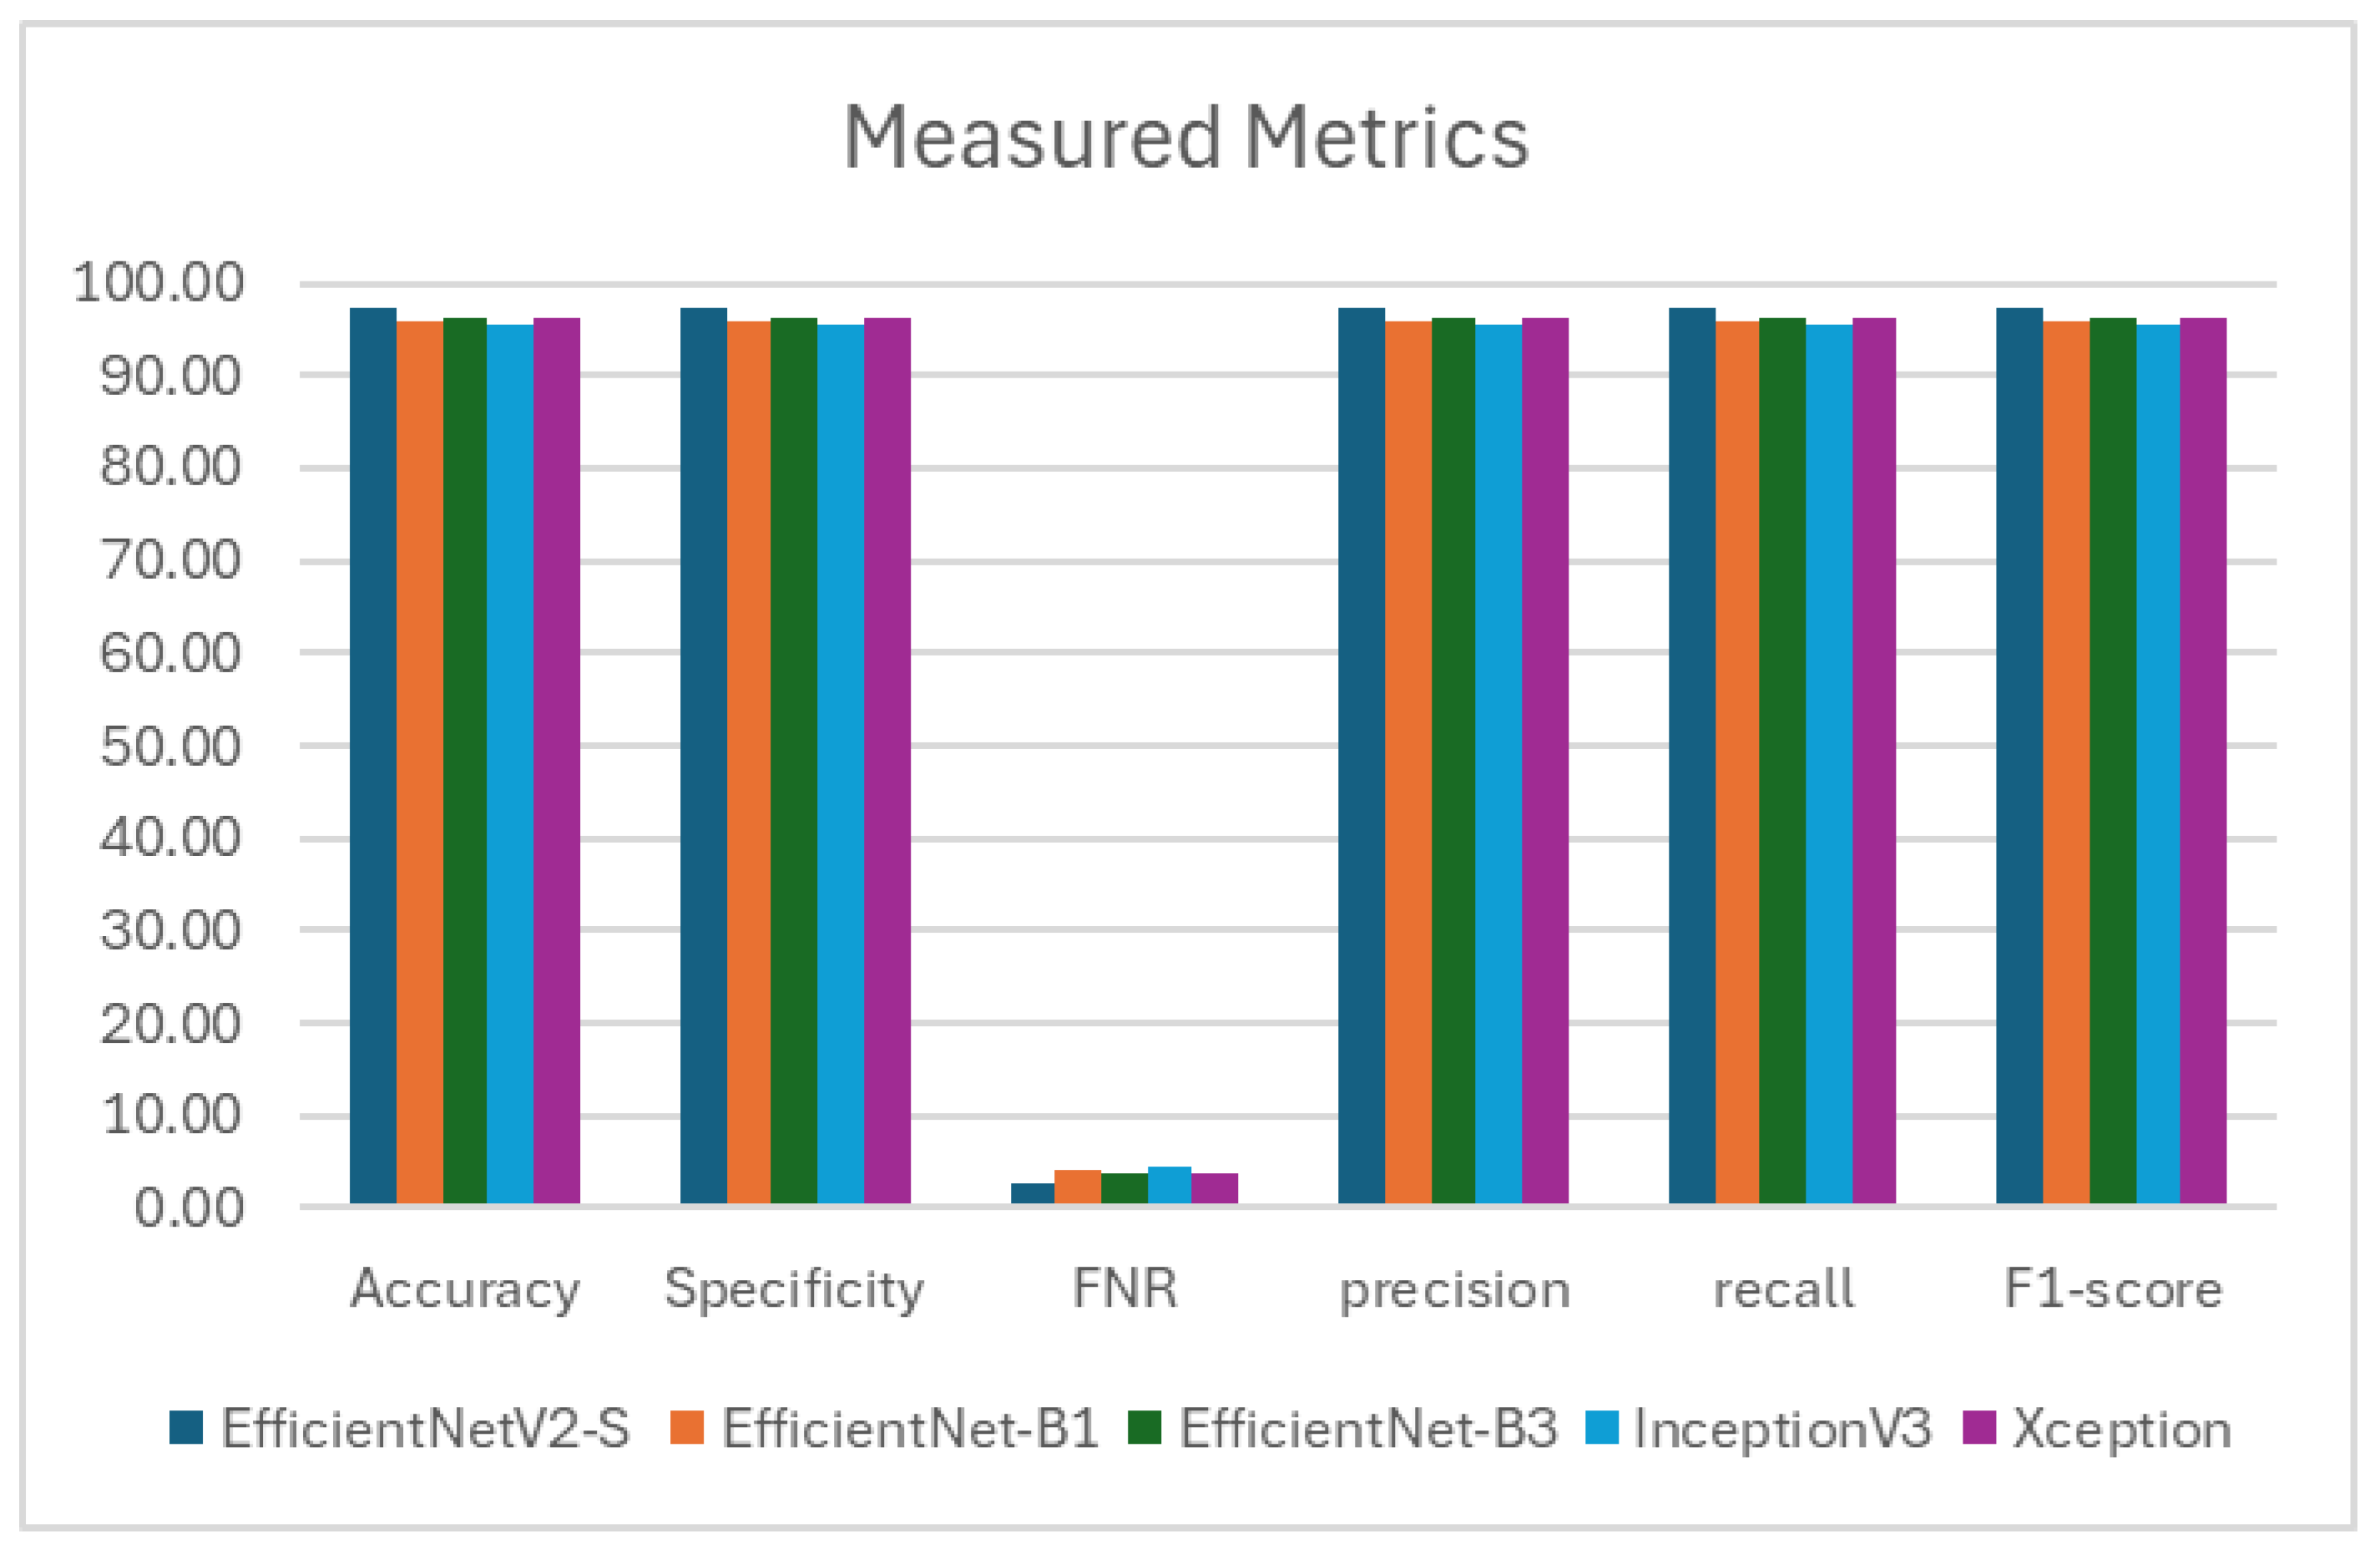
Figure 8. These tables present the average assessment metrics for the proposed models used in the binary classification task on the C-NMC_Leukemia dataset’s test set. The average accuracies achieved were 97.339%, 95.690%, 96.273%, 95.408%, and 95.243%, respectively.
As a result, the EfficientNetV2-S model demonstrated the highest level of accuracy.EfficientNet-B1 achieved high performance with 97.339% specificity, recall, and precision. It showed a low FNR of 21.790% and maintained an impressive F1- score of 97.339%. EfficientNet-B3 demonstrated solid performance with 96.273% specificity, recall, and precision. It had a relatively low FNR of 3.727% and a commendable F1-score of 96.273%. InceptionV3 showed reliable performance with 95.408% specificity, recall, and precision. It had an FNR of 4.592% and an F1-score of 95.405%. Xception displayed consistent performance with 95.243% specificity, recall, and precision. It had an FNR of 4.757% and an F1-score of 95.242%.
The EfficientNetV2-S model has exhibited outstanding performance in various metrics such as accuracy, specificity, recall, NVP, precision, and F1-score. It attained the highest average values for accuracy, specificity, recall, and F1-score, reaching 97.339%. Moreover, it achieved the highest average values for precision, at 97.342%. Remarkably, it also showcased the lowest average FNR at 2.661%. These outcomes underscore the model’s excellence in binary classification tasks, demonstrating strong performance across various evaluation criteria.
Figure 9,
Figure 10,
Figure 11,
Figure 12 and
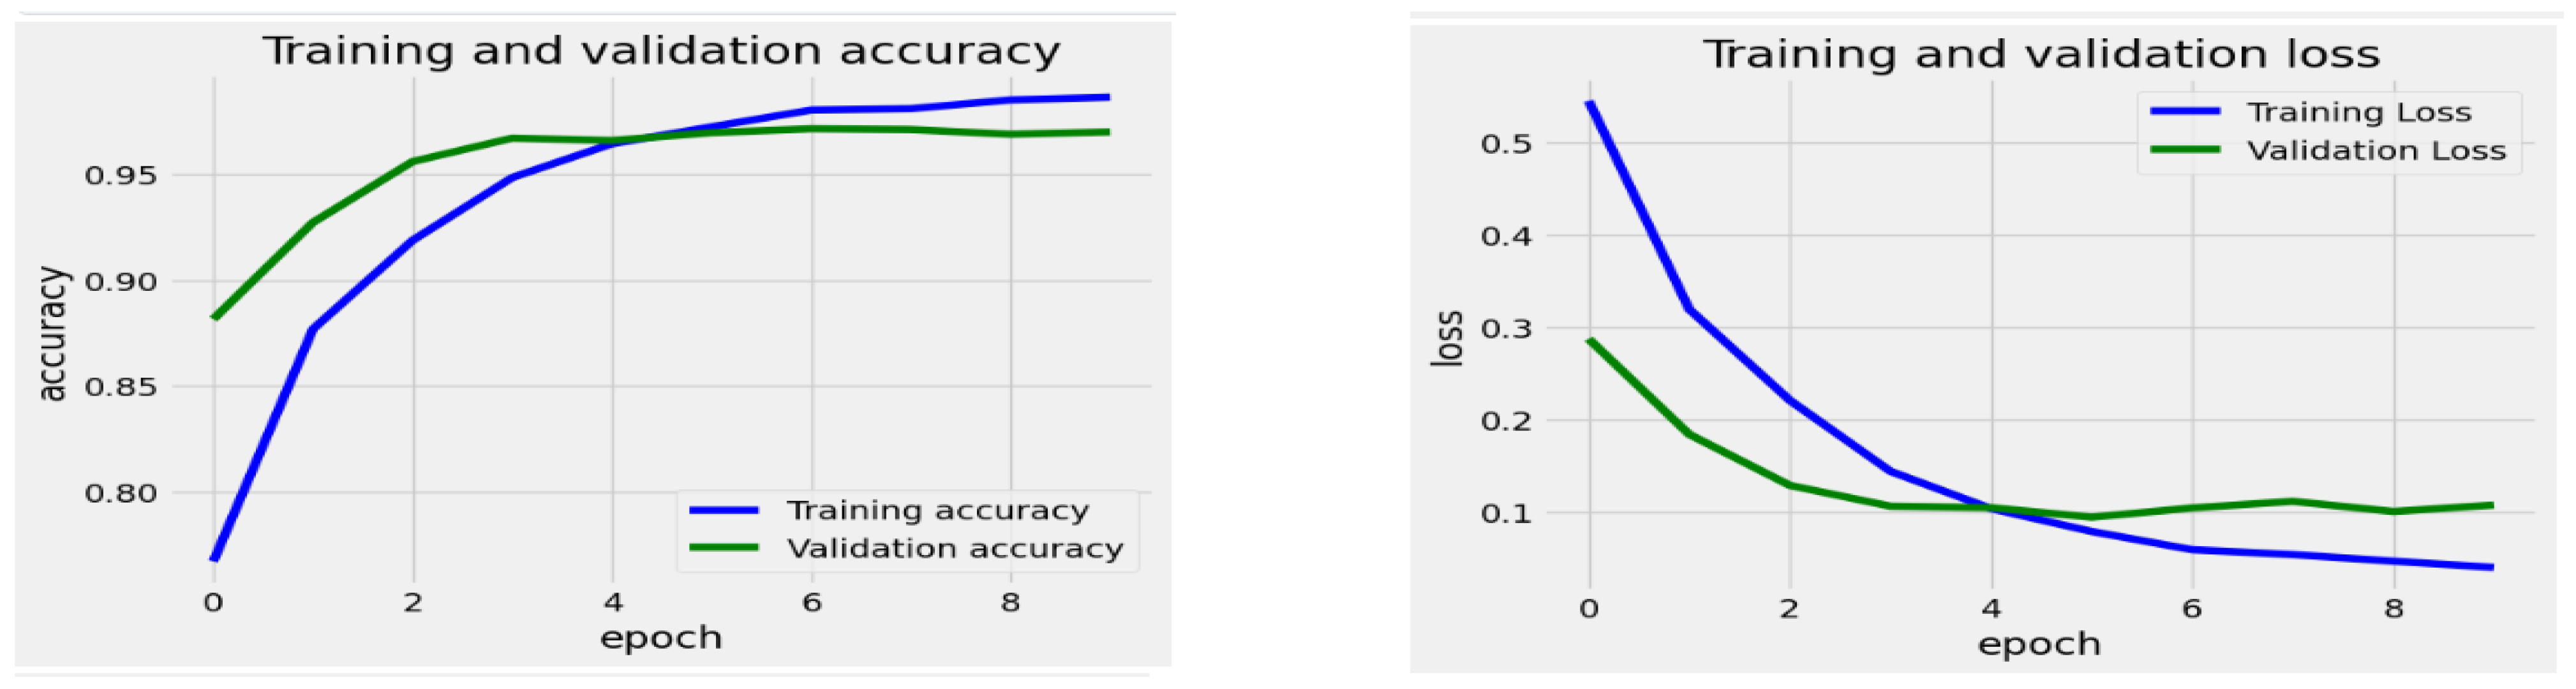
Figure 13 display the progression of training and validation metrics across 8 epochs for the EfficientNetV2-S, the EfficientNet-B1, the EfficientNet-B3, the InceptionV3, and the Xception DL models. The graph on the right illustrates the loss values on the Y-axis against the number of epochs on the X-axis. A blue curve depicts the training loss and the validation loss by a green curve. On the left graph, accuracy is plotted on the Y-axis with epochs on the X-axis. The training accuracy is in blue, and the validation accuracy is in green. During the training of the EfficientNetV2-S model, the initial training loss was notably high at epoch 0, suggesting that the model had not yet undergone sufficient training. The loss consistently diminished as the training progressed through the subsequent epochs, indicating that the model was effectively improving and adapting to the training dataset. By epoch 9, the loss stabilized at a lower level, representing a point of diminishing returns for additional training. Similarly, the validation loss initially decreased, mirroring the trend observed in the training loss. This pattern suggests the model successfully generalized to new data during the earlier epochs.
The training accuracy began at a low point of approximately 78% during epoch 0. It showed a rapid increase in the early epochs, reaching about 95% accuracy by epoch 4. Following epoch 4, the training accuracy gradually rose, stabilizing just above 97% by epoch 9. In contrast, the validation accuracy started higher than the training accuracy at epoch 0, at around 89%. It also increased quickly in the initial epochs, nearing its peak of approximately 96% by epoch 4. However, after epoch 4, the validation accuracy plateaued, showing minimal improvement and maintaining stability while remaining below the training accuracy.
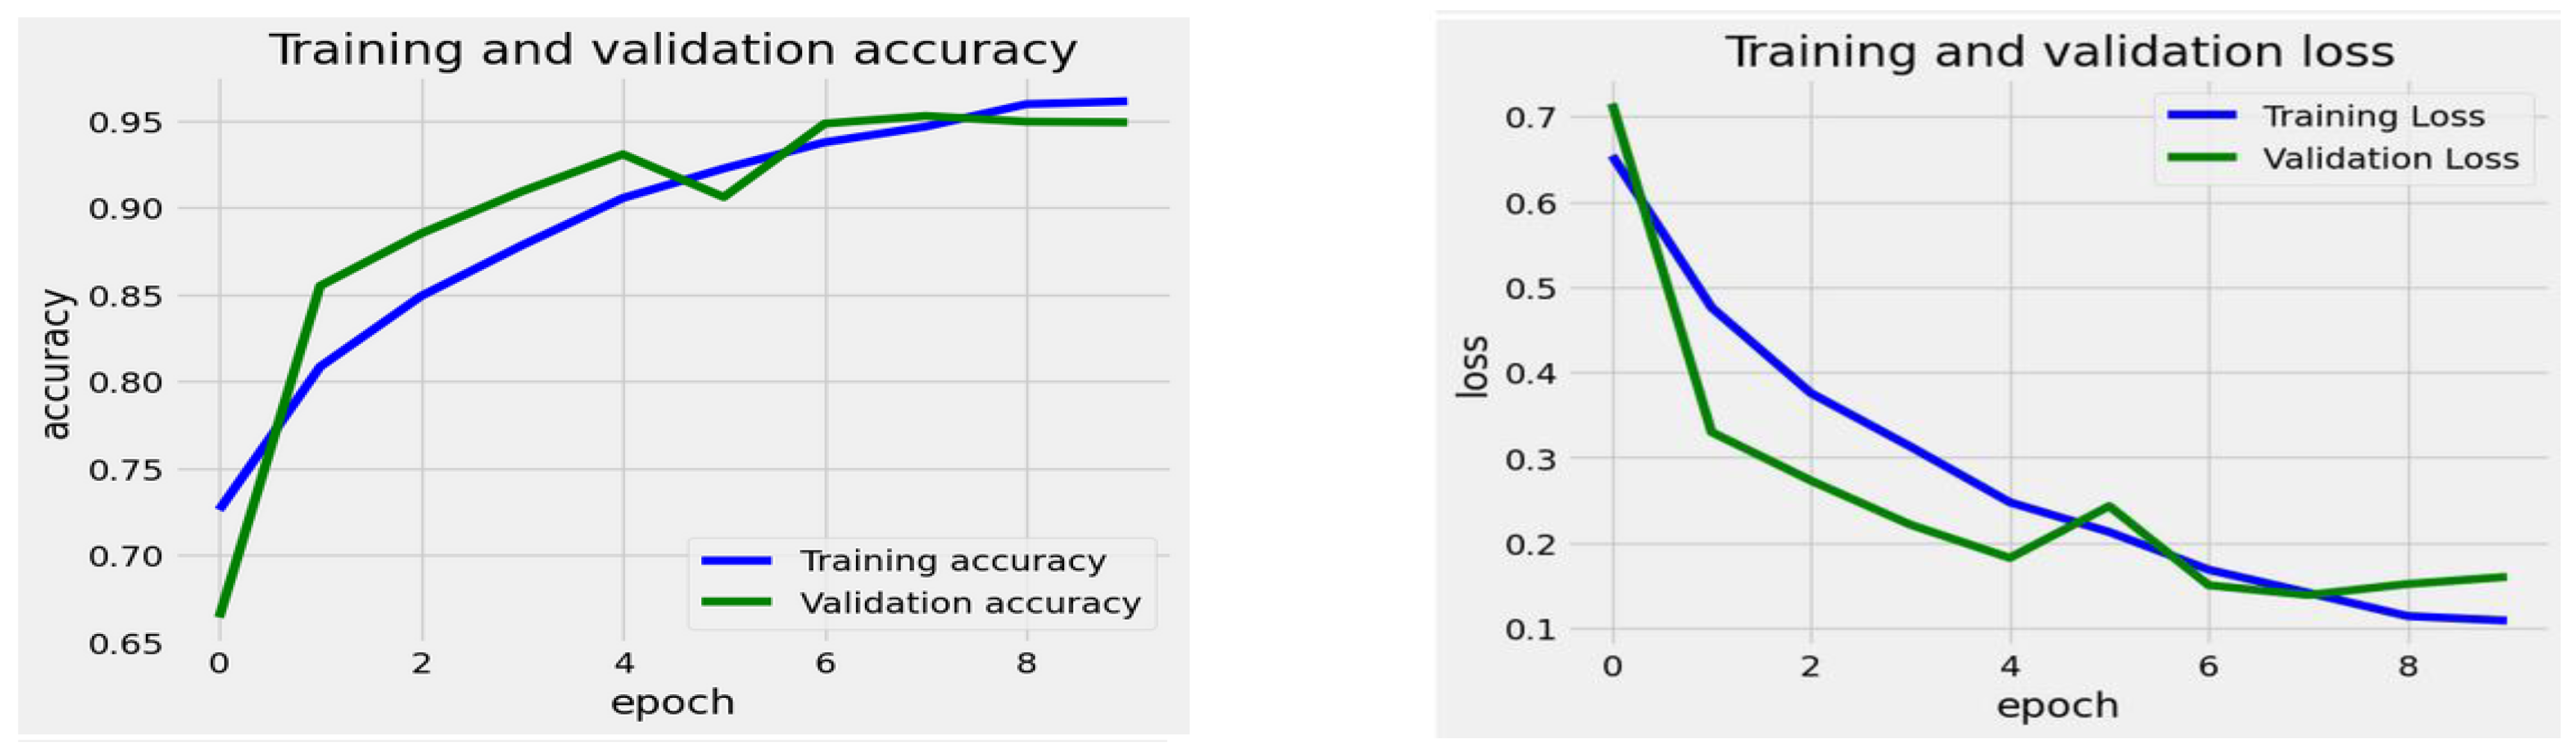
The training process for the EfficientNet-B1 Model began with a high training loss of about 0.7 during epoch 0. The loss consistently decreased as training progressed, indicating that the model improved its ability to learn from the training data. By epoch 9, the training loss had dropped to around 0.1, which reflects a successful error reduction on the training set. The validation loss followed a similar trend. It started at nearly 0.7 and experienced a significant decline in the initial epochs. However, there was a slight increase in the validation loss around epoch 6, suggesting some difficulties in generalization at that stage. After epoch 6, the validation loss resumed its downward trend, stabilizing at roughly 0.15 by epoch 9, which remained slightly higher than the training loss.
The training accuracy steadily improved over the epochs, starting at approximately 70% and stabilizing near 95% by the 9th epoch. In comparison, the validation accuracy initially increased rapidly, beginning at around 67%. It peaked around the 5th epoch, slightly surpassing the training accuracy, but then fluctuated slightly before stabilizing close to 95%. The overall results showed that the model attained high training and validation accuracy, indicating that the model learned effectively with minimal overfitting, as the two curves closely aligned after the initial epochs.
The EfficientNet-B3 Model began with an initial training loss of approximately 0.6. This loss steadily decreased throughout the training epochs, reaching about 0.1 by the 9th epoch. The validation loss followed a similar trend, although it experienced minor fluctuations. Notably, during the 5th and 6th epochs, the validation loss temporarily increased before continuing its downward trend. By the conclusion of the final epoch, the validation loss stabilized at around 0.1. The data indicates that the model’s loss consistently decreased for both the training and validation sets, highlighting effective learning. Although there were minor fluctuations in the validation loss, the overall downward trend suggests that the model did not experience significant overfitting.
The training accuracy increased steadily from approximately 75% at epoch 0 to nearly 96% by epoch 9, demonstrating continuous improvement. The validation accuracy initially rose sharply, starting at around 70%, and it soon surpassed the training accuracy. By the 5th epoch, it fluctuated slightly but remained closely aligned with the accuracy of the training. Eventually, it plateaued nearly 96% by the final epoch. The figure indicated that the training and validation accuracies closely matched, suggesting the model generalized well without significant overfitting. Both curves showed a consistent upward trend, stabilizing at a high accuracy level.
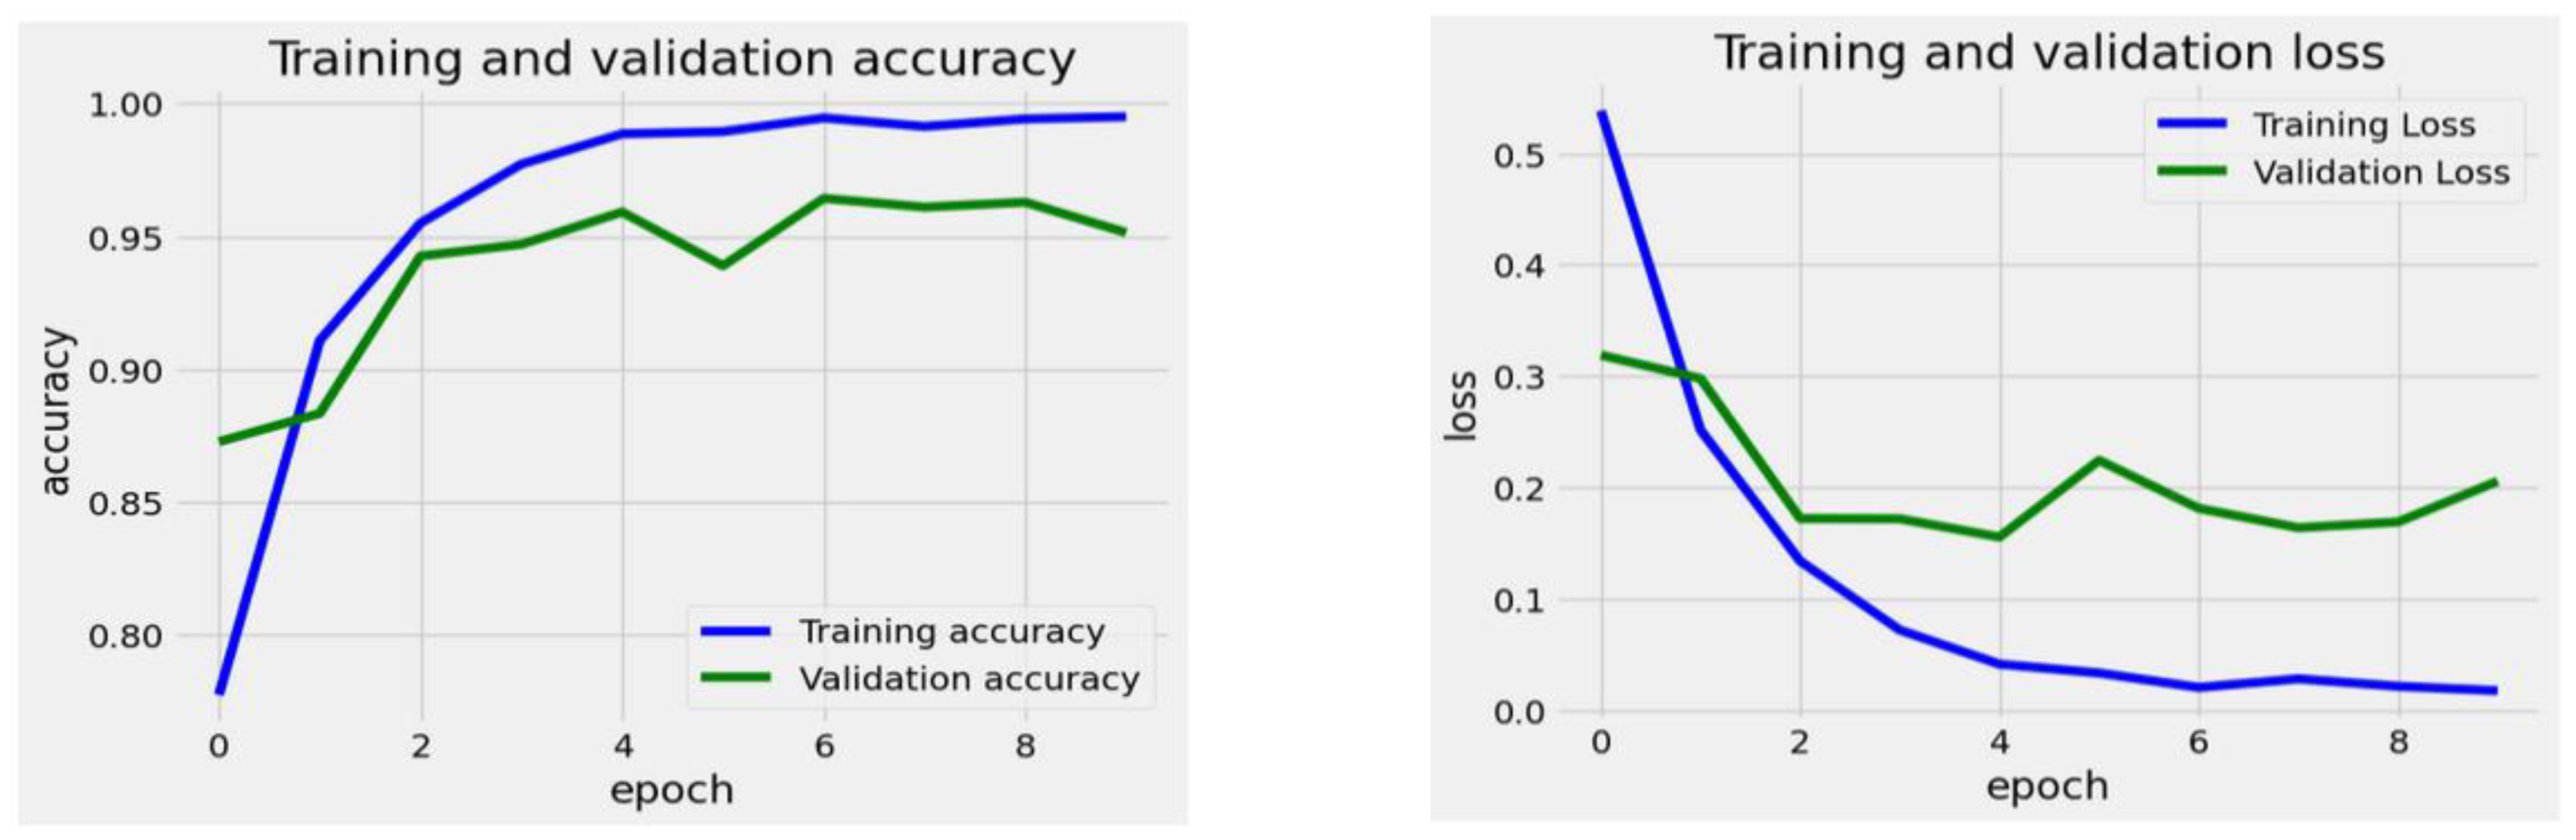
For the InceptionV3 model, the training loss started at around 0.55 during the first epoch and consistently decreased throughout the training process, reaching a low of approximately 0.02 by the ninth epoch. This trend indicates that the model successfully adapted to the training data over time. In contrast, the validation loss began at about 0.3 and dropped until around the second epoch. After this point, it stabilized and exhibited some variability. Notably, after the second epoch, the validation loss fluctuated between roughly 0.15 and 0.2, with a slight upward trend observed toward the end. The discrepancy between the training loss and validation loss suggests that the model may have overfitted to the training data. While the training loss continued to decline steadily, the validation loss did not show improvement after a few epochs, indicating that the model’s generalization ability did not enhance further.
The training accuracy began at approximately 0.8 during epoch 0 and steadily increased throughout the epochs, approaching 1.0 by epoch 9. This gradual rise indicates that the model effectively learned to make more accurate predictions on the training data. In contrast, the validation accuracy started at around 0.87 and experienced a rapid increase until epoch 2, reaching nearly 0.95. However, after epoch 2, it displayed minor fluctuations, remaining in the range of 0.95 to 0.97, without showing significant improvement. By epoch 9, it showed a slight decline compared to earlier values. The growing gap between training and validation accuracy over time suggests potential overfitting. While the model nearly memorized the training data perfectly, its performance on the validation set plateaued and did not improve, indicating that its ability to generalize to new, unseen data may be limited.
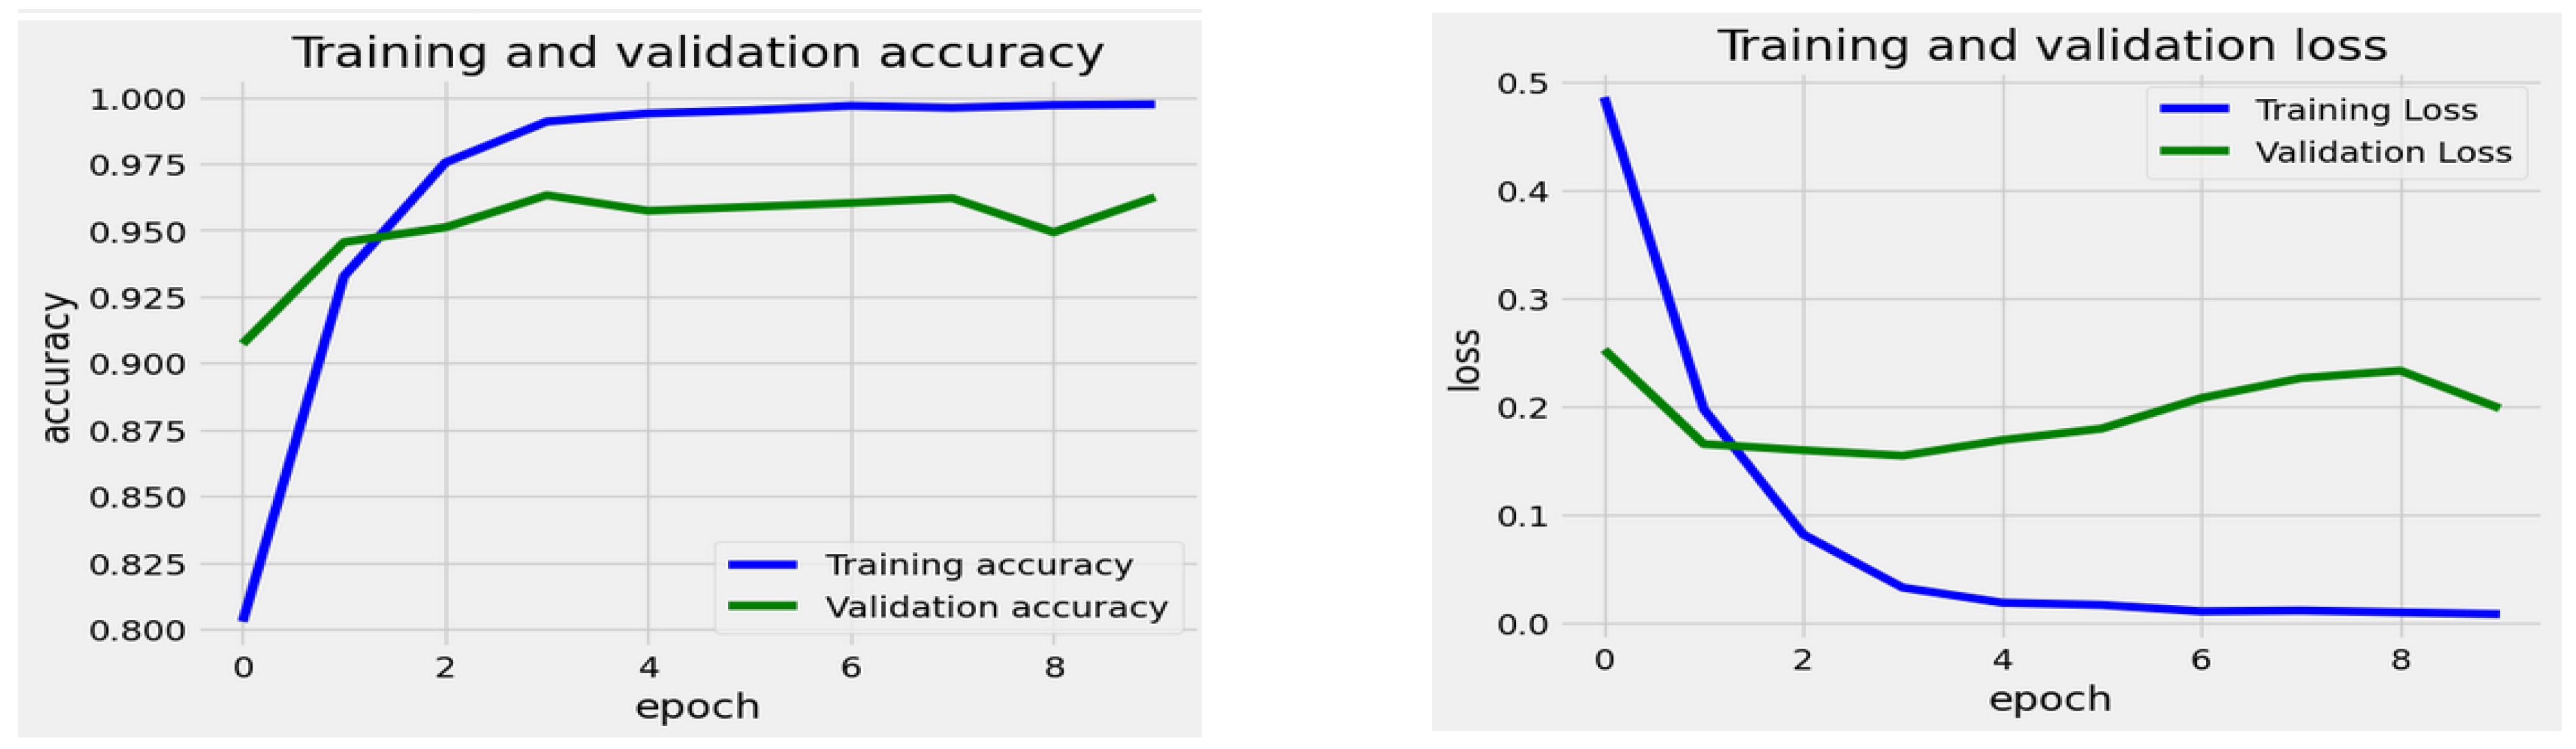
For the Xception model, the training loss started at around 0.5 during epoch 0 and showed a steady decline as the epochs progressed, eventually stabilizing near 0.02 by epoch 9. This consistent decrease indicates that the model effectively reduced losses on the training dataset over time. In contrast, the validation loss began at roughly 0.23 and initially decreased along with the training loss until it reached epoch 2. After epoch 2, the validation loss stabilized and began to show a slight increase, fluctuating between 0.17 and 0.23 in the subsequent epochs. The gap between training and validation loss after epoch 2 suggests that the model started to overfit the training data. While the training loss continued to decrease steadily, the validation loss stopped improving and began to rise, indicating a reduced ability to generalize to new, unseen data.
The training accuracy started at approximately 80% and increased rapidly during the first few epochs. By the end of the third epoch, it nearly reached 99% and remained consistent for the rest of the training, indicating that the model achieved almost perfect accuracy. The validation accuracy showed a similar upward trend but began to stabilize earlier. It peaked at around 95% after the third epoch and displayed minor fluctuations afterward, with slight decreases and recoveries, but it never surpassed the training accuracy. In conclusion, the data indicated that while the training accuracy reached 100%, the validation accuracy leveled off below this point, suggesting a potential overfitting of the training data. The gap between the curves highlighted the model’s limited capacity to generalize to new, unseen data.
In
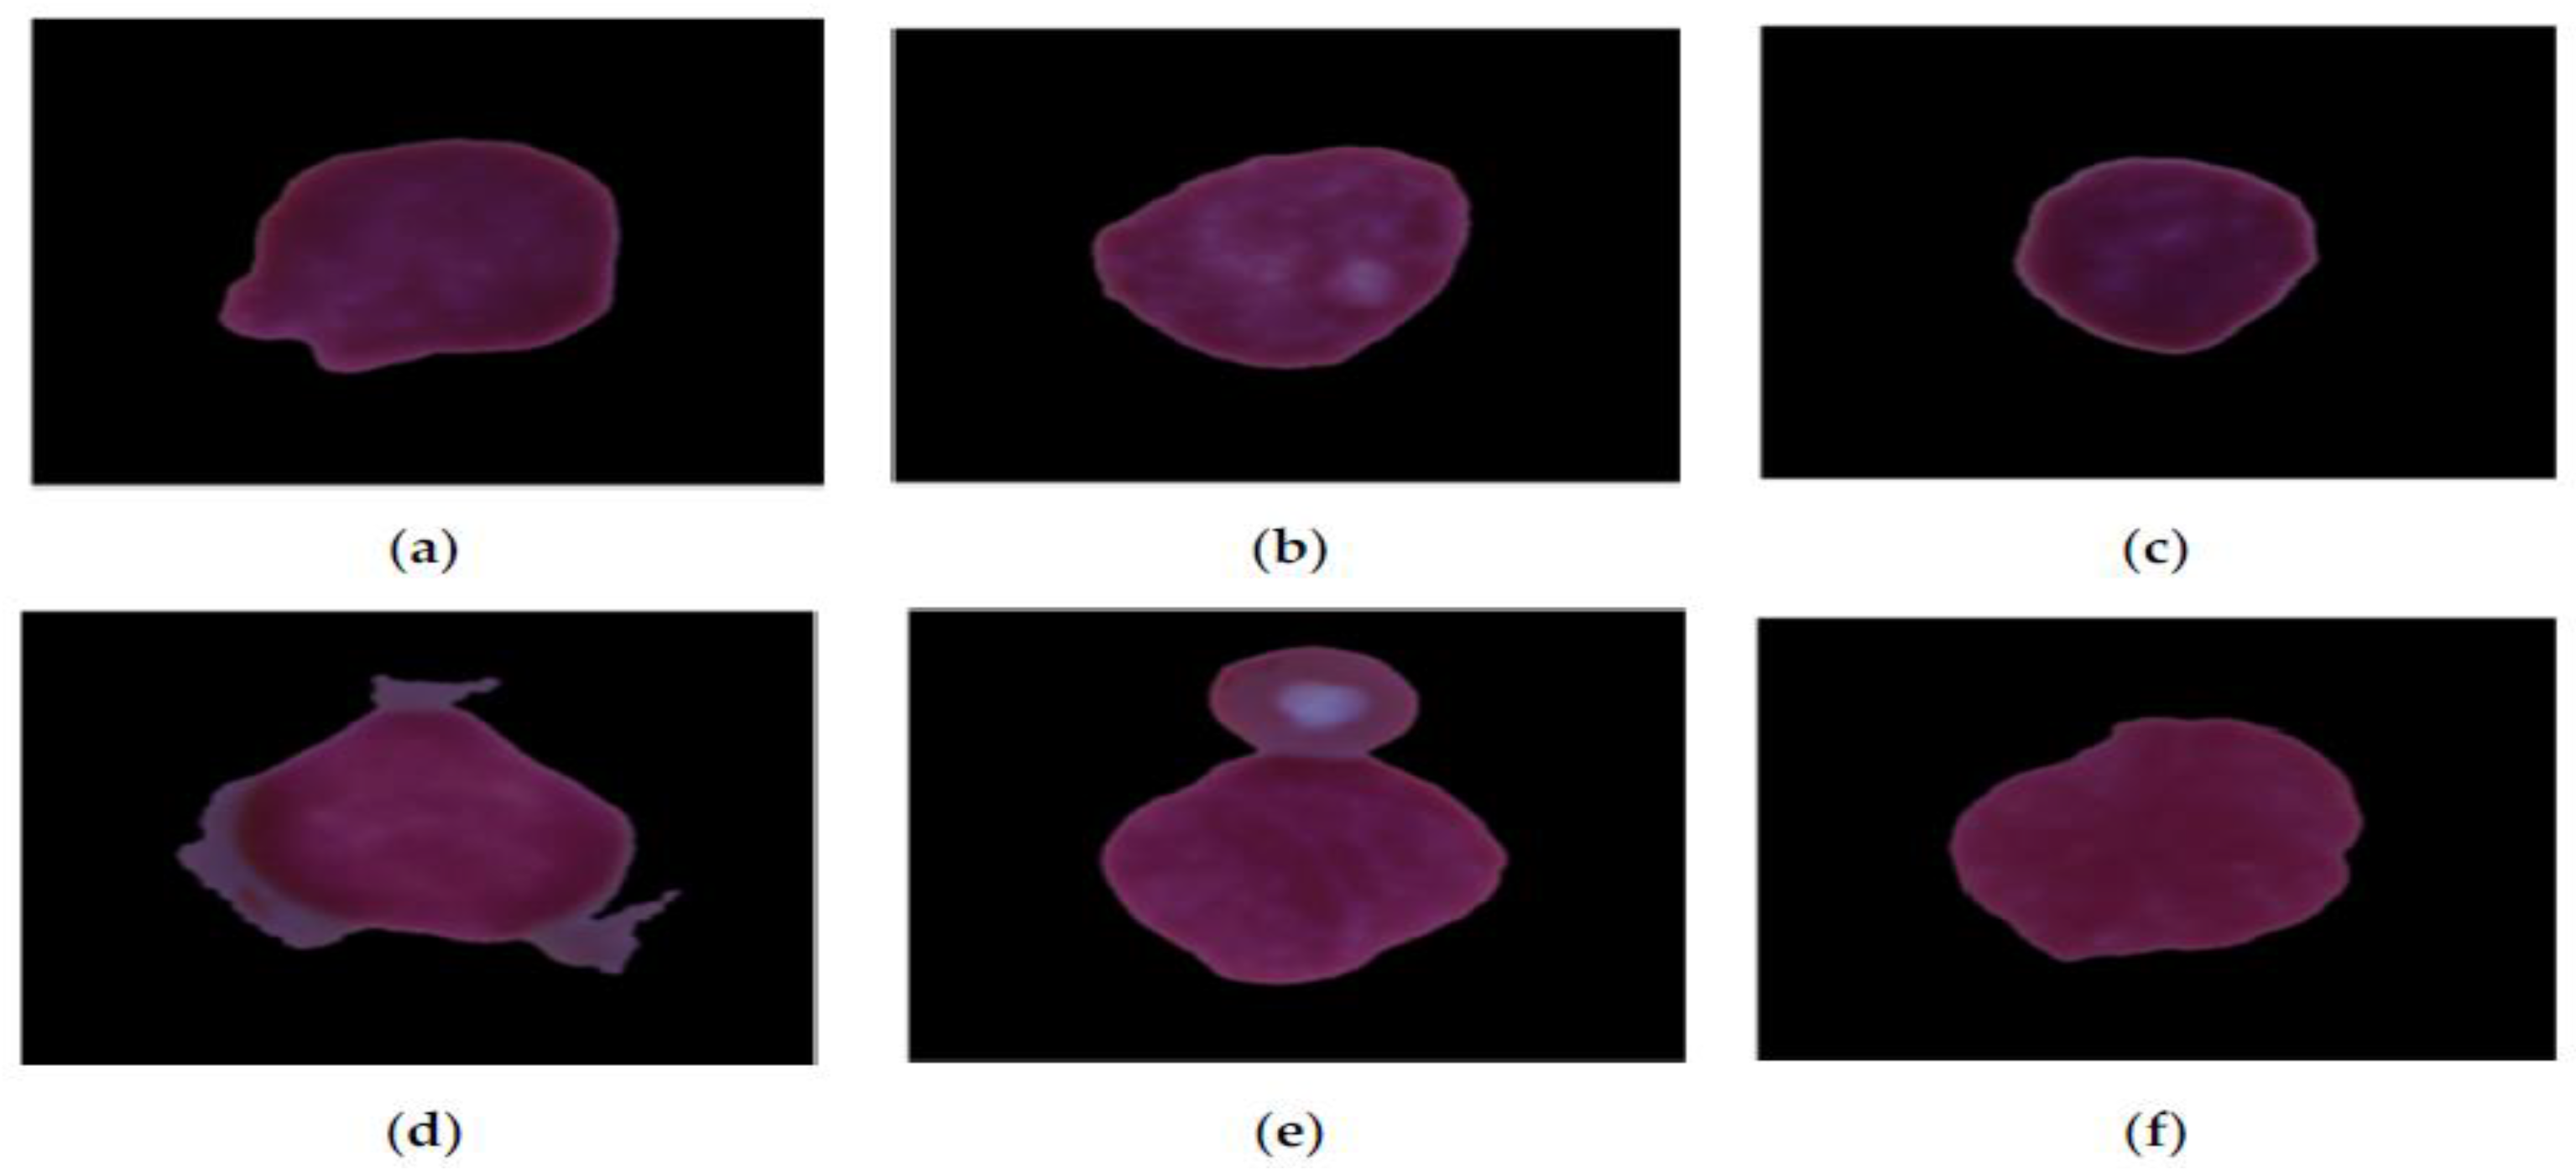
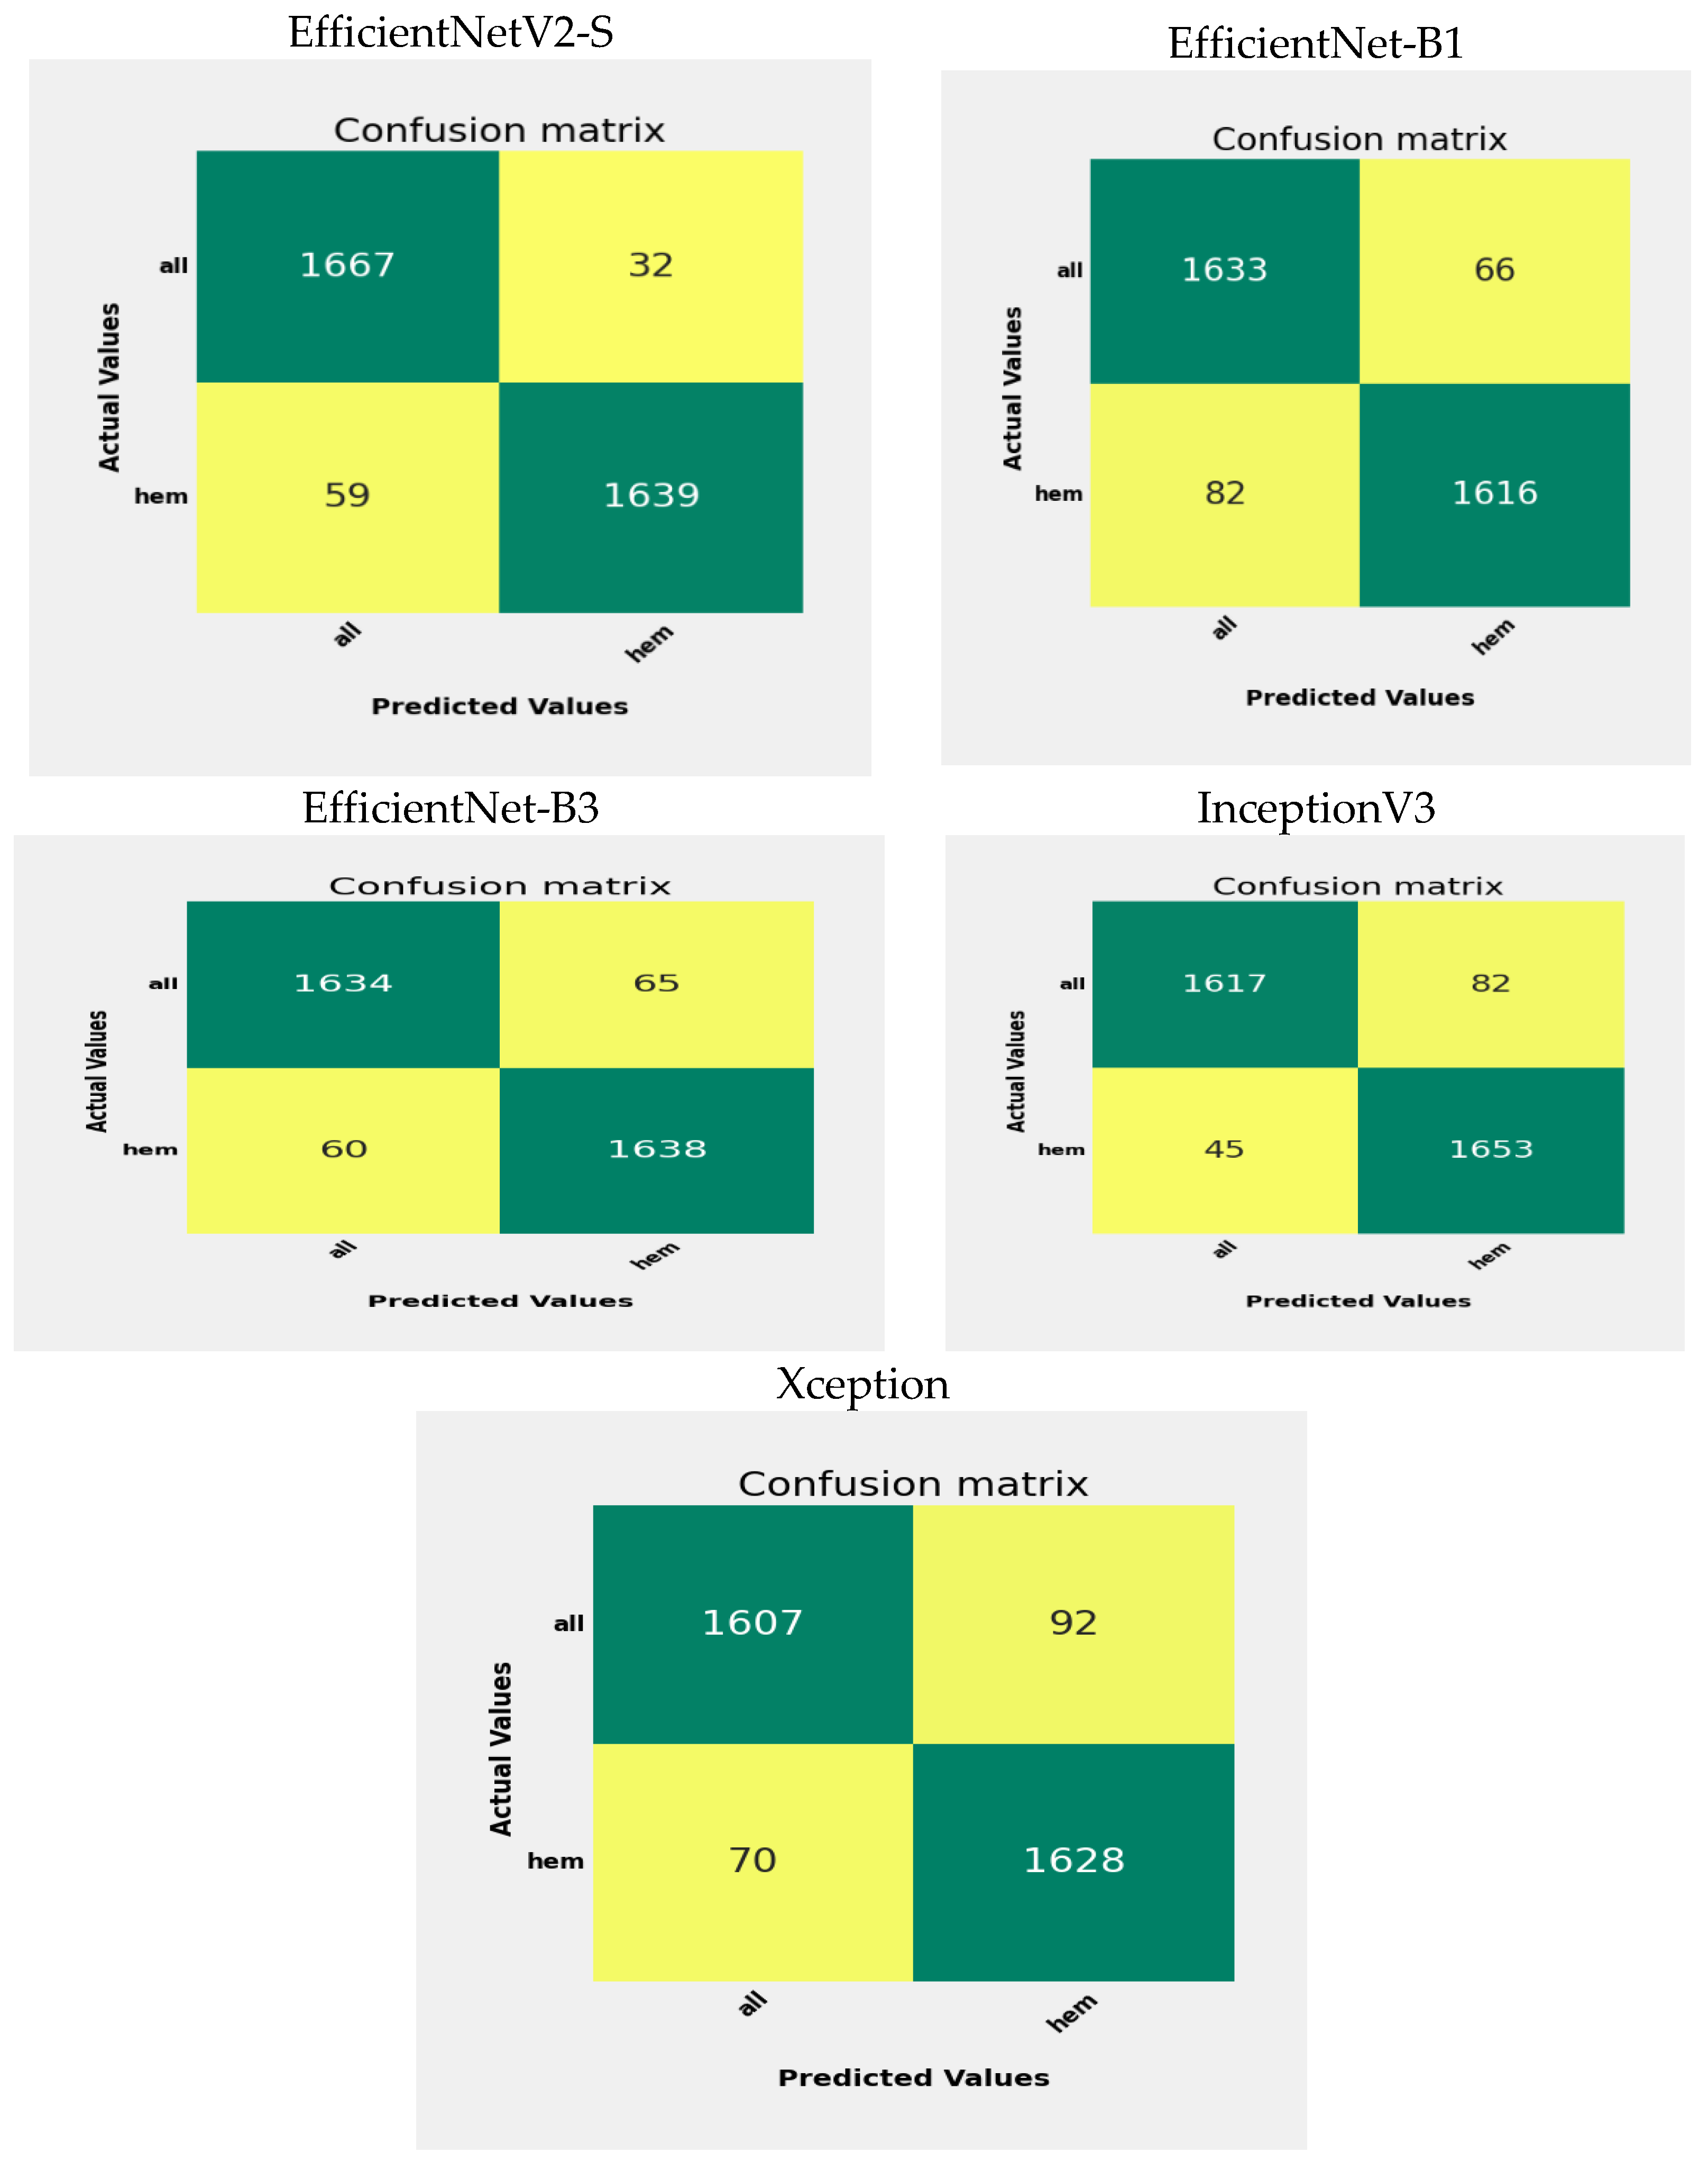
Figure 14, we can observe the outcomes of testing the EfficientNetV2-S, EfficientNet-B1, EfficientNet-B3, InceptionV3, and Xception DL models on the C-NMC_Leukemia test set, which consists of two main categories: Healthy and ALL. The ALL category contains 1699 images, while the Healthy category comprises 1698 images.
Some specific counts indicate the performance of the EfficientNetV2-S model. The TP count is 1667, showing that the model accurately predicted 1667 instances belonging to the ALL class. The FP count is 32, meaning the model mistakenly identified 32 cases as ALL when they were Healthy, which suggests that the model has some difficulty distinguishing between the characteristics of ALL and Healthy in specific situations. Such misclassifications can occur because of similar visual features between ALL and Healthy and noise or artifacts in the images. The FN count is 59, indicating that the model incorrectly labeled 59 cases as Healthy when they were not. This type of misclassification stems from overlapping features or inadequate distinguishing patterns.
On the other hand, the TN count is 1639, demonstrating that the model correctly predicted 1639 instances that belonged to the Healthy class. Consequently, the precision for the ALL class stands at 98.1%, while the precision for the Healthy class is 96.5%. The model’s overall accuracy is approximately 97.3%, illustrating that the model accurately classified 97.3% of the instances.
In evaluating the EfficientNet-B1 model, the number of TP is 1633, indicating instances correctly predicted as ALL. Conversely, there are 66 FP instances incorrectly classified as ALL instead of Healthy. Moreover, 82 FN represent instances wrongly identified as Healthy instead of ALL. In contrast, there are 1616 TN, showing instances predicted correctly as Healthy by the model. The precision for the ALL class is 96.11%, denoting ALL predictions’ accuracy, while the Healthy class’s precision is 95.17%. The overall model accuracy is around 95.7%, meaning the model correctly classified 95.7% of instances.
When assessing the EfficientNet-B3 model, it correctly identified 1634 cases of ALL. However, it mistakenly classified 65 cases of Healthy as ALL. On the other hand, 60 cases of ALL were inaccurately labeled as Healthy. The model accurately recognized 1638 cases of health. The precision for the ALL category is 96.17%, signifying the correctness of its predictions for ALL. Similarly, the precision for the Healthy category is also 96.4%. The model’s overall accuracy is approximately 96.2%, accurately classifying 96.2% of cases.
When evaluating the InceptionV3 model, it correctly identified 1617 instances of ALL. However, it mistakenly categorized 82 Healthy cases as ALL. Conversely, it misclassified 45 ALL cases as Healthy. The model correctly detected 1653 Healthy cases. The precision for the ALL class is 95.17%, demonstrating the accuracy of its ALL predictions. Likewise, the precision for the Healthy class is 97.3%. The model’s overall accuracy is around 95.4%, showing that it correctly categorized 95.4% of instances.
When assessing the Xception model, it accurately recognized 1607 occurrences of ALL. Nonetheless, it erroneously labeled 92 Healthy instances as ALL. In contrast, it misidentified 70 ALL instances as Healthy. The model accurately identified 1628 Healthy occurrences. The precision for the ALL category stands at 94.6%, indicating the reliability of its ALL predictions. Similarly, the precision for the Healthy category is 95.8%. The model’s general accuracy hovers at approximately 95.2%, indicating that it precisely classified 95.2% of occurrences.
In
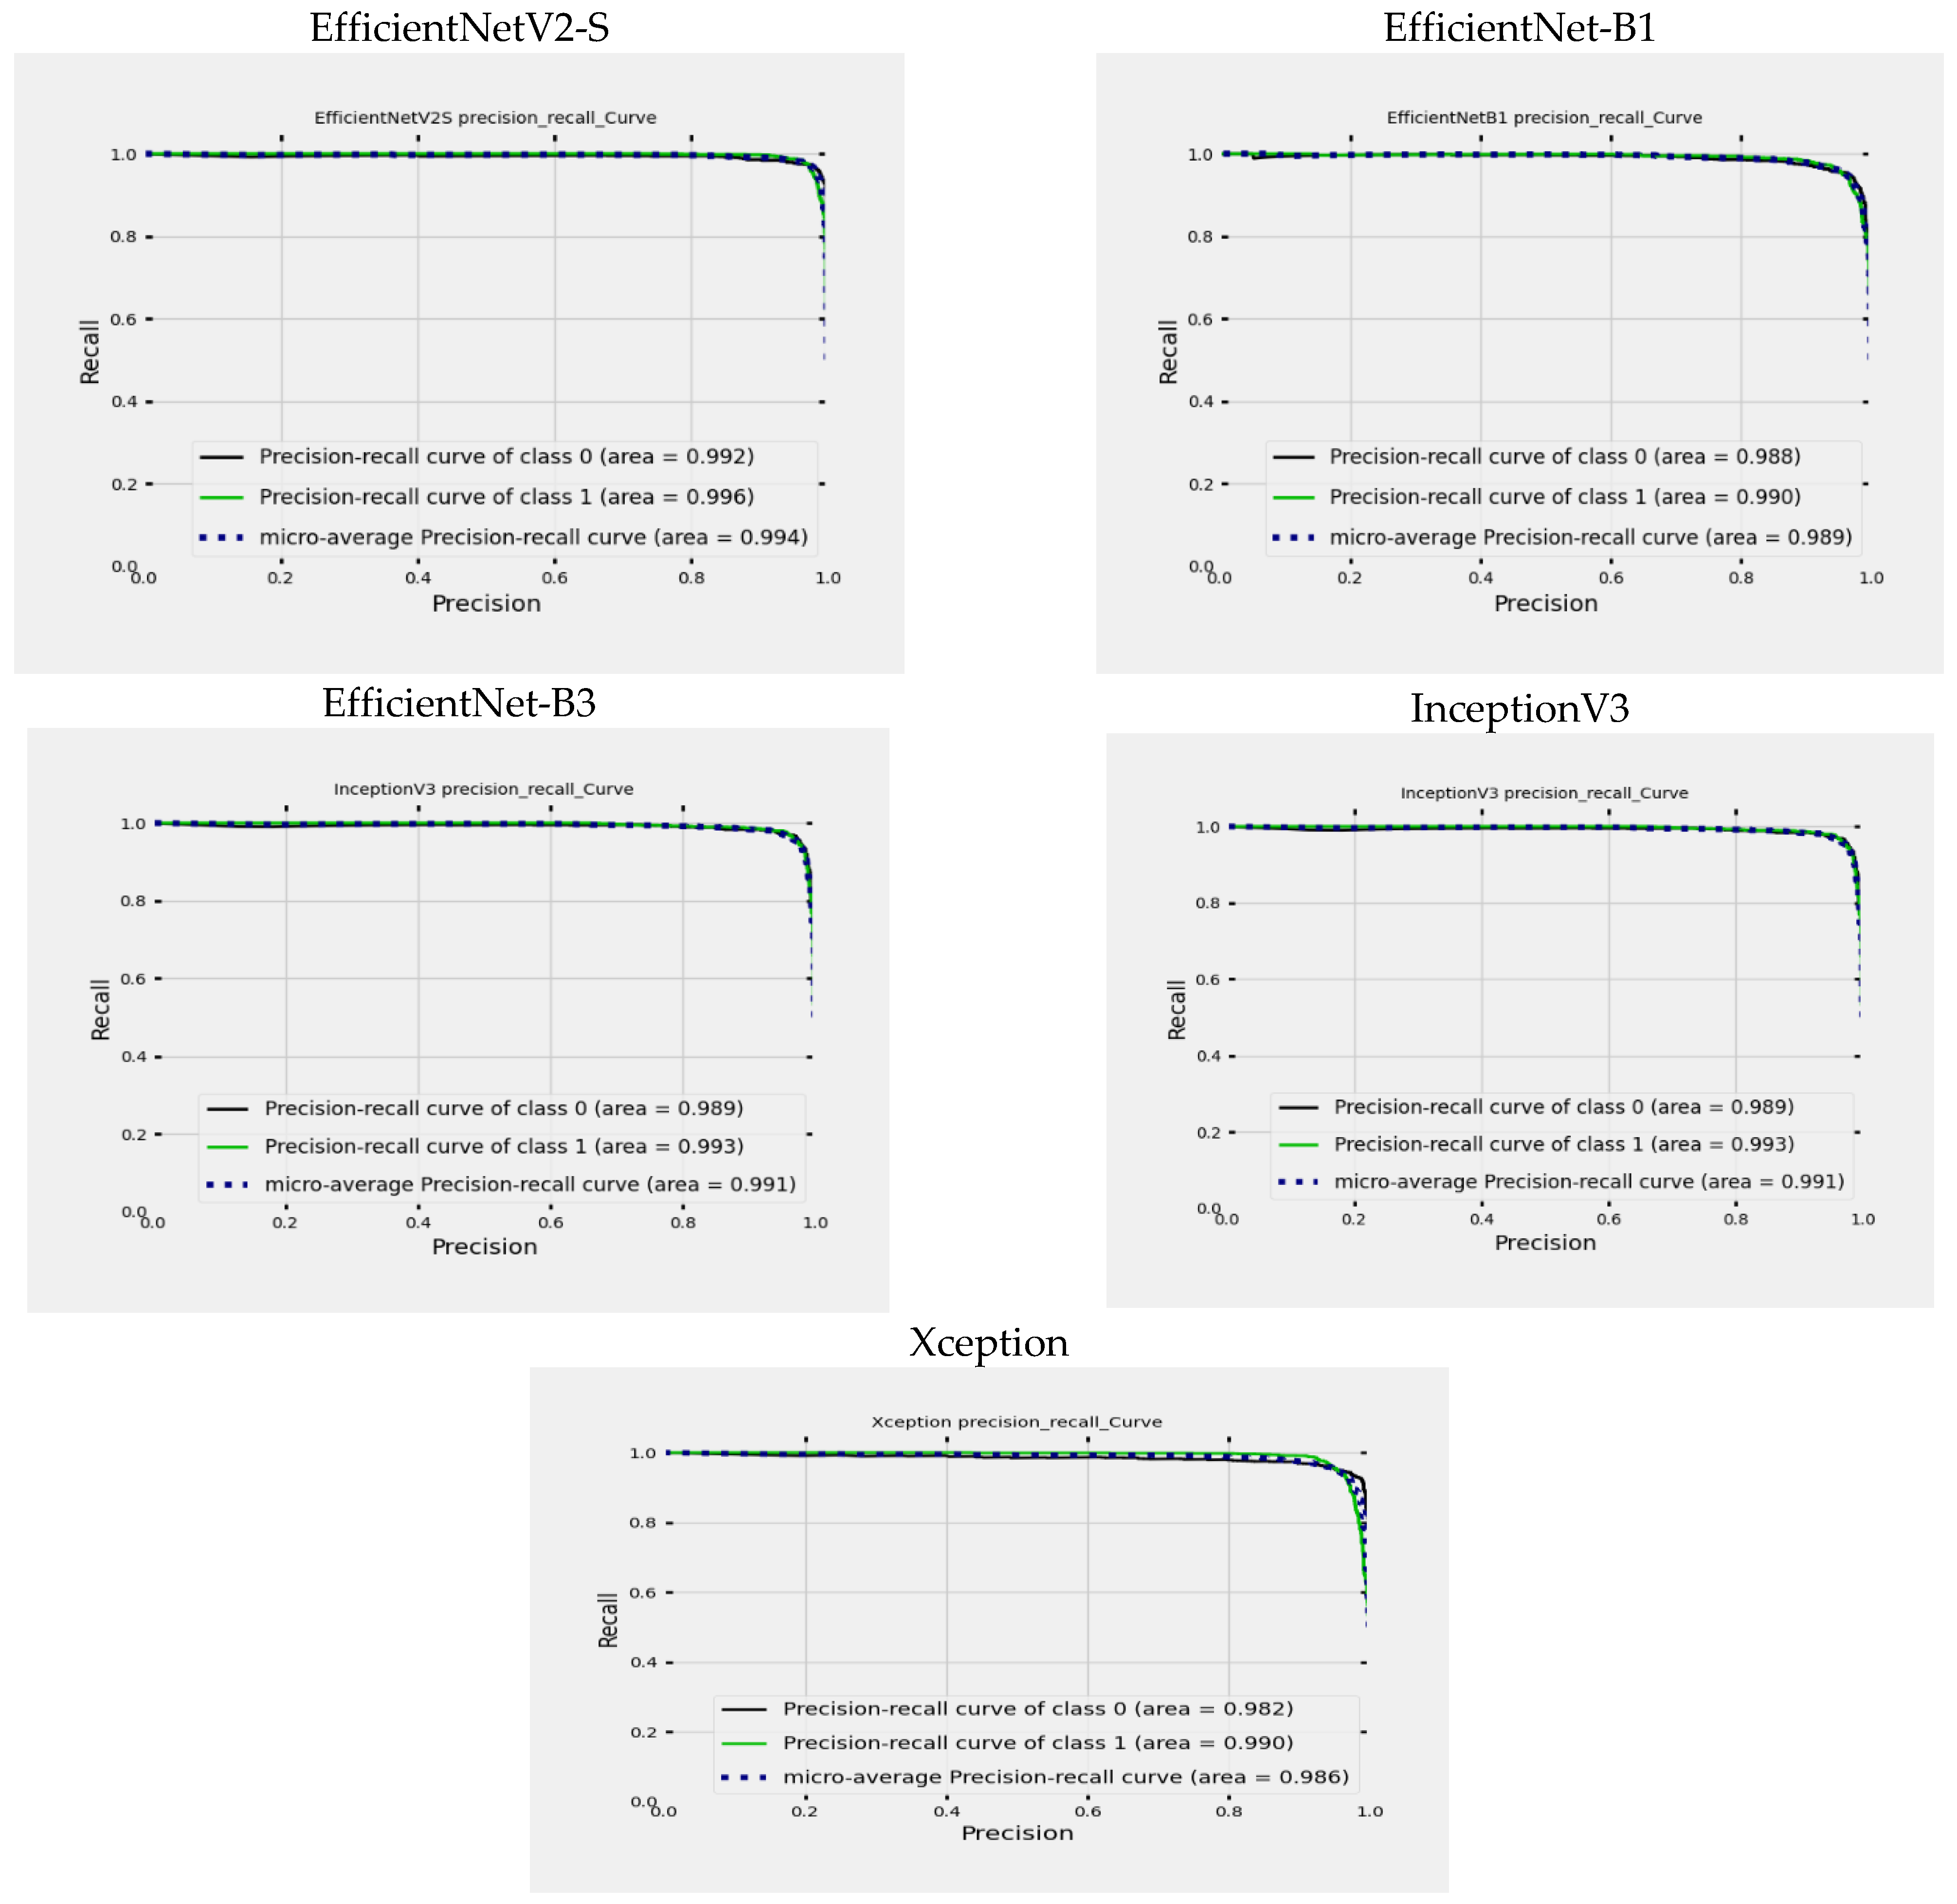
Figure 15, you can see a graph illustrating the Precision-Recall (PR) curves for EfficientNetV2-S, EfficientNet-B1, EfficientNet-B3, InceptionV3, and Xception. This graph helps us understand how precision and recall values change based on different threshold settings. The X-axis (precision) represents the ratio of TP to the sum of TP and FP. It shows the accuracy of optimistic predictions made by the model. The Y-axis (recall) shows the ratio of TP to the sum of TP and FN. It reflects the model’s ability to identify all relevant cases within the dataset. The graph includes different lines:
The black line depicts the precision-recall curve for class ALL.
The green line illustrates the precision-recall curve for class Healthy.
The blue dotted line represents the Micro-averaged precision-recall curve, which simultaneously considers precision and recall values across all classes.
For the EfficientNetV2-S model, the ALL class’s area under the curve (AUC) is 99.2%, indicating high precision and recall across various thresholds. Achieving a high AUC of 99.2% showcases exceptional performance predicting the ALL class. Similarly, the AUC for the Healthy class is 99.6%, signifying high precision and recall as well. With a remarkable AUC of 99.6%, the model demonstrates superior performance in predicting the Healthy class. Furthermore, the micro-averaged AUC of 99.4% presents an overall performance metric that combines the predictive capabilities comprehensively.
The performance of the EfficientNet-B1 model was evaluated using the area under the curve (AUC) metric. The AUC for the ALL class was found to be 98.8%, indicating strong precision and recall at different thresholds. This high AUC value of 98.8% demonstrates the model’s exceptional ability to predict the ALL class accurately. Similarly, the AUC for the Healthy class was 99.0%, showing excellent precision and recall. The model’s remarkable AUC score of 99.0% signifies its superior performance in predicting the Healthy class. Additionally, the micro-averaged AUC of 98.9% provides a comprehensive performance metric that reflects the overall predictive capabilities of the model.
For the EfficientNet-B3 model, the AUC for the ALL class is 98.9%, demonstrating excellent precision and recall across different thresholds. This high AUC of 98.9% indicates outstanding performance in predicting the ALL class. Similarly, the AUC for the Healthy class is 99.0%, highlighting strong precision and recall rates. The model achieves an impressive AUC of 99.0% in predicting the Healthy class. The micro-averaged AUC of 99.0% provides a comprehensive performance measure that effectively combines predictive capabilities.
The InceptionV3 model exhibits exceptional accuracy in classifying ALL and Healthy classes. The model demonstrates outstanding precision and recall at various thresholds, with an AUC of 98.9% for ALL and 99.3% for Healthy classes. These high AUC values signify the model’s exceptional predictive performance for both classes. Moreover, the micro-averaged AUC of 99.1% offers a holistic evaluation of the model’s overall predictive capabilities, showcasing its seamless effectiveness in combining predictive strengths.
The Xception model shows remarkable accuracy when distinguishing between the ALL and Healthy classes. It achieves an AUC of 98.2% for the ALL class and 99.0% for the Healthy class, highlighting its excellent precision and recall across different thresholds. The high AUC values indicate the model’s exceptional predictive ability for both classes. Additionally, the micro-averaged AUC of 98.6% provides a comprehensive assessment of the model’s overall predictive performance, demonstrating its seamless integration of predictive capabilities.
4.4. Discussion of the Outcomes of the Recent Literature
WBCs are essential components of the immune system. Unlike RBCs, which primarily transport oxygen, WBCs protect the body from infections and other foreign threats. These cells are generated in the bone marrow through a process called hematopoiesis. Within the bone marrow, HSCs differentiate into various types of blood cells, including WBCs. Once they reach full maturity, WBCs enter the bloodstream and surrounding tissues to perform their immune functions. Anomalies in the quantity, size, structure, or function of WBCs can disrupt the bone marrow’s ability to produce vital blood components, potentially weakening the immune system. Abnormal WBCs can crowd out normal blood cells, leading to decreased RBCs, WBCs, and platelets. Additionally, suppose cancerous WBCs circulate in the bloodstream. In that case, they may harm essential organs such as the liver, kidneys, spleen, and brain, which result in severe complications, including infections, disorders of the immune system, and blood-related cancers, such as leukemia.
This research aims to create a strong and optimized model based on the EfficientNetV2-S architecture to classify ALL diseases into two categories: ALL and Healthy. The study used the 5KCV technique, which allowed for effective fine-tuning of the model’s parameters to improve the performance of the EfficientNetV2-S model. By using 5KCV, we achieved a more thorough evaluation of the model’s performance compared to a single train-test split. The use of multiple folds helps to minimize variability in performance estimates. The average performance across the five folds is typically more stable and reliable than that from just one train-test split. Cross-validation is useful for identifying overfitting, where a model performs well on training data but poorly on validation data. This feedback is crucial for adjusting the model and selecting the right features. Cross-validation is also commonly used in hyperparameter tuning to determine the best model parameters, providing a reliable performance estimate for each parameter set and assisting in selecting the optimal choice. As a result, this fine-tuned model achieved superior outcomes compared to recent techniques outlined in
Table 13.
In
Table 13, various ML and DL techniques were utilized. These included CNNs as presented by Mondal et al. [
20], YOLO by R. Khandekar et al. [
21], and traditional ML models such as NB, KNN, RF, and SVM used by Almadhor et al. [
22]. Additionally, advanced DL models featuring specialized architectures were employed in the studies by Kasani et al. [
23] and Liu et al. [
24]. Hybrid models, such as those by Sulaiman et al. [
25], were also explored, and they combined ResNet features with RF and SVM.
Our proposed model, which integrated EfficientNetV2-S with a 5KCV approach, achieved the highest classification accuracy of 97.33%, surpassing all other models. This result underscores the effectiveness of EfficientNetV2-S alongside 5KCV. The YOLO model (Khandekar et al. [
21]) attained a mAP of 98.7%. The second-highest classification accuracy was recorded by Kasani et al. [
23], with a score of 96.58% using DL techniques. Traditional ML methods, as demonstrated by Almadhor et al. [
22], showed comparatively lower performance, with SVM achieving the best result among them at 90%.
EfficientNetV2-S is recognized as a state-of-the-art DL model and is noted for its efficiency and scalability, factors that likely contribute to its high accuracy. Implementing 5KCV enhanced the robustness of the findings by minimizing overfitting and providing a dependable estimate of the model’s generalization capabilities.
In summary, the proposed model demonstrated the best classification accuracy (97.33%) on the C-NMC_Leukemia dataset, showcasing the promise of EfficientNetV2-S when combined with rigorous evaluation methods such as 5KCV.


