Article

A Robust Large-Scale Multi-Criteria Decision Algorithm for Financial Risk Management with Interval-Valued Picture Fuzzy Information

1
School of Economics, Minzu University of China, Beijing 712000, China
2
School of Economics, Wuhai Vocational and Technical College, Wuhai 016000, China
3
School of Economics, Hebei University of Engineering, Handan 056038, China
*
Author to whom correspondence should be addressed.
Symmetry 2025, 17(1), 144; https://doi.org/10.3390/sym17010144
Submission received: 2 December 2024 / Revised: 26 December 2024 / Accepted: 15 January 2025 / Published: 19 January 2025
(This article belongs to the Section Computer)

Abstract

:
Financial Risk Management (FRM) is crucial for organizations navigating complex and volatile economic conditions, as it aids in identifying and mitigating potential losses. Conventional FRM approaches are inadequate because they do not incorporate vagueness and variability in financial data. To overcome these challenges, this research presents interval-valued picture fuzzy measurement alternatives and rankings according to the Compromise Solution (IVPF-MARCOS) method. The IVPF-MARCOS method ranks investment strategies under uncertainty by assessing ten distinct investment options across seven key factors, including market risk and return on investment. It evidences its usefulness in enhancing decision-making, increasing accuracy in FRM, and developing Multi-Criteria Group Decision-Making (MCGDM) methodologies involving aggregation operators that are symmetric in nature. Consequently, this research establishes a compelling need to adopt improved fuzzy techniques in formulating the FRM to achieve more robust financial strategies.

1. Introduction

In today’s complex and dynamic financial landscape, effective FRM [1] has become increasingly critical for organizations striving to maintain stability and achieve sustainable growth. FRM entails the enumeration, evaluation, and categorization of financial risks and then declaring the optimal use of funds to alter the chance of regrettable occurrences. The increasing complexity of financial markets and various risks, including market risks, credit risks, liquidity risks, and regulatory risks, make the use of other traditional risk measurement models less capable of addressing the uncertainties and vagueness of financial data.
In the field of FRM, MCGDM [2] approaches have stepped forward because they allow for more straightforward evaluations with multiple conflicting criteria. However, there is a significant limitation for those current MCGDM techniques where deterministic models are used in the assessment while financial information is normally associated with fuzziness. Some of the decision outcomes would not be optimal, and the decision-makers would also be unable to dictate the various facets of financial risk. The fuzzy set (FS) theory, together with its concepts, was initiated by Zadeh [3] in 1965, where it addressed inherent vagueness by allowing elements to belong to a set at a degree between 0 and 1 rather than belonging or not belonging to a set. However, applying the concept of a traditional FS fails to formulate the different aspects of decision-making conditions. To this end, Intuitionistic Fuzzy Sets (IFS), developed by Atanassov [4], use both the membership degree (MD) and non-membership degree (NMD), leading to a probabilistic approach to uncertainty. However, IFS has problems describing hesitation and uncertainty; Yager [5] proposed Pythagorean Fuzzy Sets (PyFS) and q-Rung Orthopair Fuzzy Sets (q-ROFS) [6], where flexibility is attained with the freedom to have the MD and NMD vary across more than one dimension. picture fuzzy sets (PFS) were introduced by Cuong [7], which include abstinence degrees (ADs) that provide more flexibility. Finally, interval-valued picture fuzzy sets (IV-PFS) [8] expand on PFS by incorporating interval values to represent uncertainty, making them particularly useful for financial applications where precise information is often unavailable.
This study uses the interval-valued picture fuzzy (IVPF) approach integrated with the MARCOS approach to FRM. Thus, applying IVPF with MARCOS helps to provide a more solid approach to managing uncertainty and imprecision, which characterizes addressing critical financial decisions. IVPF is a more suitable method to depict uncertainty since it combines MD and NMD with AD intervals, making it more ideal for decision-making than conventional fuzzy systems. The IVPF-MARCOS methodology is superior to expert-based and data-based approaches since it can incorporate accurate additional expert knowledge and provide decision scheme flexibility without needing massive amounts of data, which are often lacking in FRM. This combination is beneficial where instability and reliance on the need for judgment are paramount. When combining IVPF for uncertainty modeling and MARCOS for ranking and evaluating the alternatives, the proposed methodology is superior for use in FRM in terms of efficiency and effectiveness.

1.1. Objectives

This research’s primary objective is to assess ten different investment options based on seven essential factors, with the implementation of views of various decision-makers for the analysis. Recognizing the strengths of the IVPF-MARCOS approach, this research advances our understanding of FRM and offers practitioners the framework to make their investments more resilient to uncertainties.
The following are the secondary objectives of this study.
(a)
To involve multiple decision-makers and make financial decisions more secure.
(b)
To enhance the capability of decision-makers under uncertainty through detecting and managing the impacts of fuzzy information in FRM.
(c)
To enhance advanced fuzzy techniques in the process of financial decision-making.

1.2. Contributions

This study has the following contributions:
(a)
This research explores the use of IVPF information to improve the MARCOS application for evaluating MCGDM methods of FRM.
(b)
This study contributes an assessment framework that facilitates the structured analysis of financial issues for practice application.
(c)
The IVPF-MARCOS algorithm is an advanced instrument used in practice by financial decision-makers. It allows them to make choices that consider the uncertainty of financial data.
(d)
This work responds to a gap in the literature emphasizing that new forms of fuzzy techniques can be implemented in FRM and offers more research into new approaches to managing financial risks.

1.3. Research Gap and Motivations

While the interest and need for FRM are huge and ever-increasing, given the current economic instability, there are still many shortcomings in how methodologies are developed to address the issues and concerns that have become prominent in decision-making. The quantitative approaches applied to risk management often involve computational methods most suitable for deterministic environments and do not consider that the data involved exhibit a certain level of imprecision. Moreover, although various MCGDM methods are used when implementing FRM, most of these methodologies do not consider the issue of fuzzy information and, therefore, provide low-quality decisions. However, there is a gap in the literature regarding integrating IVPF information into MCGDM frameworks, which restricts the applicability and impact of risk management approaches in today’s world. Hence, developing efficient decision-making structures capable of handling uncertain data has become increasingly important. Still, at the same time, more systematically structured methods have arisen that evaluate these multiple competing factors in financial domains. This gap underlines the need for new approaches that could increase the effectiveness and relevance of FRM approaches and improve investment decisions’ efficiency.
The motivations for this study come from the inherent gap arising from the limitations of existing FRM methodologies. In the capacity of providing basic information on risks and returns, decision-makers need sharper tools that are capable of analyzing fuzzy markets. Therefore, while implementing the MARCOS algorithm within an IVPF context, the present investigation expects to devise a more efficient decision-making instrument to improve the evaluation and ranking of investment options. In addition, an extension of IVPF in MCGDM also solves the problem of vagueness that may exist in financial assessments. It facilitates a more comprehensive analysis of trade-offs in the management of FRM. This research will, therefore, aim to arm organizations with a strong framework of how they can best manage investment opportunities to ensure their increased readiness in the face of any uncertainty and, thus, increased financial stability. With this work, we would like to help enhance our knowledge about fuzzy decision-making techniques, especially in the context of the financial environment, and promote the development of the type of FRM used in the literature.

1.4. Structure of the Study

This paper is arranged to ensure that the proposed IVPF-MARCOS framework and its role in FRM are explained in detail. The literature review in Section 2 is a fitting starting point because it discusses earlier work in FRM and the MARCOS approach. In Section 3, preliminaries are introduced to the reader regarding the main mathematical concepts related to IV-PFS. In Section 4, the methodology is described in detail, showing the integration of IVPF information into the MARCOS algorithm and explaining step by step how the IVPF-MARCOS framework works to demonstrate its ability to deal with uncertainty in financial data. Section 5 illustrates a real-life application of the IVPF-MARCOS method, evaluating ten investment alternatives against seven criteria based on decision-maker evaluations; it further shows how this technique helps to make financial risk decisions. In 
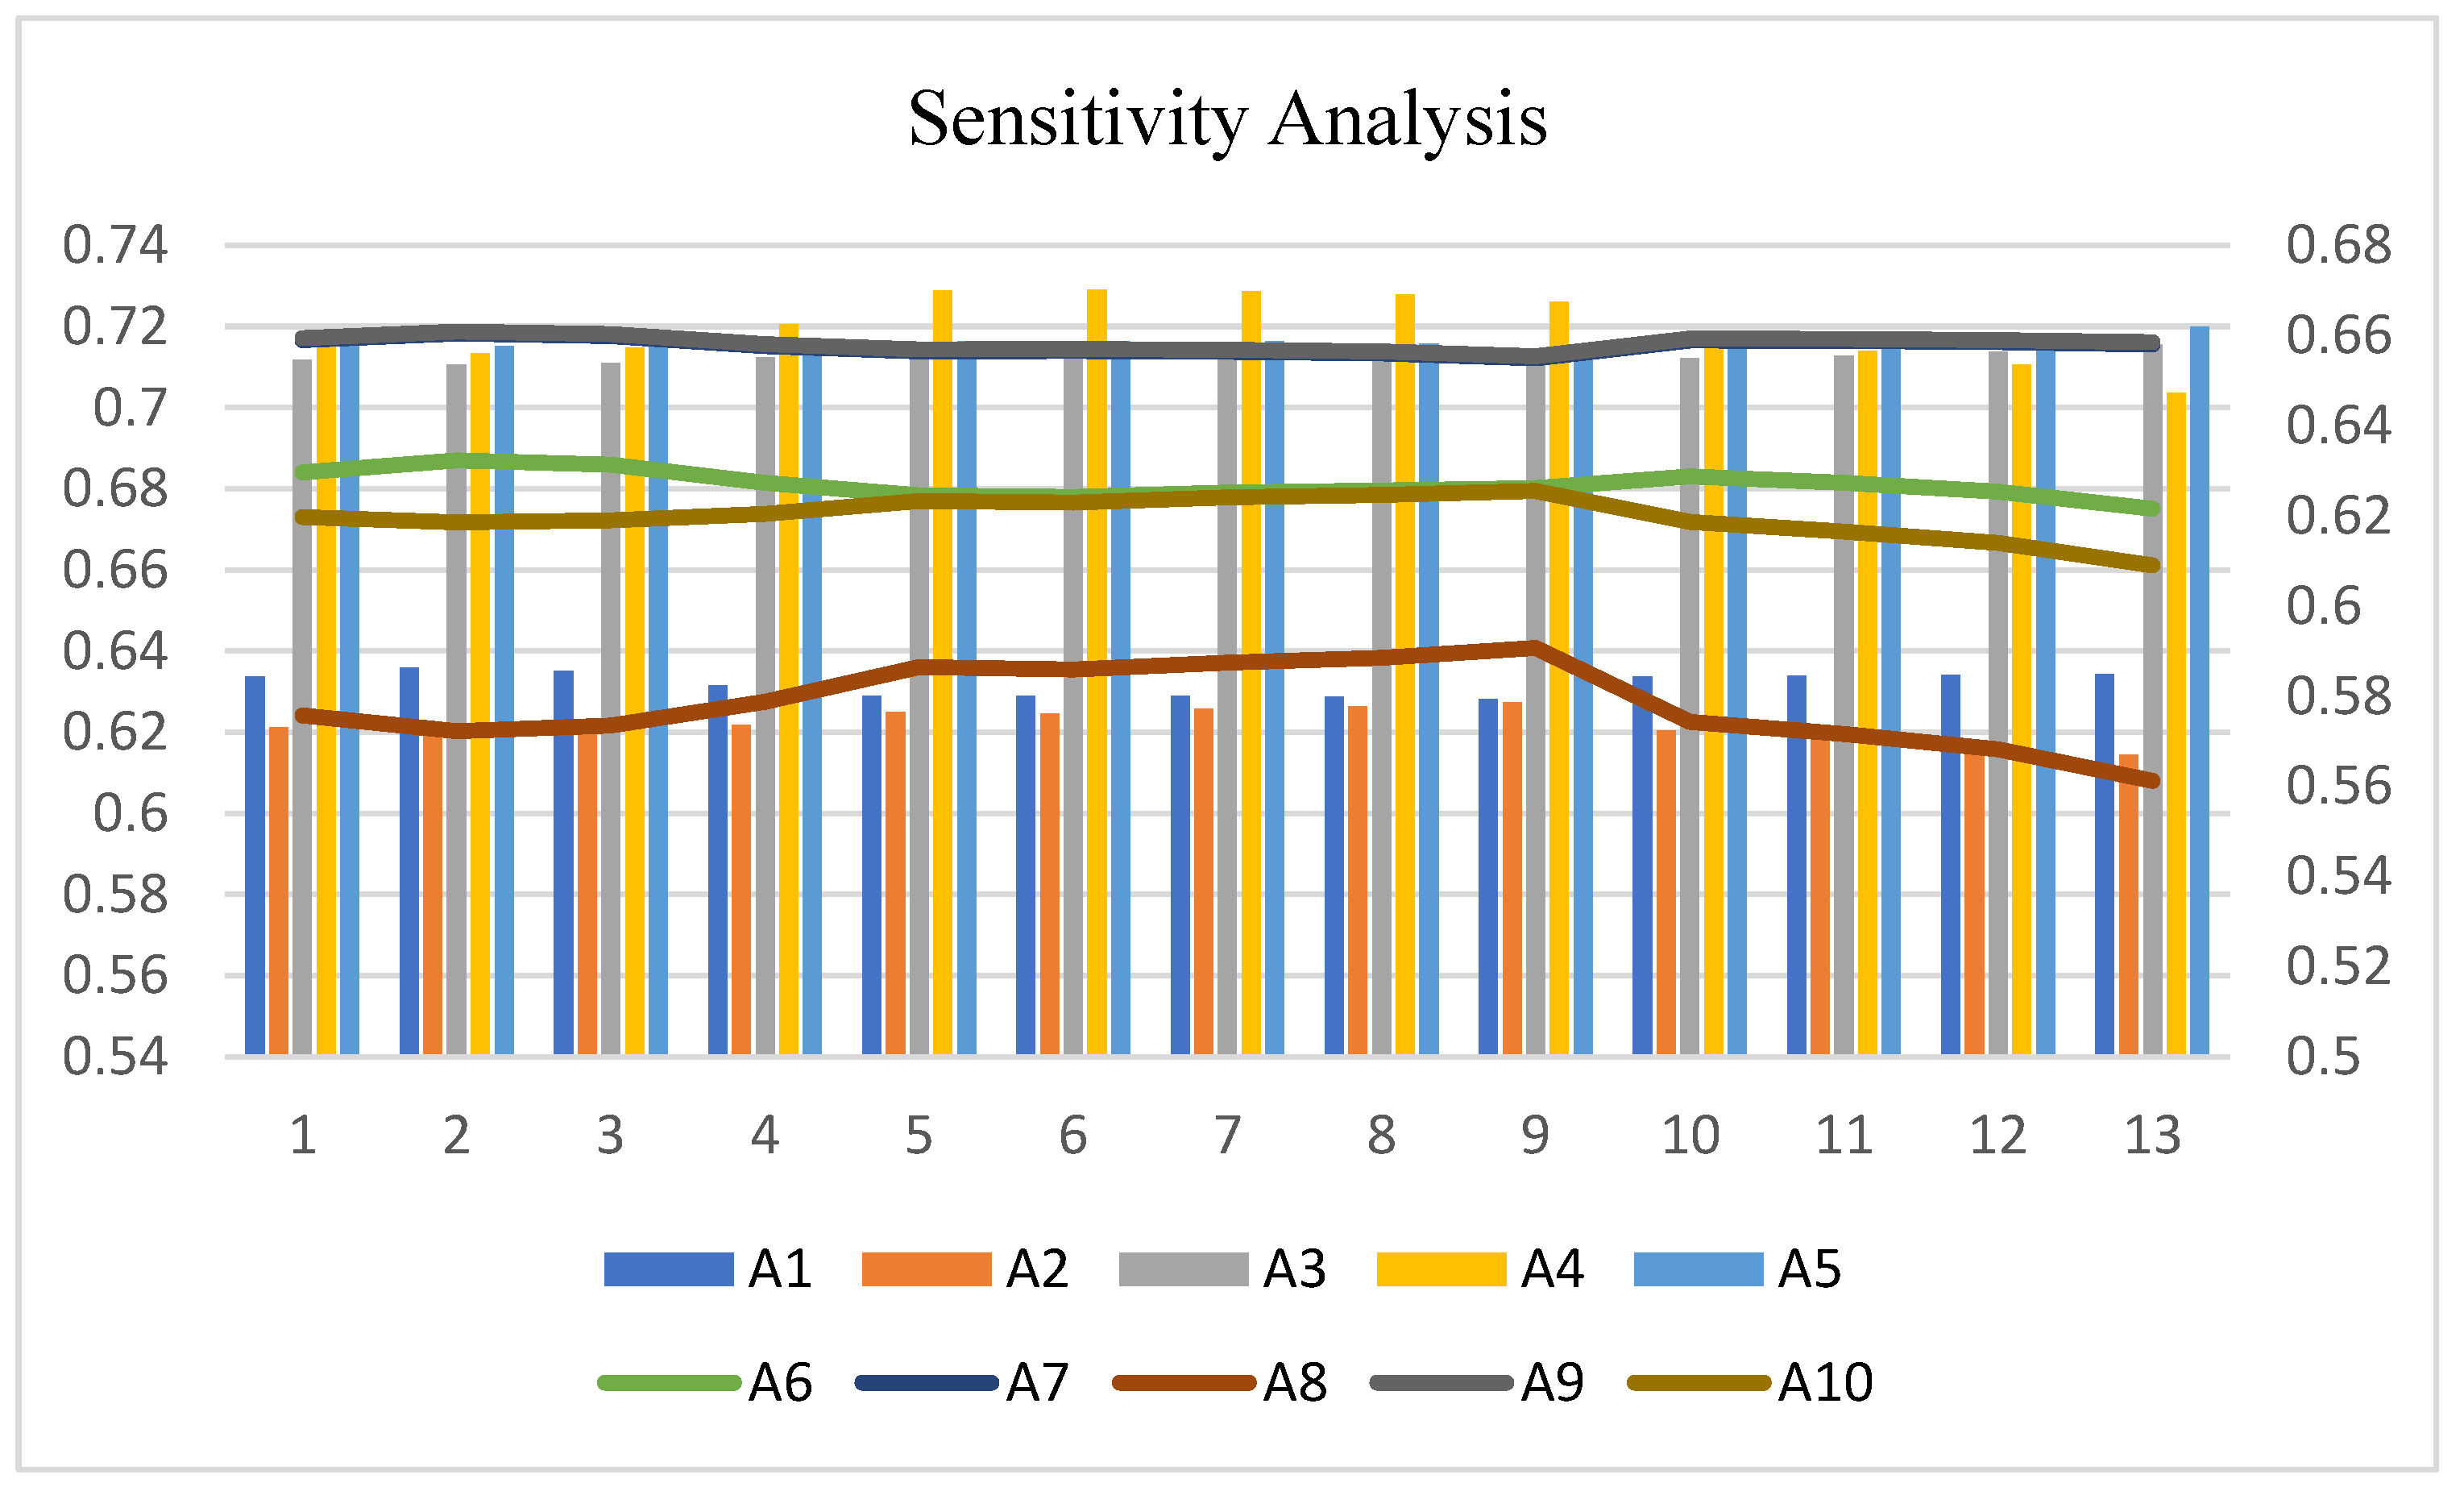
Section 6, sensitivity analysis is performed, and the research benefits are outlined. Lastly, Section 7 provides a brief conclusion to the present study in addition to the limitations encountered with real-time data integration and applications to broader areas of finance.

2. Literature Review

This section presents a comprehensive review of existing methodologies of FRM in MCGDM and MARCOS techniques in MCGDM.

2.1. Financial Risk Management (FRM) in MCGDM

FRM serves as part of the decision-making process under conditions of MCGDM in today’s sophisticated financial environment. Taking full advantage of MCGDM approaches involving symmetric aggregation operators, including fuzzy logic, EDAS, and TODIM, makes it easier for organizations to review and manage financial risks by following a systematic multiple-criterion perspective. These techniques help when dealing with the uncertainties that are characteristic of financial data, making these techniques especially useful for areas like credit risk assessment and supply chain finance, where data vagueness and variability are relatively high [9,10,11]. The BWM-CRITIC and interval type-2 fuzzy CPT-TODIM MCGDM models significantly improve FRM. As an example, BWM-CRITIC is preferred in supply chain finance to evaluate risk factors such as the speed of logistics, the degree of market fluctuation, and the credibility of suppliers while offering an integrated picture of sustainable financial health [12]. On the other hand, interval type-2 fuzzy CPT-TODIM has an enhanced credit risk evaluation capability by managing uncertainties in credit scores, especially during unpredictable market situations [13]. In infrastructural research areas, specifically in FRM, MCGDM approaches are described as vital as they bring risk factors into analysis by utilizing experts’ input, which, in turn, improves the aspect of prevention [14]. In addition, there has been an extension in the use of social media data in MCGDM-based FRM frameworks to provide real-time market sentiments. That is, along with historical data, organizations can use social media sentiment analysis to obtain a more active evaluation of financial risks, including potential public sentiments that can affect the assessment of financial assets [15,16]. In banking, government sectors, and many organizations, MCGDM models have been core to FRM, where organizations can make sustainable risk management decisions based on data gathered from the real-world environment [17,18,19,20].

2.2. MARCOS Technique in MCGDM

Contemporary MCDM methods such as ESP-COMET and SESP-SPOTIS enhance the ranking and preference accumulation processes but can be problematic regarding variance present in financial information. Other methods, including TOPSIS, VIKOR, WASPAS, and AHP, are equally inadequate for stochastic complexities. These methods rely on the aggregation of information satisfying the properties of idempotency, symmetry, boundedness, and monotonicity. When combined with IVPF data, MARCOS offers a robust solution by capturing uncertainty and increasing the precision of decisions, thus making it suitable for application in FRM. The MARCOS technique is ideal for MCGDM frameworks in ranking and selecting alternatives, utilizing fuzzy, probabilistic, and intuitive decision-making for different applications. It also has flexibility in multi-attribute decision-making when used with complicated decision situations, including robot choice and waste disposal, through computational extensions of fuzzy measures and entropy measures coupled with MCGDM, as seen [21,22,23]. It has been successfully implemented in healthcare for MRI device selection and for selecting coating material in tooling industries where BWM (Best Worst Method) and hybrid fuzzy techniques have improved accurate decision-making results [24,25]. Additional applications for technology selection for sustainability and IoT risk priority demonstrate the versatility of this approach in dealing with qualitative and quantitative decision factors [26,27]. The effectiveness of the MARCOS technique is further substantiated in hydrogen fuel assessments and supplier decision-making processes, which demonstrate the strength of integrating triangular and q-ROFS methods [28,29,30].

3. Preliminaries

Zadeh [3] proposed the concept of FS, a mathematical framework for dealing with uncertainty. However, it is effective on an MD under ambiguous conditions but ineffective on an NMD or any ambiguity in ambiguous circumstances. To address these constraints, Atanassov [4] presented a new method called IFS. Cuong [7] created the PFS to address more complex scenarios involving abstinence and indeterminacy. PFS includes MD, NMD, AD, and refusal degree (RD) to meet FS’s aims.
Definition 1
[7]. Consider a fixed universe  U ;  then, a PFS is defined by  F = x , m ( x , p x , n x : x X } ,  where  m ( x ) [ 0 , 1 ]  represents MD,  p ( x ) [ 0 , 1 ]  represents AD, and  n ( x ) [ 0 , 1 ]  represents NMD.
These degrees satisfy the following conditions:
0 m ( x ) + p ( x ) + n ( x ) 1
Additionally, the RD for each PFS  F  is defined as follows:
π ( x ) = 1 m ( x ) p ( x ) n ( x ) .
Definition 2
[8]. Consider a fixed universe  U ; then, an IV-PFS is defined by the following:
F = x , m L x , m U x , p L x , p U x , n L x , n U x : x X .
where  [ m L ( x ) , m U ( x ) ] , [ p L ( x ) , p U ( x ) ]  and  [ n L ( x ) , n U ( x ) ]  express the MD, AD, and NMD with a rule:
0 m U ( x ) + p U ( x ) + n U ( x ) 1 .
Additionally, the RD for each IV-PFS  F  is defined as follows:
π x = 1 m L x , m U x p L x , p U x [ n L x , n U x ] .
Also, the pair  F = [ m L ( x ) , m U ( x ) ] , [ p L ( x ) , p U ( x ) ] , [ n L ( x ) , n U ( x ) ]  expresses an interval-valued picture fuzzy value (IVPFV).
Definition 3
[8]. For any IVPFV  F = m L x , m U x , p L x , p U x , n L x , n U x , the score function is elaborated through the following:
S c ( F ) = m L x + m U x p L x p U ( x ) n L ( x ) n U ( x ) 3
Definition 4
[8]. Let  F i = m i L x , m i U x , p i L x , p i U x , n i L x , n i U x  and  F j = m j L x , m j U x , p j L x , p j U x , n j L x , n j U x  be two IVPFVs and  λ > 0 ,  λ  be any scalar number; then, the following operations can be satisfied:
F i F j = m i L x , m i U x + m j L x , m j U x m i L x , m i U x . m j L x , m j U x , p i L x , p i U x . p j L x , p j U x , n i L x , n i U x . n j L x , n j U x
F i F j = m i L x , m i U x . m j L x , m j U x , p i L x , p i U x + p j L x , p j U x p i L x , p i U x . p j L x , p j U x , n i L x , n i U x + n j L x , n j U x n i L x , n i U x . n j L x , n j U x
λ . F i = 1 1 m i L x , m i U x λ , p i L x , p i U x λ , n i L x , n i U x λ
F i λ = m i L x , m i U x λ , 1 1 ( p i L x , p i U x ) λ , 1 1 ( n i L x , n i U x ) λ
F i c = n i L x , n i U x , p i L x , p i U x , m i L x , m i U x

4. Interval-Valued Picture Fuzzy-MARCOS Technique

In this study, we used the IVPF method and the interval-valued picture fuzzy weighted averaging (IVPFWA) operator to compute the weights for each criterion using the MCGDM methodology. In addition, linguistic parameters were converted into IVPFVs for further analysis. The MARCOS approach is based on ranking and measuring choices to obtain a compromise answer. Although the MARCOS approach can be an effective decision-making tool, it cannot express confusing or uncertain facts. As a result, providing a fuzzy extension to the approach is critical to increasing its capability. The IVPF-MARCOS technique is described as follows:
(a)
  =   { 1 , 2 , , f } , denotes the collection of users with weights represented by ω = [ ω 1 , ω 2 , , ω f ] and = 1 f ω = 1 .
ω L , ω U = m L + p L . m L m L + n L k = 1 l m L + p L . m L m L + n L , m U + p U . ( m U m U + n U ) k = 1 l m U + p U . ( m U m U + n U ) .
(b)
There are C q criteria, and each weight is C = [ C 1 , C 2 , , C r ]
q = 1 r C q = 1 , ( q = 1 , 2 , , r )
Step 1.
Experts evaluate criteria.
Table 1 shows the linguistic assessments for the users and the criteria.
Step 2.
Generate an aggregated IVPF decision matrix.
The IVPF decision matrix for a given collection of users is D = q n f (   =   1 , 2 , , f ; q = 1 , 2 , , r ) . q e signifies the evaluation of d t h about users with the j t h criteria. q is an IVPFV.
The aggregated IVPF decision matrix is represented as follows:
q = I V P F W A C q 1 , q 2 , , q = 1 = 1 f 1 m q ω L , 1 = 1 f 1 m q ω U , = 1 f p q k ω L , = 1 f p q k ω U , = 1 f n q k ω L , = 1 f n q k ω U .
where ˆ q = m ˆ q L , m ˆ q U , p ˆ q L , p ˆ q U , n ˆ q L , n ˆ q U .
Table 2 is used to conduct linguistic assessments of the alternatives.
Step 3.
Determine the best solutions for IVPF.
τ + = 1 , 1 , 0 , 0 , 0 , 0 and τ = 0 , 0 , 0 , 0 , 1 , 1 are the best solutions for the IVPF-positive ideal solution (IVPFPIS) and IVPF-negative ideal solution (IVPFNIS), respectively. The results stated do not differ considerably from one another, even though the maximum operator and minimum operator define IVPFNIS and IVPFPIS.
Step 4.
Calculate the distance measurement.
The distance measure is calculated using a fuzzy normalized Euclidean distance equation. The positive and negative distance measures in the following equations are determined using q + and q , respectively.
q + L , q + U = m ˆ q L τ + 2 + p ˆ q L τ + 2 + n ˆ q L τ + 2 , m ˆ m U τ + 2 + p ˆ q U τ + 2 + n ˆ q U τ + 2 .
q L , q U = m ˆ q L τ 2 + p ˆ q L τ 2 + n ˆ q L τ 2 , m ˆ q U τ 2 + p ˆ q U τ 2 + n ˆ q U τ 2 .
Step 5.
Determine the closeness coefficients’ (CCs’) values.
C C q denotes the CCs of the q t h criterion, and it employs IVPFPIS q + and IVPFNIS q as shown below.
C C q = q L + q U q L + q U + q + L + q + U .
Step 6.
Calculate the weights of each criterion and alternative.
The CC values show the relative importance of each criterion. The concluded weights are supposed to be calculated using normalization, and the weights’ sum should equal one. A decision matrix, D , remains after steps 5 and 6.
C ˘ 1 C ˘ 2 C ˘ n ] D ˘ = u ˘ 11 u ˘ 12 u ˘ 1 r u ˘ 21 u ˘ 22 u ˘ 2 r u ˘ q 1 u ˘ q 2 u ˘ q n
Step 7.
For IVPF, construct an expanded decision matrix.
By identifying the anti-ideal AI and ideal I solutions, an expanded decision matrix E ˘ could be generated.
C ˘ 1 C ˘ 2 C ˘ n ] E ˘ = A 1 ˘ A ˘ 2 A q ˘ A I I u ˘ 11 u ˘ 12 u ˘ 1 r u ˘ 21 u ˘ 22 u ˘ 2 r u ˘ q 1 u ˘ q 2 u ˘ q r u ˘ a i 1 u ˘ a i 2 u ˘ a i r u ˘ i d 1 u ˘ i d 2 u ˘ i d r
In this case, I performed the best, and AI performed the worst. Using Equations (7) and (8), respectively, they can be determined.
A I = m i n i u ˘ i j ,   if   j B   and   m a x i u ˘ i j ,   if   j C .
I = m a x i u ~ i j ,   if   j B   and   m i n i u ˘ i j ,   if   j C .
It is evident that B is made up of criteria of the benefit type, whereas C is made up of criteria of the cost type.
Step 8.
Construct the normalized IVPF decision matrix.
The procedure for determining the alternatives’ normalized value, ξ ˘ i j , is as follows.
ξ ˘ i j = u ˘ a i j u ^ i d j , j B u ˘ i d j u ^ a i j , j C .
Step 9.
Construct the IVPF weighted decision matrix.
The weighted values for all options are calculated as follows.
C ˘ i j = ξ ˘ i j ˘ j .
C ˘ j in Equation (10) denotes the j t h criterion’s relative relevance.
Step 10.
Construct the matrix S ˘ i .
The values of the S ˘ i matrix are gained by applying Equation (11).
S ˘ i = i = 1 n C i j .
Step 11.
Determine the various degrees of utility of the options. Equations (12) and (13), when applied to alternatives, find the utility degrees of each alternative.
i = S ˘ i S ˘ a i .
˘ i + = S ˘ i S ˘ i d .
Step 12.
Determine the alternatives’ utility function.
By using Equation (14), the utility functions of alternatives can be calculated.
f i = ˘ i + + ˘ i 1 + 1 f ˘ i + f ˘ i + + 1 f ˘ i f ˘ i .
In Equation (14), f (   ˘ i + ) represents the utility function of the ideal solution, whereas f (   ˘ i ) represents the utility function of the anti-ideal solution. Equations (15) and (16) were used to determine f (   ˘ i + ) and f (   ˘ i ) .
f ˘ i + = ˘ i ˘ i + ˘ i + .
f ˘ i = ˘ i + ˘ i + ˘ i + .
Step 13.
Rank the alternatives.
In the final stage, alternatives are ranked using the final values of the utility functions. Stated differently, the most preferred alternative is the one with the highest utility value.

4.1. Assessment of Financial Risk Management

FRM recognizes, evaluates, and controls the risks affecting organizations investing and operating in the financial markets and making business decisions. It encompasses the methods applied in an organization to reduce the adverse effects of market, credit, liquidity, and operational risks. These risks come from numerous areas, including exchange rates, interest rates, stock prices, the credit risk of the borrowers, and operational risks. Specifically, emphasizing how financial risk managers measure risks, several techniques are applied, such as statistical analysis, stress tests, economic scenarios, and the application of such instruments as options and futures. The aim is to try to maintain stability for the long term, especially for banking institutions, investment houses, and companies engaged in significant funds transactions.
MCGDM methods are essential because incorporating numerous factors when addressing risk management in FRM is a tremendous advantage. Financial risks have traditionally contained dimensions where more than one criterion, which may sometimes be opposed, forms the basis of decision-making, such as profitability, liquidity, market exposure, or legal requirements. MCGDM assists financial managers in striking the above-competing aims and selecting the best course of action based on several criteria. To summarize, the application of MCGDM to FRM adheres to organized decision-making because it proposes how criteria could be gauged, how trades-offs among them might be evaluated, and how suitable options under conditions of uncertainty can be identified. More precisely, the MARCOS method allows for the ranking and identification of the most preferable FRM strategy. Thus, extending to an IVPF environment, MARCOS can adopt more uncertainty and ambiguity in decision-making as the IVPF can offer a more liberal expression of fuzzy data. This is particularly true where actual data may be imprecise or decision-maker assessments more subjective.
The problem consists of applying the IVPF-MARCOS method to address a Financial Risk Management decision regarding ten investment options assessed by seven criteria and considering the opinions of five decision-makers. Each alternative may be an investment or a financing plan, and each criterion defines a different dimension of financial risk. In the context of FRM, the decision-makers are either experts or those who want to take financial risks from another angle. They offer opinions on how well each of the alternatives progresses in the seven criteria in the RFM model. Most may be from another department or functional position within the financial institution or the organization.
(a)
D 1 : Risk Management Officer;
(b)
D 2 : Investment Analyst;
(c)
D 3 : Compliance Officer;
(d)
D 4 : Financial Controller;
(e)
D 5 : External Financial Consultant.

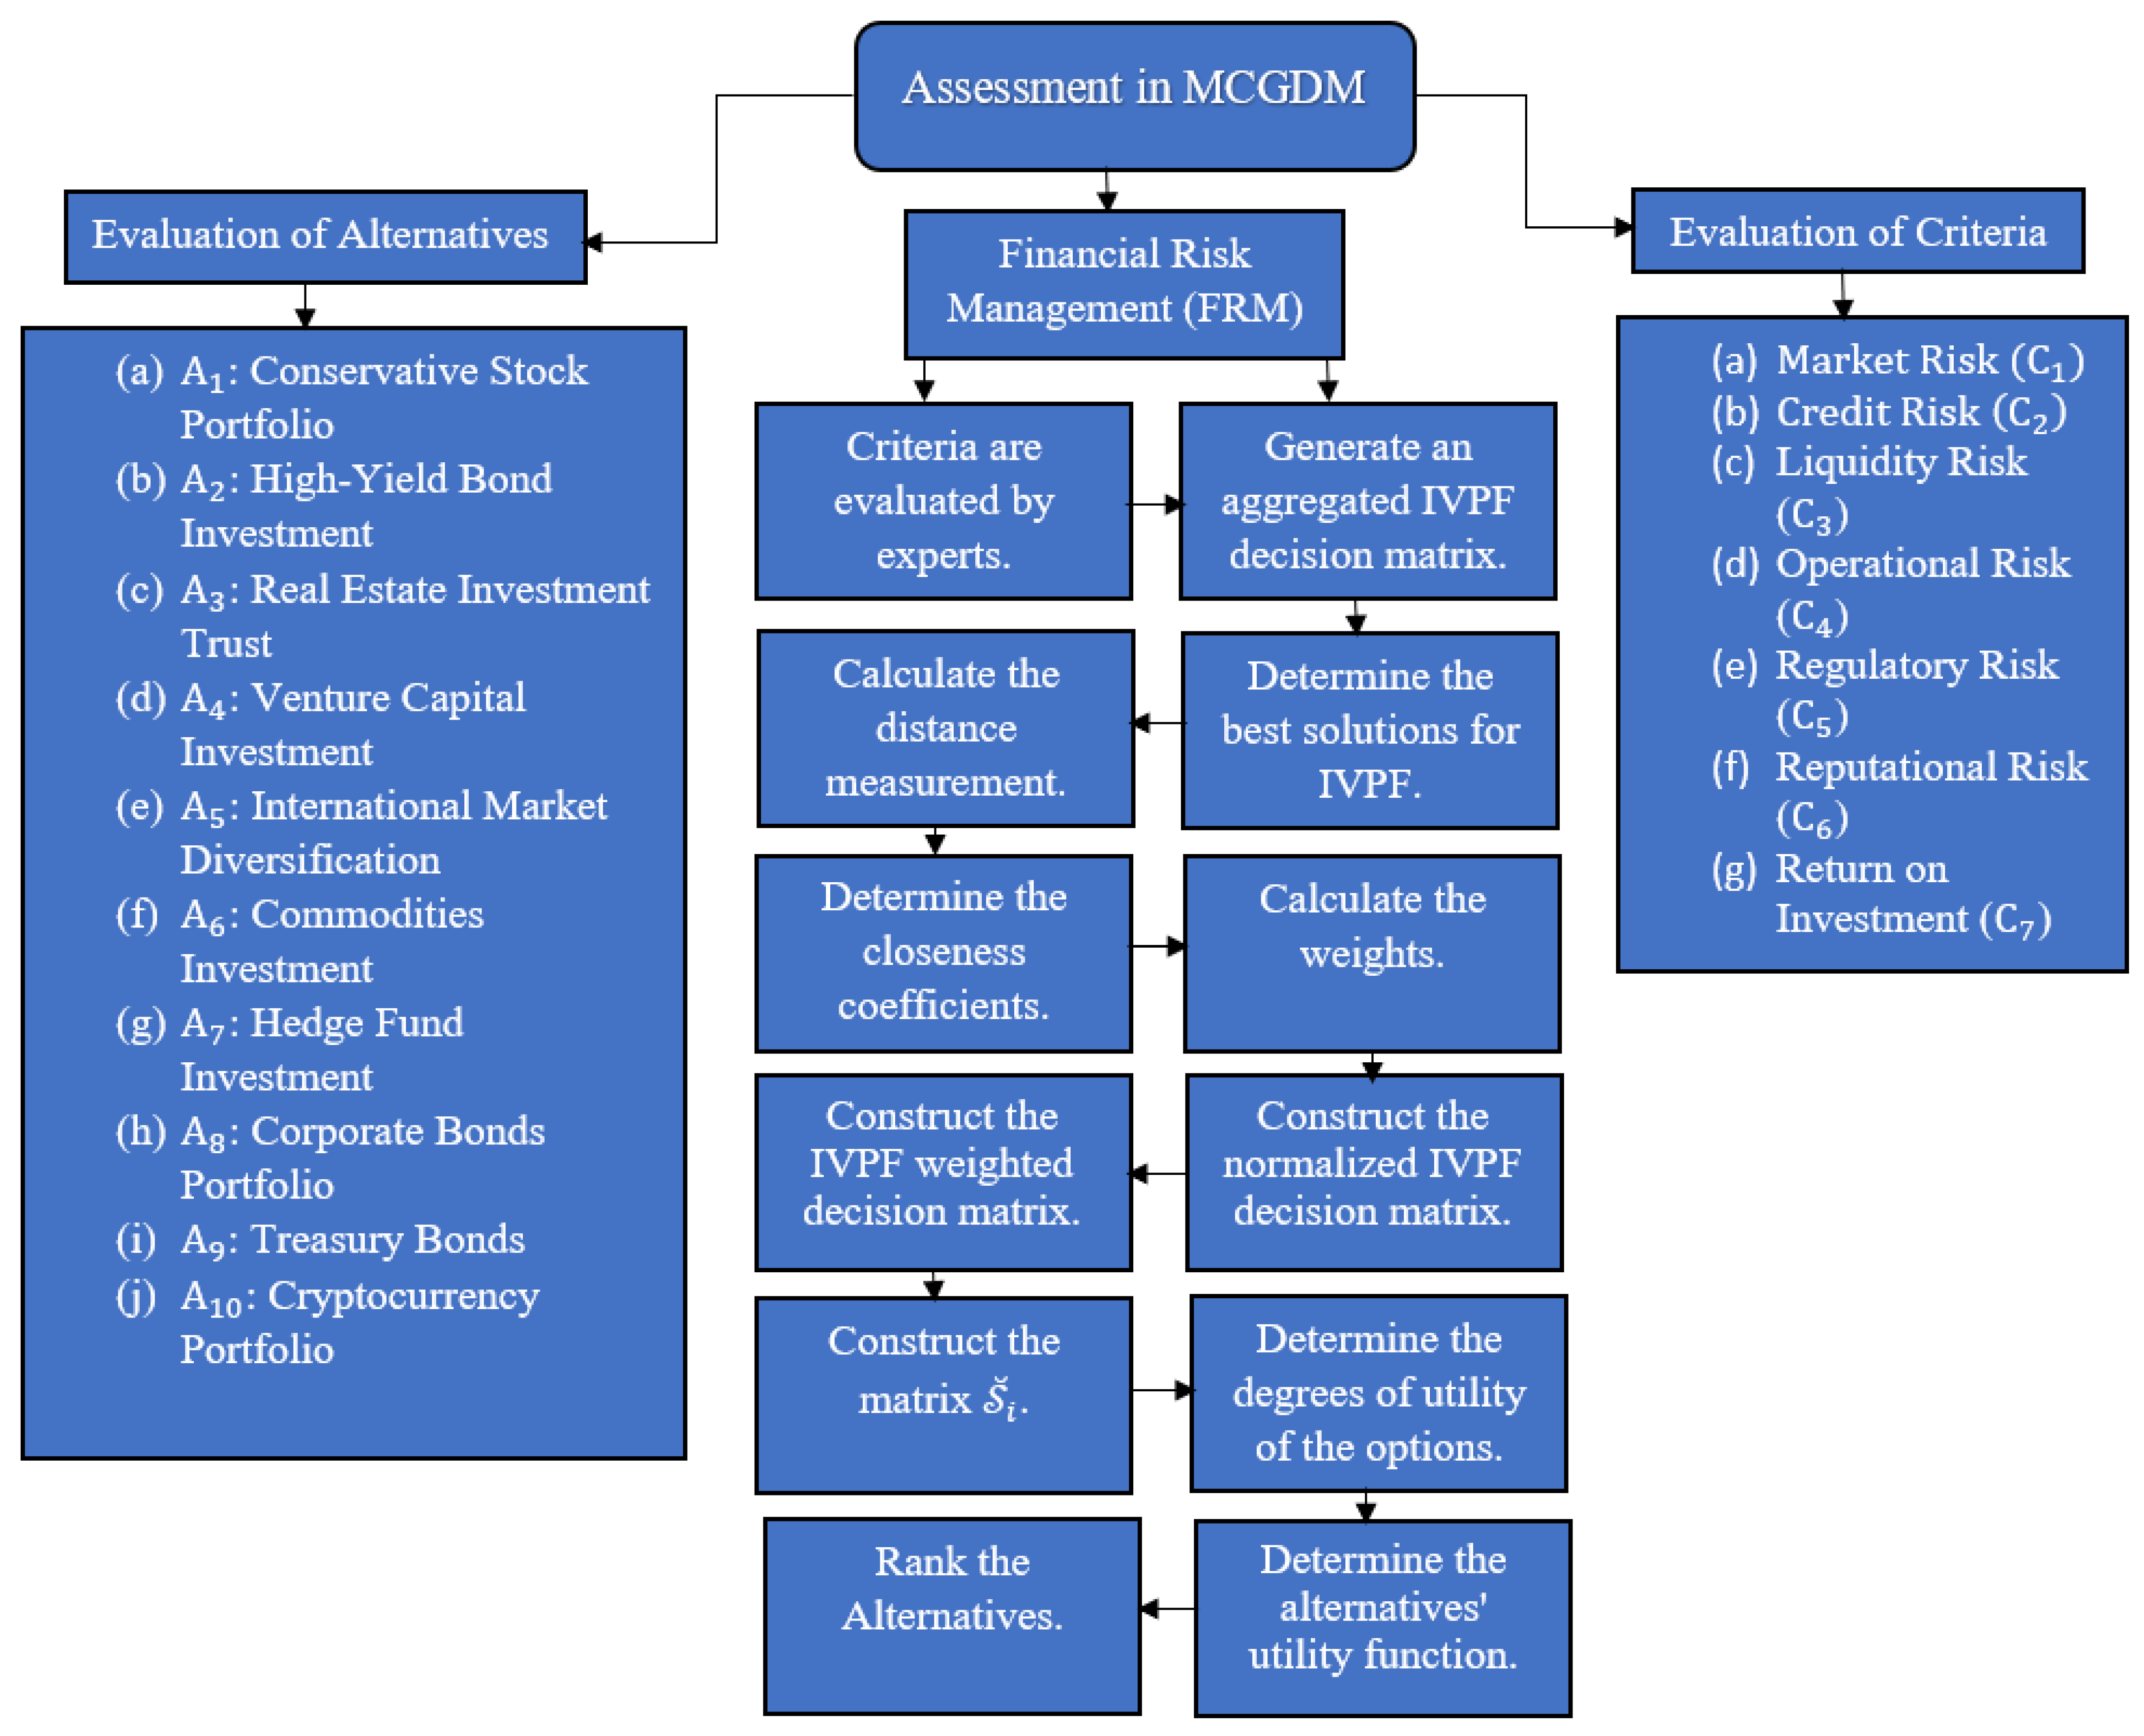
4.1.1. Evaluation of Criteria

(a)
Market Risk ( C 1 ) : Short-term risks include the possibility of losses being realized due to variations in factors such as stock prices and exchange rates.
(b)
Credit Risk ( C 2 ): Risks include the failure of debtors or counterparties to pay the amount back in full on due dates.
(c)
Liquidity Risk ( C 3 ): There is credit risk or inability to meet short-term liabilities.
(d)
Operational Risk ( C 4 ): Internal variations risk association with corrupted internal activities or programs (for instance, threats to cyber security).
(e)
Legal/Regulatory Risk ( C 5 ): There are possible penalties for law violations or other kinds of losses.
(f)
Reputational Risk ( C 6 ): A counter risk may include damage to the company’s brand or reputation.
(g)
Return on Investment ( C 7 ): Projected returns on intended stocks are significant for the best alternative investment.
These seven criteria have been chosen because they all cover the different aspects of FRM. They include some fundamental factors of risk and return, which are quantitative and qualitative, and form the basis for analyzing investment opportunities. These criteria have been derived from a literature survey and consultation with financial management experts, making them realistic and suitable for application in real-life financial decision-making situations.

4.1.2. Evaluation of Alternatives

As stated in the FRM note, each alternative is a possible business or investment solution that can be implemented or made in an organization. The alternatives should be varied and consist of concepts of probable approaches to financial management regarding risk.
(a)
A 1 : Conservative Stock Portfolio;
(b)
A 2 : High-Yield Bond Investment;
(c)
A 3 : Real Estate Investment Trust;
(d)
A 4 : Venture Capital Investment;
(e)
A 5 : International Market Diversification (IMD);
(f)
A 6 : Commodities Investment;
(g)
A 7 : Hedge Fund Investment;
(h)
A 8 : Corporate Bonds Portfolio;
(i)
A 9 : Government Securities, also known as Treasury Bonds;
(j)
A 10 : Cryptocurrency Portfolio.
These alternatives are selected to represent as many possible scenarios concerning financial investments as possible and, thus, check the proposed methodology’s efficiency in the most practical cases possible. Their risks and returns are different, which allows for a comparison of how the FRM algorithm is efficient. The diversity helps enhance the generalization of the results, thus proving the efficiency of the methodological approach to actual financial decision-making dilemmas. These ten alternatives used in the study ensure good coverage while at the same time ensuring that the findings can be practically applied. A detailed flowchart of the above-discussed methodology is given in Figure 1.
The alternatives are ranked using the MARCOS approach. This method determines each platform’s utility by contrasting it with both ideal (best) and anti-ideal (worst) options. The IVPF-MARCOS method’s ability to incorporate decision-maker hesitancies and various levels of confidence by including the IVPFVs can result in a more accurate and consensus-based option. In constructing the decision matrix in this research, five decision-makers, the Risk Management Officer, Investment Analyst, Compliance Officer, Financial Controller, and External Financial Consultant, assessed each criterion’s relevance and ranked the alternatives. Predefined linguistic expressions representing evaluations included criteria qualities such as “Very Important”, “Important”, and “Medium” and qualities of other options such as “Extremely Good”, “Very Good”, and “Very Bad”. These linguistic terms were then translated into IVPFVs, as highlighted in Table 1 and Table 2. For instance, a decision-maker may assign an IVPF value to a particular criterion as “Very Important” with an IVPF interval ( [ 0.80 , 0.85 ] ,   [ 0.04 , 0.06 ] ,   [ 0.06 , 0.09 ] ) . This ensures that a proven expert’s opinion is understandable and can be replicated; the values capture the necessary vagueness of decision-making. Incorporating these values enables the capturing of expert judgment so that effective decision-making can be enhanced.
Steps 1 and 2: Decision-makers evaluate the ten alternatives using the seven criteria and the rating scales in Table 2 after completing linguistic assessments of the seven criteria using the rating scales in Table 1. The linguistic assessments of the criteria and alternatives are provided in Table 3 and Table 4.
Step 3: The committee determines the decision-maker’s ratings using Table 3. Next, each decision-maker’s weight is extracted. Their weights are shown in Table 5.
Step 4: Table 6 displays the aggregated IVPF decision matrix.
Step 5: The results of calculating the IVPF weights, q + and q for each criterion are shown in Table 7.
Step 6: The variables m ,   p , and n are determined in the next step using Table 4, just like in Step 4. Table A1 presents these values. Second, Table A1 is used to generate Table A2.
Step 7: Using the CC values from Table A2, we construct an extended decision matrix, as shown in Table A3.
Step 8: Each criterion’s normalized values are computed. The normalized IVPF decision matrix is shown in Table A4. Table A5 shows the weighted normalized IVPF decision matrix.
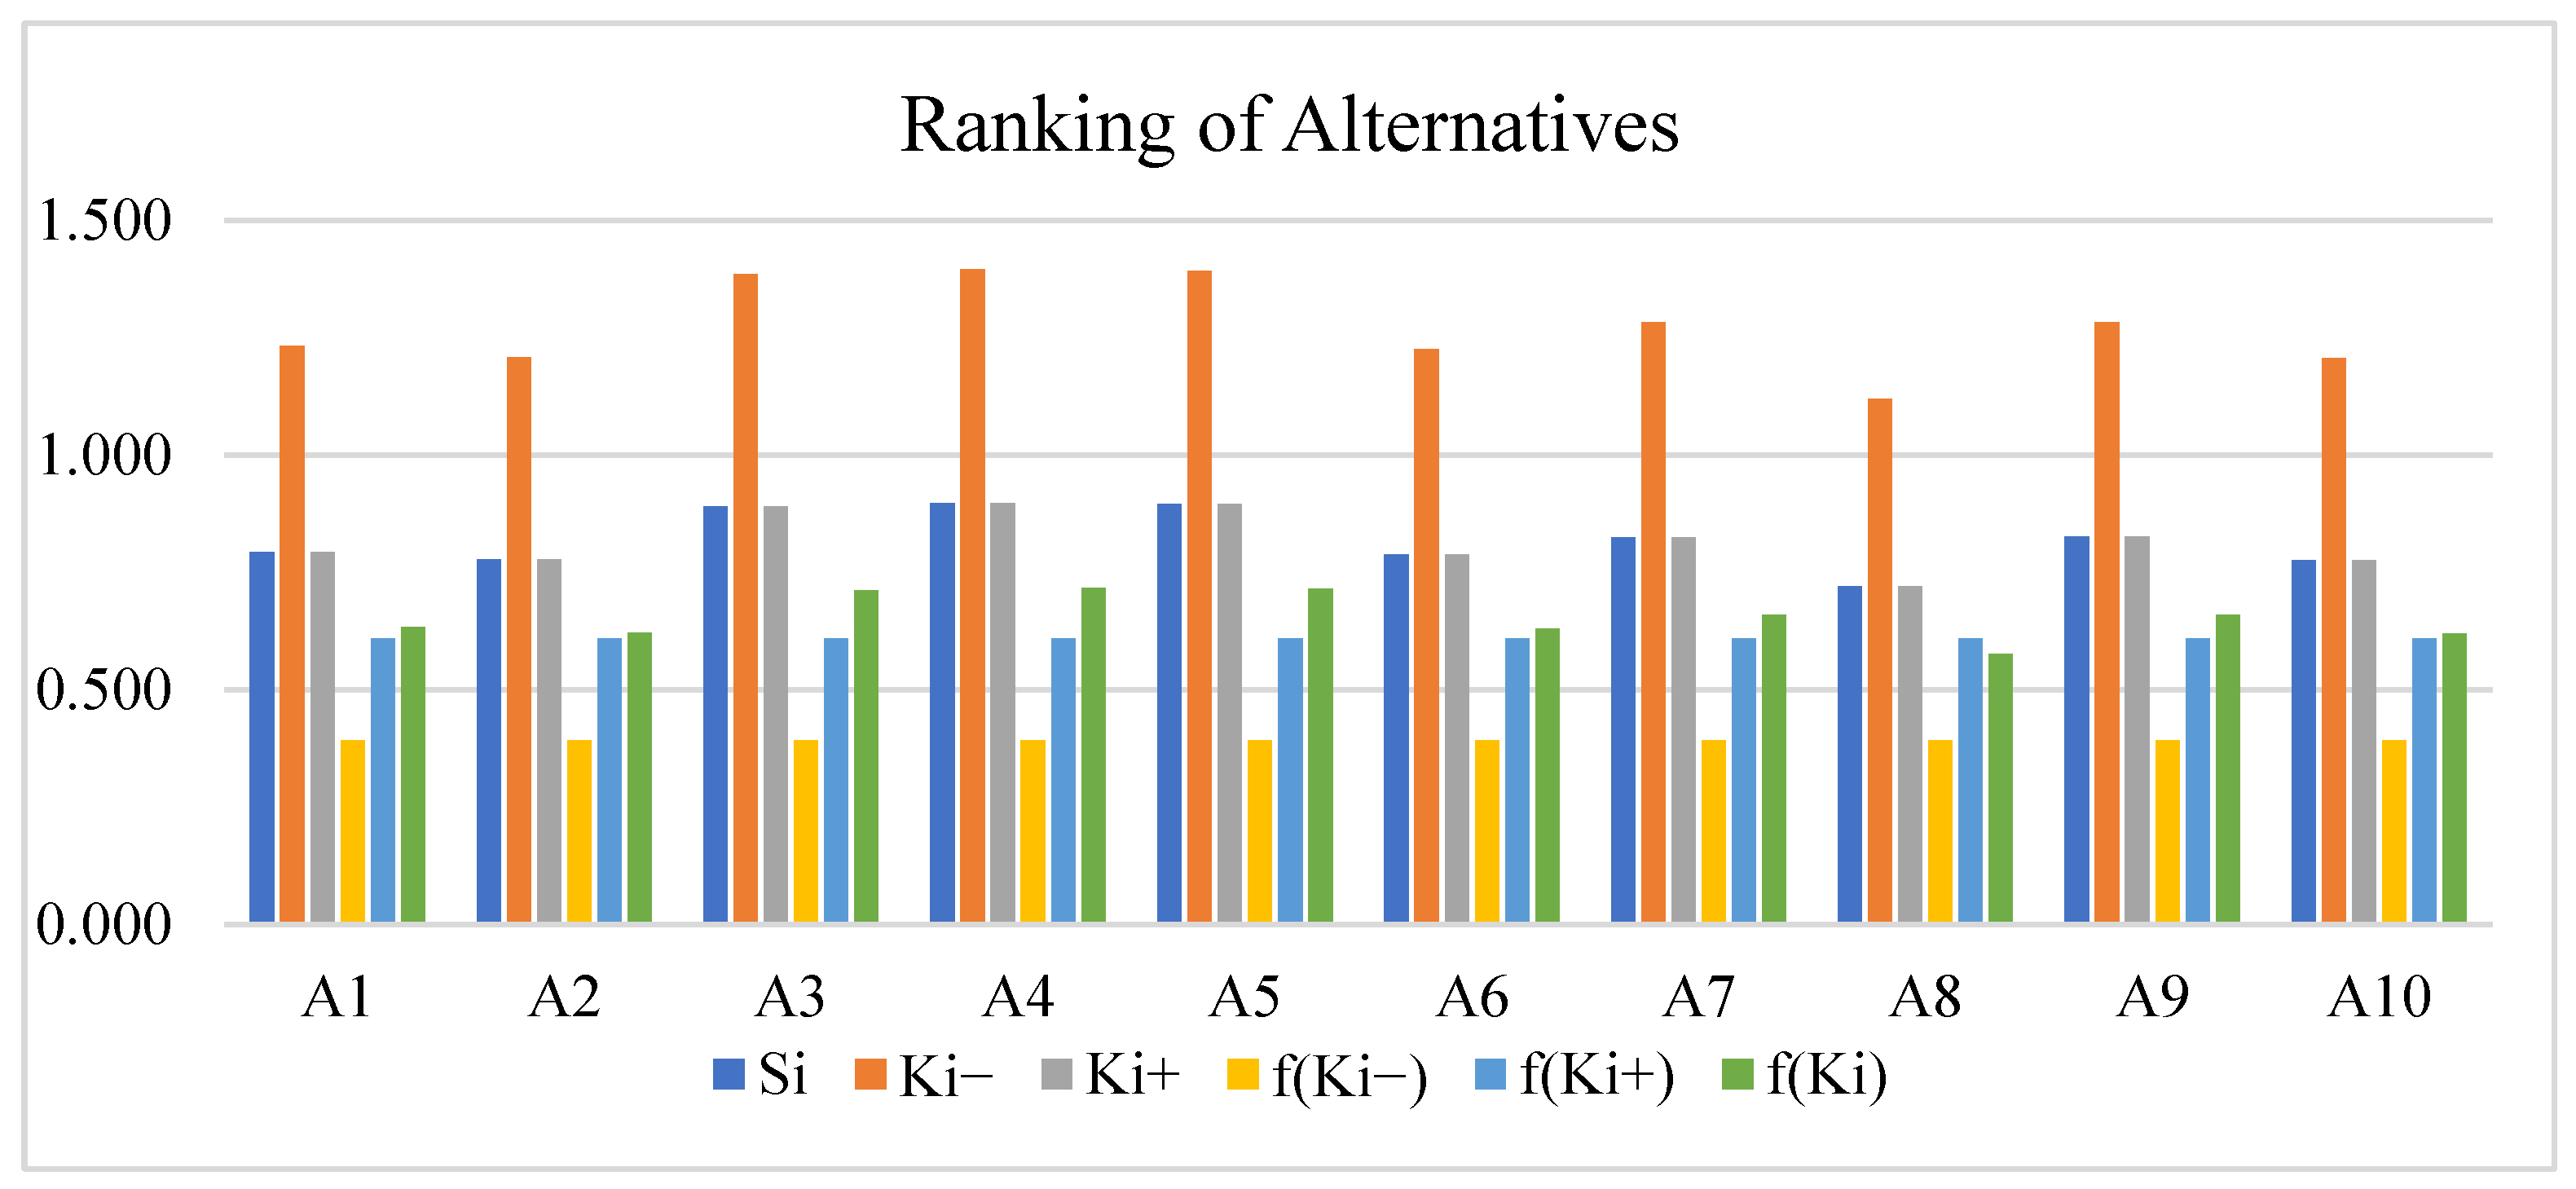
Step 9: Applying Equations (11)–(16), we obtain Table 8.
Figure 2 shows the graphical representation of the ranking of alternatives.

5. Result Discussion

The financial risk assessment further shows that A 4 and A 5 are the most advantageous for venture capital investment due to their high growth factor but low risk. Real estate investment trusts ( A 3 ) are also on the favorable side, giving stability with moderate gains. ( A 9 ) Government securities and ( A 8 ) corporate bonds are ranked slightly down due to their attractive risk–reward profile, essentially benefiting the conservatives. Nevertheless, high-risk, low-return investments, like cryptocurrency ( A 10 ) , and commodities ( A 6 ) , are placed at the bottom of the pyramid since they tend to be relatively unstable compared to more reliable investment forms. Thus, the presented rankings reflect the expanse regarding risk–return constraints, which may suit conservative and large risk-taker investors. The proposed IVPF-MARCOS methodology is further demonstrated to be strong conceptually by the ability to accommodate various investment alternatives and possibilities, as well as the required criteria under conditions of risk and fuzziness. Using the IVPF framework, the methodology can minimize hesitation and incomplete information, which could be a problem in managing financial risk. Furthermore, the repetitions in ranking and evaluating the alternatives over a broad range of scenarios prove the reliability of the framework. The current study does not compare the framework on large datasets to see how it performs in different decision-making scenarios. Still, the results imply that the framework could be extended to accommodate the differences. This robustness, in turn, is underpinned by the diverse investment options and criteria captured by this model, making it well-suited for various financial environments where investments might exist.

6. Comparison Analysis

Table 9 compares the IVPF-MARCOS methodology and other modern decision-making methodologies such as ESP-COMET [31], SESP-SPOTIS [32], TOPSIS [33], VIKOR [12], WASPAS [34], and AHP [35]. When comparing these methods, the criteria considered are the management of uncertainty, computational cost, the flexibility of the methods, and their applicability in FRM. The IVPF-MARCOS approach is identified because of its data conversion, where IVPF data are well handled and given the flexibility of capturing uncertainties and impreciseness in financial decision-making. For compromise solutions, the framework also helps maintain stability and objectivity while dealing with MCGDM. Both ESP-COMET and SESP-SPOTIS offer more contemporary approaches; however, they do not incorporate uncertainty and decision-maker preferences to the level that makes IVPF-MARCOS possible. This comparison further supports the choice of IVPF-MARCOS for this research as it affirms that this method is more appropriate and efficient than traditional and other FRM approaches.

6.1. Sensitivity Analysis

This sensitivity analysis was performed to study the effects of variation in linguistic terms on the weights affecting the decision-makers and, consequently, on the ranking of alternatives. As for the position of each alternative, Figure 3 illustrates how changing the values of the linguistic terms influences the ranking. The results also reveal that while some alternatives have a relatively fixed ranking format when tested across all scenarios, some experience a dramatic decline in ranking, suggesting possible sensitivity to shifts in decision-maker preferences. Thus, this analysis enabled us to justify the selection of the specified model and learn which alternatives are likely to be more influential when decision-maker opinions are different. This is especially important for revealing consistent activities that could be considered promising, no matter if one changes the weight the decision-maker has and confirms the effectiveness of the proposed MARCOS technique.
Sensitivity analysis was performed where the weights assigned to the criteria were altered purposefully, and changes in the ranking of the alternatives were noted. As Figure 3 indicates, the rankings remained relatively stable under various conditions, showing that the proposed method is robust. To see the reliability of the ranking, we used the Spearman correlation coefficient proposed by Al-HameedKhawla [36] and found that the ranking results are reliable. Such a method is applied in many studies, including by Hussain et al. [37]. Other correlation coefficients can be used as well, such as Sałabun & Urbaniak [30,38]. The Spearman correlation values demonstrated a high measure of stability, indicating the reliability of the IVPF-MARCOS in comparing investment prospects accurately [39].

6.2. Advantages of the Study

This study has the following advantages:
(a)
In FRM decision-making, the IVPF-MARCOS algorithm enhances the incorporation of fuzzy information; hence, better conclusions can be formulated compared to traditional methods.
(b)
This research offers a framework for assessing multiple investment options based on different metrics to select the best investment that will assist financial decision-makers in achieving their objectives.
(c)
Created by involving multiple stakeholders, the framework increases the solidity and reliability of the assessments and guarantees that various opinions will be taken into consideration during decision-making.
(d)
The IVPF-MARCOS model is suited to addressing the issues of computational softness and flexibility that arise due to the complexity and vagueness of financial data while making it more viable in almost all the domains of finance and accounting.
(e)
It is the first study that delivers a practical solution, applying enhanced fuzzy methods within MCGDM for the evaluation of financial risks for stocks and stones for future researchers and improvements.
(f)
This research will be useful to organizations as it presents a reliable method of assessing investment opportunities and their relation to long-term financial objectives as organizations plan for their future.
(g)
This research is useful in deepening the knowledge of financial risks and strengthening financial decision-making, which will ultimately improve a firm’s ability to prepare for and mitigate such risks.

7. Conclusions

This paper introduced a new framework for FRM with MARCOS combined with IV-PFS, which constructs a powerful MCGDM method that is useful in the stochasticity of financial data. Classical formulations of FRM do not encompass the capacity for modeling and measuring financial risk in sufficient detail to address today’s actual conditions, which are replete with probabilities and uncertainties. IVPF is integrated into the proposed IVPF-MARCOS method, as it offers a more systematic way of handling fuzziness, such as ranging from varying partial membership to complete non-membership and hesitation degrees; thus, it should offer enhanced risk analysis precision. By analyzing ten investment options against seven critical success factors elicited from five key decision-makers, this case study revealed the practicability of the proposed IVPF-MARCOS framework and the way it improves decision-making. Analysis shows that it not only addresses uncertainties arising from big data well but also provides a means to make more informed decisions given a variety of viewpoints. In conclusion, the IVPF-MARCOS framework greatly enhances the process of financial decision-making under uncertainty by providing a more flexible and accurate way for the evaluation of risk in a vacillating environment.

7.1. Limitations

However, the following limitations can be identified in this study, which introduces some improvements in applying the IVPF-MARCOS model to the FRM. First, objective factors can also inform an expert’s opinion, thus narrowing down the decision-making process. Second, although ten alternatives and seven criteria comprehensively helped evaluate the methodology, the results of this research cannot be applied to all financial contexts or environments. Third, potential issues arise from large-scale, dynamic, real-world environments that this research has not directly investigated. Finally, the extent to which the proposed framework holds across different and other financial situations (external validity or heterogeneity) has to be examined, as its internal validity can be verified through the accumulation of more research and possibly new datasets. It is suggested that further research can assess how the presented approach will work under different and changing economic environments.

7.2. Future Research

Further research could perhaps extend the use of the IVPF-MARCOS algorithm across all financial domains, including banking and financial investment, to ensure that it is constructive in other domains as well. Furthermore, exploring the applicability of IVPF-MARCOS with other MCGDM models, such as TOPSIS [33], the fuzzy neural network [40], and ordinary fuzzy differential equations [41], can establish this algorithm’s decision-making strength. Adapting the option for real-time updated financial information and analysis would also enhance the practical risk measurements. Additionally, exploring the various fuzzy techniques regarding the solving process would enhance the decision-making option. Potential areas of research and development of the IVPF-MARCOS approach include longitudinal research to evaluate the effectiveness of the medical diagnosis [42], the sliding mode control of discrete-time systems [43], switching systems [44], TS fuzzy systems [45], and construction material selection [46].

Author Contributions

Conceptualization, N.S. and H.W.; Investigation, N.S. and J.F.; Methodology, N.S. and J.F.; Resources, H.W.; Validation, N.S., H.W. and J.F.; Writing—original draft, N.S., H.W. and J.F.; Writing—review and editing, N.S., H.W. and J.F. All authors have read and agreed to the published version of the manuscript.

Funding

This research received no external funding.

Data Availability Statement

Data are contained within the article.

Conflicts of Interest

The authors declare no conflicts of interest.

Appendix A

Table A1. The aggregated m, p, and n values for alternatives by criterion.
1 2 3
m L m U p L p U n L n U m L m U p L p U n L n U m L m U p L p U n L n U
A 1 0.490 0.600 0.140 0.170 0.100 0.180 0.550 0.700 0.070 0.140 0.080 0.130 0.747 0.033 0.000 0.000 0.000 0.000
A 2 0.192 0.329 0.198 0.298 0.216 0.394 0.477 0.511 0.133 0.175 0.103 0.191 0.408 0.343 0.124 0.252 0.193 0.248
A 3 0.603 0.735 0.064 0.132 0.064 0.110 0.326 0.428 0.079 0.187 0.163 0.316 0.535 0.680 0.083 0.146 0.085 0.140
A 4 0.363 0.424 0.135 0.273 0.214 0.288 0.506 0.625 0.117 0.163 0.094 0.167 0.747 0.739 0.000 0.000 0.000 0.000
A 5 0.603 0.735 0.064 0.132 0.064 0.110 0.326 0.428 0.079 0.187 0.163 0.316 0.535 0.680 0.083 0.146 0.085 0.140
A 6 0.192 0.362 0.198 0.298 0.216 0.394 0.477 0.584 0.133 0.175 0.103 0.191 0.408 0.488 0.124 0.252 0.193 0.248
A 7 0.490 0.600 0.140 0.170 0.100 0.180 0.550 0.700 0.070 0.140 0.080 0.130 0.747 0.739 0.000 0.000 0.000 0.000
A 8 0.400 0.500 0.100 0.200 0.120 0.250 0.411 0.538 0.161 0.200 0.127 0.227 0.598 0.680 0.102 0.151 0.066 0.134
A 9 0.490 0.600 0.000 0.170 0.100 0.180 0.550 0.700 0.070 0.140 0.080 0.130 0.747 0.739 0.000 0.000 0.000 0.000
A 10 0.400 0.500 0.100 0.200 0.120 0.250 0.411 0.735 0.161 0.200 0.127 0.227 0.598 0.735 0.102 0.151 0.066 0.134
4 5 6
m L m U p L p U n L n U m L m U p L p U n L n U m L m U p L p U n L n U
A 1 0.494 0.596 0.087 0.177 0.091 0.188 0.144 0.279 0.223 0.341 0.260 0.457 0.500 0.620 0.126 0.164 0.097 0.170
A 2 0.644 0.549 0.000 0.000 0.000 0.000 0.374 0.389 0.148 0.271 0.224 0.274 0.644 0.549 0.000 0.000 0.000 0.000
A 3 0.718 0.810 0.040 0.100 0.043 0.081 0.535 0.680 0.083 0.146 0.085 0.140 0.294 0.369 0.169 0.311 0.260 0.337
A 4 0.736 0.803 0.050 0.117 0.032 0.072 0.389 0.453 0.147 0.264 0.204 0.267 0.100 0.250 0.240 0.350 0.260 0.500
A 5 0.718 0.810 0.040 0.100 0.043 0.081 0.535 0.680 0.083 0.146 0.085 0.140 0.294 0.369 0.169 0.311 0.260 0.337
A 6 0.644 0.636 0.000 0.000 0.000 0.000 0.374 0.442 0.148 0.271 0.224 0.274 0.644 0.636 0.000 0.000 0.000 0.000
A 7 0.494 0.596 0.087 0.177 0.091 0.188 0.144 0.279 0.223 0.341 0.260 0.457 0.500 0.620 0.126 0.164 0.097 0.170
A 8 0.514 0.355 0.000 0.000 0.000 0.000 0.020 0.062 0.102 0.150 0.541 0.776 0.485 0.625 0.083 0.164 0.097 0.173
A 9 0.494 0.596 0.087 0.177 0.091 0.188 0.144 0.279 0.223 0.341 0.260 0.457 0.500 0.620 0.126 0.164 0.097 0.170
A 10 0.514 0.735 0.000 0.000 0.000 0.000 0.020 0.735 0.102 0.150 0.541 0.776 0.485 0.735 0.083 0.164 0.097 0.173
7
m L m U p L p U n L n U
A 1 0.495 0.636 0.064 0.142 0.103 0.175
A 2 0.351 0.367 0.105 0.190 0.154 0.307
A 3 0.530 0.646 0.115 0.155 0.090 0.159
A 4 0.550 0.700 0.070 0.140 0.080 0.130
A 5 0.490 0.600 0.140 0.170 0.100 0.180
A 6 0.351 0.440 0.105 0.190 0.154 0.307
A 7 0.495 0.636 0.064 0.142 0.103 0.175
A 8 0.707 0.783 0.063 0.133 0.038 0.085
A 9 0.495 0.636 0.064 0.142 0.103 0.175
A 10 0.707 0.735 0.063 0.133 0.038 0.085

Appendix B

Table A2. The aggregated IVPF decision matrix of alternatives.
1 2 3
q + L q + U q L q U q + L q + U q L q U q + L q + U q L q U
A 1 0.54 0.47 1.03 1.03 0.67 0.46 0.36 1.07 1.13 0.73 0.25 0.97 1.25 1.00 0.65
A 2 0.86 0.83 0.83 0.75 0.48 0.55 0.55 1.02 0.97 0.64 0.63 0.75 0.91 0.86 0.56
A 3 0.41 0.32 1.12 1.16 0.76 0.70 0.68 0.90 0.83 0.56 0.48 0.38 1.06 1.11 0.72
A 4 0.69 0.70 0.88 0.87 0.56 0.52 0.44 1.04 1.05 0.69 0.25 0.26 1.25 1.24 0.83
A 5 0.41 0.32 1.12 1.16 0.76 0.70 0.68 0.90 0.83 0.56 0.48 0.38 1.06 1.11 0.72
A 6 0.86 0.81 0.83 0.77 0.49 0.55 0.49 1.02 1.01 0.66 0.63 0.62 0.91 0.93 0.59
A 7 0.54 0.47 1.03 1.03 0.67 0.46 0.36 1.07 1.13 0.73 0.25 0.26 1.25 1.24 0.83
A 8 0.62 0.59 0.97 0.92 0.61 0.62 0.55 0.98 0.96 0.62 0.42 0.38 1.11 1.11 0.74
A 9 0.52 0.47 1.02 1.03 0.67 0.46 0.36 1.07 1.13 0.73 0.25 0.26 1.25 1.24 0.83
A 10 0.62 0.59 0.97 0.92 0.61 0.62 0.40 0.98 1.08 0.67 0.42 0.33 1.11 1.15 0.75
4 5 6
q + L q + U q L q U q + L q + U q L q U q + L q + U q L q U
A 1 0.52 0.48 1.04 1.02 0.67 0.92 0.92 0.79 0.70 0.45 0.52 0.45 1.04 1.05 0.68
A 2 0.36 0.45 1.19 1.14 0.74 0.68 0.72 0.87 0.87 0.55 0.36 0.45 1.19 1.14 0.74
A 3 0.29 0.23 1.20 1.23 0.82 0.48 0.38 1.06 1.11 0.72 0.77 0.78 0.81 0.82 0.51
A 4 0.27 0.24 1.22 1.23 0.83 0.66 0.66 0.90 0.90 0.58 0.97 0.97 0.78 0.66 0.43
A 5 0.29 0.23 1.20 1.23 0.82 0.48 0.38 1.06 1.11 0.72 0.77 0.78 0.81 0.82 0.51
A 6 0.36 0.36 1.19 1.18 0.77 0.68 0.68 0.87 0.89 0.56 0.36 0.36 1.19 1.18 0.77
A 7 0.52 0.48 1.04 1.02 0.67 0.92 0.92 0.79 0.70 0.45 0.52 0.45 1.04 1.05 0.68
A 8 0.49 0.64 1.12 1.06 0.66 1.12 1.23 0.47 0.28 0.24 0.53 0.44 1.03 1.05 0.68
A 9 0.52 0.48 1.04 1.02 0.67 0.92 0.92 0.79 0.70 0.45 0.52 0.45 1.04 1.05 0.68
A 10 0.49 0.27 1.12 1.24 0.76 1.12 0.83 0.47 0.78 0.39 0.53 0.36 1.03 1.12 0.71
7
q + L q + U q L q U
A 1 0.52 0.43 1.03 1.05 0.69
A 2 0.67 0.73 0.92 0.81 0.55
A 3 0.49 0.42 1.06 1.07 0.70
A 4 0.46 0.36 1.07 1.13 0.73
A 5 0.54 0.47 1.03 1.03 0.67
A 6 0.67 0.67 0.92 0.84 0.57
A 7 0.52 0.43 1.03 1.05 0.69
A 8 0.30 0.27 1.20 1.21 0.81
A 9 0.52 0.43 1.03 1.05 0.69
A 10 0.30 0.31 1.20 1.18 0.80

Appendix C

Table A3. IVPF decision matrix extended.
1 2 3 4 5 6 7
A 1 0.672 0.729 0.648 0.673 0.447 0.682 0.687
A 2 0.483 0.644 0.563 0.743 0.554 0.743 0.552
A 3 0.759 0.557 0.716 0.824 0.716 0.513 0.701
A 4 0.558 0.687 0.829 0.827 0.576 0.427 0.729
A 5 0.759 0.557 0.716 0.824 0.716 0.513 0.672
A 6 0.489 0.662 0.595 0.767 0.565 0.767 0.568
A 7 0.672 0.729 0.829 0.673 0.447 0.682 0.687
A 8 0.610 0.623 0.736 0.659 0.241 0.681 0.808
A 9 0.675 0.729 0.829 0.673 0.447 0.682 0.687
A 10 0.610 0.668 0.750 0.759 0.390 0.707 0.795

Appendix D

Table A4. IVPF decision matrix normalized.
1 2 3 4 5 6 7
A 1 0.885 1.000 0.782 0.814 0.623 0.626 0.803717
A 2 0.636 0.884 0.679 0.898 0.773 0.575 1
A 3 1.000 0.764 0.864 0.996 1.000 0.833 0.787416
A 4 0.736 0.942 1.000 1.000 0.804 1.000 0.757142
A 5 1.000 0.764 0.864 0.996 1.000 0.833 0.821528
A 6 0.645 0.909 0.717 0.927 0.788 0.557 0.9714
A 7 0.885 1.000 1.000 0.814 0.623 0.626 0.803717
A 8 0.803 0.854 0.888 0.797 0.337 0.628 0.68261
A 9 0.889 1.000 1.000 0.814 0.623 0.626 0.803717
A 10 0.803 0.916 0.904 0.917 0.545 0.604 0.693778
I 1.000 1.000 1.000 1.000 1.000 1.000 1
A I 0.636 0.764 0.679 0.797 0.337 0.557 0.68261

Appendix E

Table A5. IVPF decision matrix weighted.
1 2 3 4 5 6 7
A 1 0.121 0.150 0.113 0.129 0.079 0.094 0.107
A 2 0.087 0.133 0.098 0.143 0.098 0.086 0.133
A 3 0.137 0.115 0.125 0.158 0.127 0.125 0.105
A 4 0.101 0.141 0.145 0.159 0.102 0.150 0.101
A 5 0.137 0.115 0.125 0.158 0.127 0.125 0.109
A 6 0.088 0.136 0.104 0.147 0.100 0.084 0.129
A 7 0.121 0.150 0.145 0.129 0.079 0.094 0.107
A 8 0.110 0.128 0.129 0.127 0.043 0.094 0.091
A 9 0.122 0.150 0.145 0.129 0.079 0.094 0.107
A 10 0.110 0.138 0.131 0.146 0.069 0.091 0.092
I 0.137 0.150 0.145 0.159 0.127 0.150 0.133
A I 0.087 0.115 0.098 0.127 0.043 0.084 0.091

References

  1. Akomea-Frimpong, I.; Jin, X.; Osei-Kyei, R. Fuzzy Analysis of Financial Risk Management Strategies for Sustainable Public–Private Partnership Infrastructure Projects in Ghana. Infrastructures 2024, 9, 76. [Google Scholar] [CrossRef]
  2. Mu, L. An Integrated Methodology for Enterprise Financial Management Capability Evaluation Based on EDAS Technique and Group Decision Making. J. Intell. Fuzzy Syst. 2024, 46, 2281–2296. [Google Scholar] [CrossRef]
  3. Zadeh, L.A. Fuzzy Sets. Inf. Control 1965, 8, 338–353. [Google Scholar] [CrossRef]
  4. Atanassov, K.T. Intuitionistic Fuzzy Sets. In Intuitionistic Fuzzy Sets; Studies in Fuzziness and Soft Computing; Physica-Verlag HD: Heidelberg, Germany, 1999; Volume 35, pp. 1–137. ISBN 978-3-7908-2463-6. [Google Scholar]
  5. Yager, R.R. Pythagorean Fuzzy Subsets. In Proceedings of the 2013 Joint IFSA World Congress and NAFIPS Annual Meeting (IFSA/NAFIPS), Edmonton, AB, Canada, 24–28 June 2013; pp. 57–61. [Google Scholar]
  6. Yager, R.R. Generalized Orthopair Fuzzy Sets. IEEE Trans. Fuzzy Syst. 2017, 25, 1222–1230. [Google Scholar] [CrossRef]
  7. Cuong, B. Picture Fuzzy Sets-First Results; Part 1: Seminar Neuro-Fuzzy Systems with Applications; Institute of Mathematics: Hanoi, Vietnam, 2013.
  8. Khalil, A.M.; Li, S.-G.; Garg, H.; Li, H.; Ma, S. New Operations on Interval-Valued Picture Fuzzy Set, Interval-Valued Picture Fuzzy Soft Set and Their Applications. IEEE Access 2019, 7, 51236–51253. [Google Scholar] [CrossRef]
  9. Kou, G.; Peng, Y.; Wang, G. Evaluation of Clustering Algorithms for Financial Risk Analysis Using MCDM Methods. Inf. Sci. 2014, 275, 1–12. [Google Scholar] [CrossRef]
  10. Marqués, A.I.; García, V.; Sánchez, J.S. Ranking-Based MCDM Models in Financial Management Applications: Analysis and Emerging Challenges. Prog. Artif. Intell. 2020, 9, 171–193. [Google Scholar] [CrossRef]
  11. Froelich, W.; Hajek, P. IVIFCM-TOPSIS for Bank Credit Risk Assessment. In Intelligent Decision Technologies 2019; Czarnowski, I., Howlett, R.J., Jain, L.C., Eds.; Springer: Singapore, 2020; pp. 99–108. [Google Scholar]
  12. Wang, P.; Lin, Y.; Fu, M.; Wang, Z. VIKOR Method for Plithogenic Probabilistic Linguistic MAGDM and Application to Sustainable Supply Chain Financial Risk Evaluation. Int. J. Fuzzy Syst. 2023, 25, 780–793. [Google Scholar] [CrossRef]
  13. Li, W.; Wang, L.; Rehman, O.U. A Novel Interval Type-2 Fuzzy CPT-TODIM Method for Multi-Criteria Group Decision Making and Its Application to Credit Risk Assessment in Supply Chain Finance. In International Journal of Fuzzy Systems; Springer: Berlin/Heidelberg, Germany, 2024. [Google Scholar] [CrossRef]
  14. Kara, K.; Yalçın, G.C.; Çetinkaya, A.; Simic, V.; Pamucar, D. A Single-Valued Neutrosophic CIMAS-CRITIC-RBNAR Decision Support Model for the Financial Performance Analysis: A Study of Technology Companies. Socio-Econ. Plan. Sci. 2024, 92, 101851. [Google Scholar] [CrossRef]
  15. Mashrur, A.; Luo, W.; Zaidi, N.A.; Robles-Kelly, A. Machine Learning for Financial Risk Management: A Survey. IEEE Access 2020, 8, 203203–203223. [Google Scholar] [CrossRef]
  16. Li, D.-P.; Cheng, S.-J.; Cheng, P.-F.; Wang, J.-Q.; Zhang, H.-Y. A Novel Financial Risk Assessment Model for Companies Based on Heterogeneous Information and Aggregated Historical Data. PLoS ONE 2018, 13, e0208166. [Google Scholar] [CrossRef]
  17. Trung, D.D.; Dudić, B.; Dung, H.T.; Truong, N.X. Innovation in Financial Health Assessment: Applying MCDM Techniques to Banks in Vietnam. Econ. Innov. Econ. Res. J. 2024, 12, 21–33. [Google Scholar] [CrossRef]
  18. Nguyen, P.-H.; Nguyen, L.-A.T.; Pham, T.-V.; Nguyen, K.-A.; Nguyen, M.-A.N.; Nguyen, L.-D.T.; Nguyen, L.-T. Z-Number Based Fuzzy MCDM Models for Analyzing Non-Traditional Security Threats to Finance Supply Chains: A Case Study from Vietnam. Heliyon 2024, 10, e31615. [Google Scholar] [CrossRef] [PubMed]
  19. Alsanousi, A.T.; Alqahtani, A.Y.; Makki, A.A.; Baghdadi, M.A. A Hybrid MCDM Approach Using the BWM and the TOPSIS for a Financial Performance-Based Evaluation of Saudi Stocks. Information 2024, 15, 258. [Google Scholar] [CrossRef]
  20. Afshar, M.R.; Asadzadeh Zenozi, H. Introducing a Fuzzy MCDM Model for Financial Management in Multiple Project Environments. Constr. Innov. 2022, 22, 305–319. [Google Scholar] [CrossRef]
  21. Akram, M.; Khan, A.; Luqman, A.; Senapati, T.; Pamucar, D. An Extended MARCOS Method for MCGDM under 2-Tuple Linguistic q-Rung Picture Fuzzy Environment. Eng. Appl. Artif. Intell. 2023, 120, 105892. [Google Scholar] [CrossRef]
  22. Mishra, A.R.; Rani, P.; Pamucar, D.; Saha, A. An Integrated Pythagorean Fuzzy Fairly Operator-Based MARCOS Method for Solving the Sustainable Circular Supplier Selection Problem. Ann. Oper. Res. 2023, 342, 523–564. [Google Scholar] [CrossRef]
  23. Memarpour Ghiaci, A.; Garg, H.; Jafarzadeh Ghoushchi, S. Improving Emergency Departments during COVID-19 Pandemic: A Simulation and MCDM Approach with MARCOS Methodology in an Uncertain Environment. Comp. Appl. Math. 2022, 41, 368. [Google Scholar] [CrossRef]
  24. Kumar, S.; Bhaumik, S.; Patnaik, L.; Maity, S.R.; Paleu, V. Application of Integrated BWM Fuzzy-MARCOS Approach for Coating Material Selection in Tooling Industries. Materials 2022, 15, 9002. [Google Scholar] [CrossRef] [PubMed]
  25. Demir, G.; Chatterjee, P.; Kadry, S.; Abdelhadi, A.; Pamučar, D. Measurement of Alternatives and Ranking According to Compromise Solution (MARCOS) Method: A Comprehensive Bibliometric Analysis. Decis. Mak. Appl. Manag. Eng. 2024, 7, 313–336. [Google Scholar] [CrossRef]
  26. Zhan, M.; Li, Y.-L. Evaluation and Selection of Sustainable Hydrogen Production Technologies with Unknown Expert Weights Based on Extended MARCOS under Hybrid Information. Int. J. Hydrogen Energy 2024, 77, 1043–1055. [Google Scholar] [CrossRef]
  27. Jayakumar, V.; Kannan, J.; Kausar, N.; Deveci, M.; Wen, X. Multicriteria Group Decision Making for Prioritizing IoT Risk Factors with Linear Diophantine Fuzzy Sets and MARCOS Method. Granul. Comput. 2024, 9, 56. [Google Scholar] [CrossRef]
  28. Tarafdar, A.; Majumder, P.; Deb, M.; Bera, U.K. Performance-Emission Optimization in a Single Cylinder CI-Engine with Diesel Hydrogen Dual Fuel: A Spherical Fuzzy MARCOS MCGDM Based Type-3 Fuzzy Logic Approach. Int. J. Hydrogen Energy 2023, 48, 28601–28627. [Google Scholar] [CrossRef]
  29. Wang, C.-N.; Nguyen, T.T.T.; Dang, T.-T.; Nguyen, N.-A.-T. A Hybrid OPA and Fuzzy MARCOS Methodology for Sustainable Supplier Selection with Technology 4.0 Evaluation. Processes 2022, 10, 2351. [Google Scholar] [CrossRef]
  30. Mahmood, T.; Ali, Z. MARCOS Technique by Using Q-Rung Orthopair Fuzzy Sets for Evaluating the Performance of Insurance Companies in Terms of Healthcare Services. In q-Rung Orthopair Fuzzy Sets; Garg, H., Ed.; Springer Nature: Singapore, 2022; pp. 357–375. ISBN 978-981-19144-8-5. [Google Scholar]
  31. Shekhovtsov, A.; Kizielewicz, B.; Sałabun, W. Advancing Individual Decision-Making: An Extension of the Characteristic Objects Method Using Expected Solution Point. Inf. Sci. 2023, 647, 119456. [Google Scholar] [CrossRef]
  32. Kizielewicz, B.; Więckowski, J.; Sałabun, W. SESP-SPOTIS: Advancing Stochastic Approach for Re-Identifying MCDA Models. In Computational Science—ICCS 2024; Franco, L., de Mulatier, C., Paszynski, M., Krzhizhanovskaya, V.V., Dongarra, J.J., Sloot, P.M.A., Eds.; Springer Nature: Cham, Switzerland, 2024; pp. 281–295. [Google Scholar]
  33. Hussain, A.; Ullah, K.; Senapati, T.; Moslem, S. Energy Supplier Selection by TOPSIS Method Based on Multi-Attribute Decision-Making by Using Novel Idea of Complex Fuzzy Rough Information. Energy Strategy Rev. 2024, 54, 101442. [Google Scholar] [CrossRef]
  34. Al-Barakati, A.; Mishra, A.R.; Mardani, A.; Rani, P. An Extended Interval-Valued Pythagorean Fuzzy WASPAS Method Based on New Similarity Measures to Evaluate the Renewable Energy Sources. Appl. Soft Comput. 2022, 120, 108689. [Google Scholar] [CrossRef]
  35. Acar, C.; Haktanır, E.; Temur, G.T.; Beskese, A. Sustainable Stationary Hydrogen Storage Application Selection with Interval-Valued Intuitionistic Fuzzy AHP. Int. J. Hydrogen Energy 2024, 49, 619–634. [Google Scholar] [CrossRef]
  36. Al-Hameed, A.A. Khawla Spearman’s Correlation Coefficient in Statistical Analysis. Int. J. Nonlinear Anal. Appl. 2022, 13, 3249–3255. [Google Scholar] [CrossRef]
  37. Hussain, A.; Ullah, K.; Pamucar, D.; Simic, V. Intuitionistic Fuzzy Sugeno-Weber Decision Framework for Sustainable Digital Security Assessment. Eng. Appl. Artif. Intell. 2024, 137, 109085. [Google Scholar] [CrossRef]
  38. Sałabun, W.; Urbaniak, K. A New Coefficient of Rankings Similarity in Decision-Making Problems. In Computational Science—ICCS 2020; Krzhizhanovskaya, V.V., Závodszky, G., Lees, M.H., Dongarra, J.J., Sloot, P.M.A., Brissos, S., Teixeira, J., Eds.; Springer International Publishing: Cham, Switzerland, 2020; pp. 632–645. [Google Scholar]
  39. Shekhovtsov, A.; Więckowski, J.; Kizielewicz, B.; Sałabun, W. Towards Reliable Decision-Making in the Green Urban Transport Domain. Facta Univ. Ser. Mech. Eng. 2022, 20, 381–398. [Google Scholar] [CrossRef]
  40. Ge, J.; Zhang, S. Adaptive Inventory Control Based on Fuzzy Neural Network under Uncertain Environment. Complexity 2020, 2020, 6190936. [Google Scholar] [CrossRef]
  41. Sarwar, M.; Li, T. Fuzzy Fixed Point Results and Applications to Ordinary Fuzzy Differential Equations in Complex Valued Metric Spaces. Hacet. J. Math. Stat. 2019, 48, 1712–1728. [Google Scholar] [CrossRef]
  42. Mahmood, T.; Ullah, K.; Khan, Q.; Jan, N. An Approach toward Decision-Making and Medical Diagnosis Problems Using the Concept of Spherical Fuzzy Sets. Neural Comput. Appl. 2019, 31, 7041–7053. [Google Scholar] [CrossRef]
  43. Sun, Q.; Ren, J.; Zhao, F. Sliding Mode Control of Discrete-Time Interval Type-2 Fuzzy Markov Jump Systems with the Preview Target Signal. Appl. Math. Comput. 2022, 435, 127479. [Google Scholar] [CrossRef]
  44. Zhang, N.; Qi, W.; Pang, G.; Cheng, J.; Shi, K. Observer-Based Sliding Mode Control for Fuzzy Stochastic Switching Systems with Deception Attacks. Appl. Math. Comput. 2022, 427, 127153. [Google Scholar] [CrossRef]
  45. Gao, M.; Zhang, L.; Qi, W.; Cao, J.; Cheng, J.; Kao, Y.; Wei, Y.; Yan, X. SMC for Semi-Markov Jump TS Fuzzy Systems with Time Delay. Appl. Math. Comput. 2020, 374, 125001. [Google Scholar]
  46. Khan, M.R.; Wang, H.; Ullah, K.; Karamti, H. Construction Material Selection by Using Multi-Attribute Decision Making Based on q-Rung Orthopair Fuzzy Aczel–Alsina Aggregation Operators. Appl. Sci. 2022, 12, 8537. [Google Scholar] [CrossRef]
Figure 1. Flowchart of the methodology.
Symmetry 17 00144 g001
Figure 2. Ranking of alternatives.
Symmetry 17 00144 g002
Figure 3. Sensitivity analysis.
Symmetry 17 00144 g003
Table 1. Linguistic expressions for evaluating criteria and decision-makers.
Expression IVPFVs   ( m , p , n )
Very important (VI) ( [ 0.80 , 0.85 ] , [ 0.04 , 0.06 ] , [ 0.06 , 0.09 ] )
Important (I) ( [ 0.68 , 0.75 ] , [ 0.04 , 0.09 ] , [ 0.06 , 0.12 ] )
Medium (M) ( [ 0.40 , 0.50 ] , [ 0.14 , 0.26 ] , [ 0.1 , 0.15 ] )
Unimportant (UI) ( [ 0.20 , 0.32 ] , [ 0.24 , 0.31 ] , [ 0.16 , 0.28 ] )
Very unimportant (VU) ( [ 0.05 , 0.09 ] , [ 0.04 , 0.06 ] , [ 0.80 , 0.85 ] )
Table 2. Linguistic components for an alternative ranking system.
Expression IVPFVs   ( m , p , n )
Extremely good (EG) ( [ 0.90 , 1 ] , [ 0 , 0 ] , [ 0 , 0 ] )
Very very good (VVG) ( [ 0.80 , 0.85 ] , [ 0.04 , 0.1 ] , [ 0.02 , 0.05 ] )
Very good (VG) ( [ 0.70 , 0.80 ] , [ 0.04 , 0.1 ] , [ 0.05 , 0.09 ] )
Good (G) ( [ 0.55 , 0.70 ] , [ 0.07 , 0.14 ] , [ 0.08 , 0.13 ] )
Medium good (MG) ( [ 0.49 , 0.60 ] , [ 0.14 , 0.17 ] , [ 0.1 , 0.18 ] )
Fair (F) ( [ 0.40 , 0.50 ] , [ 0.10 , 0.20 ] , [ 0.12 , 0.25 ] )
Medium bad (MB) ( [ 0.35 , 0.40 ] , [ 0.15 , 0.30 ] , [ 0.26 , 0.30 ] )
Bad (B) ( [ 0.10 , 0.25 ] , [ 0.24 , 0.35 ] , [ 0.26 , 0.50 ] )
Very bad (VB) ( [ 0.05 , 0.1 ] , [ 0.04 , 0.15 ] , [ 0.40 , 0.70 ] )
Very very bad (VVB) ( [ 0.01 , 0.05 ] , [ 0.14 , 0.15 ] , [ 0.60 , 0.80 ] )
Table 3. Linguistic assessments for criteria rating.
Ε 1 Ε 2 Ε 3 Ε 4 Ε 5
1 I M UI VI VU
2 M UI VI M I
3 M UI I M I
4 I M I M VI
5 VI VU M M UI
6 M I I UI I
7 M I UI M M
Table 4. Linguistic assessments to rate the alternatives.
AlternativesUsers Criteria
1 2 3 4 5 6 7
A 1 Ε 1 MG G EG VVG MB G VB
Ε 2 MG G VG F B MG G
Ε 3 MG G VG F B MG G
Ε 4 MG G VG F B MG G
Ε 5 MG G VG F B MG G
A 2 Ε 1 G F MB EG MG EG VVB
Ε 2 B MG MB G MB G F
Ε 3 B MG MB G MB G F
Ε 4 B MG MB G MB G F
Ε 5 B MG G G MB G F
A 3 Ε 1 VVG F G VVG G MB VG
Ε 2 G F G VG G MB MG
Ε 3 G F G VG G MB MG
Ε 4 G F G VG G MB MG
Ε 5 G VB MG VG MG B MG
A 4 Ε 1 MB MG EG VVG MB B G
Ε 2 MB MG VG VVG MB B G
Ε 3 MB MG VG VVG MB B G
Ε 4 MB MG VG VVG MB B G
Ε 5 F G VG F MG B G
A 5 Ε 1 VVG F G VVG G MB MG
Ε 2 G F G VG G MB MG
Ε 3 G F G VG G MB MG
Ε 4 G F G VG G MB MG
Ε 5 G VB MG VG MG B MG
A 6 Ε 1 G F MB EG MG EG VVB
Ε 2 B MG MB G MB G F
Ε 3 B MG MB G MB G F
Ε 4 B MG MB G MB G F
Ε 5 B MG G G MB G F
A 7 Ε 1 MG G EG VVG MB G VB
Ε 2 MG G VG F B MG G
Ε 3 MG G VG F B MG G
Ε 4 MG G VG F B MG G
Ε 5 MG G VG F B MG G
A 8 Ε 1 F MG MG EG VVB G VVG
Ε 2 F MG MG MB VVB G VVG
Ε 3 F MG MG MB VVB G VVG
Ε 4 F MG MG MB VVB F VVG
Ε 5 F B VVG MB VB F B
A 9 Ε 1 MG G EG VVG MB G VB
Ε 2 MG G VG F B MG G
Ε 3 MG G VG F B MG G
Ε 4 MG G VG F B MG G
Ε 5 MG G VG F B MG G
A 10 Ε 1 F MG MG EG VVB G VVG
Ε 2 F MG MG MB VVB G VVG
Ε 3 F MG MG MB VVB G VVG
Ε 4 F MG MG MB VVB F VVG
Ε 5 F B VVG MB VB F B
Table 5. Weights of decision-makers.
Ε 1 Ε 2 Ε 3 Ε 4 Ε 5
Linguistic variables U I V U I M I UI
Weight (L) 0.155 0.155 0.218 0.218 0.254
Weight (U)0.1770.1770.2090.2090.228
Table 6. IVPF decision matrix aggregated.
m L m U p L p U n L n U
1 0.4870.5790.072 0.1180.155 0.219
2 0.579 0.6500.084 0.1550.085 0.143
3 0.534 0.6100.084 0.1690.085 0.152
4 0.641 0.7090.064 0.1240.073 0.122
5 0.353 0.5180.109 0.1610.144 0.215
6 0.569 0.6520.072 0.1410.080 0.149
7 0.421 0.5280.130 0.2240.102 0.164
Table 7. Weights of criteria.
q + L q + U q L q U CC Normalized   Weights
1 0.540442 0.4887050.977849 0.9792740.655374 0.137
2 0.437713 0.4089461.086406 1.0864440.719604 0.150
3 0.481489 0.4511221.062941 1.0582730.694609 0.145
4 0.371787 0.3387541.129175 1.13510.761148 0.159
5 0.672038 0.5517010.932336 0.9544320.606579 0.127
6 0.44395 0.4041121.083945 1.0810250.718535 0.150
7 0.60237 0.5472560.999808 1.0136640.6365510.133
Table 8. Utility functions of alternatives and utility degrees.
S i ˘ i ˘ i + f ˘ i f ˘ i + f ˘ i R a n k
A 1 0.793 1.233 0.793 0.392 0.608 0.634 6
A 2 0.778 1.209 0.778 0.392 0.608 0.621 8
A 3 0.891 1.385 0.891 0.392 0.608 0.712 3
A 4 0.898 1.396 0.898 0.392 0.608 0.717 1
A 5 0.896 1.392 0.896 0.392 0.608 0.715 2
A 6 0.788 1.225 0.788 0.392 0.608 0.630 7
A 7 0.825 1.282 0.825 0.392 0.608 0.659 4
A 8 0.721 1.120 0.721 0.392 0.608 0.576 10
A 9 0.826 1.283 0.826 0.392 0.608 0.659 5
A 10 0.776 1.206 0.776 0.392 0.608 0.620 9
Table 9. Comparison analysis.
MethodsUncertainty HandlingIVPF Data CompatibilityComputational ComplexityDecision-Making ClarityMethodological FlexibilityEase of ImplementationNovelty of ApproachRobustness in FRM
IVPF-MARCOSStrongFully compatibleHighHighHighHighHighHigh
ESP-COMETModerateLimitedHighModerateModerateLowModerateModerate
SESP-SPOTISModerateLimitedHighModerateModerateLowModerateModerate
TOPSISWeakLimitedHighModerateModerateHighModerateModerate
VIKORModerateLimitedHighHighModerateHighModerateModerate
WASPASStrongLimitedHighHighHighModerateModerateHigh
AHPWeakLimitedLowLowLowHighLowLow
Disclaimer/Publisher’s Note: The statements, opinions and data contained in all publications are solely those of the individual author(s) and contributor(s) and not of MDPI and/or the editor(s). MDPI and/or the editor(s) disclaim responsibility for any injury to people or property resulting from any ideas, methods, instructions or products referred to in the content.

