1. Introduction
As a form of identification in everyday life, handwritten signatures are widely used on important documents [
1]. They indicate that the signer accepts and is responsible for the entire content of the signed document. Handwritten signatures are unique and easy to collect. For this reason, identification of the signature becomes an extremely important process in terms of determining whether the signature belongs to the original signatory. Since manual recognition creates time costs and is prone to recognition errors, systems need to automate the process.
Signature samples are divided into online and offline handwritten signature classification technologies. The images obtained through online signature are dynamic images obtained through touch screens. The process of signatures obtained offline involves scanning the signatures on paper, converting them to digital form, and processing them on the computer. Handwritten signatures can be classified by their similarity based solely on strategic information such as shape and location [
2,
3]. Therefore, recognition and classification of handwritten signature images is a more challenging task than online signatures.
Handwritten signature classification is divided into two stages according to the development processes. The first stage includes traditional classification approaches. The second involves the classification of handwritten signatures using deep learning approaches. Physical properties of signatures are generally analyzed by feature extraction techniques. Deep learning techniques enable learning network architectures for large amounts of data. Researchers working in this field have recently introduced many deep learning technologies and obtained results that contribute to the field.
The handwritten signature verification system has a problem regarding how genuine and forged signatures are classified. It is a system that tries to distinguish between genuine and forged signatures of individuals. Although signatures are used for authentication, some signatures of the same person may differ due to a number of factors and conditions. In other words, not every signature taken from the same person may be symmetrical. Hilton emphasizes that signatures have three main characteristics: form, movement, and variation [
3]. The author also observed that once people adopt a signature style, small changes occur over time. The signing process is defined as the process by which the brain retrieves information from long-term memory with parameters such as size, shape, etc. Genuine signatures are associated with neural activity planning, while forged signatures are the result of deliberate handwriting imitation [
4].
Handwritten signature forgery can be detected by a number of features and characteristics. However, if a forged signature is created by a skilled person, it can cause confusion for examiners. To counter such problems, deep image classification methods can be used that focus on comparing multiple combinations of comprehensive signature features. For this purpose, a special signature image dataset, “C-Signatures “, is created for this study and Si-CNN and Si-CNN+NC models are presented to improve the classification performance for signature images. The Si-CNN model, the first CNN model constructed, as well as the pre-trained models employed in this study were categorized using standard cross-entropy, and the results were obtained. A new loss function was created for the Si-CNN+NC model, and classification outcomes were achieved. The major goal of this comparison is to assess the way the classification layer created for the Si-CNN+NC model performs in comparison to the classification layer used in Si-CNN and pre-trained models. The proposed model is deliberately designed to be lightweight in order to output a classification result for a given input as quickly as possible, even when deployed on devices that are limited in processing power (e.g., mobile devices). Various state-of-the-art classifiers are used, including deep neural networks to compare the classification performance of the proposed new models.
While there are many studies on handwritten signature image recognition in the literature, there is a lack of studies on signature image classification in the research field. To this end, this study can contribute to the field in five different ways.
- (1)
Two different convolutional frameworks are proposed to design compatible CNN model architectures to investigate signature image classification.
- (2)
A new model that is highly accurate: a unique model, a CNN, which outperforms the state-of-the-art baselines and is lightweight, quick, and accurate, is presented.
- (3)
A comprehensive hyper-parameter optimization task: To determine the optimal value for each hyper-parameter in the suggested model, a thorough hyper-parameter optimization was carried out. As a result, the model that would eventually provide the best classification accuracy was selected.
- (4)
A new classification layer design: a new classification layer design named “Si-CL” is presented.
- (5)
A new dataset: a new dataset of image images, “C-Signatures”, is proposed for use by researchers in this field.
The remainder of the paper will be organized as follows:
Section 2 briefly presents the work conducted in the related field and information about CNN.
Section 3 describes the datasets used and the methodology.
Section 4 presents the results of the experiments.
Section 5 presents the discussions.
Section 6 concludes the paper by giving information about what can be done after this study.
2. Related Work
The success of deep learning methods in many fields, especially after the developments in graphics card technology, has attracted the attention of researchers working on signature verification and classification. Researchers have applied deep learning methods to signature verification and classification in order to increase success in this field. Luiz G. Hafemann et al. developed an author-independent signature feature extraction model for classifying author-dependent signature sets using a CNN [
5].
Especially for offline signatures, the performance of offline signature verification is significantly degraded due to the fact that dynamic features are not available and, therefore, it is difficult to extract signature characteristics with a very limited set of features. For this reason, the authors have developed an author-dependent offline signature verification model with signature attributes automatically extracted with CNN, independent of the author. However, as stated in their study, they only used real signatures as training data. In some cases, they also included skilled forged signature samples. Therefore, the training data are quite small and it is thought to affect the success of learning.
Zhang et al. [
6] proposed a multi-phase unsupervised classification method for offline signature verification using Deep Convolutional Generative Adversarial Networks (DCGANs). In order to solve the problem of insufficient data in their proposed system, they trained the system with both user-independent and user-dependent signatures.
Sam et al. [
7] tested different versions of the Google inception CNN model for online signature verification with different numbers of users and compared their performance. They emphasized that the 22-layer inception V1 model outperformed the 42-layer inception V3 model on signature images. Souza et al. [
8] proposed a support vector machine (SVM) system for author-independent classification. In their proposed system, they used the CNN method for user-dependent feature extraction.
Rabbi et al. [
9] proposed a study on offline handwritten signature verification using CNN. They used data augmentation with the CNN model and also presented a comparative study with Multilayer Perceptron (MLP) and Single-Layer Perceptron (SLP). Alajrami et al. [
10] created a CNN model for offline signatures using python and achieved a high success rate. Mohapatra et al. [
11] used a CNN to learn features from pre-processed real and forged signatures. The CNN model they used was inspired by the Inception V1 architecture. The architecture used the concept of having different filters at the same level to make the network wider instead of deeper.
Parcham et al. [
12] used a combination of CNNs and capsule neural networks for an offline signature verification model. There are two reasons for using CapsNet for feature extraction. First, there is the possibility of reducing the number of layers and parameters. Second, CapsNet can detect details of spatial and angular changes. Berkay et al. [
13] proposed a hybrid user-dependent/independent offline signature verification technique with a two-channel CNN for both verification and feature extraction. Muhammed Mutlu et al. [
14] proposed a Deep Learning (DL)-based offline signature verification method to prevent signature forgery by malicious actors. The DL method used in the study is a CNN. The CNN is designed and trained separately for two different models, Writer-Dependent (WD) and Writer-Independent (WI).
Jain et al. [
15] proposed a language-independent shallow sCNN for signature verification. Although the proposed architecture is quite simple, it is highly efficient in terms of accuracy. A specialized shallow CNN is used to automatically learn signature features from the provided training data.
While there are many studies on signature image recognition, there is a lack of studies on signature image classification. There are some studies on signature classification: Vargas et al. [
16] proposed an offline handwritten signature classification approach. In their study, HMM and SVMLight models were analyzed and a high performance was obtained in the SVMLight model.
Rosso et al. [
17] proposed an online handwritten signature classification and verification approach. Using One-Class SVM, it was found that the number of training examples in the dataset is an important criterion for success. Kim et al. [
18] proposed classifying handwritten signature images using a chromosome clustering technique. Ganguly et al. [
19] proposed an automatic approach for handwritten signature classification. The input images were first converted into binary images. Then, rotation and noise removal operations were performed. A set of 100 images was tested using K-NN classification and the classification success of the model was 92%.
Keyhosravi et al. [
20] proposed a new method for offline signature identification using deep learning approaches under various experimental conditions and different uncertainties such as environmental noises. The signatures of 85 people were collected at various time intervals. The proposed method was analyzed not only on the collected dataset but also on various other datasets. The proposed model achieved a high performance. Samonte et al. [
21] implemented an ED model to classify a dataset of 300 signatures from 20 authors using a feature extraction algorithm of global features such as area, height, and width.
Akhundjanov et al. [
22] proposed a model based on CNNs to classify handwritten signature images. A study-specific dataset and a publicly available handwritten signature dataset called Bengali were used. In the study-specific dataset, handwritten signature data of 40 people, consisting of 10 real and 10 fake signatures, were collected. The Bengali dataset consists of 100 people and there are 24 real and 30 fake signatures for each person. In this study, experiments were conducted by randomly selecting 20 people from the Bengali dataset. Images in the two datasets were used as input data for the proposed network architecture. As a result of testing the proposed CNN model, classification accuracies of 90.04% were obtained from the study-specific dataset and 97.50% were obtained from the Bengali dataset.
Mohammed et al. [
23] proposed a model based on a CNN to classify handwritten signature images. To test the effectiveness of the presented model, comparisons with MobileNets were made. In the study, experiments were carried out using CEDAR, ICDER, and sigcomp datasets and the effectiveness of the presented model was demonstrated.
Culqui et al. [
24] proposed a model based on a CNN to quickly classify a person’s signature with over 90% accuracy. In the study, two different datasets called the publicly available CEDAR dataset and GC-DB prepared by the researchers were used.
3. Materials and Methods
The dataset structure, the Si-CNN and Si-CNN+NC models, and the models developed to benchmark the suggested model are all thoroughly explained in the subsections that follow in this section.
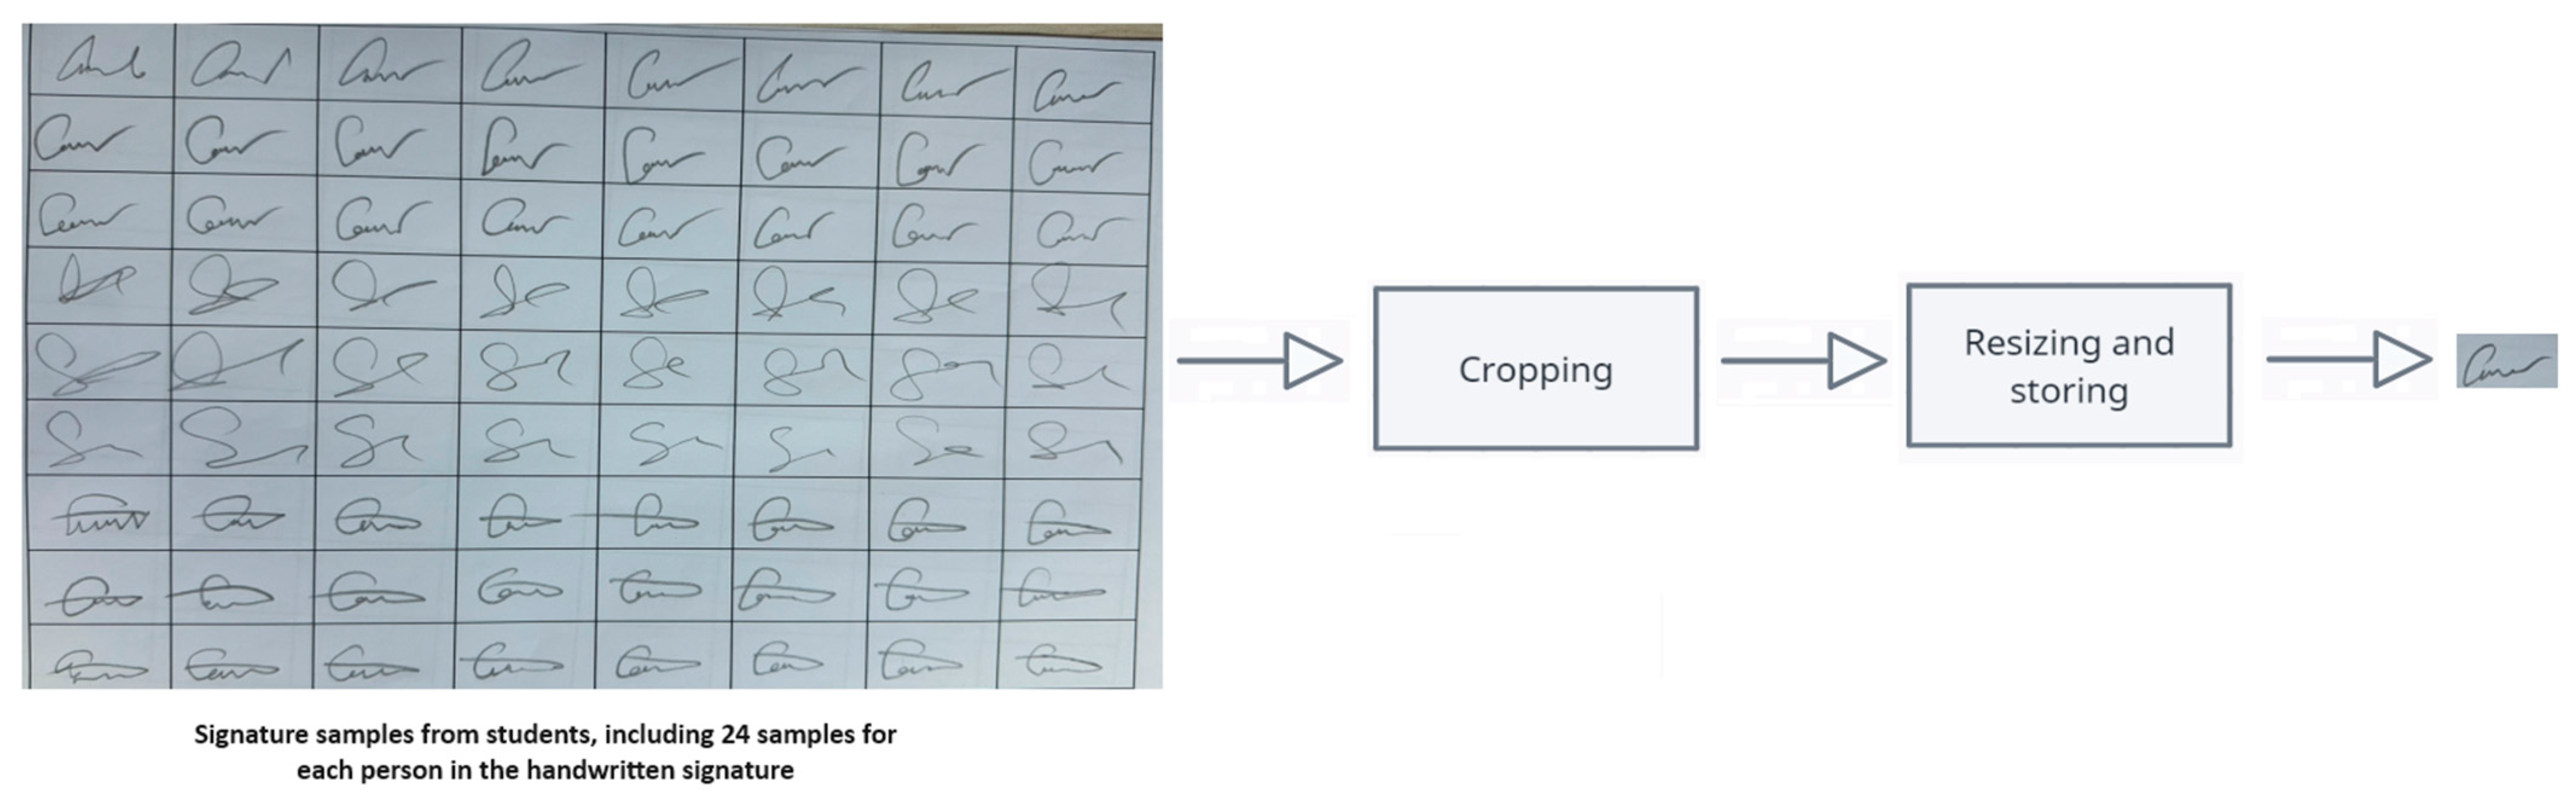
3.1. Datasets Construction and Workflow of the Method
Three different datasets (C-Signatures, Cedar, and MNIST) were used for training and evaluation of Si-CNN, Si-CNN+NC, and benchmark models. First, the dataset called “C-Signatures” was used, which was created by taking 24 samples from 55 different people. Signature samples were collected from a total of 65 students, but some of the collected samples were not included in the created dataset because (1) they did not meet the expected quality in terms of DPI and/or resolution, or (2) they were corrupted. Since the importance of preprocessing was proven in this study, each image in the dataset was preprocessed in order to improve the quality of the data, which directly affects the performance of the proposed CNN models. The preprocessing phase included the following steps: (1) each image was cropped for handwritten signature samples, and (2) each image was resized to 120 pixels × 120 pixels. Thanks to the implemented script, the pre-processing phase was fully automated and is shown in
Figure 1. A sample image of the classes in the “C-Signatures” dataset is shown in
Figure 2.
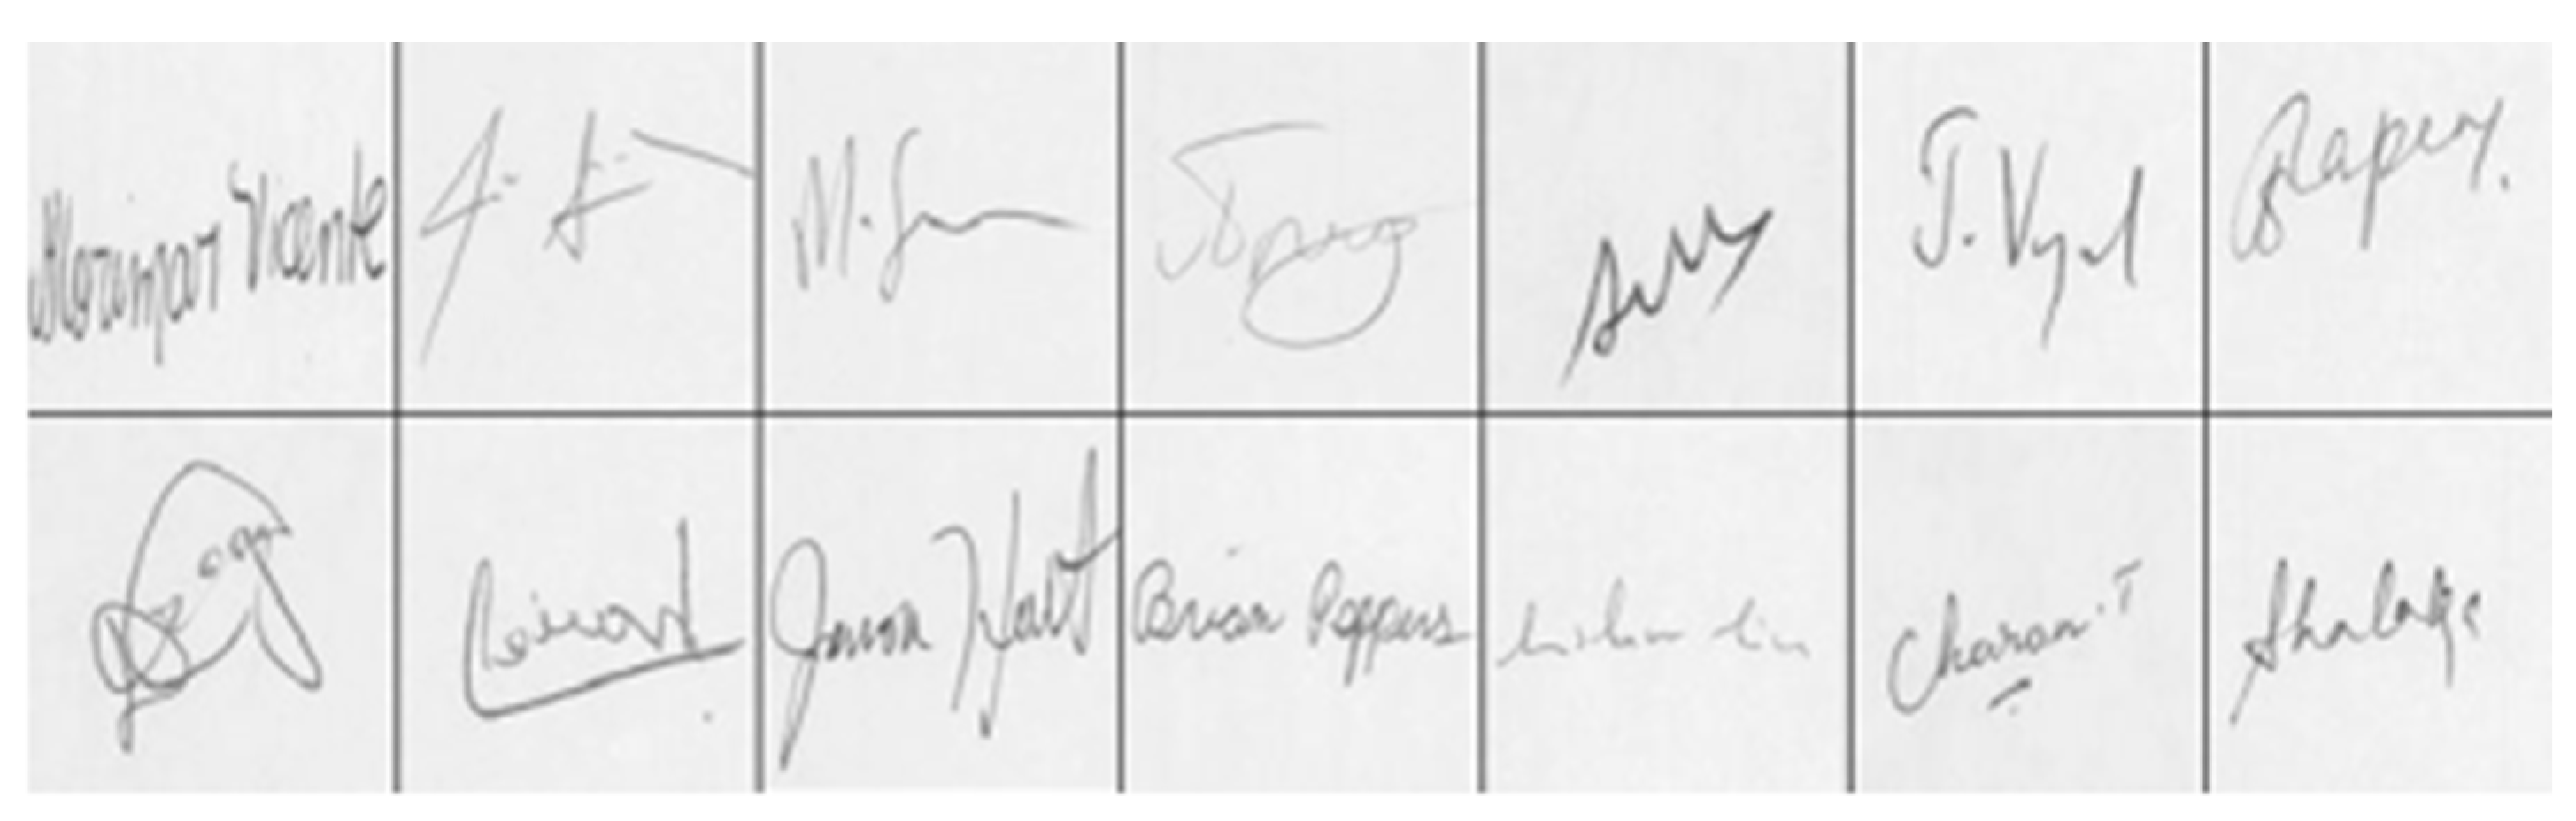
The second dataset used in the study, “Cedar Signature”, consists of real and forged signature images from 55 different people. Both real and forged signatures in this dataset have 55 different classes and each class consists of 24 different signature images. In this study, only real signature images were used. A sample image of the classes in the “Cedar Signature” dataset is shown in
Figure 3.
In image recognition and classification, preprocessing steps significantly affect the performance of the proposed CNN models [
25]. To improve the performance of the Si-CNN and Si-CNN+NC models, every image in both datasets was preprocessed. All images in the “C-Signatures” and “Cedar Signature” dataset used in the study were resized to 120 pixels × 120 pixels and trained.
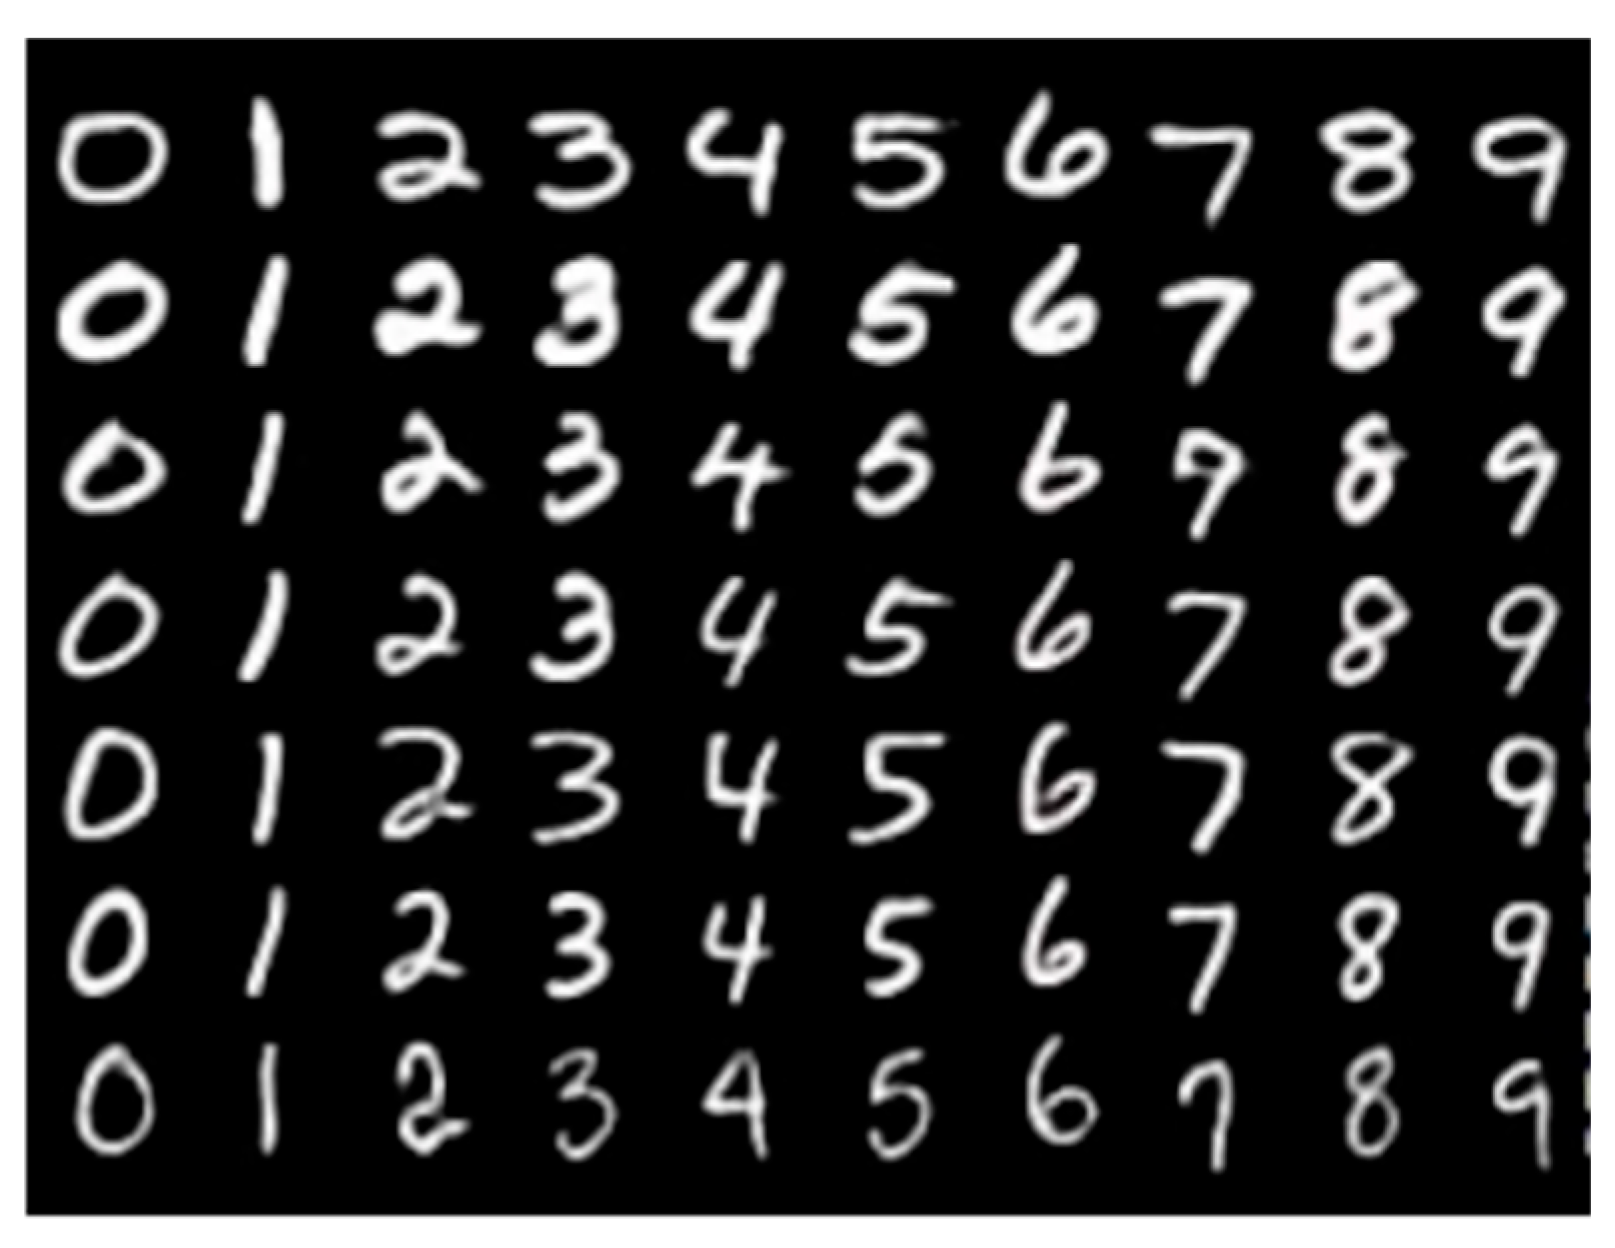
On a benchmark dataset, MNIST, the generalization capacities of the models were demonstrated [
26]. For this goal, the MNIST dataset was used to test the models that were trained on the signature image datasets.
Figure 4 provides a summary of the MNIST dataset.
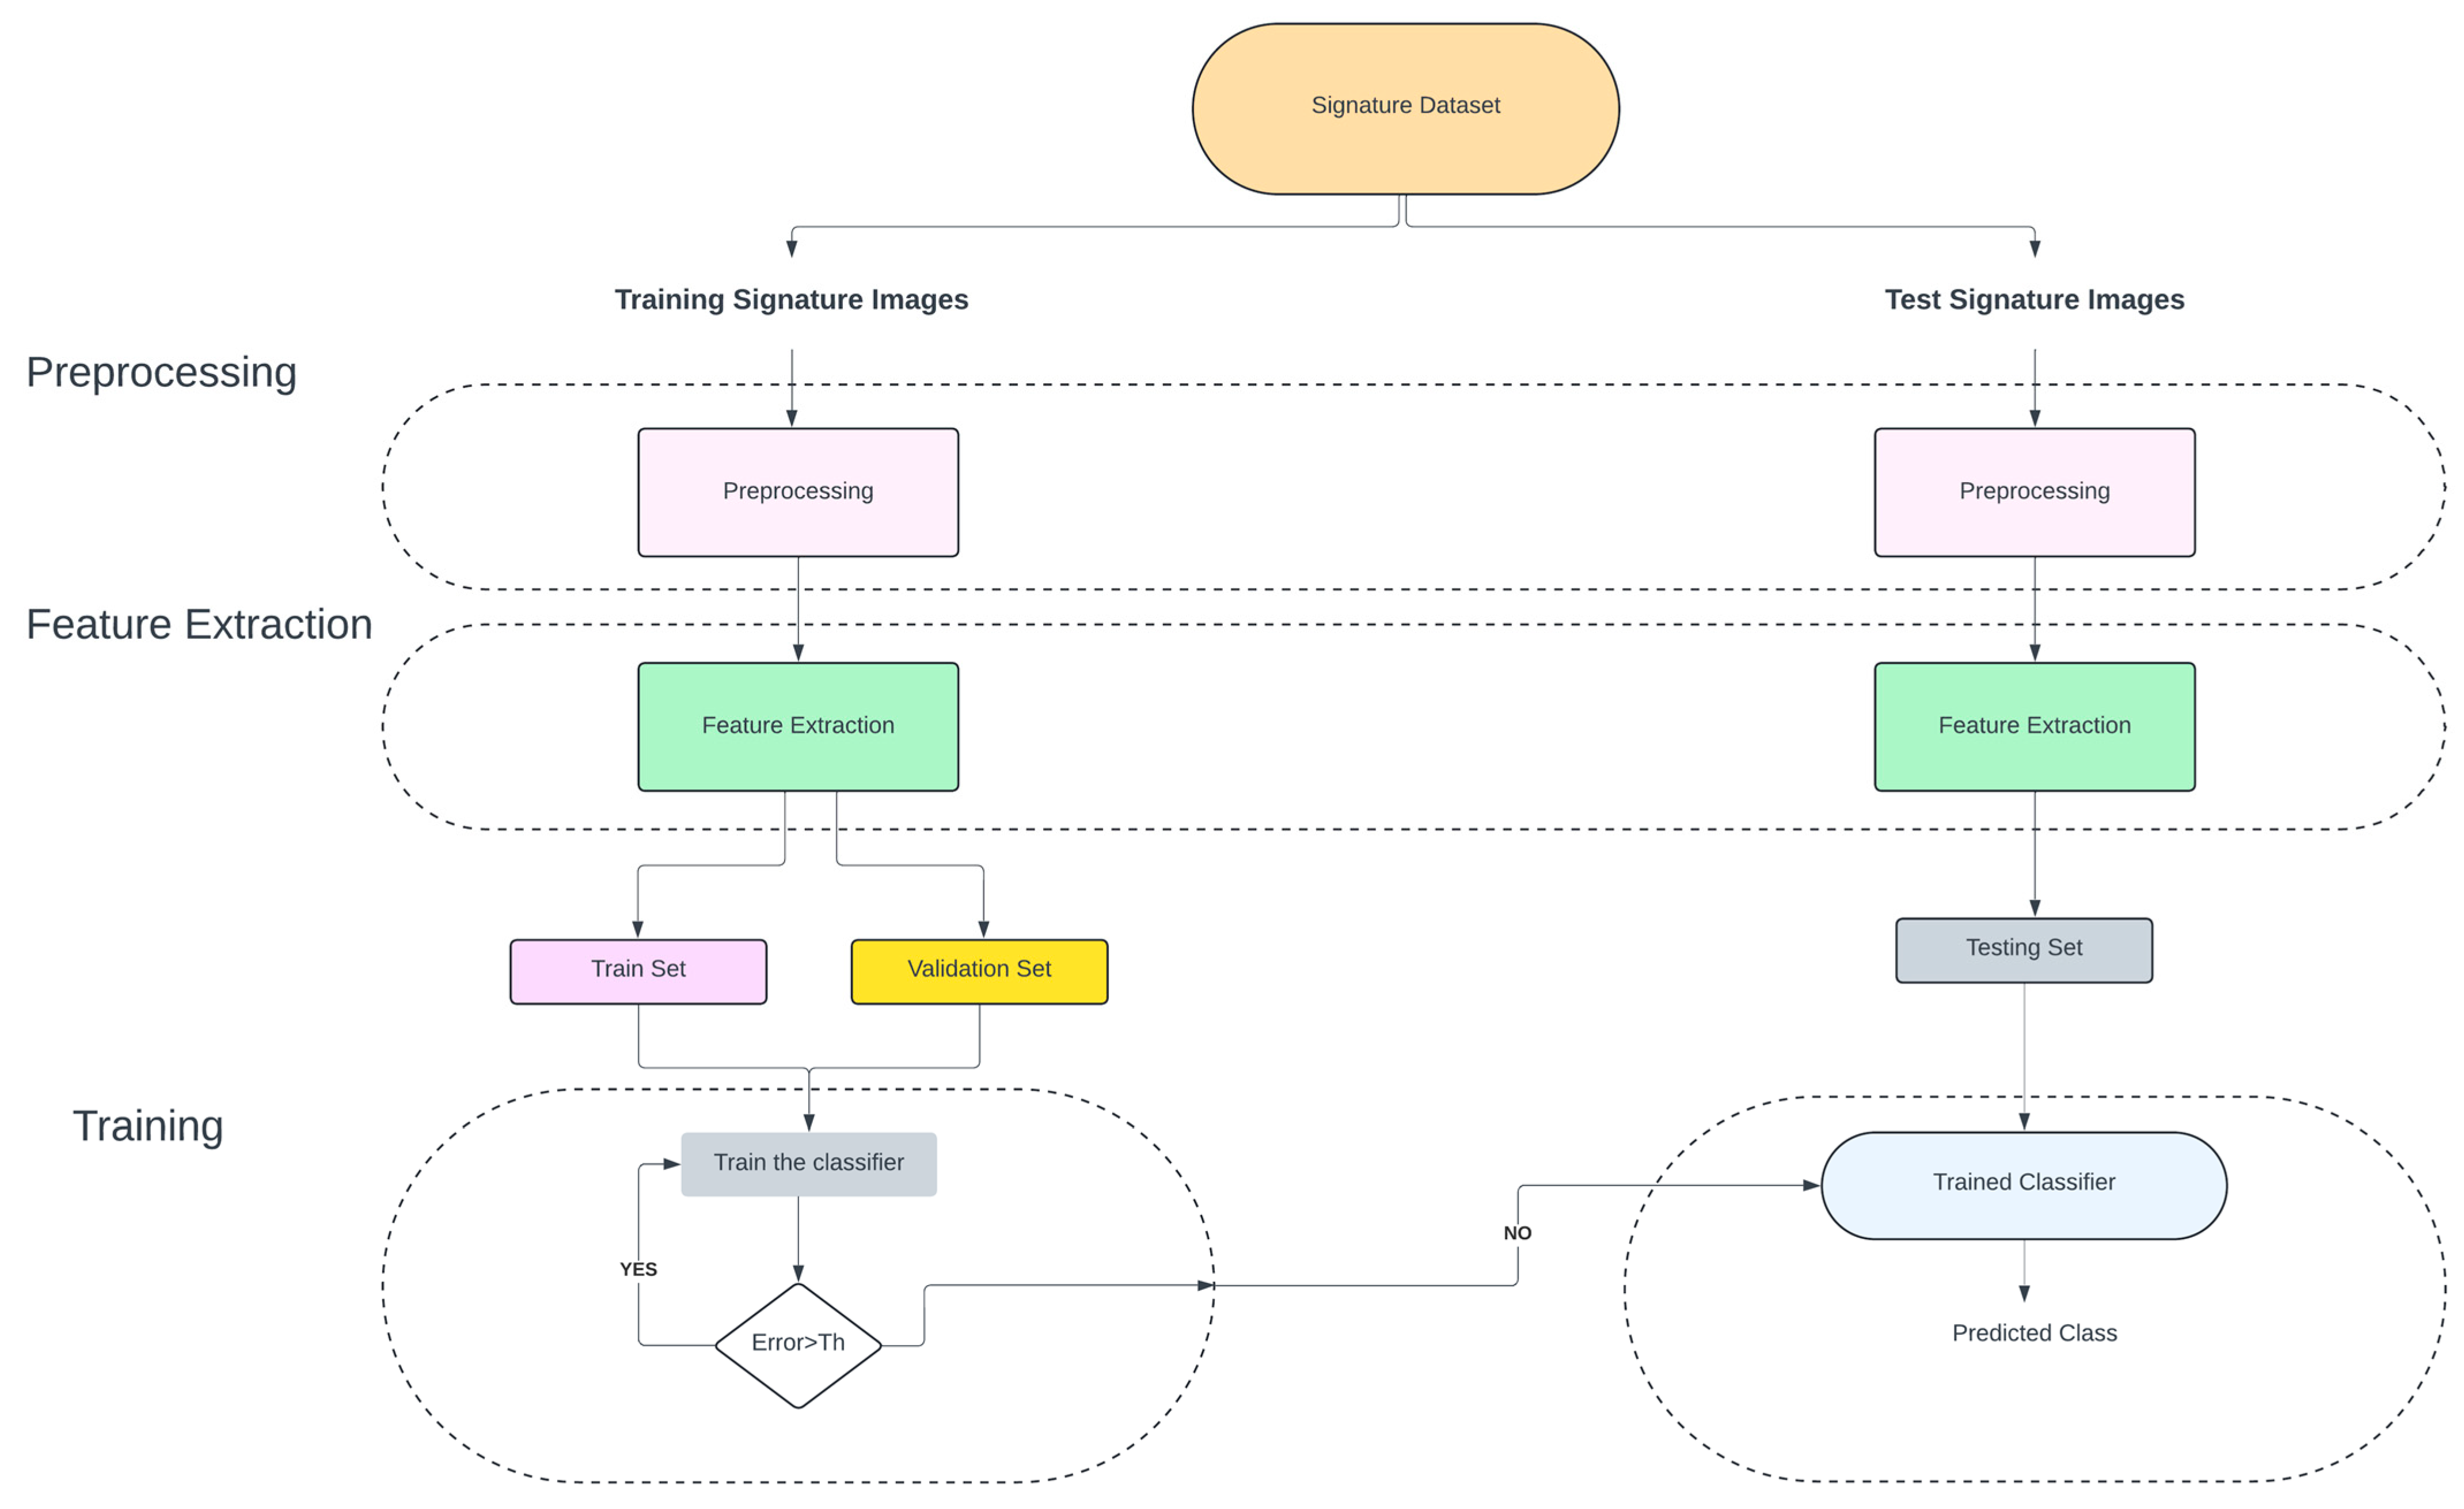
The aim of the proposed method is to provide an effective way to perform classification of handwritten signature images.
Figure 5 presents the overview of the proposed method. This method is divided into four different parts. They are listed as (i) pre-processing, (ii) feature extraction, (iii) training, and (iv) classification.
3.2. Background
Traditional machine learning algorithms need the experience and knowledge of experts for feature extraction and selection tasks, which are important tasks for data scientists. CNNs have the ability to perform feature selection and feature extraction from raw data compared to traditional machine learning algorithms [
27,
28]. In CNN architectures, there are two types of feature extraction: high-level and low-level. As they can efficiently learn high-level characteristics, CNNs are frequently employed to learn visual and semantic information. Due to their proximity to the inputs, low-level picture characteristics also include more thorough information [
29]. Many modern techniques combine low-level and high-level features into multi-layered features, which can considerably increase the network’s performance accuracy [
30]. In the U-net architecture, Ronneberger et al. combined low-level and high-level characteristics to obtain excellent accuracy in biomedical picture segmentation [
31].
One of the most popular classifiers is deep neural networks. They are highly preferred due to their modular design. CNN designs may be quickly customized to meet particular requirements by changing connections, adding special layers, and conducting experiments with a wide variety of activation functions [
32]. CNN architectures are generally composed of input, convolution, activation function, pooling, dropout, and fully connected layers with various variations. They are not limited to the layers mentioned here and there are various layers with different features. The input layer is the first layer in CNNs. The data presented to the network is first presented from this layer. The convolution layer is the layer where new feature matrices are obtained by circulating m × n filters whose dimensions and properties are determined by the developers on the data coming from the previous layer. The activation layer brings the matrix values obtained from the convolution layer to the range determined depending on the algorithm used. The pooling layer is the layer used to reduce the preceding data into smaller matrices. Although this data reduction process makes the network run faster, it may cause data loss in some cases. In the dropout layer, when the network has a small amount of data, there is a risk of overlearning. It is used to prevent the network from memorizing the training set. The fully connected layer is the layer that takes all the data from the previous layers and transforms it into a one-dimensional array matrix [
33]. The data from this layer is transferred directly to the classification layer as input.
Neural network designs learn to translate a collection of input training data to a set of outputs using deep learning. It is exceedingly challenging to determine the neural network weights that are the most ideal since there are so many variables. Instead, the learning problem is resolved via an algorithm. Stochastic gradient descent (SGD) and Adaptive Moment Estimation (Adam) optimization techniques are the typical algorithms utilized in neural networks. The “gradient” in gradient descent refers to an error gradient. Predictions are made using a model with certain weight values, and errors related to these predictions are computed. To reduce network loss is the major goal of researchers that are interested in deep neural networks. As a result, the value determined by the error function is referred to as “loss” [
34]. Choosing a loss function is necessary for determining the model’s error throughout the optimization phase. The chosen loss function must reflect the characteristics of the current issue. It will be quite challenging to obtain adequate outcomes if a well-performing loss function is not selected specifically for the issue [
35]. From hinge loss, logit loss, cross-entropy loss, to quadratic loss, etc., numerous loss functions exist. In addition to these, researchers can design and apply custom loss functions for CNN systems. The activation function employed in the neural network’s output layer has a direct impact on the loss function that is selected. These two design components are tied to one another, and harmony is crucial. From this point of view, construction of a new classification layer and loss function was attempted in addition to the Si-CNN model designed in the study. The Si-CNN model, the first CNN model constructed, as well as the pre-trained models employed in this study were categorized using standard cross-entropy, and the results were obtained. A new loss function was created for the Si-CNN+NC model, and classification outcomes were achieved. The major goal of this comparison is to assess the way the classification layer created for the Si-CNN+NC model performs in comparison to the classification layer used in Si-CNN and pre-trained models.
3.3. Si-CNN and Si-CNN+NC Models
3.3.1. Model Configuration
A brand-new CNN-based model is suggested for the task of classifying handwritten signature images. The Si-CNN and Si-CNN+NC models consist of 29 layers. An overview of the Si-CNN and Si-CNN+NC models is presented in
Figure 6. Si-CNN and Si-CNN+NC start with an input layer that accepts images. The input is then passed through an 8-filter convolutional layer (referred to as Conv.) to execute convolutional processing on it. CNN’s foundation is its convolution layer. Applying a certain filter to the image allows for the detection of low-level features in some images, followed by the detection of higher-level features. Low-level features in an image are the tiniest components, such as lines, colors, or dots, while high-level features, which are used to identify objects and more substantial forms in an image, are built from low-level features [
36]. In order to learn high-level features, CNNs are trained on large image datasets. Thus, CNNs can learn to identify and extract high-level features [
37].
The ReLU activation function was applied following the convolution layer. The ReLU activation function [
38] was used as the activation function since it returns the non-linear negative inputs as 0 and the positive values are unchanged. Convolution and activation layers were used again. After this layer, batch normalization, max pooling, and dropout layers were used, respectively. The reasons for using the layers in this order are as follows: the process of batch normalization involves averaging each activation output’s mean and standard deviation across all samples in the minibatch [
39]. In the Si-CNN and Si-CNN+NC models, batch normalization was used after convolution and fully connected layers. The training time for the neural network is shortened by max pooling. Additionally, by applying the maximum function to the pooling window, it can be utilized as a sampling strategy to lower the input size of the images [
40]. A max pooling layer with pooling dimensions of (2 × 2) was used, which resulted in a two-fold reduction in both width and height. The model performs better in terms of accuracy when categorizing the provided samples into the classes they belong to because the size of the incoming images is also reduced [
41]. Dropout is a popular solution suggested to get around the overfitting problem [
42]. In order to prevent memorizing, dropout randomly removes neurons from the neural network during training. To avoid overfitting, a dropout layer was used after the batch normalization layers. In addition, max pooling layers additionally help in reducing the issue of overfitting. The convolution (1), convolution (2), batch normalization, max pooling, and dropout layers were designed to extract the features of the images in a total of 4 iterations. During these iterations, convolution (1) and convolution (2) filters were increased by 8, 16, 32, and 32. After this iterative structure, a fully connected layer of 128 units was used. ReLU was utilized as the activation function for this fully connected layer, just like it was for the conv layers. After this layer, batch normalization and dropout layers were used. Fully connected, batch normalization, and dropout layers were also repeated 2 times. During these repetitions, the fully connected layer continued to decrease from 128 to 64, and so on. The output layer of the suggested model uses a 55-unit fully connected layer and a softmax activation function to classify the acquired image into 55 categories. The Si-CNN model’s classification layer uses cross-entropy as the error function. A new network model called Si-CNN+NC was developed, replacing the Si-CNN model’s classification layer with the Si-CL special classification layer. The formula for the error function used in the Si-CL layer is given in Equation (1). In the Equation, YJ stands for input; TJ stands for target; N stands for normalization; and K stands for the number of classes. The layers of the network structures of the Si-CNN and Si-CNN+NC models are presented in
Table 1. All layers except the last layer in the table were used in the same way in the Si-CNN and Si-CNN+NC models. The only difference between the Si-CNN+NC model and the Si-CNN model is that the classifier layer is different.
3.3.2. Models Training
CNNs use a loss function to estimate the model’s loss, which is then utilized to update the neuronal weights in order to minimize the loss. For the Si-CNN model, in the proposed work, the Adam algorithm, which is an extension of Stochastic Gradient Descent (SGD), was used as the optimization algorithm of the model. Adam is an optimization algorithm that calculates adaptive learning rates for each network parameter [
43].
CNN networks’ hyper-parameters are determined empirically and significantly affect the learning process. For this reason, experiments need to be made over a wide range of values to reveal the most optimized model in terms of classification performance. A range of commonly used values, listed in
Table 2, were tried and the most suitable values are shown in bold.
Deep neural networks are currently among the most widely used classifiers. Although they easily achieve a very good performance, one of the best-selling points of these models is their modular design; architectures can be easily adapted to specific needs, special layers can be added, connection patterns can be changed, normalization schemes can be made, and experiments can be made with numerous activation functions. While an impressively wide spread of various configurations of almost every aspect of deep networks can be found, classification problems are often poorly represented [
32]. The vast majority of applications use only log loss. Starting from this point, the loss function of the classification layer in the Si-CNN model was formulated specifically for the study.
Following the model proposal, the model was trained using a recall that controlled the training in the following ways: (1) EarlyStopping, which is in charge of terminating the training if the monitored criterion does not improve for a predetermined number of epochs; this ensures that the training has an optimum time at the most advantageous moment and avoids the model from becoming overfit [
44].
To enhance the performance of Si-CNN and Si-CNN+NC architectures in training:
Early Stopping technique was used.
Evaluations were made by separating the datasets into training, testing, and validation.
Hyper-parameter optimization was performed and the most appropriate hyper-parameters were used.
More accurate and faster results were obtained by developing a new loss function in the Si-CNN+NC architecture.
3.4. Benchmarking Models
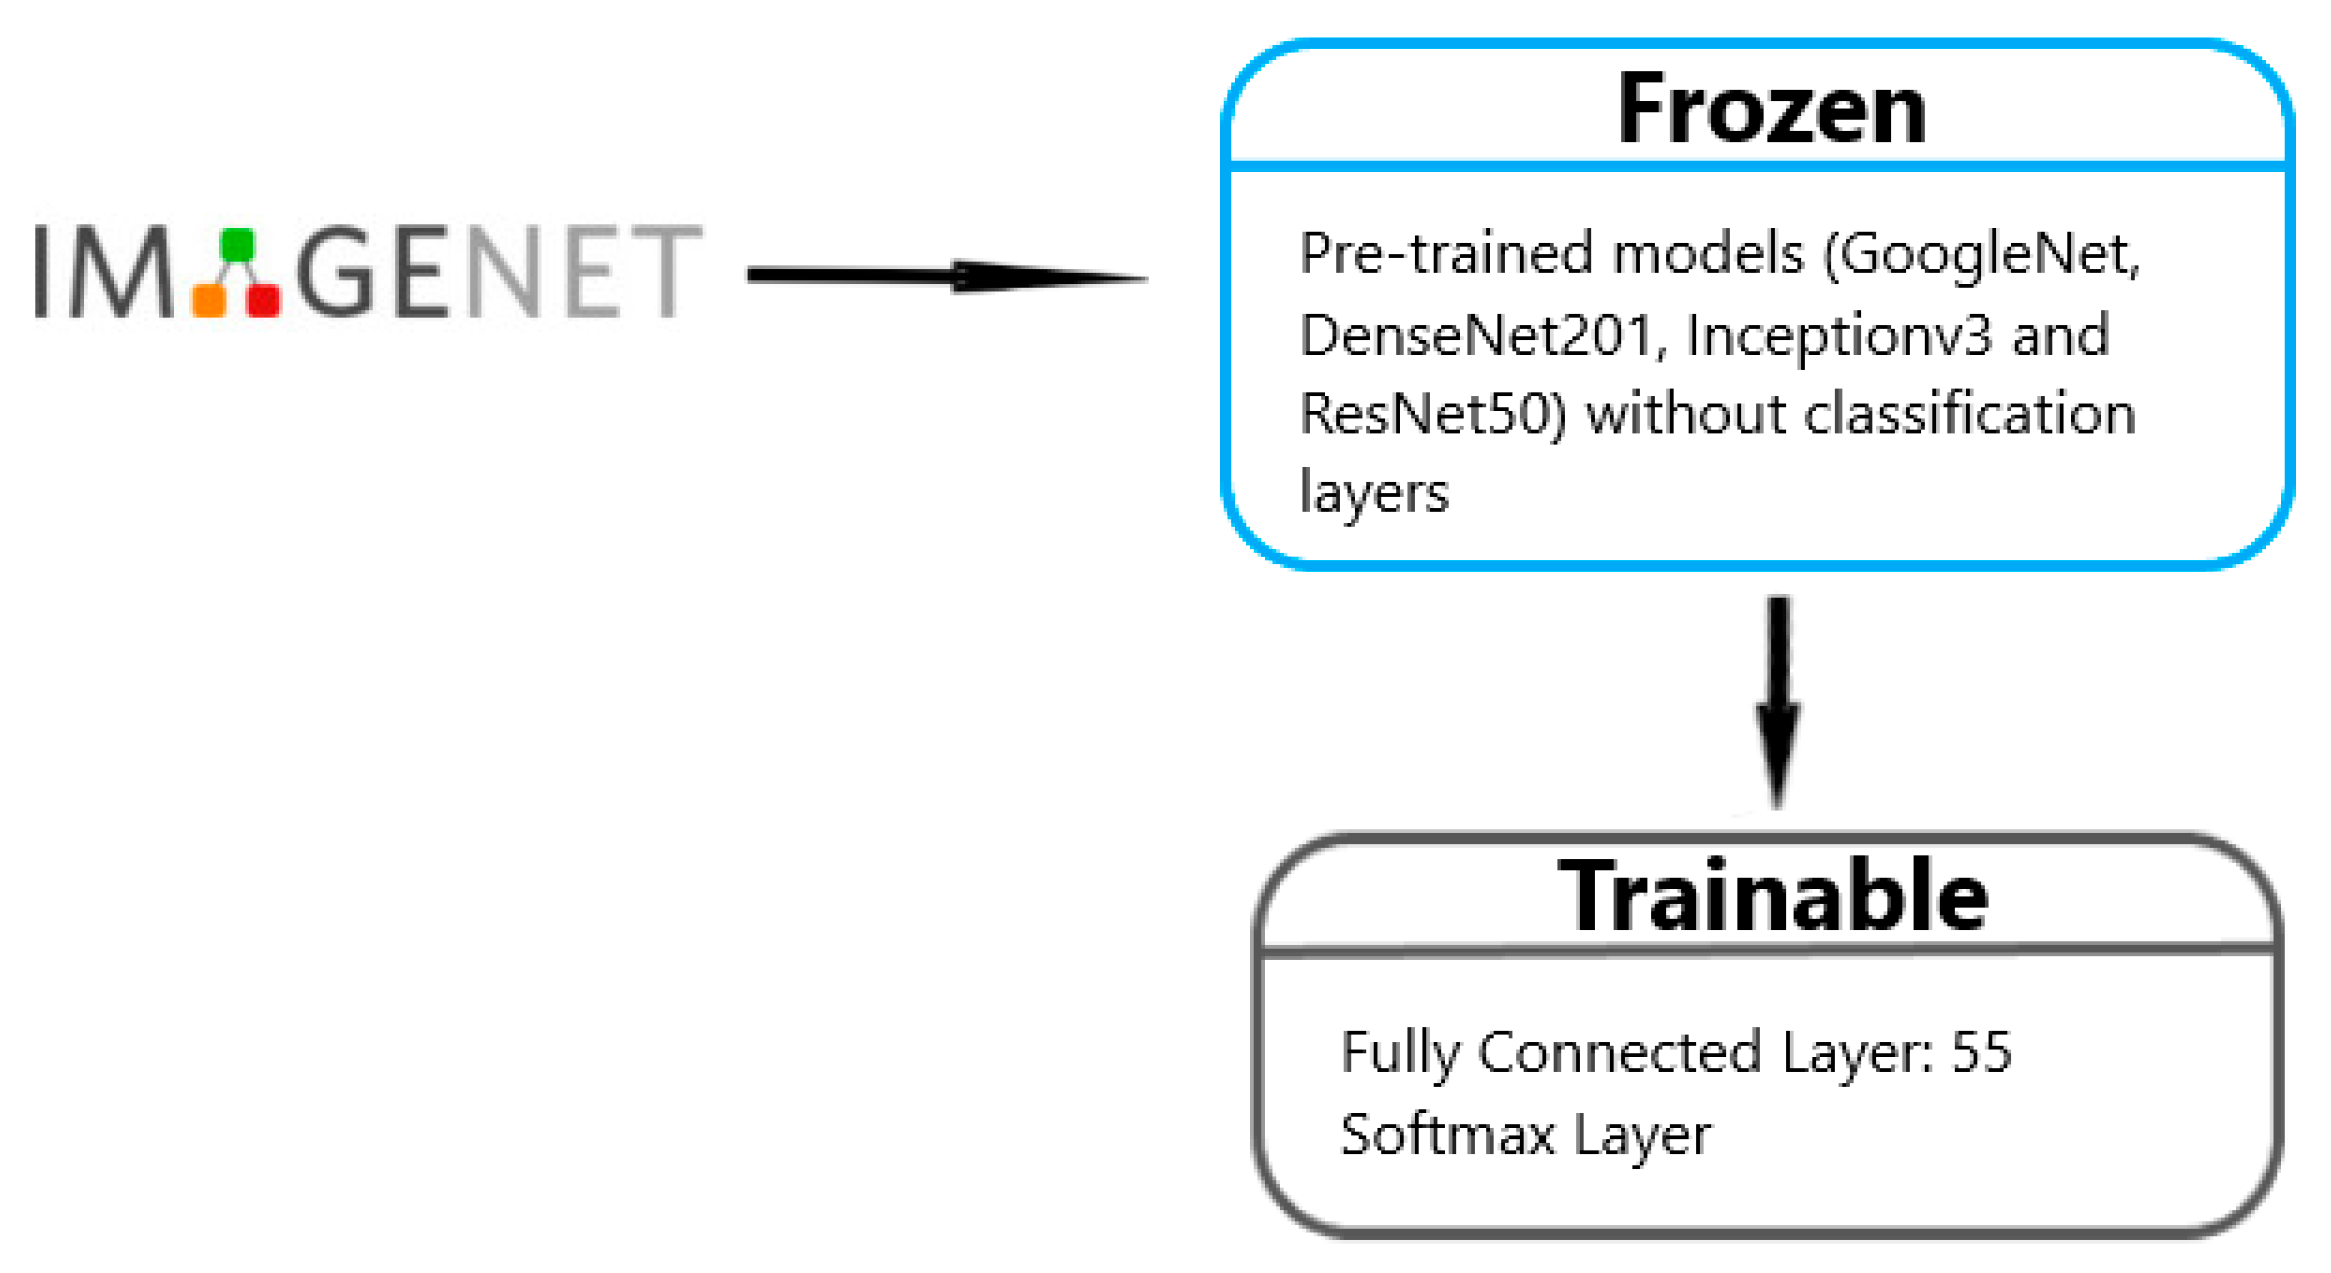
To evaluate the effectiveness of the Si-CNN and Si-CNN+NC models, four different models, namely, Inceptionv3, GoogleNet, ResNet50, and DenseNet201, were used with the transfer learning technique [
45]. The feature extraction layers of the pre-trained models are not trained in order to implement this strategy. The widely used ImageNet [
46] dataset served as the training ground for these pre-trained algorithms. The layer weights generated for ImageNet were applied as a result. Information is transmitted in this way.
Table 2 lists the (1) Top-1 accuracy rate obtained from ImageNet, (2) depth, and (3) number of parameters of the models used in the study.
Inceptionv3, The Inception-V3 model, is the updated version of the Inception-V1 model. It has a wider network than the Inception-V1 and V2 models. The Inception-V3 model is a deep CNN trained directly on a low-configuration computer [
47].
GoogLeNet, with an error rate of 6.66%, is the model that won the 2014 ILSVRC Imagenet competition among the compared models used in the study. GoogLeNet no longer arranges its layers in a sequential fashion. In order to reduce the memory cost of the network and reduce the probability of memorization of the network, GoogLeNet uses initial modules connected to each other in parallel instead of adding many consecutive layers and using filters. In GoogLeNet, 1 × 1, 3 × 3, 5 × 5 convolution filters are then collected in the inception module and given as input to the next layer. Thanks to this module, both general and specific features of an object are extracted [
48]. The input size of the GoogLeNet architecture is given as 224 × 224 × 3.
DenseNet201: This architecture was created by Huang et al. to ensure information transfer. In this architecture, for each layer, the outputs of the previous layers become input values. DenseNet network architecture significantly reduces the disappearing gradient problem. The DenseNet model has a reduced number of parameters to perform this process. DenseNet201 also has a total of 201 layers consisting of a 7 × 7 convolution filter followed by a 3 × 3 MaxPool as the first layer, 196 convolutional layers with 3 average pooling layers in between, and 1 output [
49]. The input size to the DenseNet201 architecture is given as 224 × 224 × 3.
ResNet50: It is a model developed in 2015. The ResNet model won the 2015 ILSVRC ImageNet competition. ILSVRC is a structure that came first in the competition held in 2015 with an error rate of 3.6%. It is one of the first algorithms to use batch normalization. The network requires input images of size 224 × 224 × 3 [
50]. These custom models, which were built for this work and are designated with TGoogleNet, TResnet50, and TDenseNet201, respectively, were applied to the binary image classification task because the original models were created for their own classification tasks.
The transfer learning approach employed did not include the classification-related layers because the pre-trained models were created specifically for their classification tasks. The number of trainable parameters was greatly decreased by transferring the weights from the ImageNet dataset to the layers of the pre-trained models. For instance, the original DenseNet201 has 20.2 M trainable parameters, as shown in
Table 3. The DenseNet201 model has 3.8 K trainable parameters when utilized with the transfer learning technique. It offers significant time savings in this regard.
Table 4 provides a comparison of the deep neural network trainable parameters for transfer learning. The final layers of these four models, which are in charge of categorization, are not incorporated in the models that were constructed for this reason. The completely linked layer of the model was put after the basic layers in place of the classification layers, as shown in
Figure 7. These designs are referred to in this work as SInceptionv3, SGoogleNet, SResnet50, and SDenseNet201 since they were created for specific tasks of classification. These previously developed specialized models were applied to classify handwritten signature images on two different datasets.
4. Experimental Results
The equipment of the computer used for training the model is essential for future research. The Si-CNN and Si-CNN+NC models and the compared models were tested on Matlab R2020a software installed on a Windows 11 operating system. The specifications of the computer used are: Intel i5-9400 CPU, 2.9 GHz processor, and 8 GB Ram memory.
The precise assessment criteria of accuracy, precision, recall, and f1-score were employed to assess the classification performance of the Si-CNN and Si-CNN+NC models. The term “
TP” refers to samples that are both really indicative of a positive state and are classified as such by the classifier.
TN refers to cases that the classifier predicts as negative but which truly indicate a negative situation. FP stands for cases that the classifier predicts as positive but really indicate a negative condition.
FN denotes cases that the classifier predicts as negative but actually indicate a positive condition. The most common evaluation statistic is accuracy, which is just the proportion of properly predicted cases to all instances. Precision is defined as the proportion of accurately anticipated positives to all positive observations. The proportion of accurately anticipated positives to all positives is known as recall [
51]. The
F1-score is the harmonic mean of precision and recall and is more useful than accuracy for unbalanced datasets. The equations for the techniques used are presented as (2), (3), (4), and (5).
The Si-CNN and Si-CNN+NC models, SGoogleNet, SResNet50, SInceptionv3, and SDenseNet201 architectures were evaluated on three different datasets. The first dataset used in the study is the “C-Signatures” dataset, the second is the “Cedar Signature” dataset, and the third is the “MNIST” dataset. Both datasets consist of 55 classes and each class has 24 different images. Both datasets consist of 1320 handwritten signature images. The information about the datasets used in this study is listed in
Table 5. In machine learning processes, the datasets are divided into three different clusters: (1) training set for training the model, (2) validation set to measure the effect of training, and (3) test set to measure the final accuracy of the model. In all experiments, 20% of the dataset to be processed was used as a test set. The rest of the datasets were used as follows: 20% of the remaining part was divided into a validation set and 80% into a training set. As a result, 16% of the datasets were used as validation, 20% as test set, and 64% as training set. The training of all models used in the study was evaluated under the same conditions and the results are presented.
4.1. Experiments with the “C-Signatures” Dataset
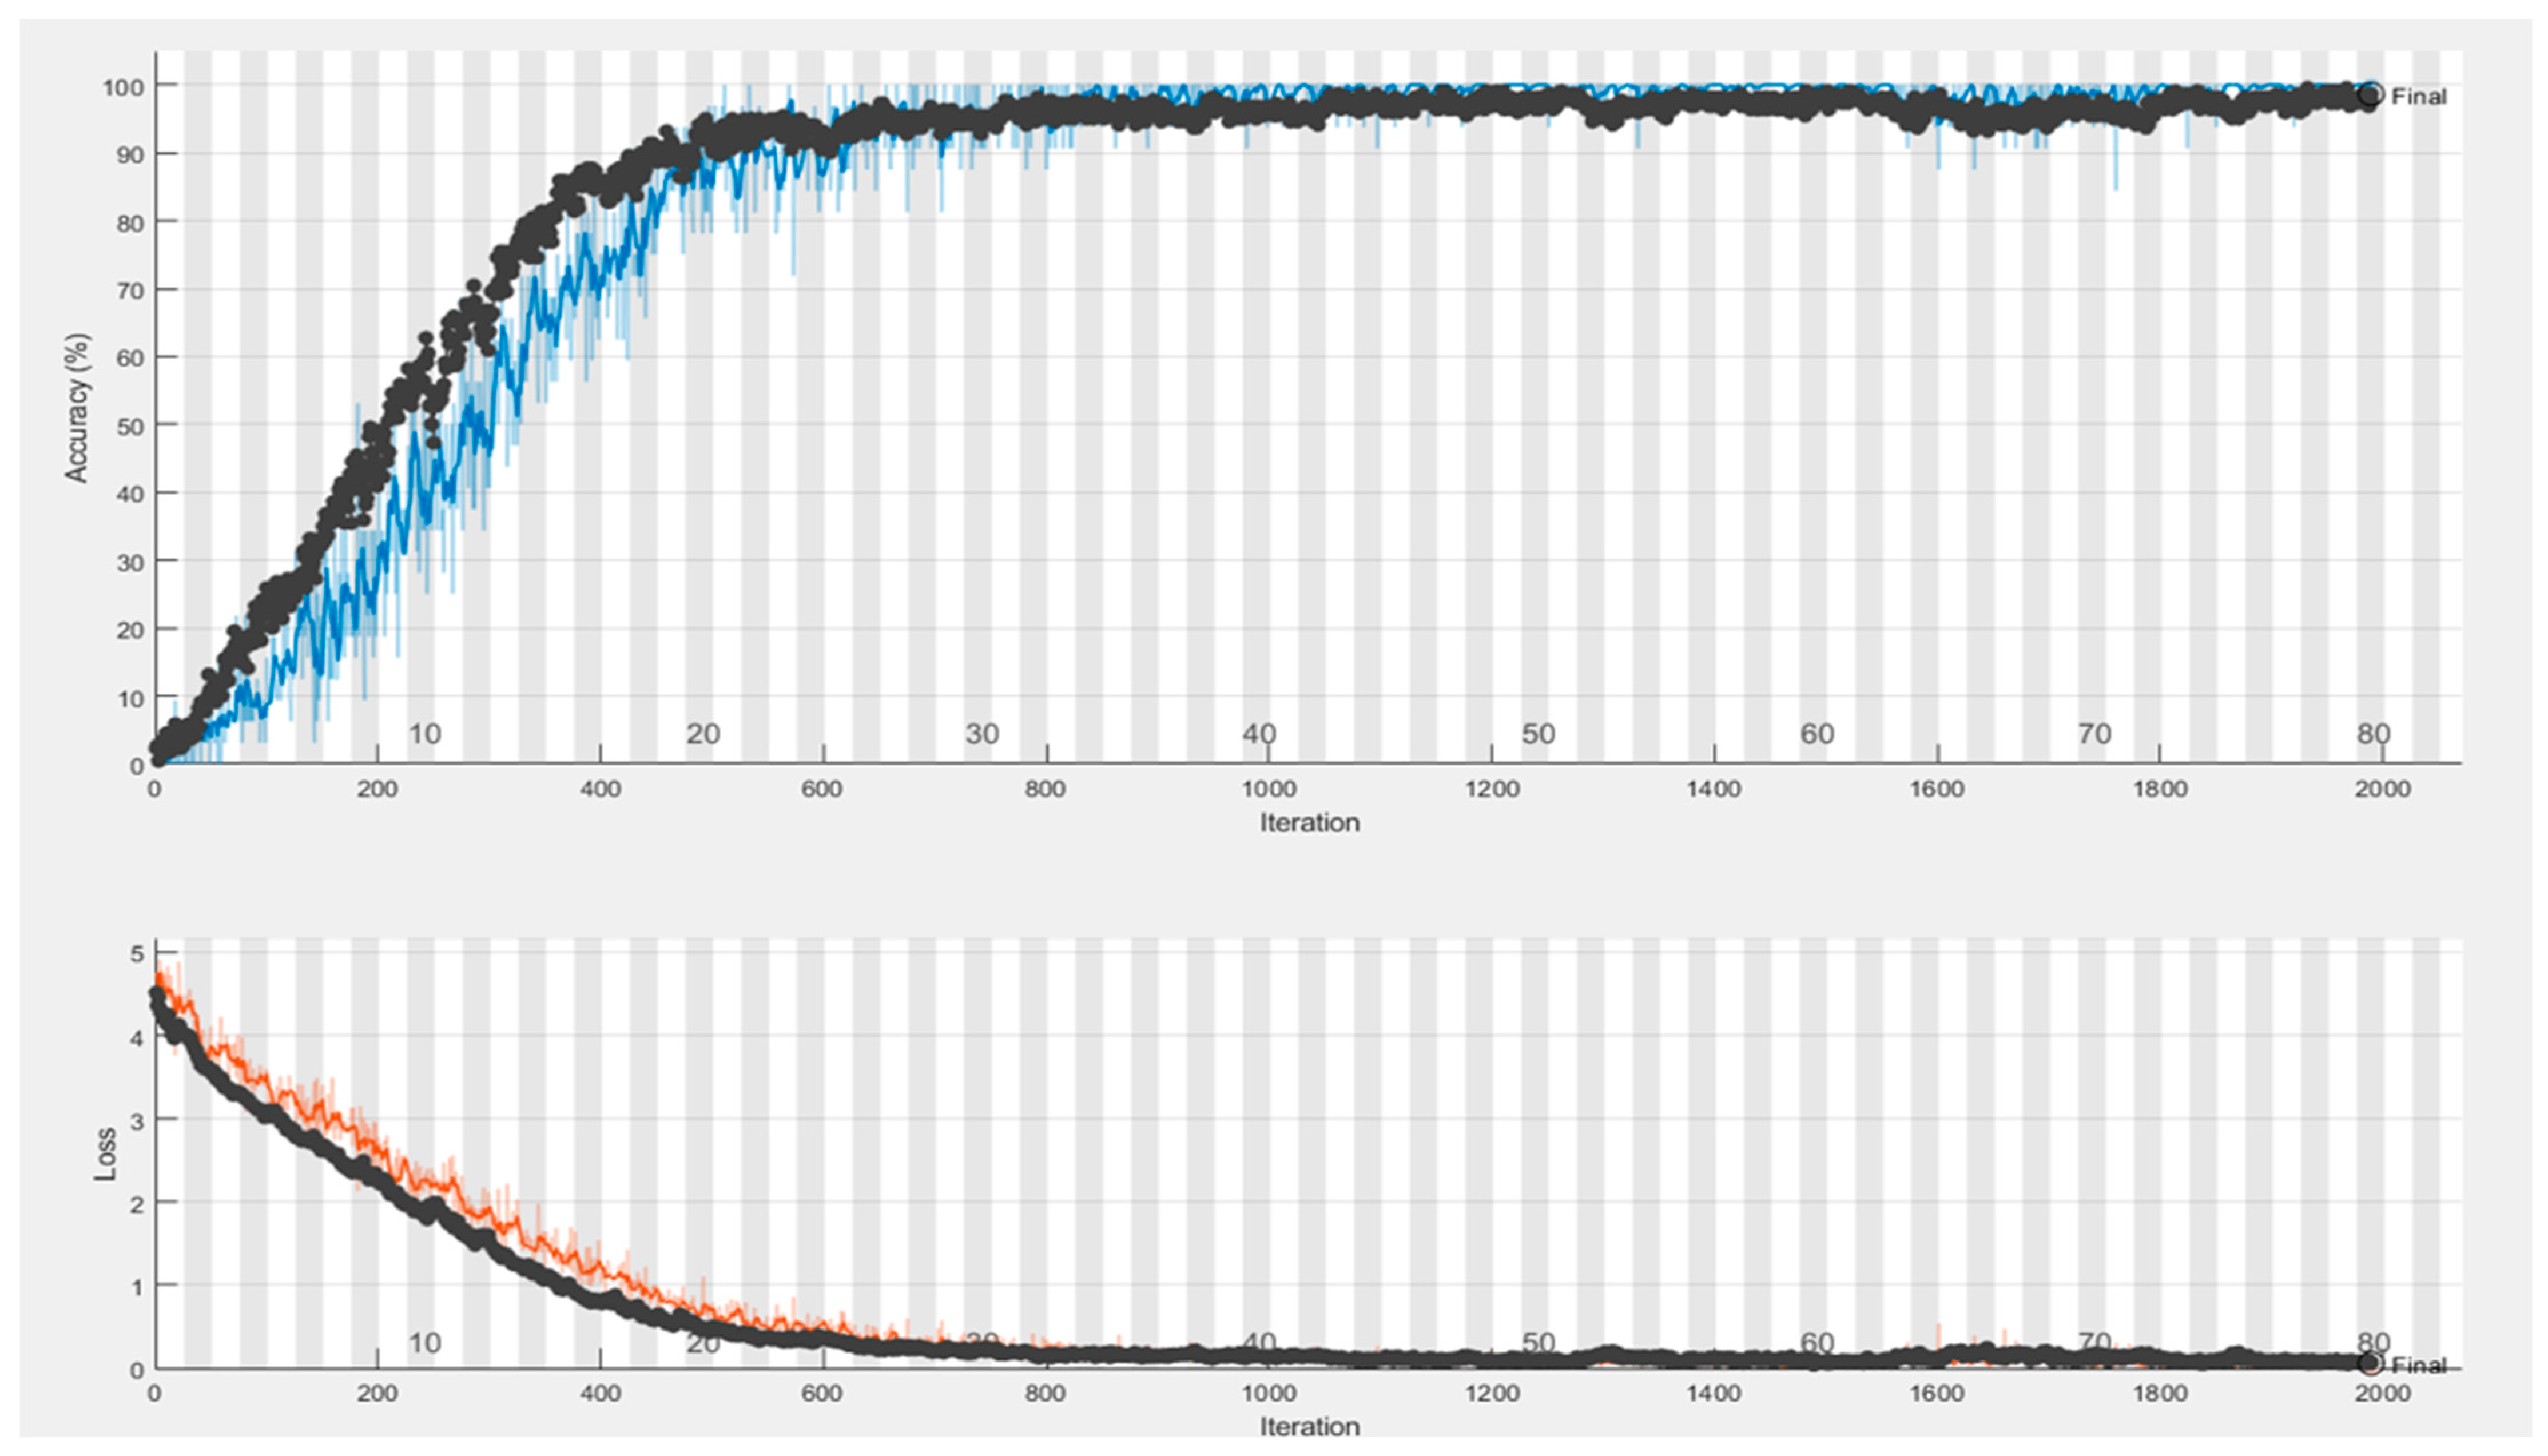
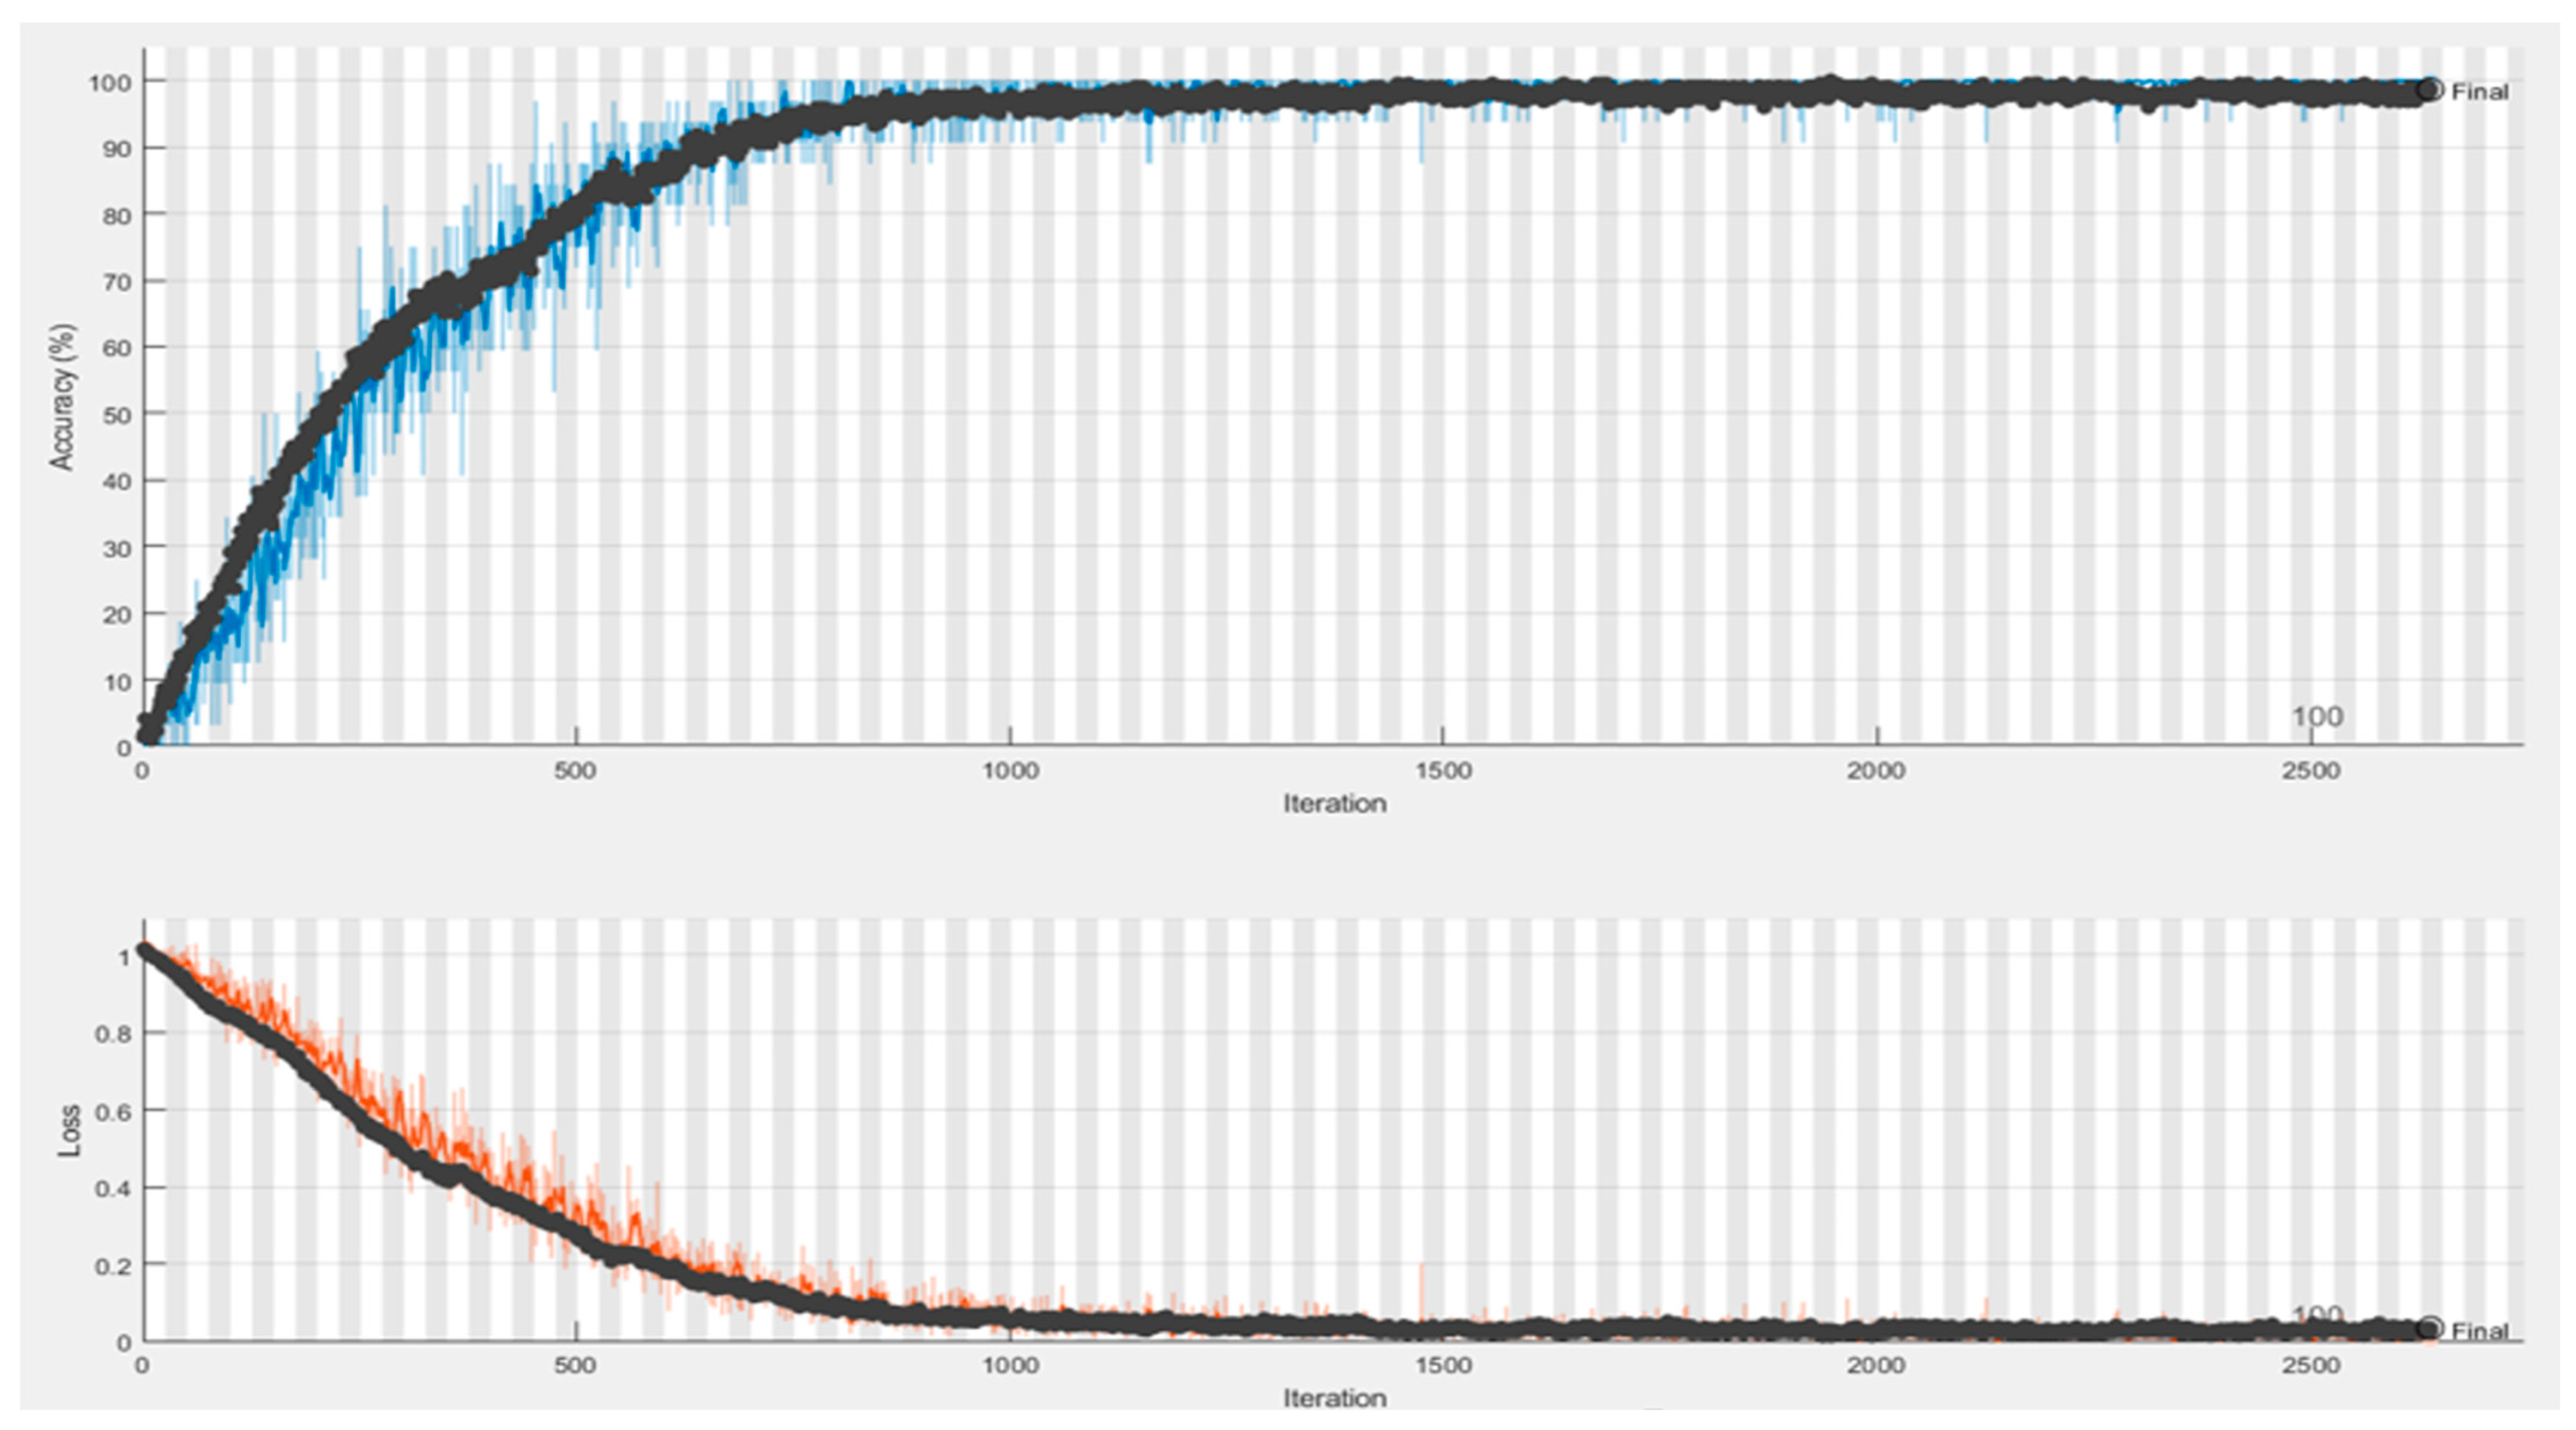
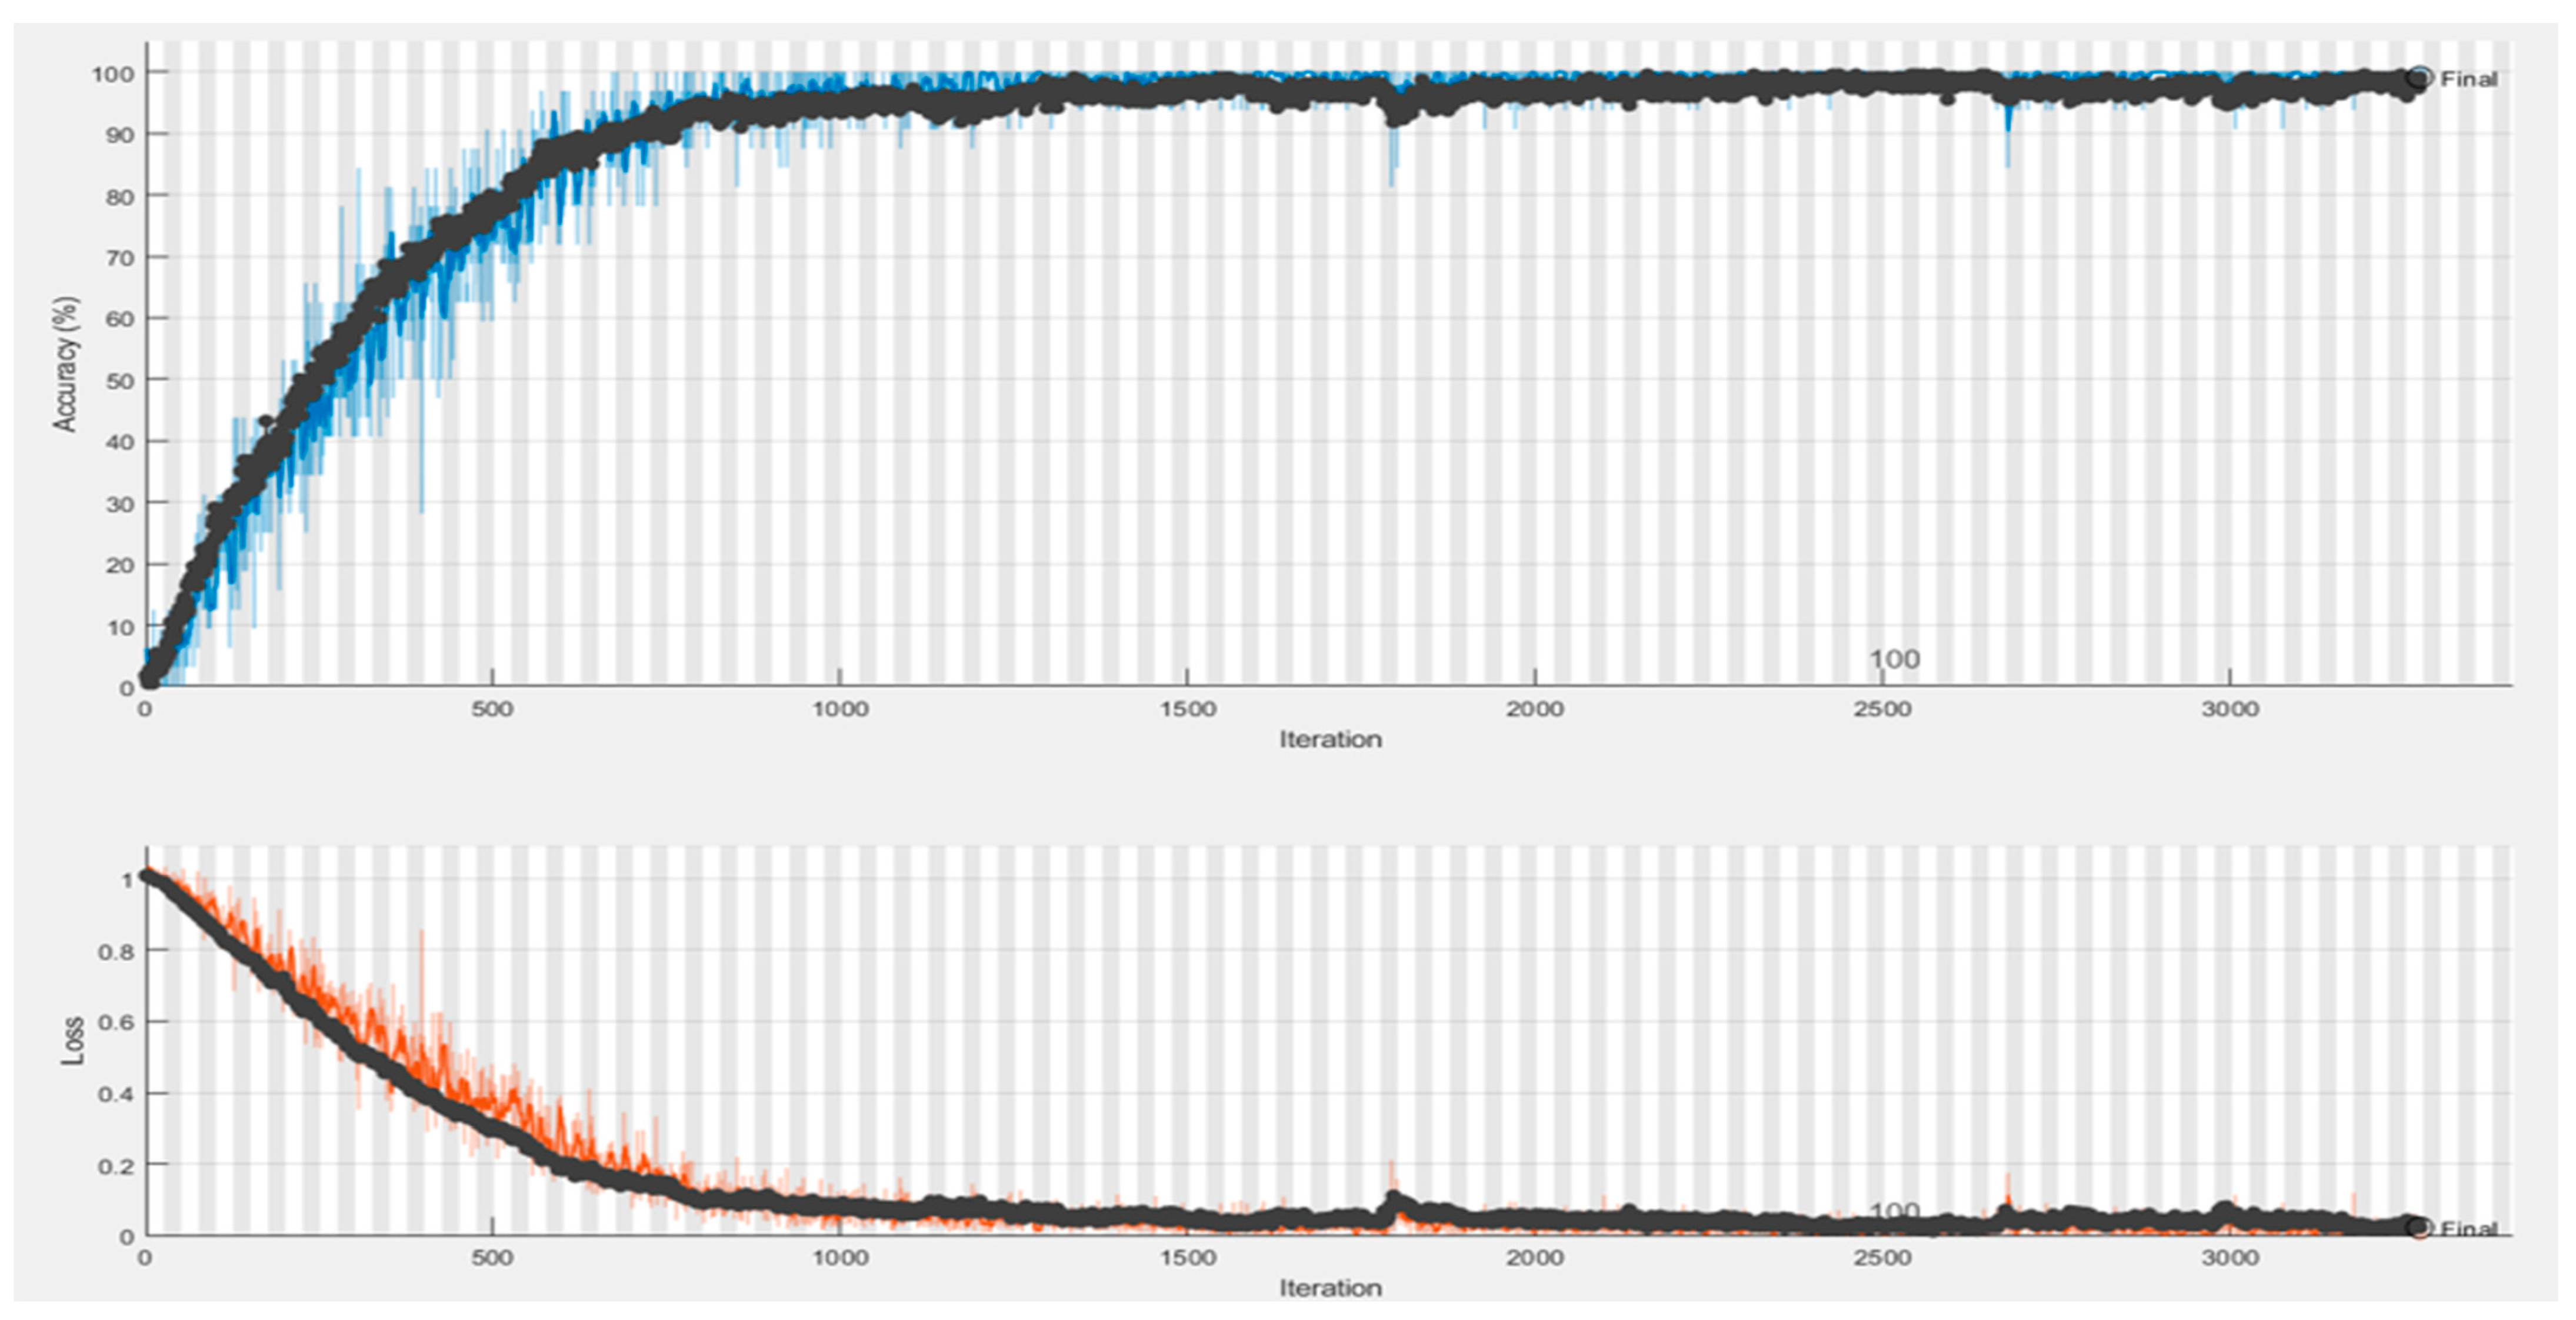
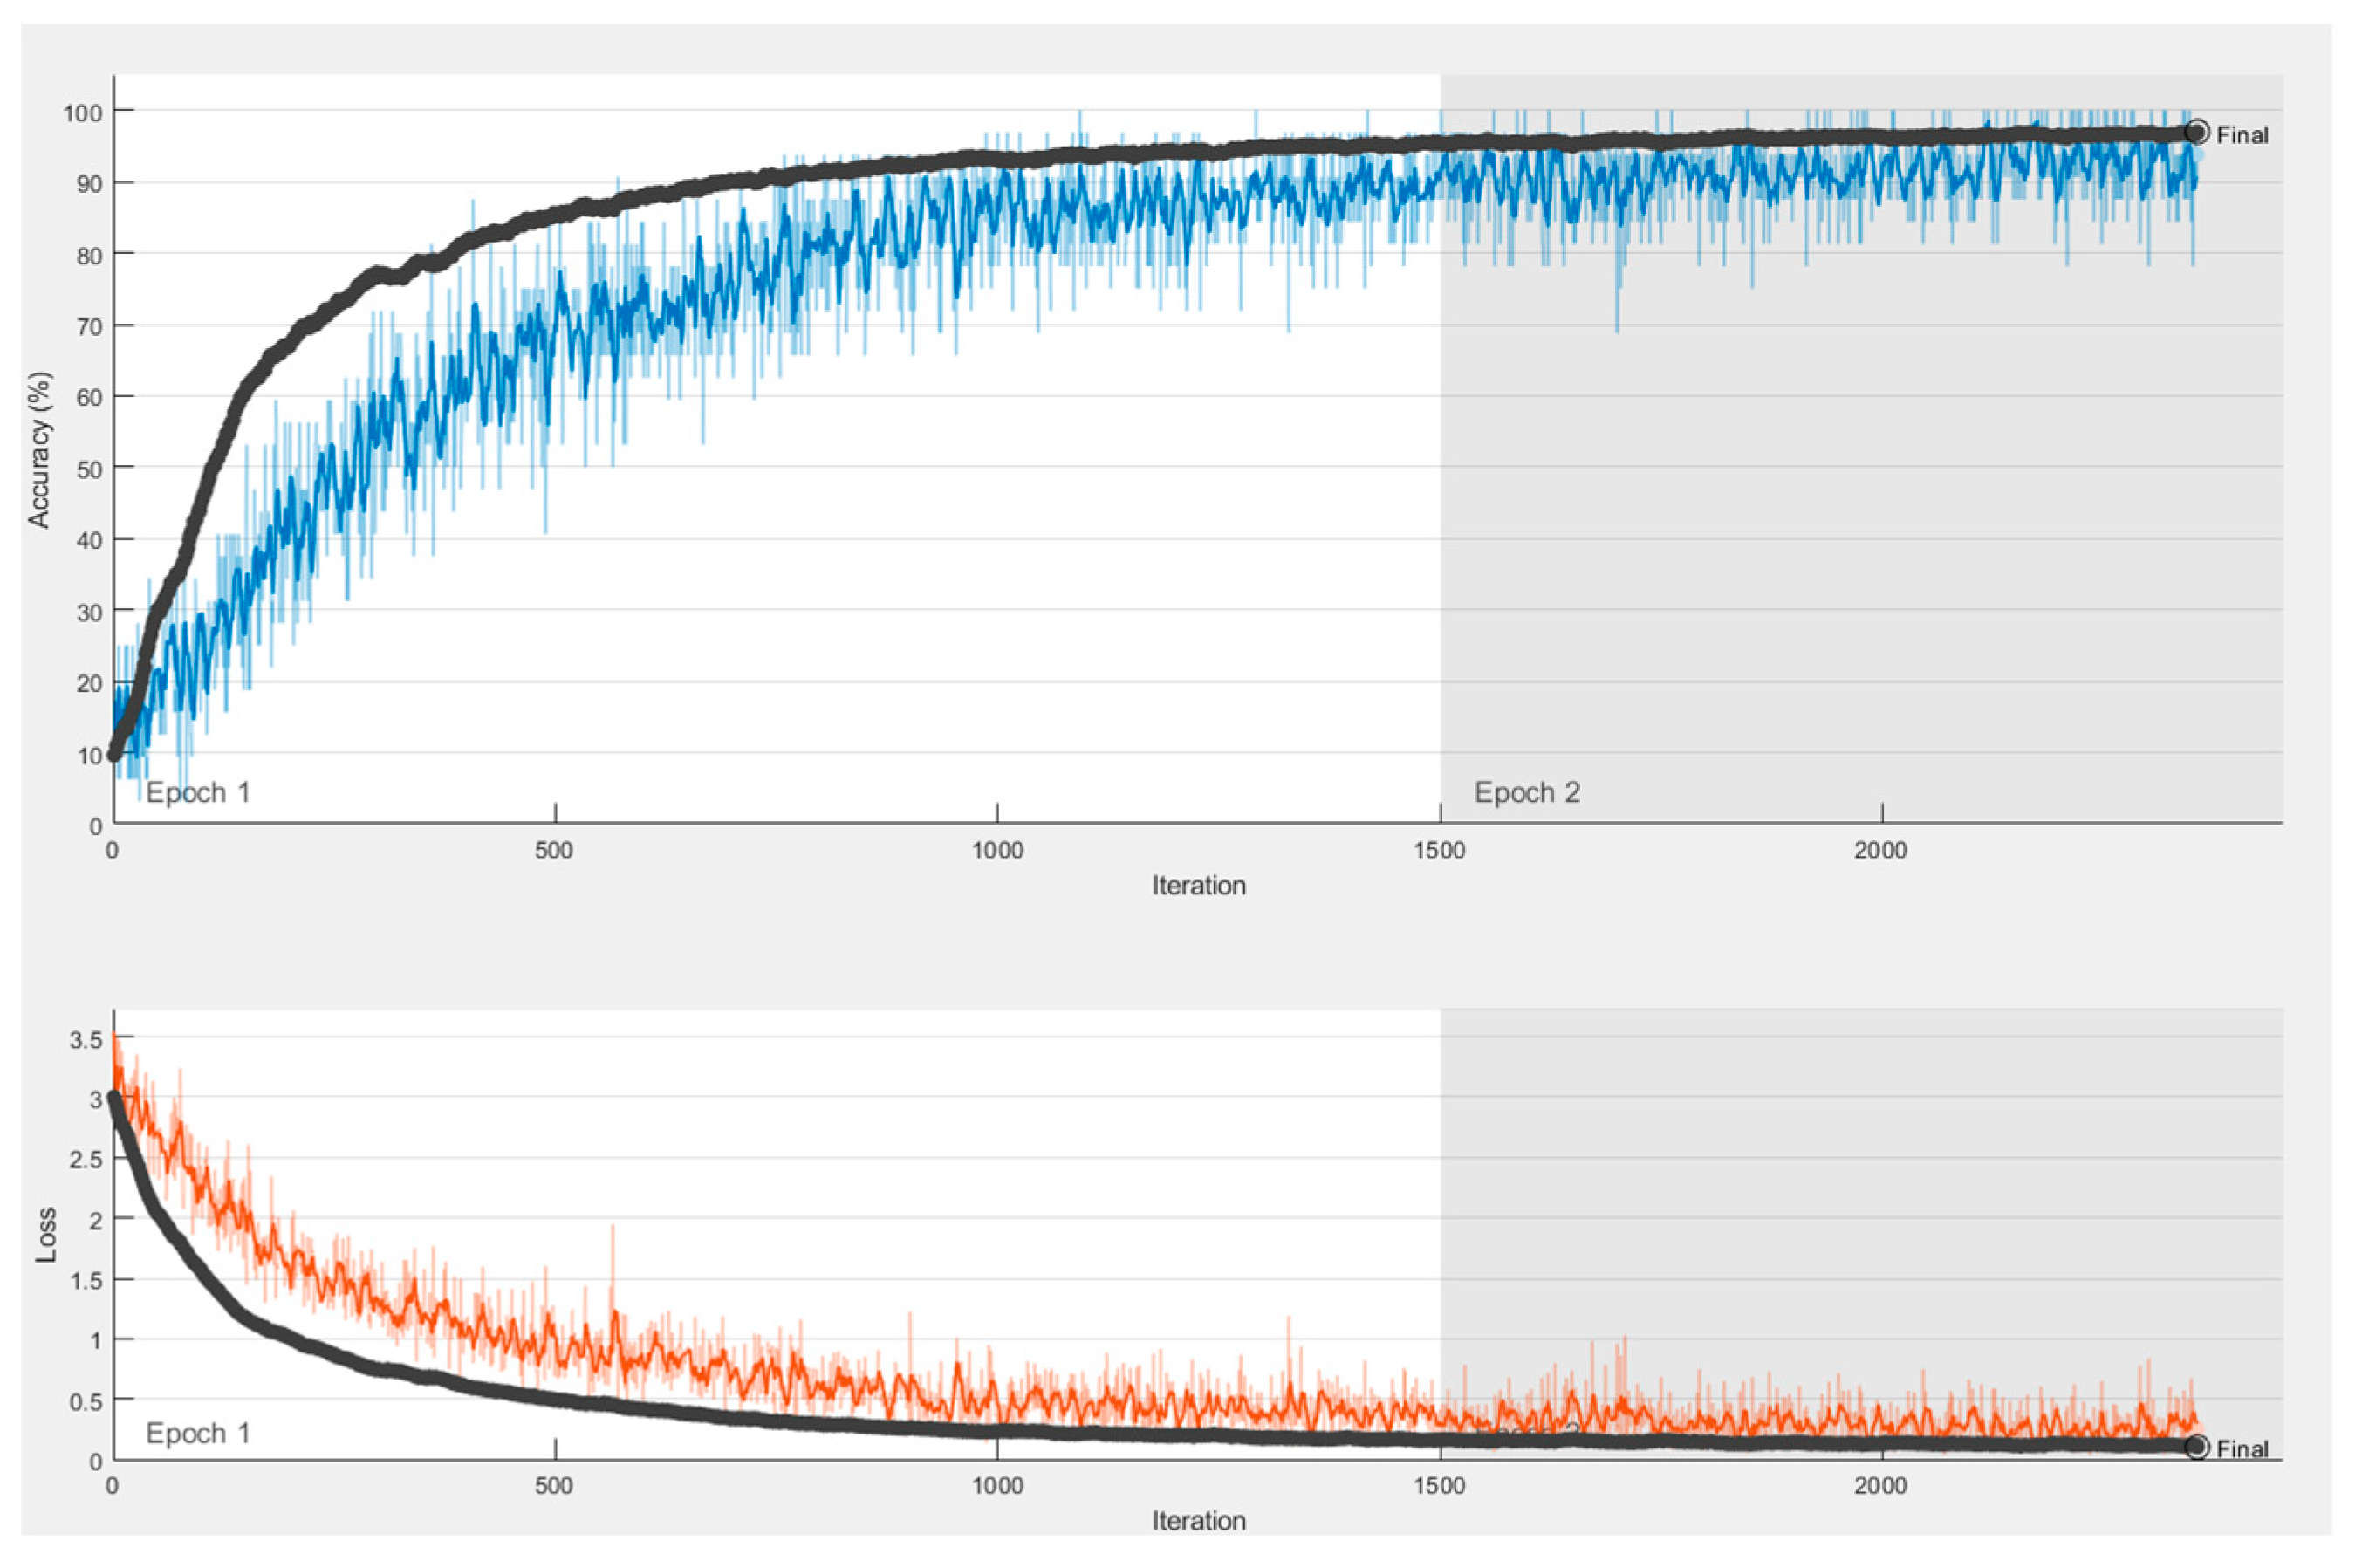
The Si-CNN and Si-CNN+NC models and benchmark models were trained and evaluated on a dataset of handwritten signature images called “C-Signatures”. The number of epochs to train the Si-CNN model was set to 250, but the training of the proposed model continued for 80 epochs because early stopping was used. The training time of the new proposed model was 85 min and 14 s. The epoch number was also set to 250 for the training of the Si-CNN+NC model, but the training of the proposed model continued for 106 epochs since early stopping was used. The training time of the proposed new model also took 65 min and 28 s, despite an increase in the number of epochs. A plot of the accuracy values obtained for the training and validation sets during the training of the proposed models is presented in
Figure 8 and
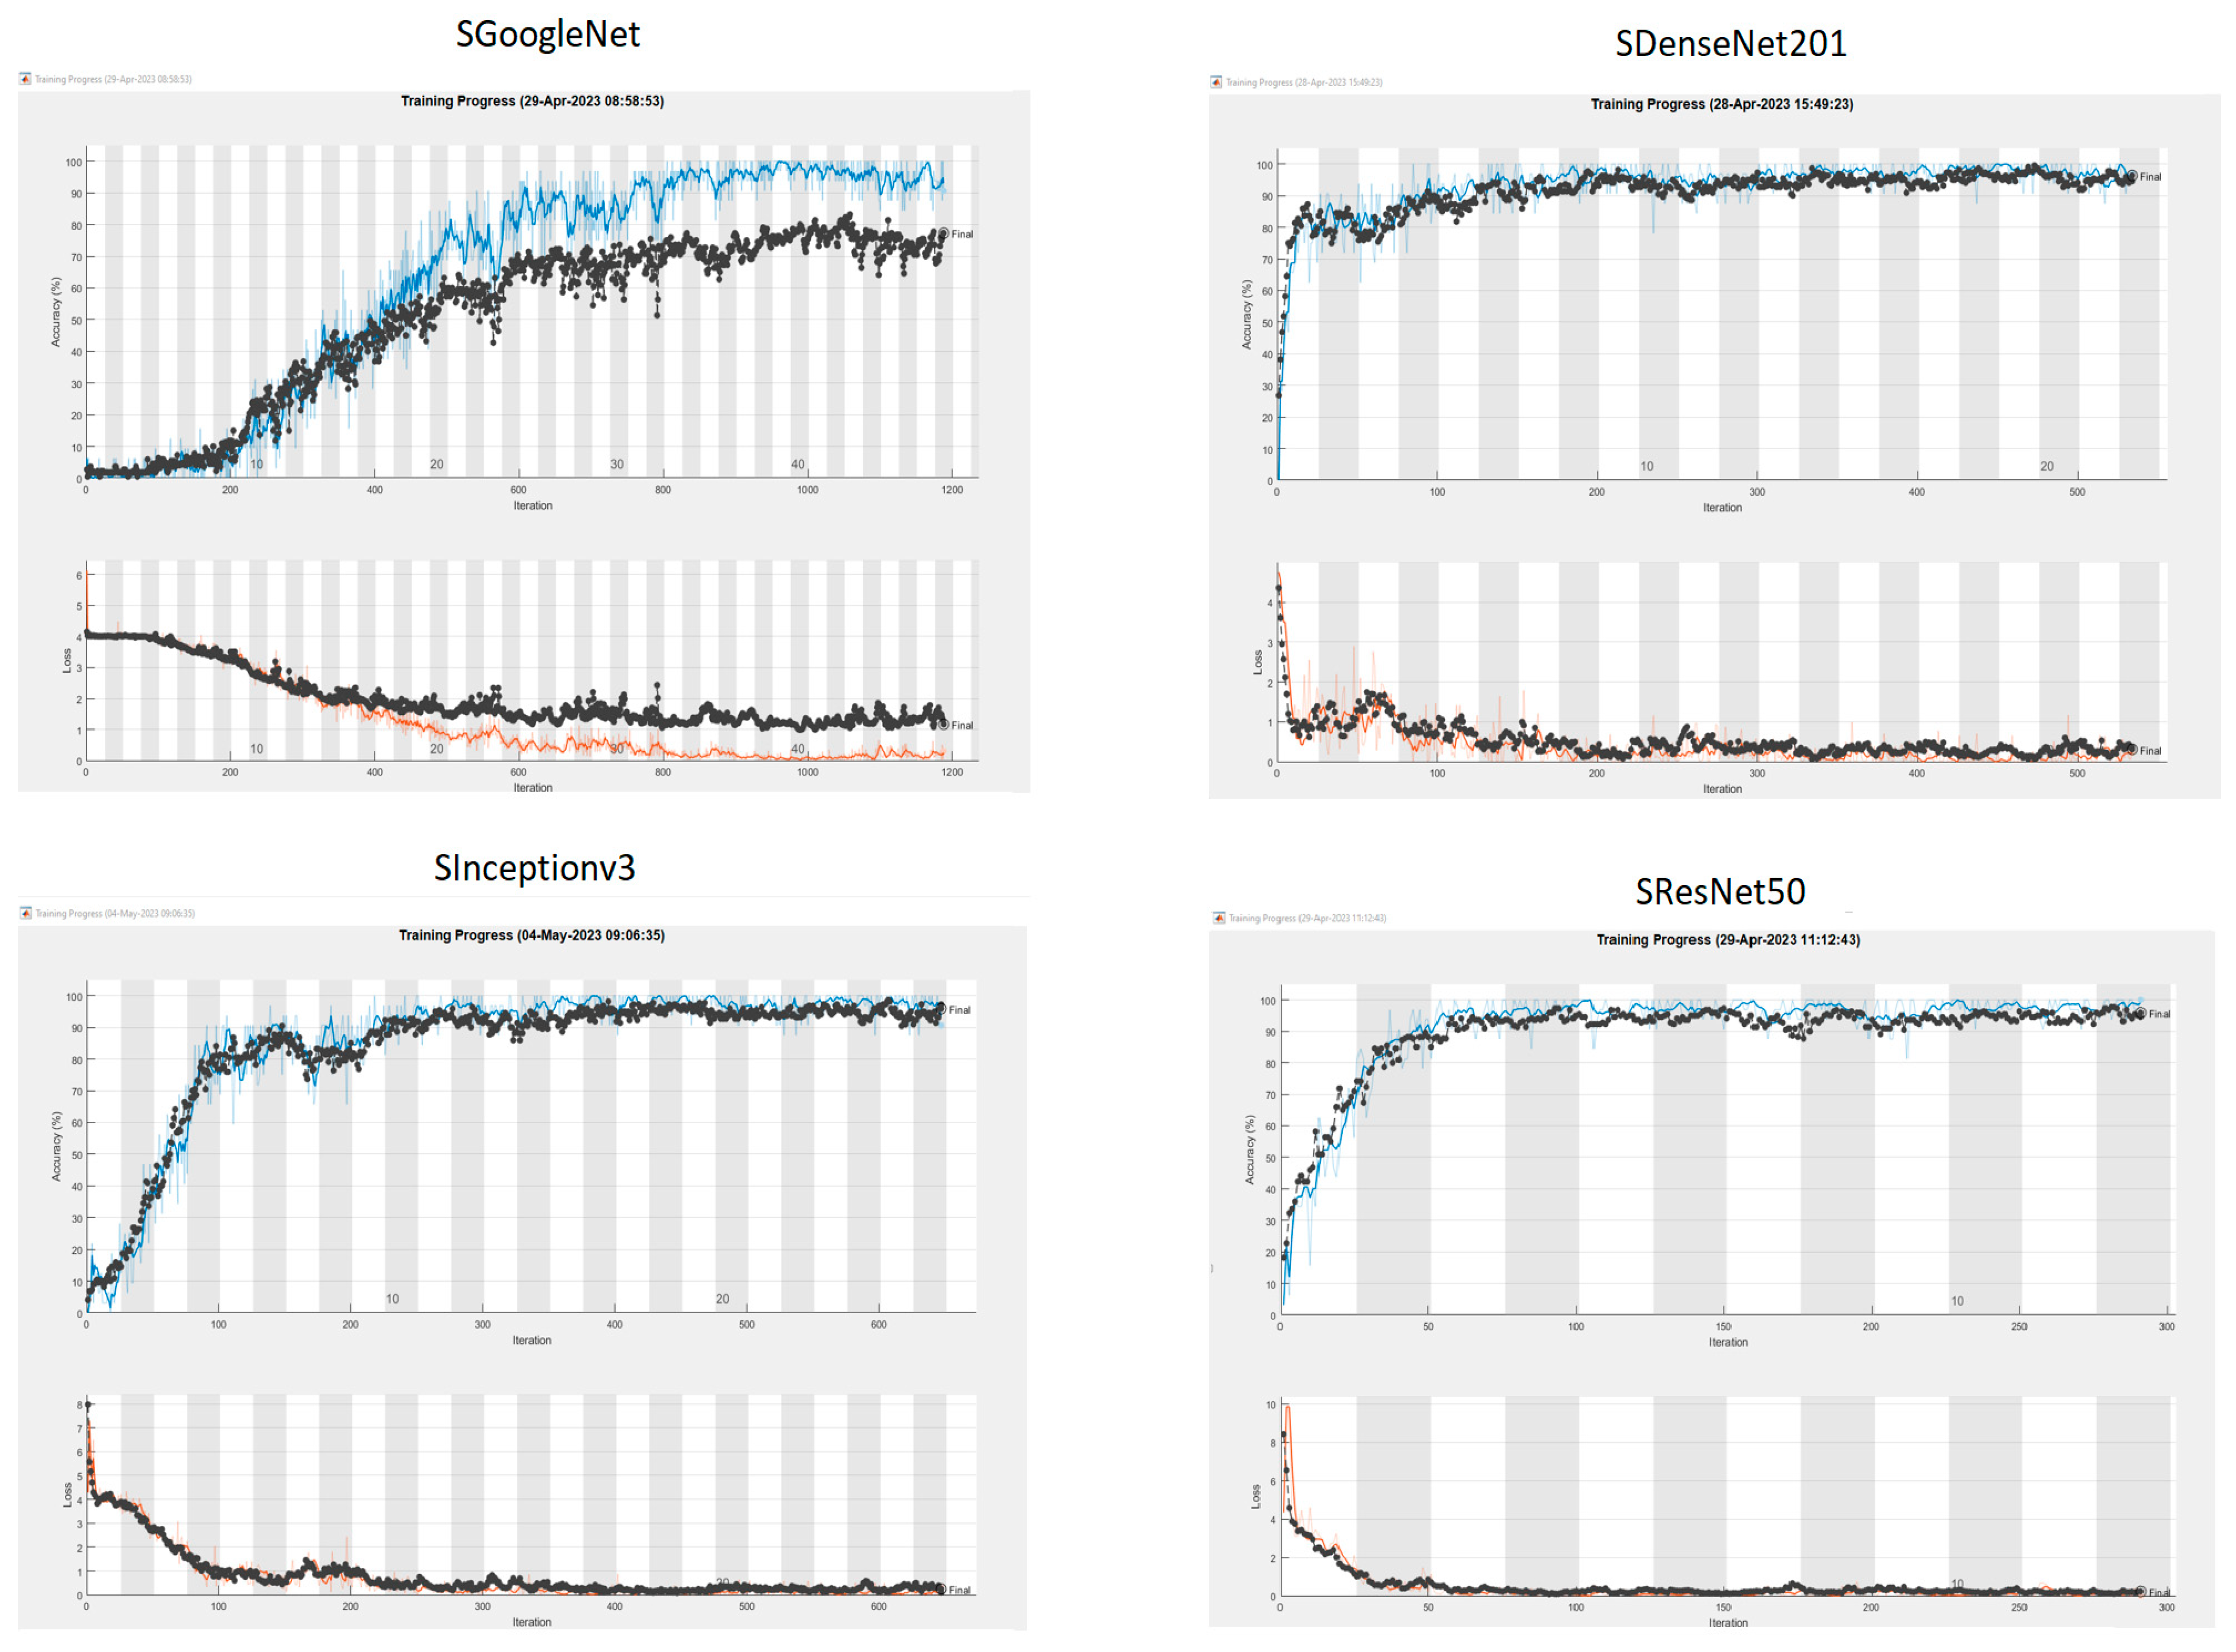
Figure 9. This figure shows that there is no over fitting problem for the proposed model. The benchmark models were also trained under the same training configuration conditions as the Si-CNN and the obtained accuracy plots are presented in
Figure 10.
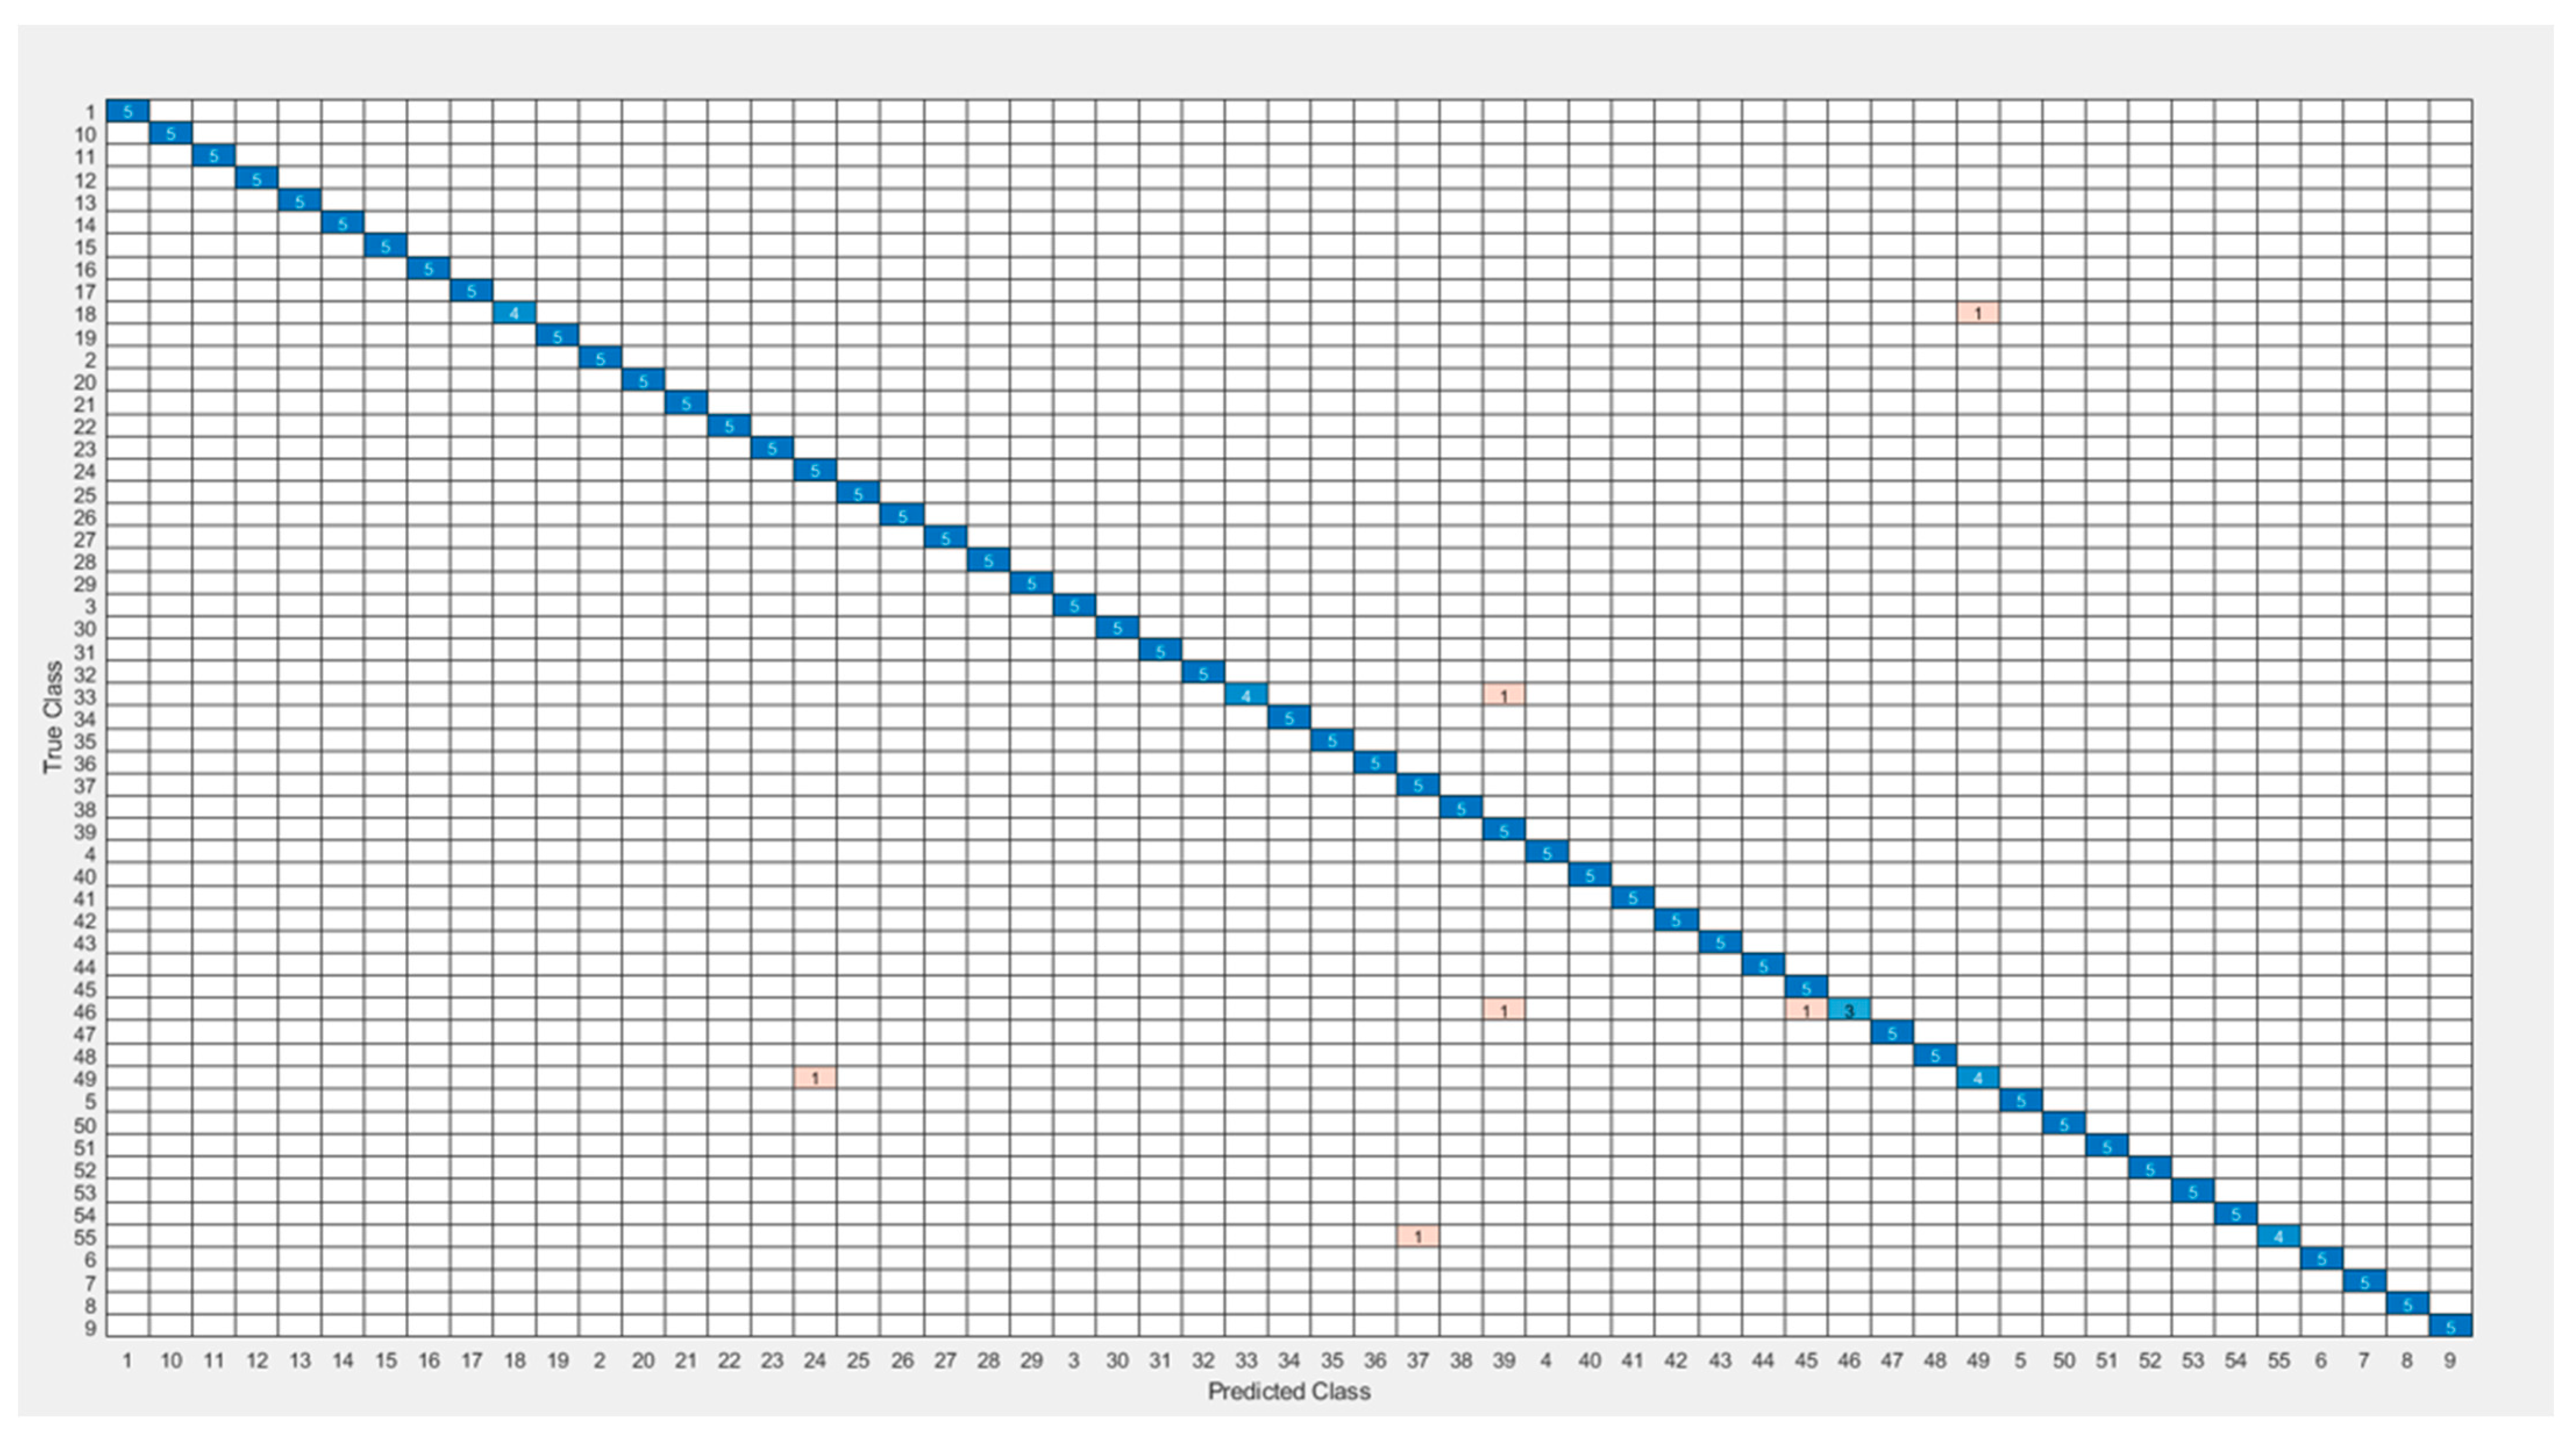
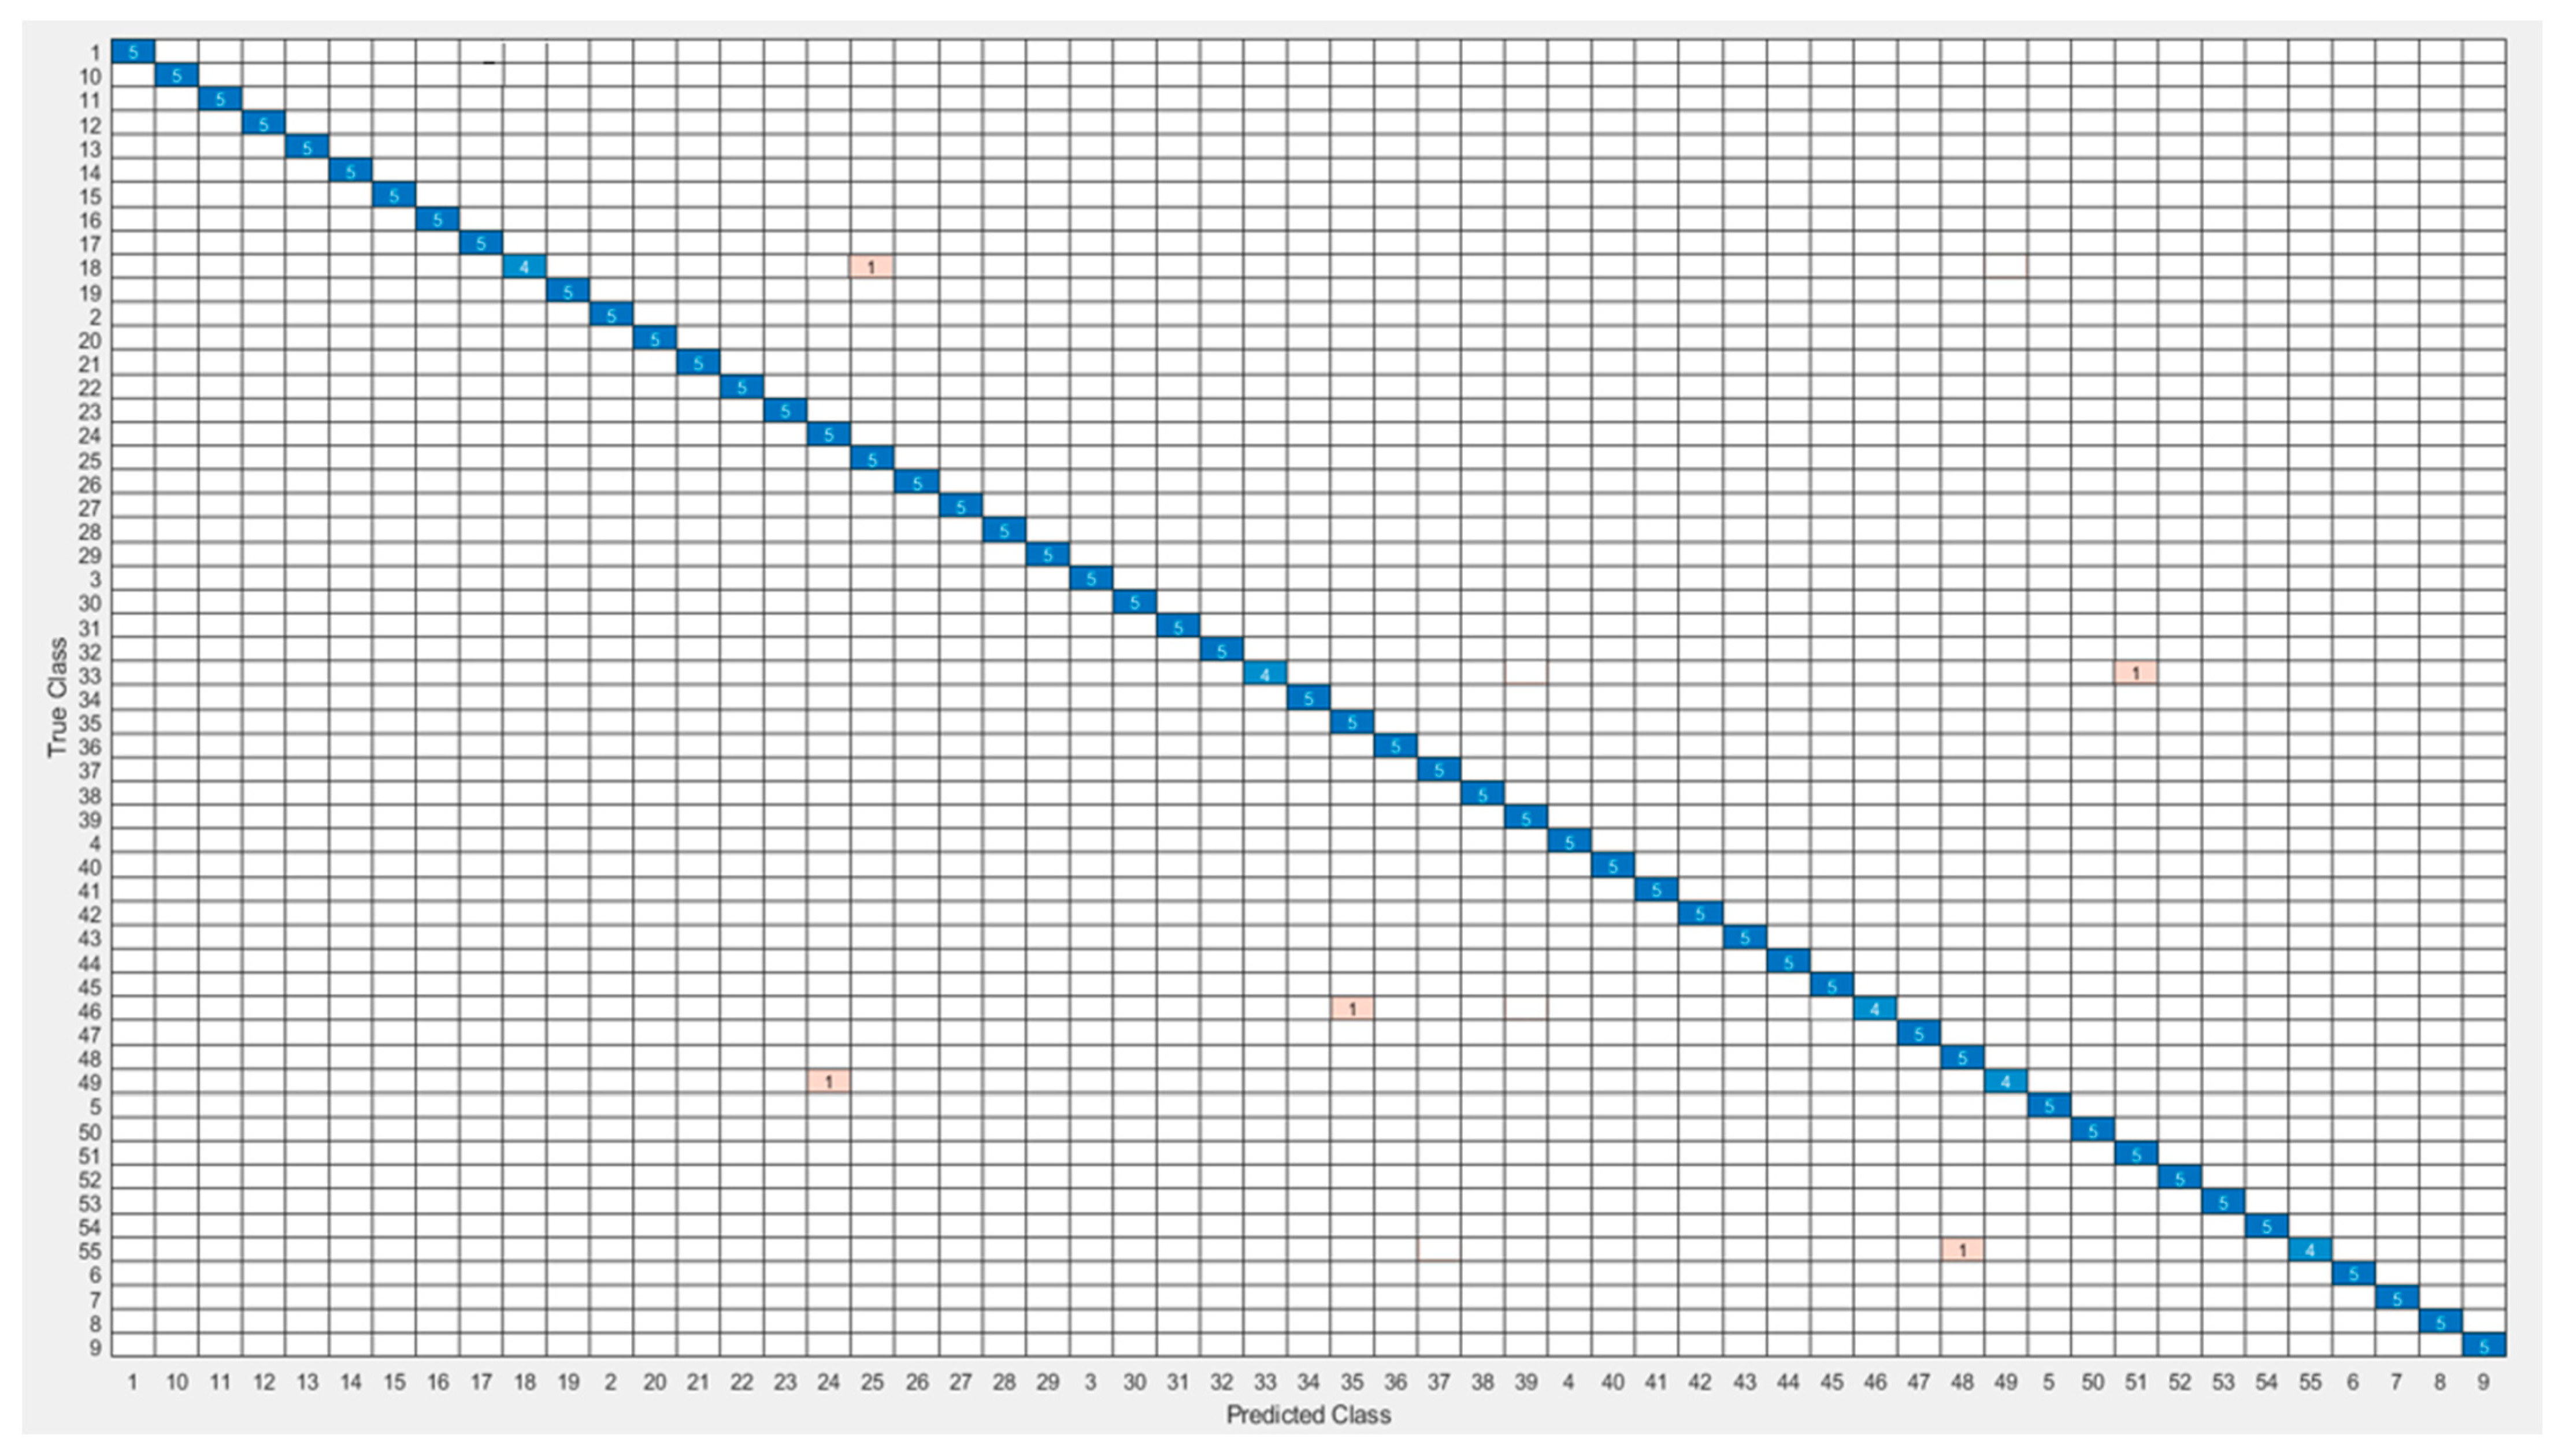
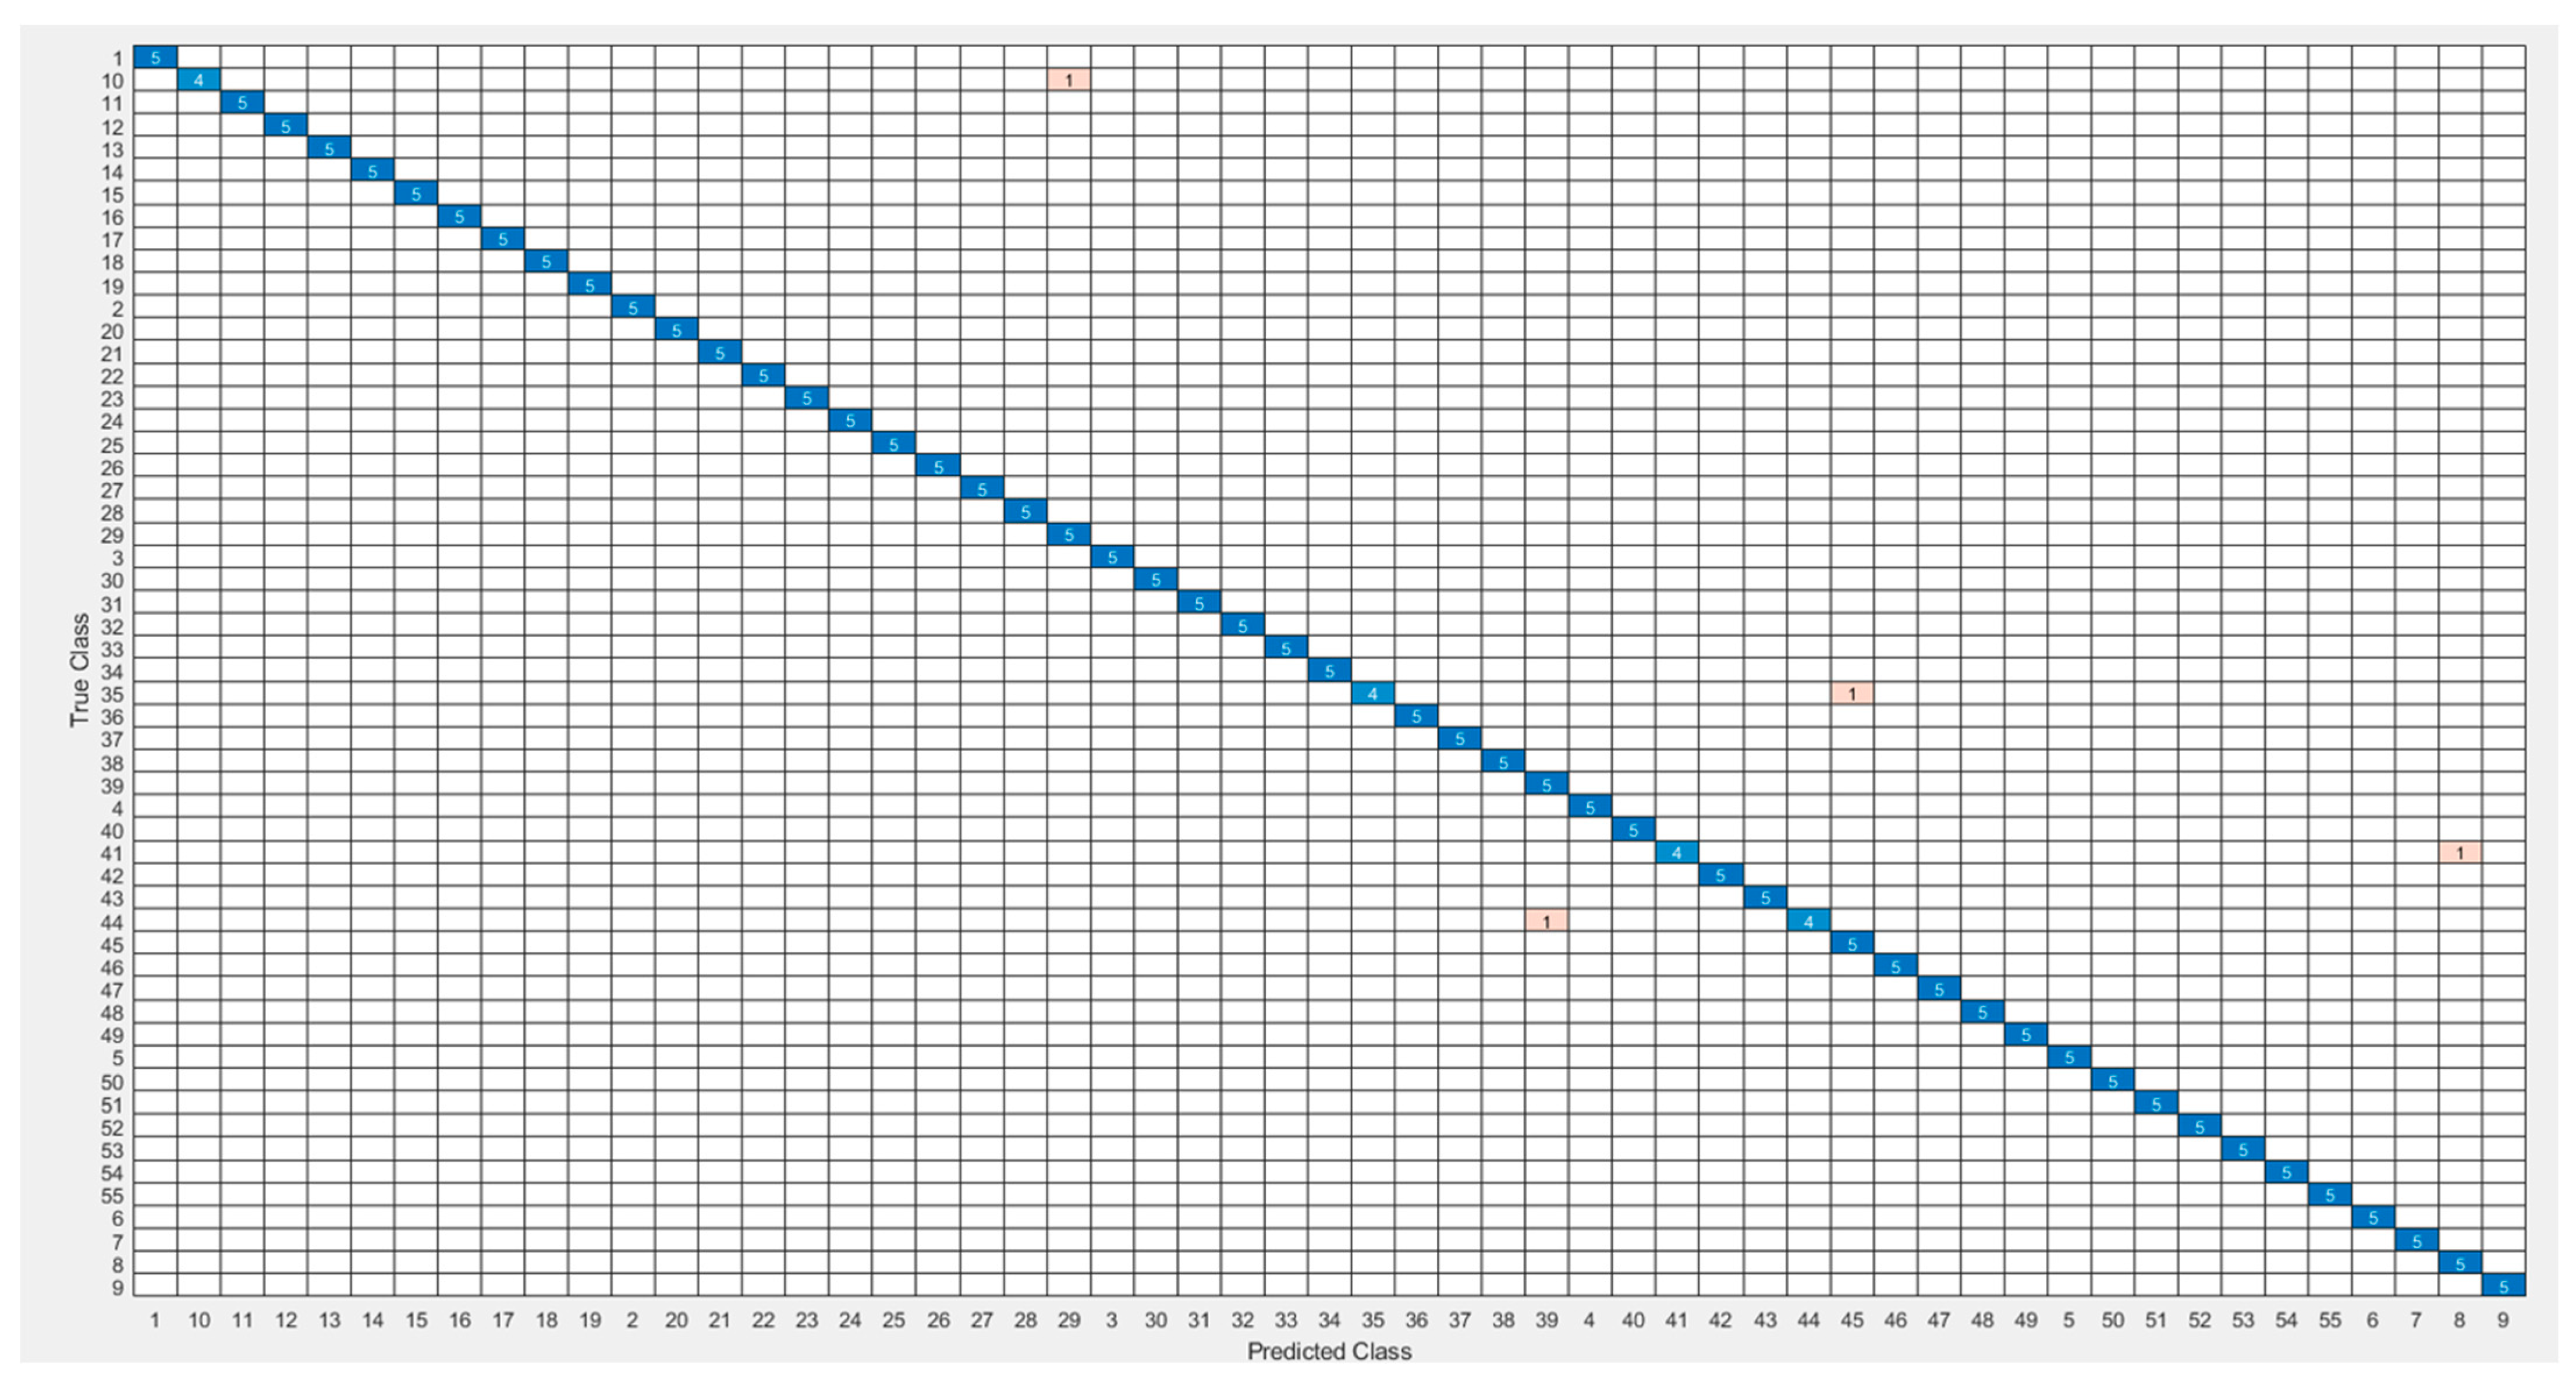
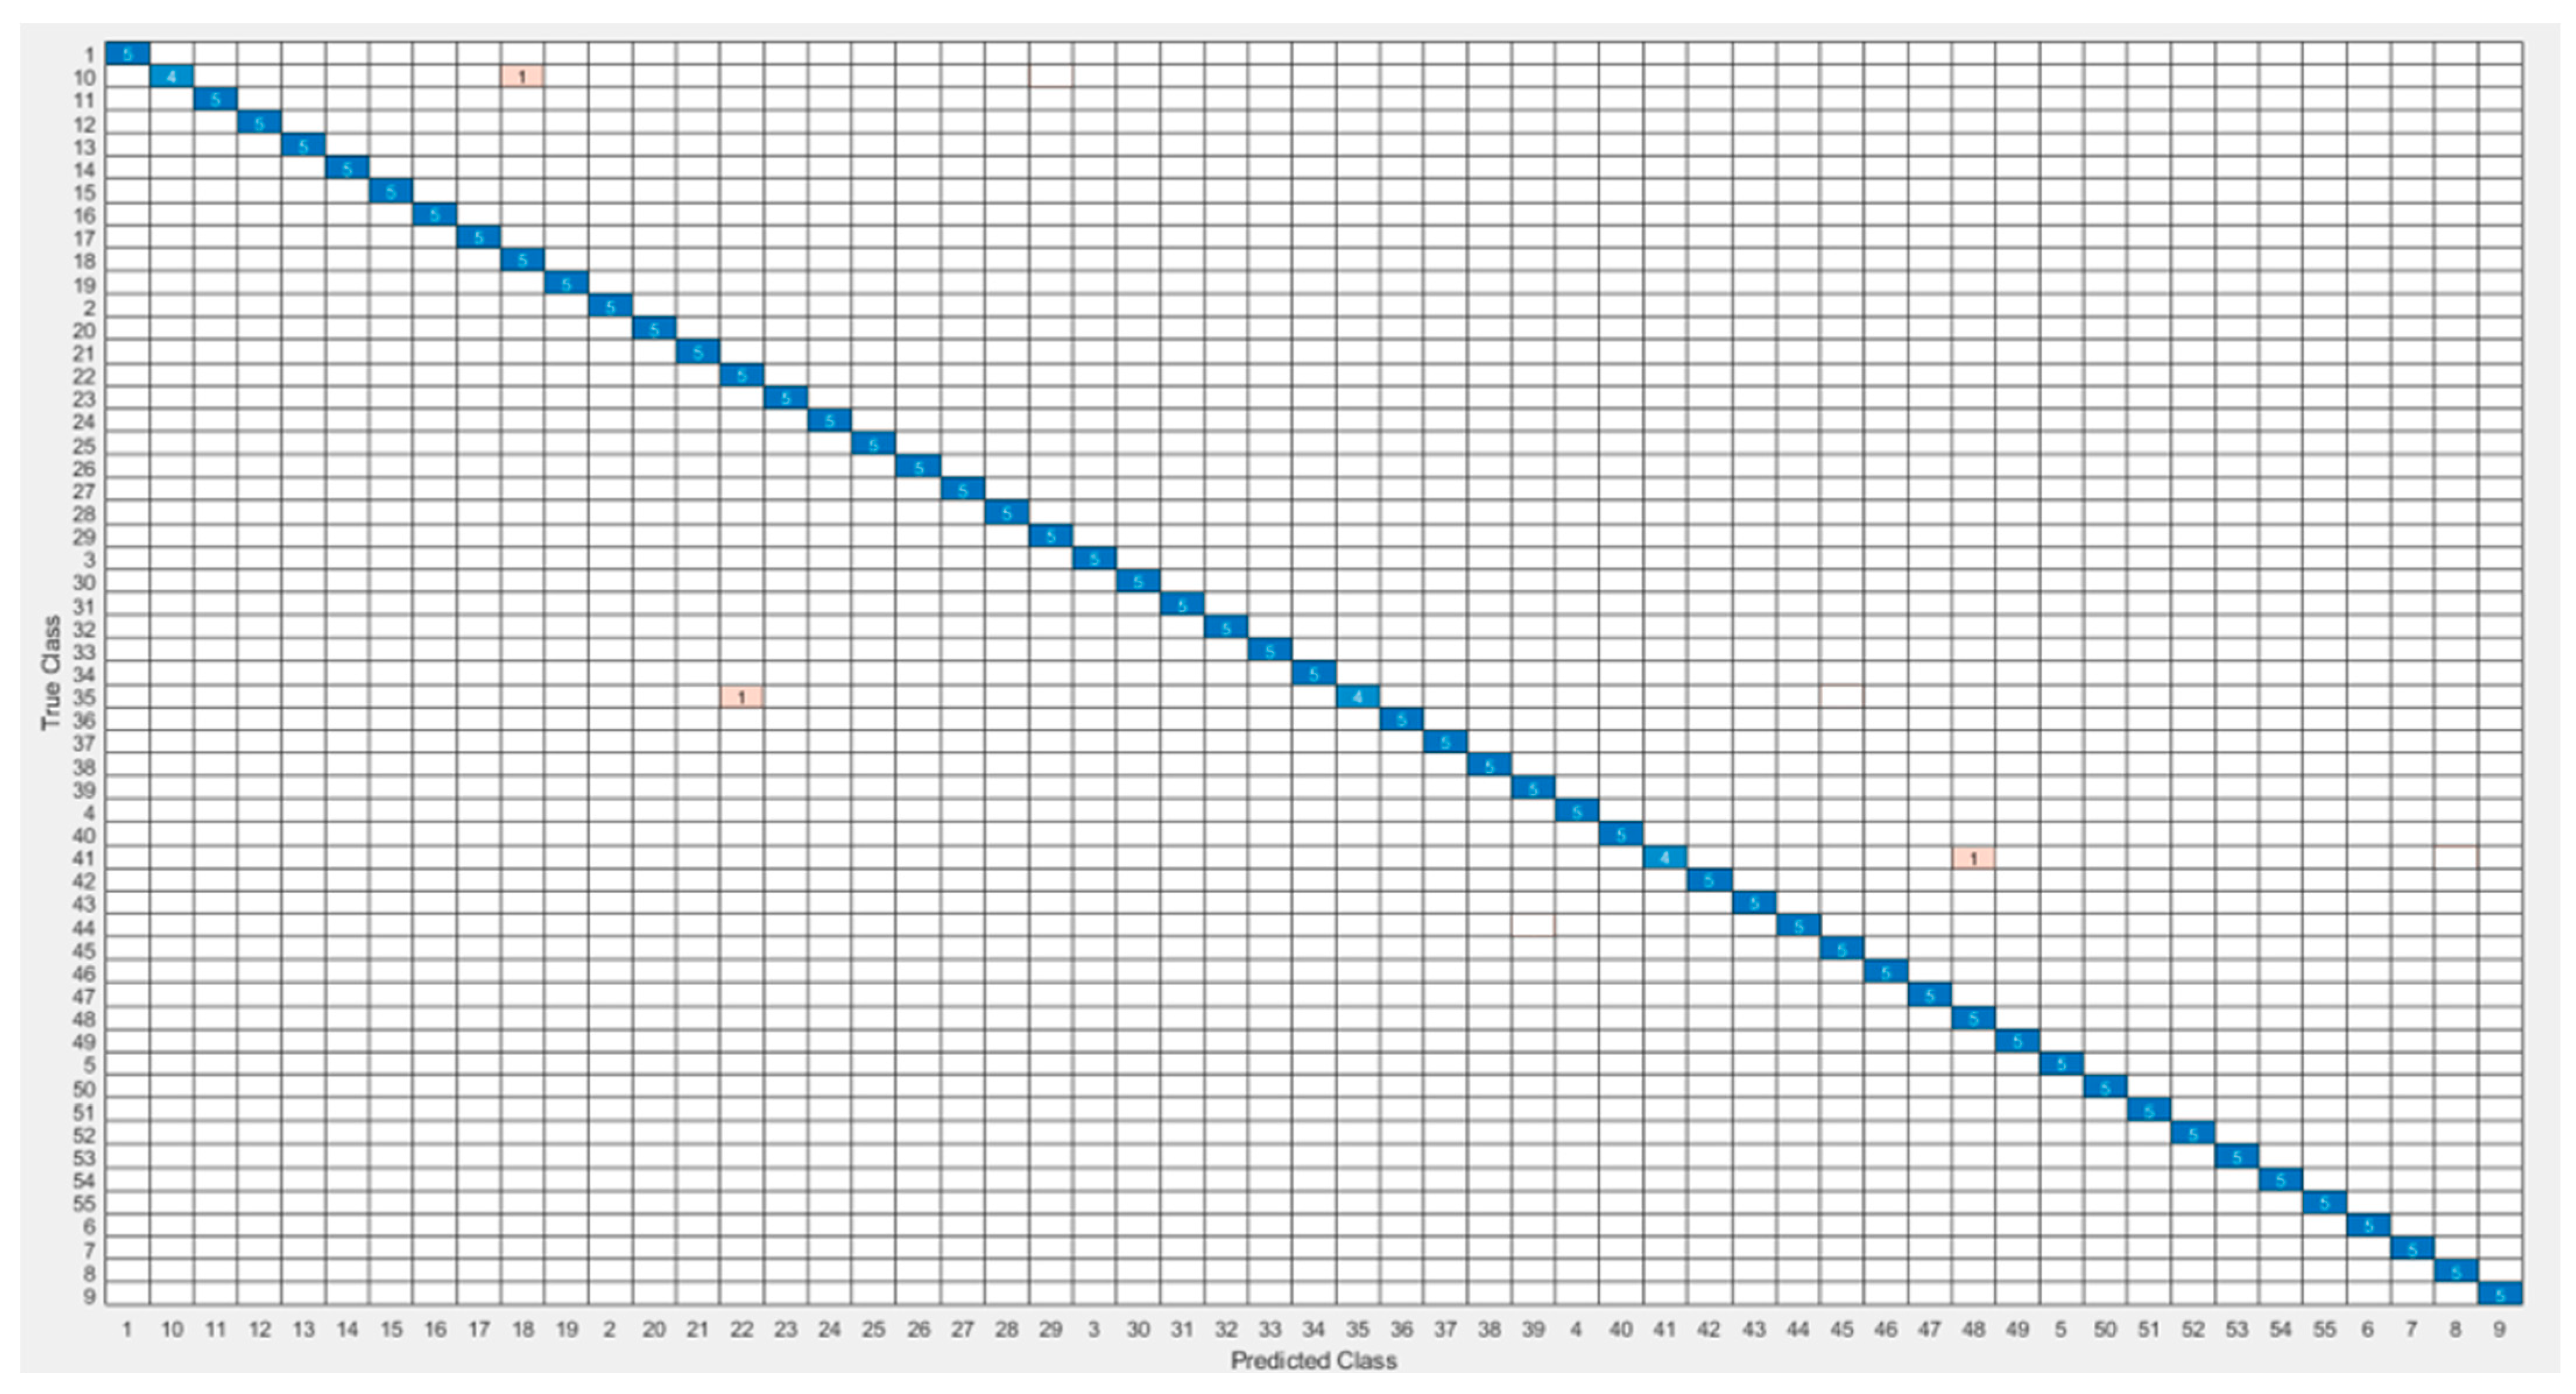
The most common table for visualizing classifier predictions is the confusion matrix. The Si-CNN and Si-CNN+NC models’ classification performance was assessed using the confusion matrix. The confusion matrix’s rows correspond to the true class’s instance count. The number of instances in the projected class is shown in the columns.
Figure 11 and
Figure 12 show the confusion matrices that were used to evaluate the Si-CNN and Si-CNN+NC models on the “C-Signatures” test set.
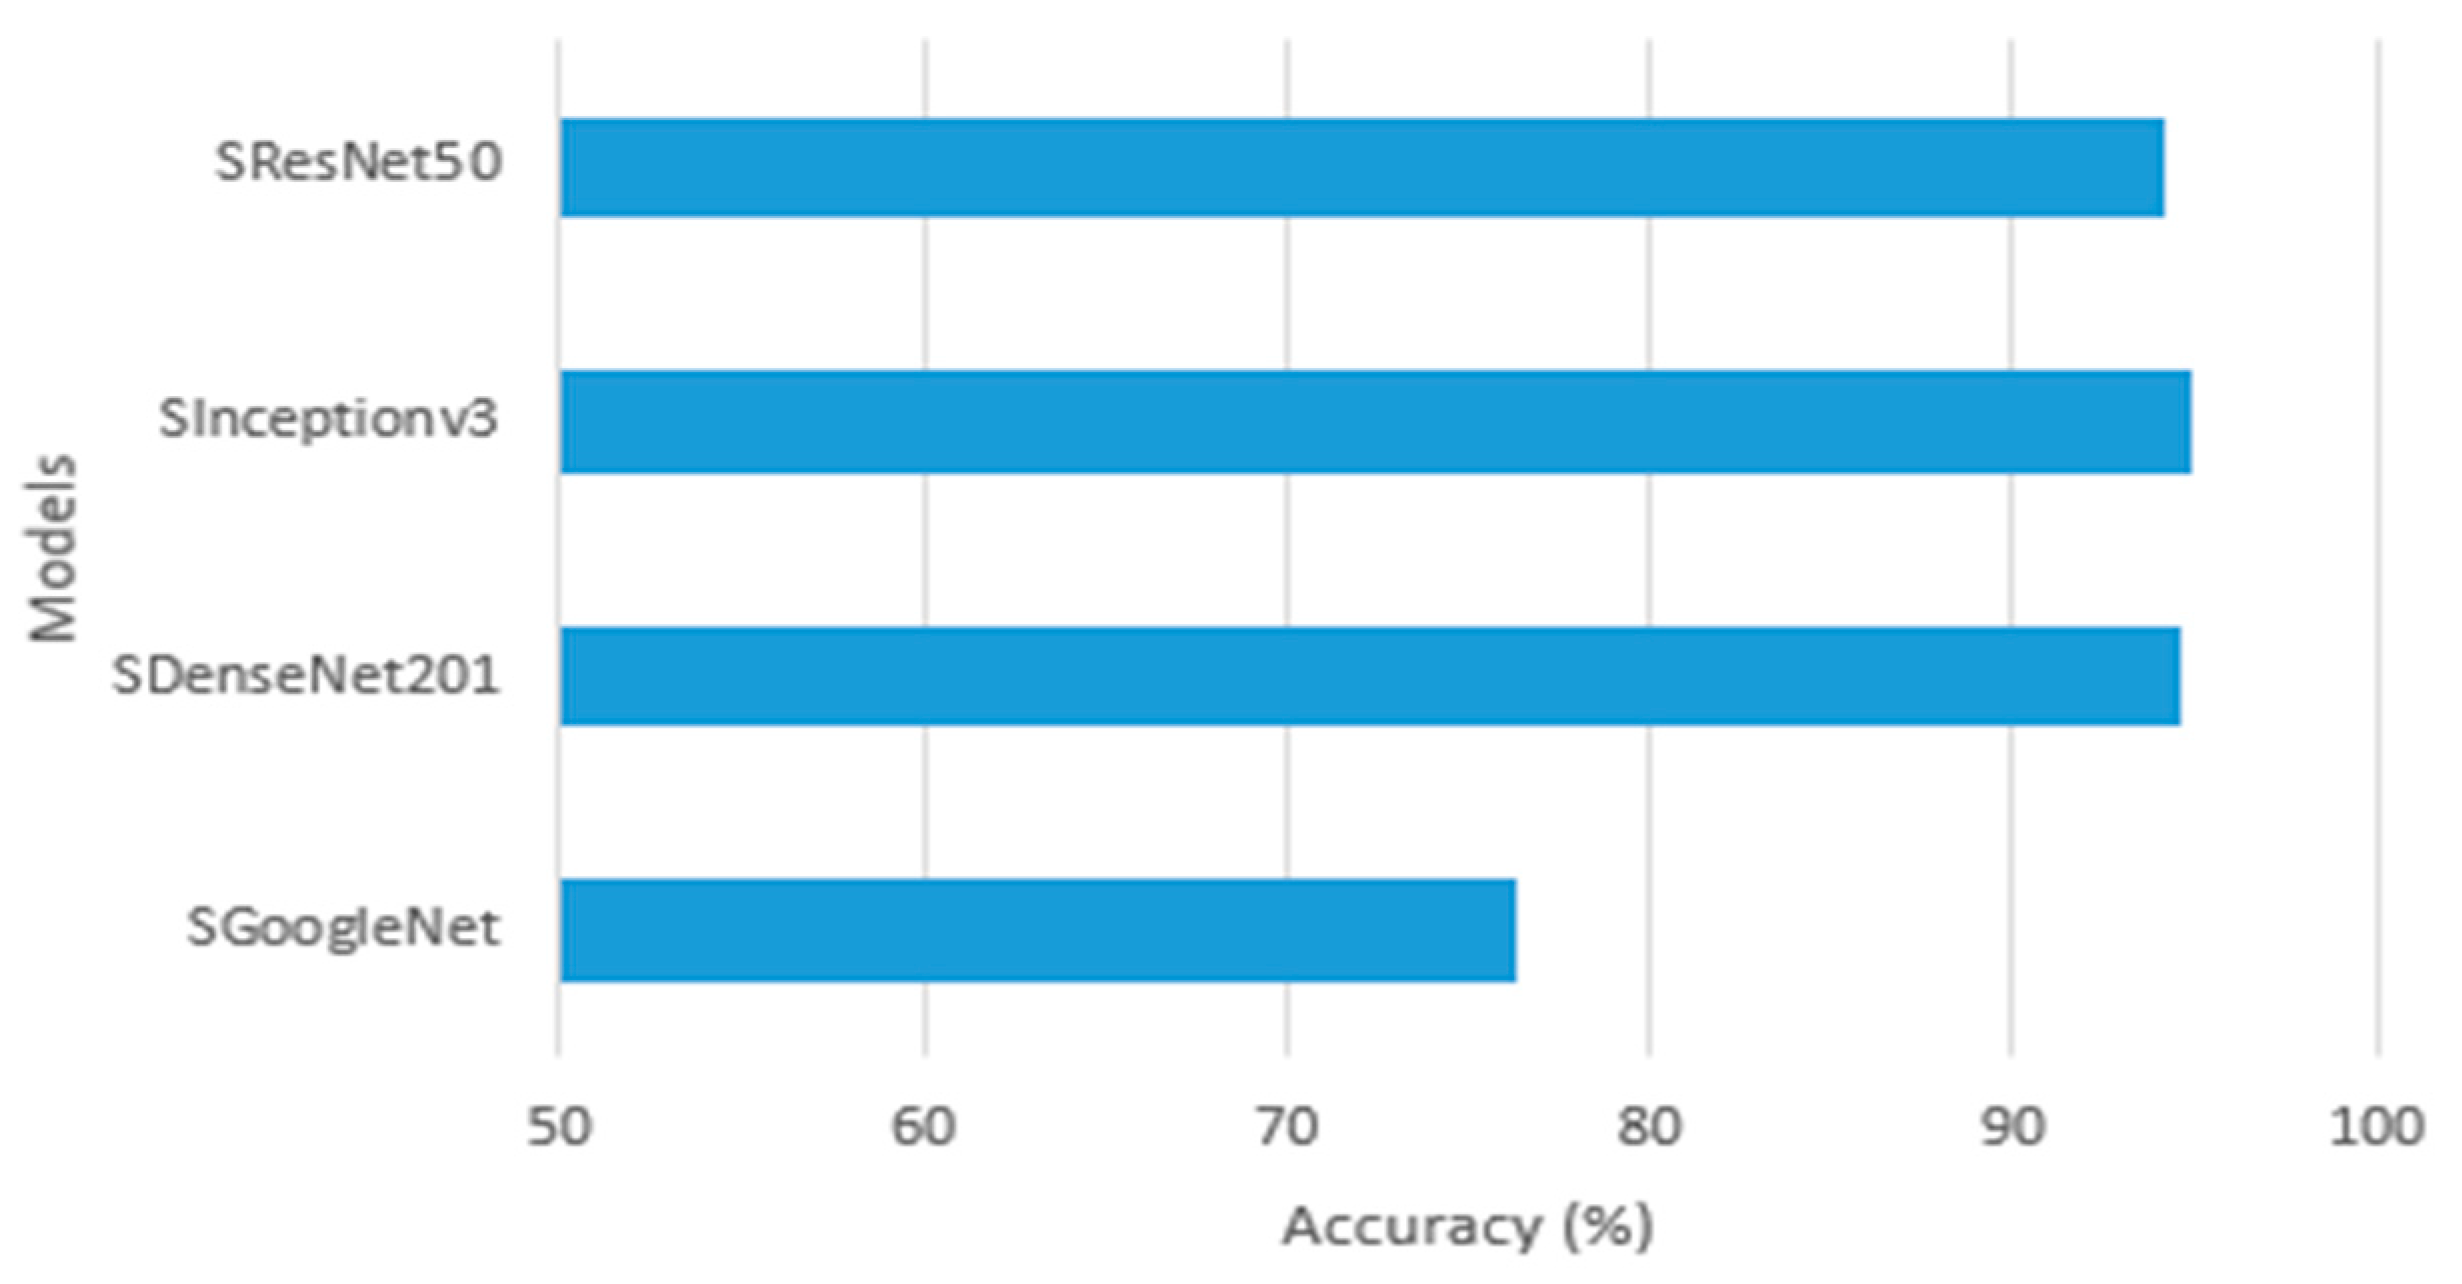
Figure 13 displays a chart of the accuracy scores attained for the compared models. The Si-CNN+NC model outperformed the other three models with an accuracy of 98.64%. This model was followed by Si-CNN with 97.82%. When the Si-CNN+NC model was valuated in the test set, 98.67% precision, 98.64% recall, and 98.72% F1-score values were obtained.
Table 6 provides an analysis of the models utilized across all evaluation criteria.
The training of CNN models takes a long time even on machines with high processing power and large amounts of memory due to their complex and deep architecture, large amount of data processing, and large number of parameters. For this reason, the training time for each thousand CNN models benchmarked using the “C-Signatures” dataset is presented in
Table 7.
The trial findings showed that SResNet50 was the quickest model, finishing training in 3762 s. The Si-CNN+NC and Si-CNN models finished the training in 3928 and 5114 s, respectively, after SResNet50. SDenseNet201 was found to be the slowest model as it has the highest depth among the benchmark models. Compared to the pre-trained network models GoogleNet, DenseNet201, Inceptionv3, and ResNet50 of the Si-CNN+NC(Si-CNN+Si-CL) model, the accuracy, recall, precision, and f1-score values of the proposed model are higher than other network models. Additionally, when the training times of the network models were examined, the Si-CNN+NC architecture showed the most successful performance after the ResNet50 model.
The impact of the developed Si-CL classification layer can be noticed when the training periods of Si-CNN and Si-CNN+NC models are compared. The training is finished faster thanks to the new classification layer’s loss function, which also returns the error more accurately. Due to the loss function used in the layer, the network performance shows positive results in terms of timing and accuracy.
4.2. Experiments with the “Cedar” Dataset
The Si-CNN and Si-CNN+NC models and benchmark models were trained and evaluated on a dataset of handwritten signature images named “Cedar”. The number of epochs to train the Si-CNN model was set to 250, but the training of the proposed model continued for 101 epochs because early stopping was used. The training time of the new proposed model was 61 min and 33 s. The epoch number was also set to 250 for the training of the Si-CNN+NC model, but the training of the proposed model continued for 132 epochs since early stopping was used. The training time of the proposed new model also took 57 min and 8 s, despite an increase in the number of epochs. A plot of the accuracy values obtained during the training of the proposed model for the training and validation sets is presented in
Figure 14 and
Figure 15. This figure shows that there is no over fitting problem for the proposed model in this dataset. The benchmark models were trained under the same training configuration conditions as the Si-CNN and the accuracy plots are presented in
Figure 16. The visualization of the confusion matrix obtained for the evaluation of the Si-CNN and Si-CNN+NC models on the “Cedar Signature” test set is presented in
Figure 17 and
Figure 18.
Figure 19 shows a graph of the accuracy scores obtained for the contrasted models. The Si-CNN+NC model achieved an accuracy of 99.09%, which was the best performance among the four models on the “Cedar Signature” dataset. This model was followed by Si-CNN with 98.55%. On the “Cedar Signature” test set, 99.11% precision, 99.09% recall, and 99.20% F1-score values were obtained when the Si-CNN+NC model was assessed.
Table 8 provides a comparison of the models utilized across all evaluation criteria.
According to the results of the experiment with the “Cedar Signature” dataset, Si-CNN+NC was found to be the fastest model, completing training in 3428 s. Si-CNN and SGoogleNet models followed Si-CNN+NC by completing training in 3693 and 3890 s, respectively. The training times for each CNN model benchmarked using the “Cedar Signature” dataset are also presented in
Table 9. As in the case of the “C-Signatures” dataset, the model with the longest training time was SDenseNet201. These experimental findings lead to the generalization that the deeper the deep neural network, the longer the training period. Similar to the “C-Signatures dataset”, when the training times and evaluation metrics of the Si-CNN and Si-CNN+NC models are compared, the most successful results are in the Si-CNN+NC model. At this point, the effect of the Si-CL classification layer can be seen. It can be noticed that the mistakes are returned rapidly and the training time is finished in a shorter amount of time due to the loss function employed in the Si-CL layer in this dataset.
4.3. Experiments with the “MNIST” Dataset
In order to compare the models proposed in the literature, all models should be evaluated on the same dataset. To this end, as a final experiment, the Si-CNN and Si-CNN+NC models were both trained and evaluated on the MNIST dataset. The Si-CNN and Si-CNN+NC models, which were trained on the MNIST dataset, were computed with high accuracy (96.98% and 97.19%, respectively), and they are shown in
Figure 20 and
Figure 21. When comparing the two models presented, it is clear that the Si-CNN+NC model which employs the Si-CL layer performs better. As a result, when our suggested models were evaluated using the gold standard dataset, they showed high accuracy rates.
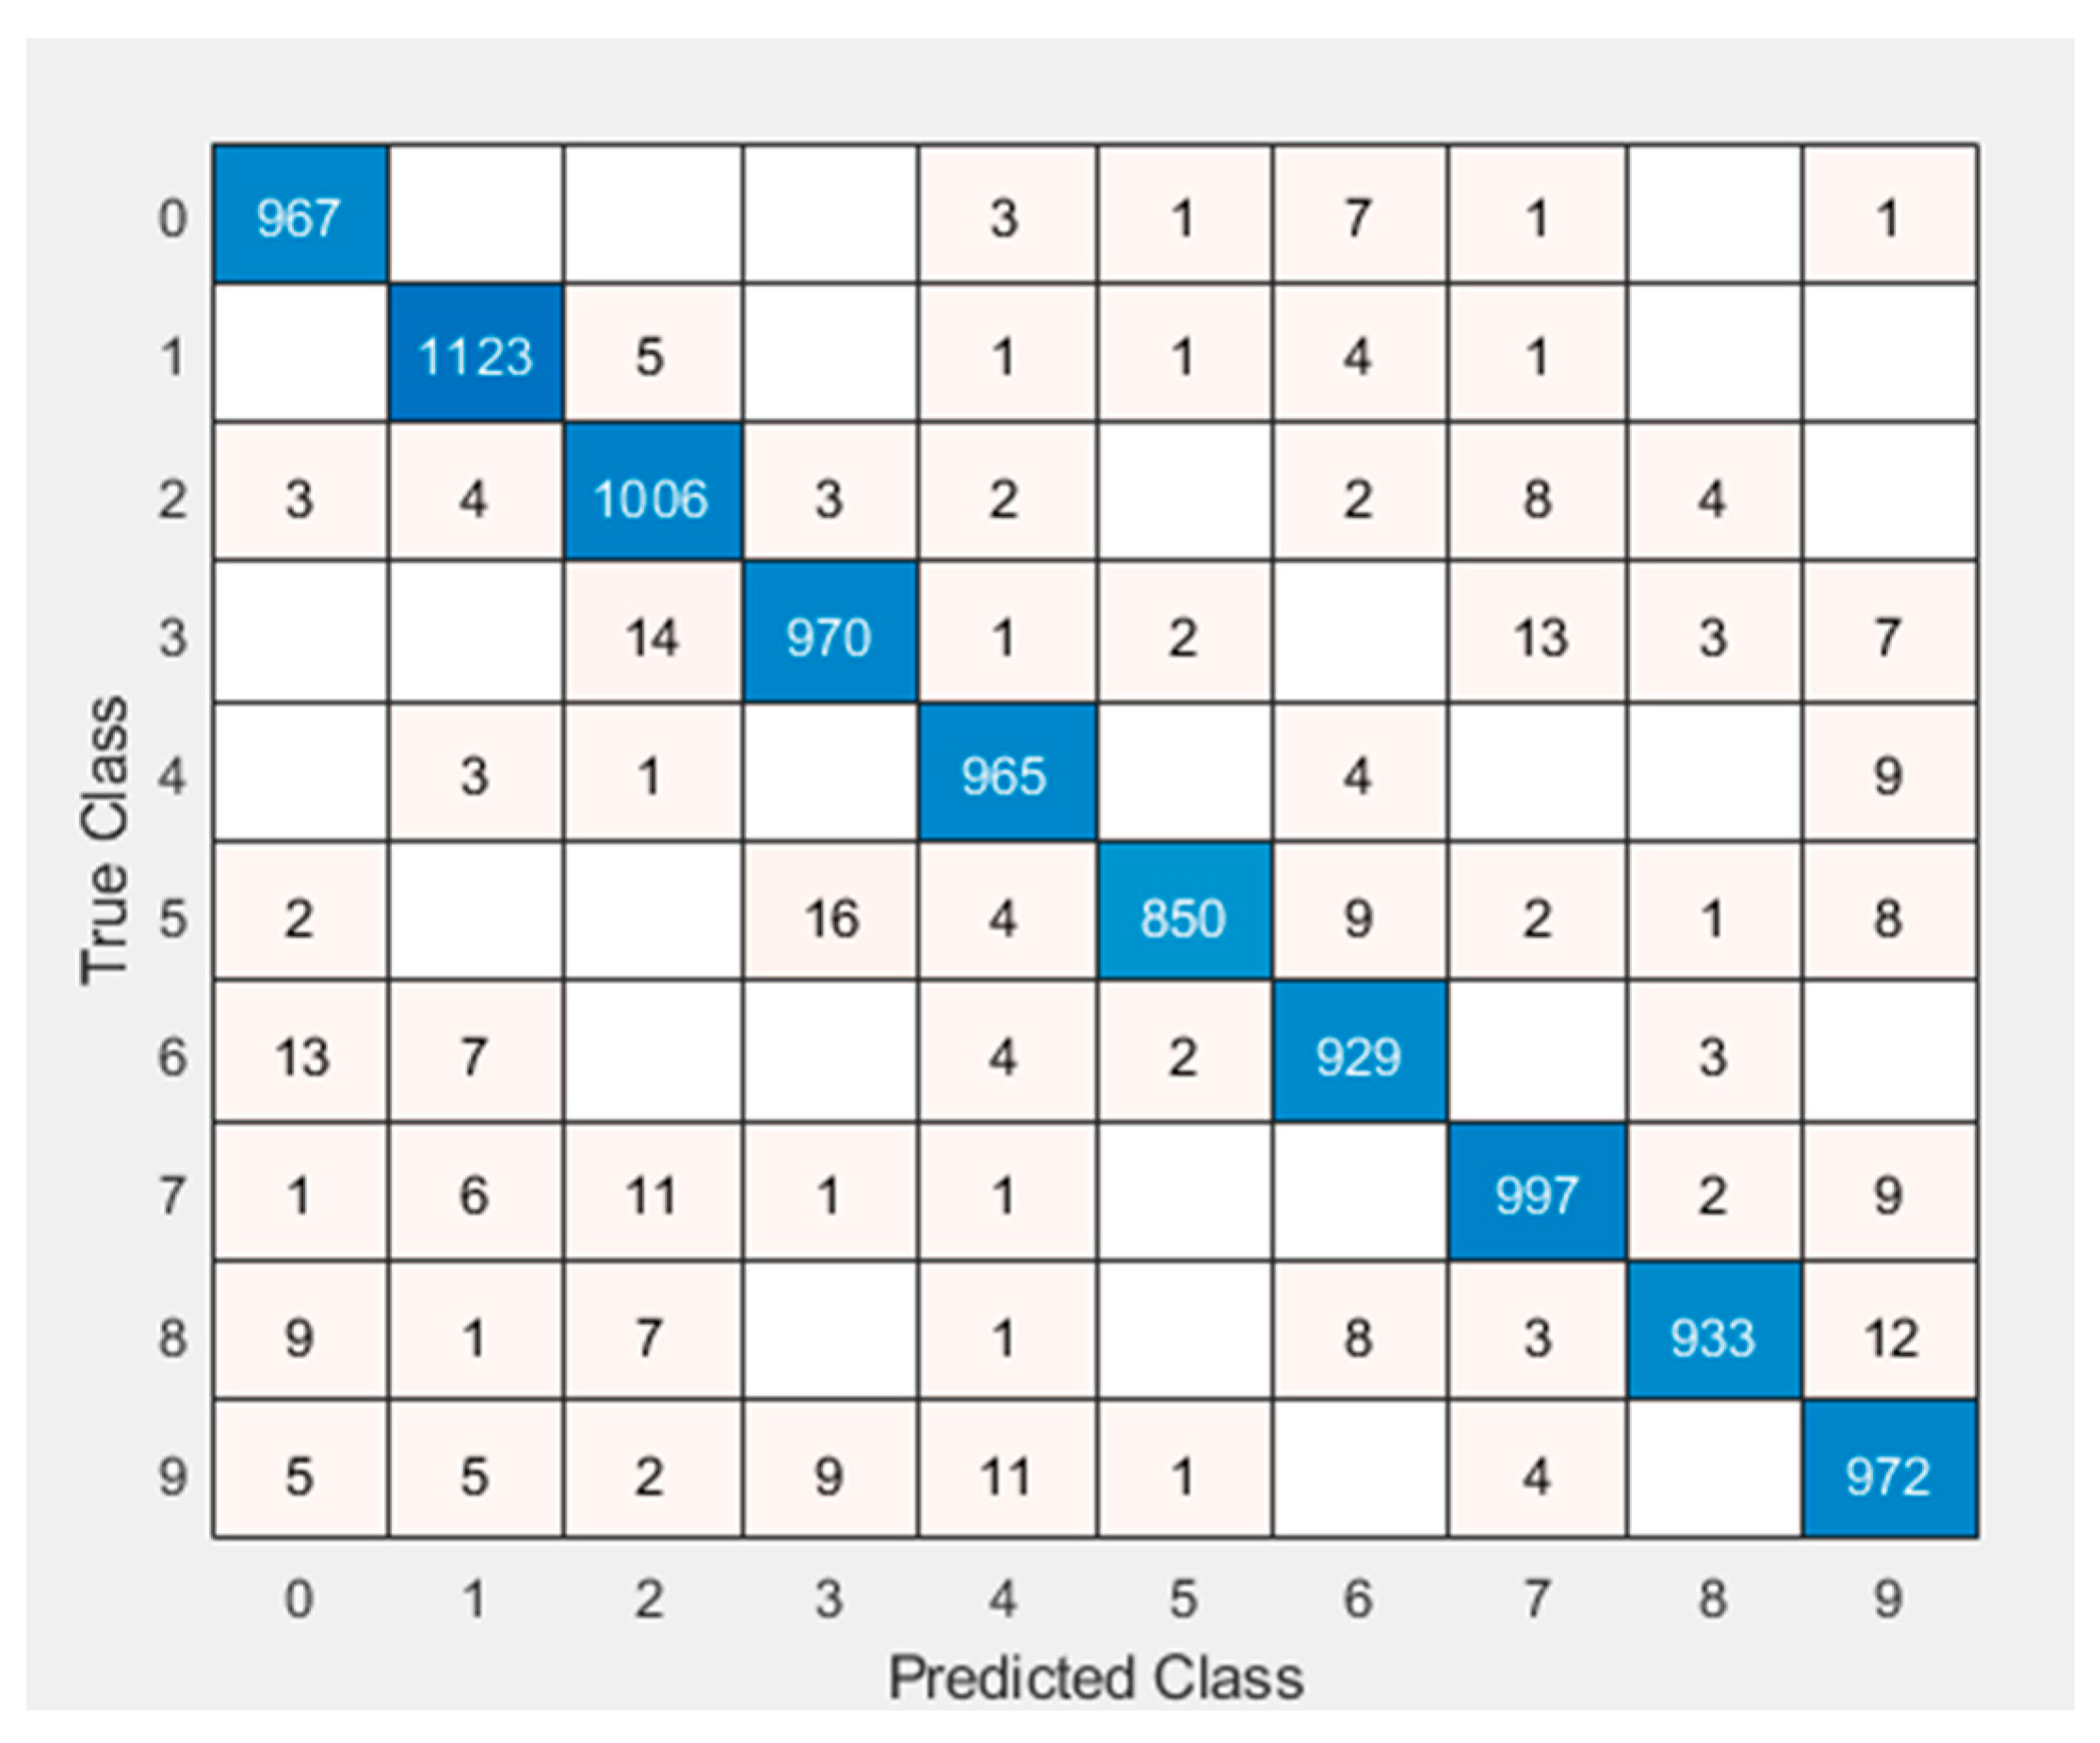
The “1”, “2”, and “7” were determined to be the most accurately recognized numbers, according to the matrix of confusion of the Si-CNN model’s evaluation on the MNIST dataset, which is shown in
Figure 22. The “1”, “2”, and “7” were determined to be the most precisely detected numbers in
Figure 23, which also displays the matrix of confusion of the analysis of the Si-CNN+NC algorithm on the MNIST dataset. The highest accuracies in both Si-CNN and Si-CNN+NC architectures are “1”, “2” and “7”, indicating the consistency and effectiveness of the proposed models. In addition, when the results obtained from these two new proposed models are compared, the lowest accuracies were obtained from the numbers “5” and “6”.
5. Discussion
The Si-CNN and Si-CNN+NC models performed well on the “C-Signatures” dataset created for this study. However, for an objective comparison, the proposed CNN models should be evaluated together with other databases commonly used in previous studies. Additionally, the proposed network models need to be compared with pre-trained networks to demonstrate their effectiveness. For this purpose, the proposed CNN models were evaluated with the “Cedar” dataset as well as the “C-Signatures” dataset.
Table 10 presents the studies conducted in the literature with the “Cedar” dataset and their results.
According to this table, the accuracy of the Si-CNN+NC model is presented as 99.09%. In addition to the dataset created, the effectiveness of the proposed CNN architectures was demonstrated by comparing them with recent studies. In addition, evaluations were made on the MNIST dataset, which is the gold standard dataset, to compare the effectiveness of the proposed network models.
Table 11 presents some studies trained and evaluated on the MNIST dataset.
According to this table, the accuracy of the Si-CNN and Si-CNN+NC models is presented as 96.98% and 97.19%, respectively. Thus, in addition to the “C-Signatures” and “Cedar” datasets, the effectiveness of the proposed CNN architectures has been demonstrated by comparing them with recent studies.
The Si-CNN and Si-CNN+NC models have some advantages over other compared models. One of them is the possibility of high-precision classification with a small number of original samples. This feature is enabled by the feature extraction ability of CNNs. The main disadvantage of this method is that it costs time because it has too many parameters. However, it still requires less time than manually classifying signatures. Finally, it is seen in the presented findings that the presented handwritten signature classification models are extremely satisfactory and sufficient. It can be concluded that they may be a useful aid to signature verification and classification experts.
6. Conclusions
With the opportunities and advantages provided by technology, studies in the fields of identification, object recognition, and verification from digital images are increasing day by day. Although signature verification studies have been greatly improved with CNN models, the classification of handwritten signature images remains insufficient in the research field. For this purpose, in this study, new CNN-based models called Si-CNN and Si-CNN+NC are proposed for the classification of handwritten signature images. The effectiveness of the Si-CNN and Si-CNN+NC models was tested on three different datasets used in this study. First, the study used “C-Signatures”, a dataset containing 1320 images collected from 55 participants for handwritten signature image classification. The Si-CNN and Si-CNN+NC models were trained and evaluated on this dataset. According to the experimental results, the Si-CNN model had an accuracy of 97.82% and the Si-CNN+NC model achieved a high accuracy of 98.64%. To compare the efficiency of the Si-CNN and Si-CNN+NC models, four different CNN models were used. The Si-CNN+NC model outperformed the other benchmark models with an accuracy of 98.64%. When looking at the results obtained with our second dataset, “Cedar Signature”, Si-CNN+NC showed the best performance among the benchmark models with an accuracy rate of 98.55%. The study’s conclusions show that the suggested network models can outperform other benchmark models in accuracy by learning characteristics from two distinct handwritten signature images. The results of the trained networks’ tests indicate that the Si-CNN+NC network performs better than the others in terms of accuracy and speed. Finally, the Si-CNN and Si-CNN+NC models were trained and evaluated on the MNIST dataset for the sake of comparison with the related studies. The Si-CNN and Si-CNN+NC models produced accuracy results of 96.98% and 97.19%, respectively, demonstrating the effectiveness of the suggested models. In addition, since there are many hyper-parameters that can be experimentally optimized within the scope of this study, research has been conducted to ensure that the Si-CNN and Si-CNN+NC models get the best accuracy results. The results obtained from the experiments are discussed to contribute to the field of machine learning.
There are some limitations in this study that should be acknowledged. First, the datasets used in the research consist of low-resolution images. Second, by nature, biometric characteristics begin to change after a certain period of time.
In future work, the generated dataset can be expanded by adding more examples to improve the model’s learning ability and help avoid overfitting, a major problem of CNNs. Additionally, performance differences can be revealed by examining the architectures of the pre-trained models used in more detail. In addition, AUC graphs can be added to evaluate the performance of network architectures and the results can be evaluated comprehensively. Finally, performance differences can be revealed by adding behavioral features to increase the accuracy and reliability of the system and the online signature classification method.


