Rotated Lorenz Curves of Biological Size Distributions Follow Two Performance Equations
Abstract
1. Introduction
2. Materials and Methods
2.1. The Three Other Lorenz Equations
2.2. The Simulation Data from Beta Distributions
2.3. Data of Plant (Organ) Size Distributions
2.4. Data Fitting and Model Assessment
3. Results
4. Discussion
5. Conclusions
Supplementary Materials
Author Contributions
Funding
Data Availability Statement
Acknowledgments
Conflicts of Interest
References
- Lorenz, M.O. Methods of measuring the concentration of wealth. Am. Stat. Assoc. 1905, 9, 209–219. [Google Scholar] [CrossRef]
- Metsaranta, J.M.; Lieffers, V.J. Inequality of size and size increment in Pinus banksiana in relation to stand dynamics and annual growth rate. Ann. Bot. 2008, 101, 561–571. [Google Scholar] [CrossRef] [PubMed]
- Chen, B.J.W.; During, H.J.; Vermeulen, P.J.; Anten, N.P.R. The presence of a below-ground neighbour alters within-plant seed size distribution in Phaseolus vulgaris. Ann. Bot. 2014, 114, 937–943. [Google Scholar] [CrossRef] [PubMed]
- Gastwirth, J.L. A general definition of the Lorenz curve. Econometrica 1971, 39, 1037–1039. [Google Scholar] [CrossRef]
- Gastwirth, J.L. The estimation of the Lorenz curve and Gini index. Rev. Econ. Stat. 1972, 54, 306–316. [Google Scholar] [CrossRef]
- McDonald, J.B. Some generalized functions for the size distribution of income. Econometrica 1984, 52, 647–663. [Google Scholar] [CrossRef]
- Huey, R.B.; Stevenson, R.D. Integrating thermal physiology and ecology of ectotherms: A discussion of approaches. Am. Zool. 1979, 19, 357–366. [Google Scholar] [CrossRef]
- Lian, M.; Shi, P.; Zhang, L.; Yao, W.; Gielis, J.; Niklas, K.J. A generalized performance equation and its application in measuring the Gini index of leaf size inequality. Trees Struct. Funct. 2023, 37, 1555–1565. [Google Scholar] [CrossRef]
- Sitthiyot, T.; Holasut, K. A universal model for the Lorenz curve with novel applications for datasets containing zeros and/or exhibiting extreme inequality. Sci. Rep. 2023, 13, 4729. [Google Scholar] [CrossRef]
- Sarabia, J.-M. A hierarchy of Lorenz curves based on the generalized Tukey’s lambda distribution. Econom. Rev. 1997, 16, 305–320. [Google Scholar] [CrossRef]
- Sarabia, J.-M.; Castillo, E.; Slottje, D.J. An ordered family of Lorenz curves. J. Econom. 1999, 91, 43–60. [Google Scholar] [CrossRef]
- Lenth, R.V. Algorithm AS 226: Computing noncentral beta probabilities. J. R. Stat. Soc. Ser. C. Appl. Statist. 1987, 36, 241–244. [Google Scholar] [CrossRef]
- Johnson, N.L.; Kotz, S.; Balakrishnan, N. Continuous Univariate Distributions, 2nd ed.; Wiley: New York, NY, USA, 1995; Volume 1. [Google Scholar]
- Cohen, J.E.; Xu, M. Random sampling of skewed distributions implies Taylor’s power law of fluctuation scaling. Proc. Natl. Acad. Sci. USA 2015, 112, 7749–7754. [Google Scholar] [CrossRef] [PubMed]
- Yu, K. Quantification of Stomatal Morphology and the Relationship between Stomatal Size and Stomatal Density in 12 Magnoliaceae Species. Master’s Thesis, Nanjing Forestry University, Nanjing, China, 2023. [Google Scholar]
- Zhang, L.; Niklas, K.J.; Niinennets, Ü.; Li, Q.; Yu, K.; Li, J.; Chen, L.; Shi, P. Stomatal area estimation based on stomatal length and width of four Magnoliaceae species: Even “kidney”-shaped stomata are not elliptical. Trees Struct. Funct. 2023, 37, 1333–1342. [Google Scholar] [CrossRef]
- Shi, P.; Ratkowsky, D.A.; Li, Y.; Zhang, L.; Lin, S.; Gielis, J. A general leaf area geometric formula exists for plants—Evidence from the simplified Gielis equation. Forests 2018, 9, 714. [Google Scholar] [CrossRef]
- Su, J.; Niklas, K.J.; Huang, W.; Yu, X.; Yang, Y.; Shi, P. Lamina shape does not correlate with lamina surface area: An analysis based on the simplified Gielis equation. Glob. Ecol. Conserv. 2019, 19, e00666. [Google Scholar] [CrossRef]
- Shi, P.; Gielis, J.; Quinn, B.K.; Niklas, K.J.; Ratkowsky, D.A.; Schrader, J.; Ruan, H.; Wang, L.; Niinemets, Ü. ‘biogeom’: An R package for simulating and fitting natural shapes. Ann. N. Y. Acad. Sci. 2022, 1516, 123–134. [Google Scholar] [CrossRef]
- R Core Team. R: A Language and Environment for Statistical Computing; R Foundation for Statistical Computing: Vienna, Austria, 2024; Available online: https://www.rproject.org/ (accessed on 1 April 2024).
- Wang, J.; Shi, P.; Yao, W.; Wang, L.; Li, Q.; Tan, R.; Niklas, K.J. The scaling relationship between perianth fresh mass and area: Proof of concept using Magnolia soulangeana Soul.-Bod. Trees Struct. Funct. 2024, 38, 241–249. [Google Scholar] [CrossRef]
- He, K.; Hui, C.; Yao, W.; Wang, J.; Wang, L.; Li, Q.; Shi, P. Evidence that field muskmelon (Cucumis melo L. var. agrestis Naud.) fruits are solids of revolution. Plants 2023, 12, 4186. [Google Scholar] [CrossRef]
- Shi, P.; Quinn, B.K.; Chen, L.; Gao, J.; Schrader, J. Quantifying α-diversity as a continuous function of location − A case study of a temperate forest. J. For. Res. 2023, 34, 1683–1691. [Google Scholar] [CrossRef]
- Nelder, J.A.; Mead, R. A simplex method for function minimization. Comput. J. 1965, 7, 308–313. [Google Scholar] [CrossRef]
- Spiess, A.-N.; Neumeyer, N. An evaluation of R2 as an inadequate measure for nonlinear models in pharmacological and biochemical research: A Monte Carlo approach. BMC Pharmacol. 2010, 10, 6. [Google Scholar] [CrossRef] [PubMed]

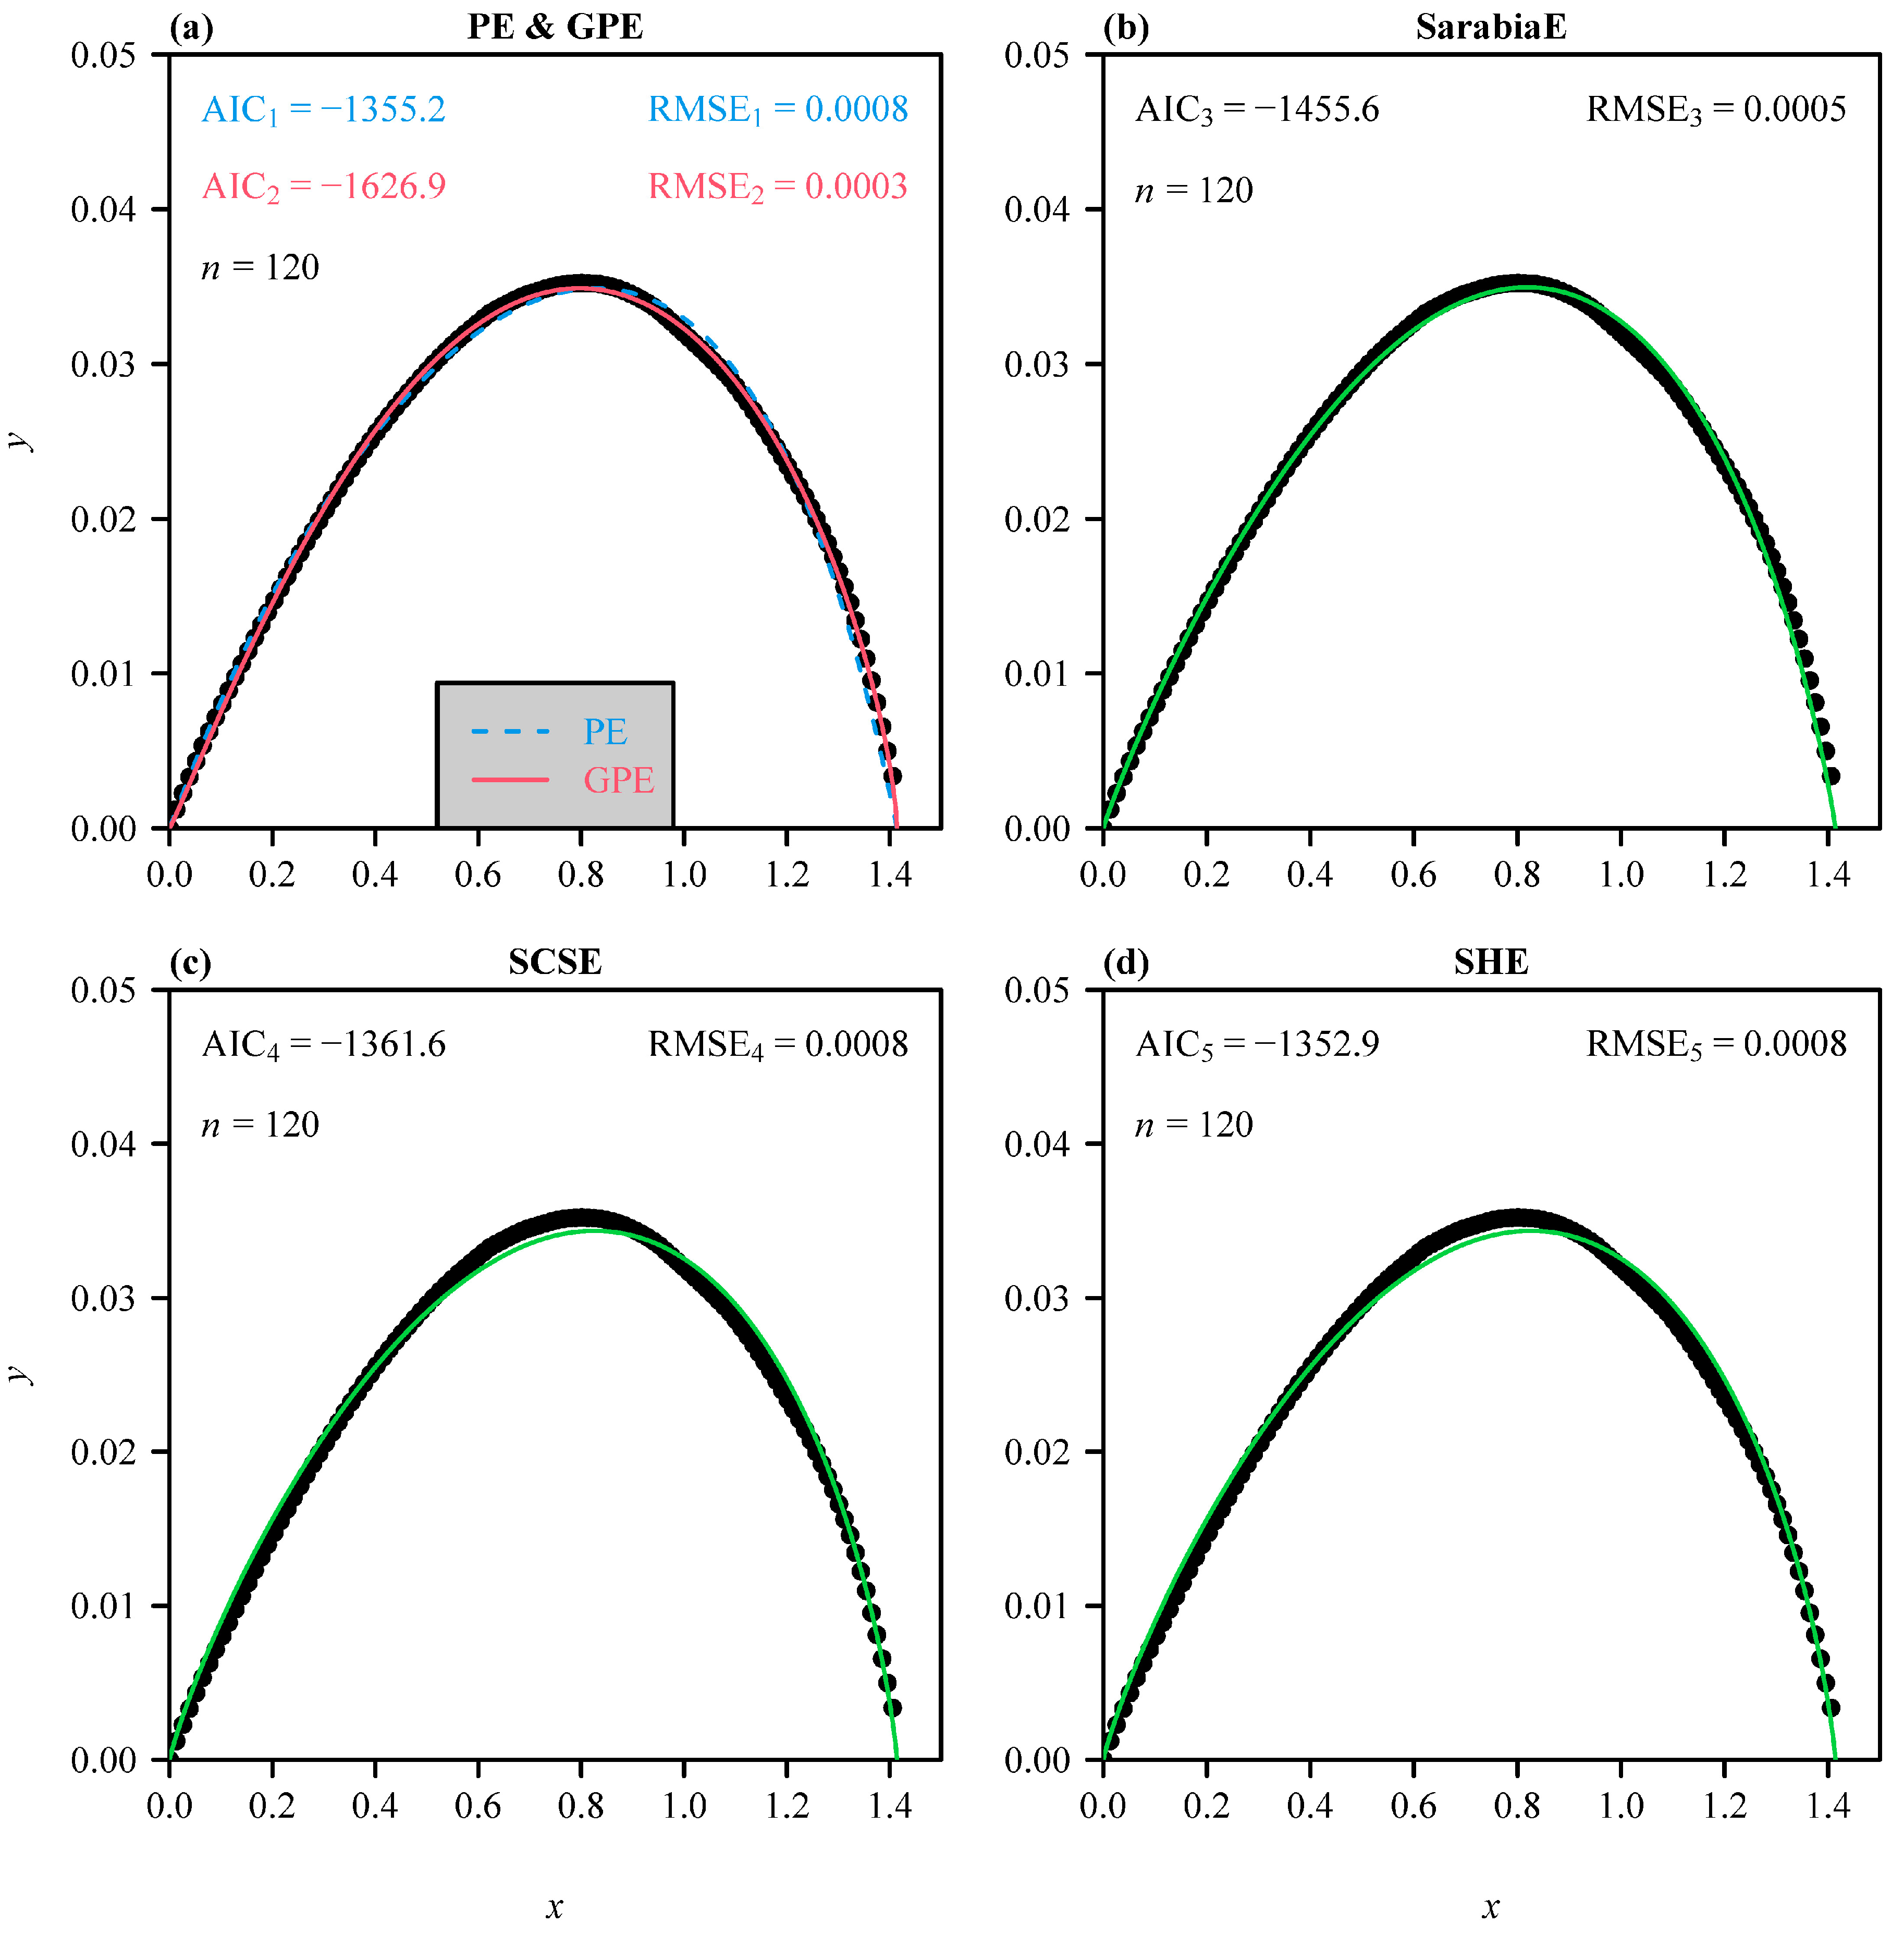
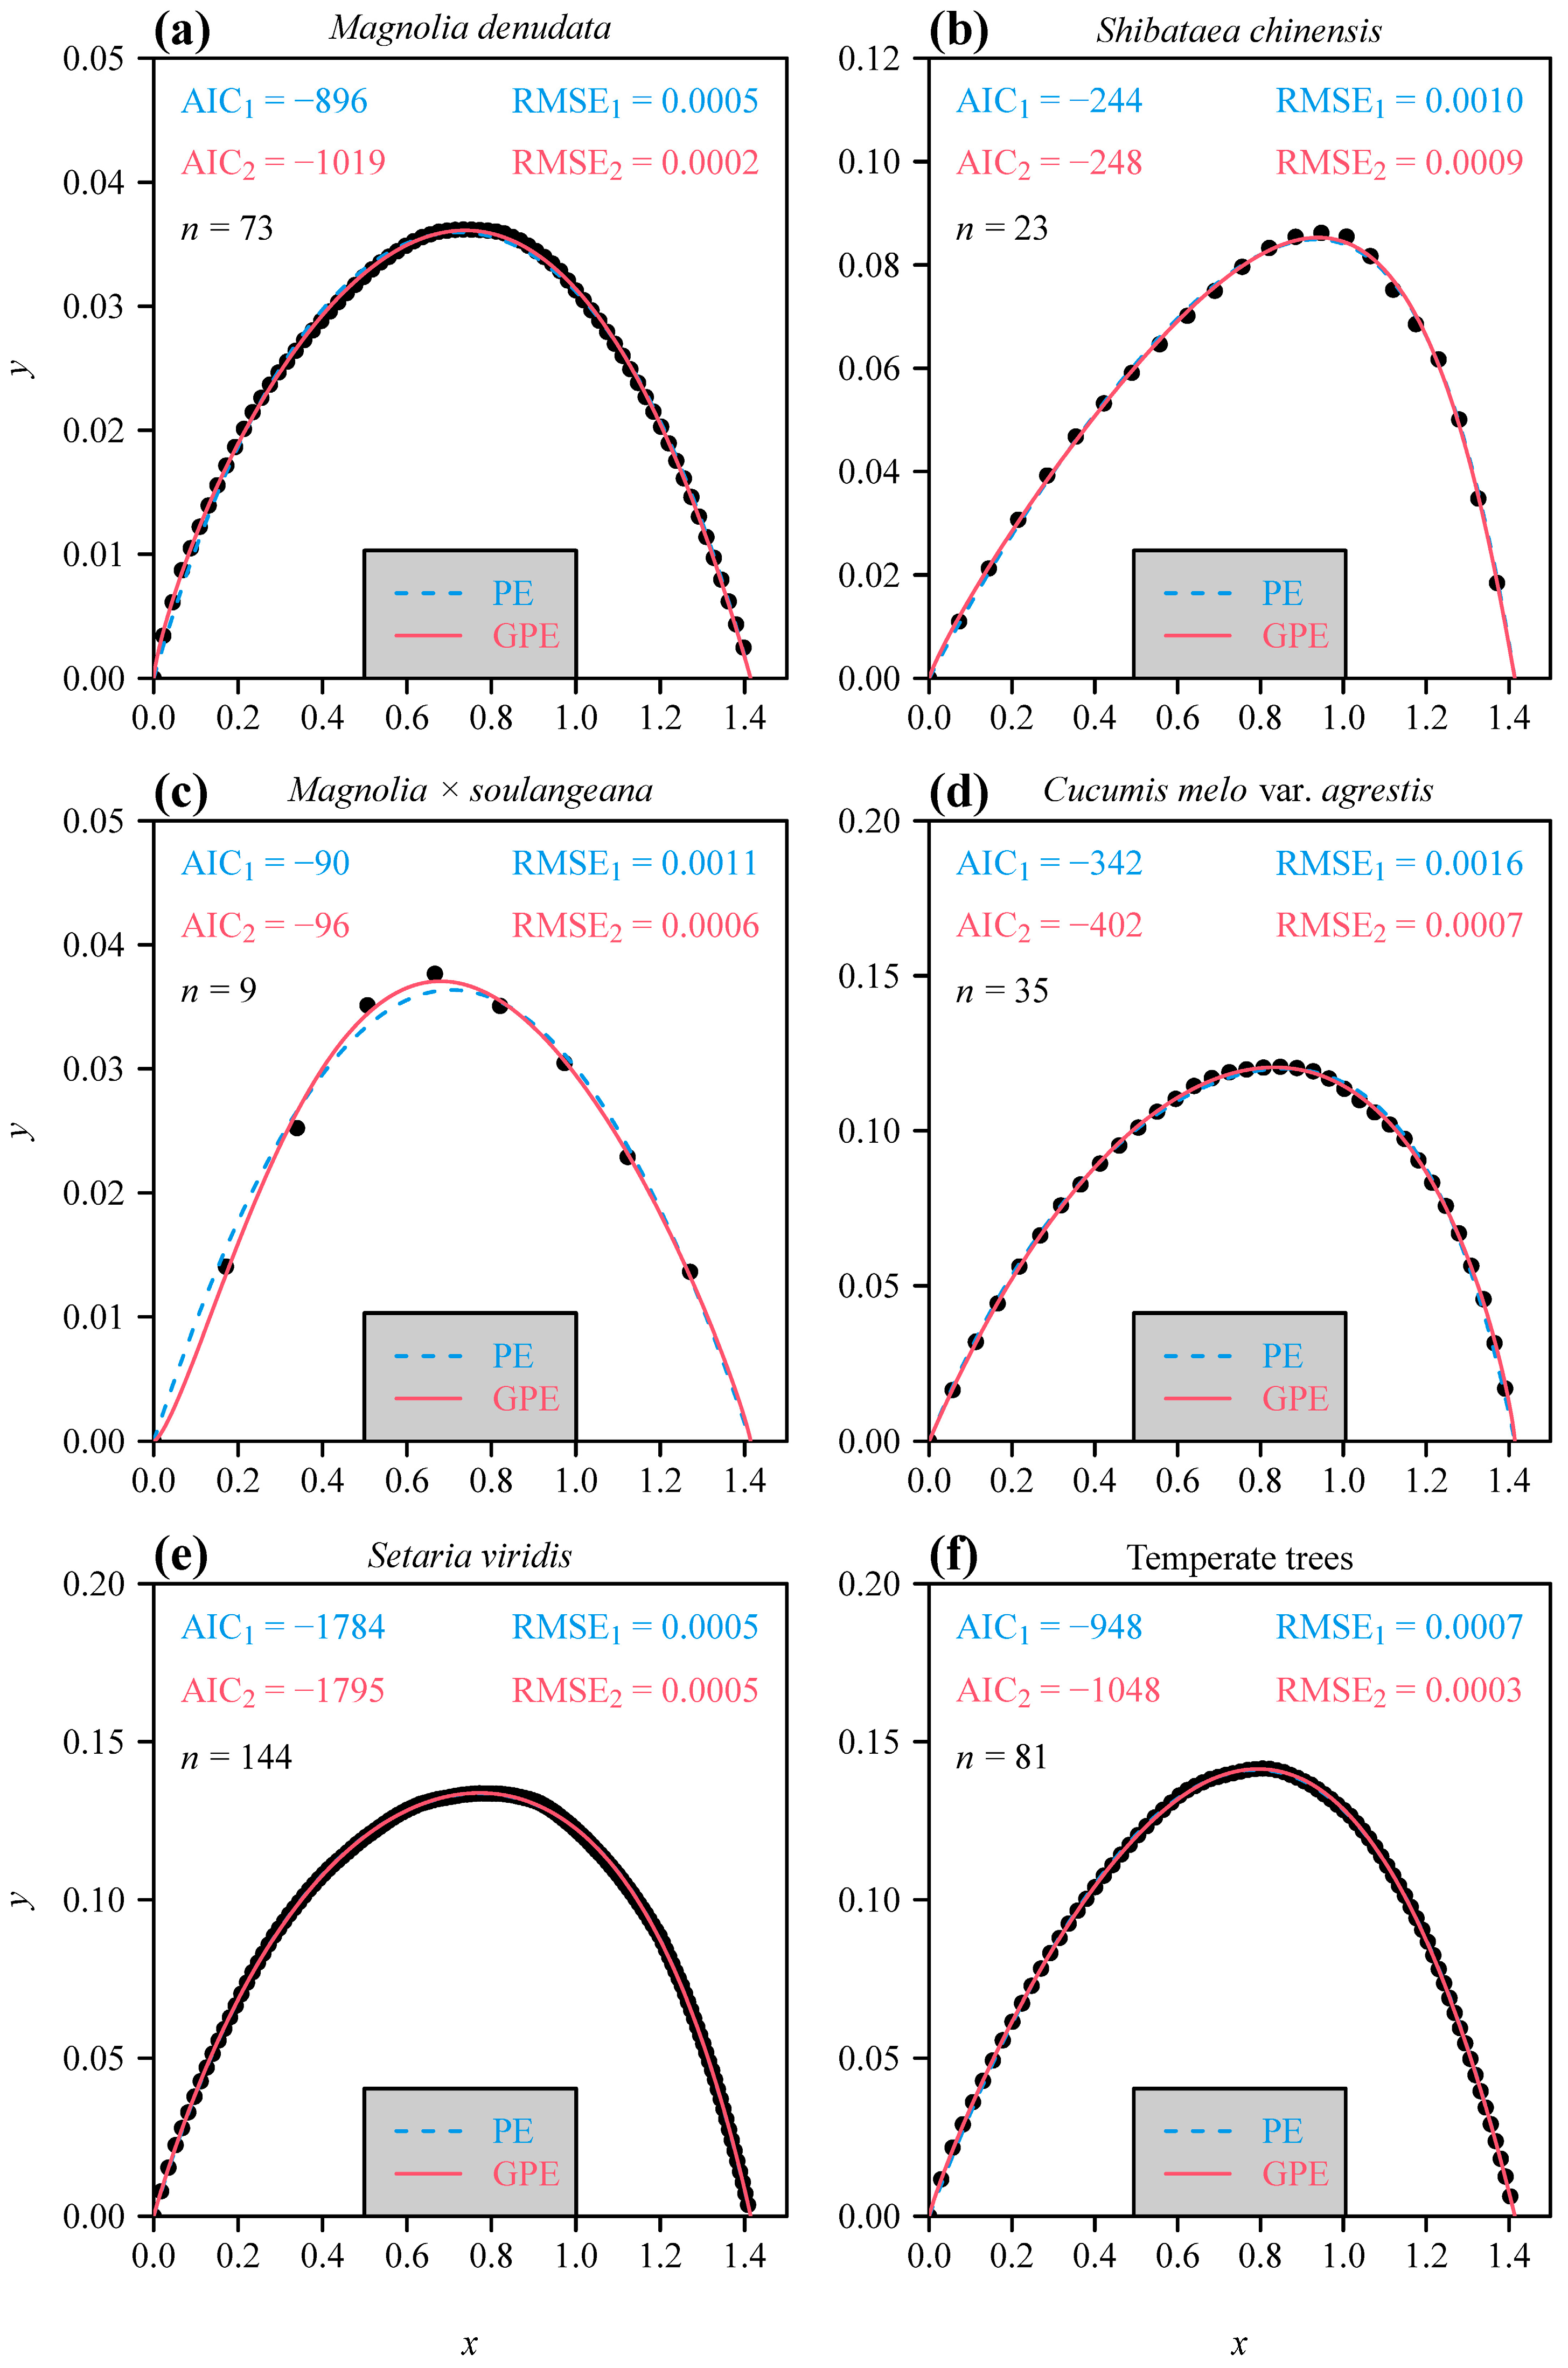

| Species | Indicator | PE | GPE | SarabiaE | SCSE | SHE |
|---|---|---|---|---|---|---|
| Magnolia denudata (n = 73) | RMSE | 0.000495 | 0.000208 | 0.000339 | 0.001084 | 0.001065 |
| AIC | −896.07 | −1018.87 | −949.32 | −781.64 | −782.21 | |
| Shibataea chinensis (n = 23) | RMSE | 0.001009 | 0.000854 | 0.002536 | 0.002536 | 0.002410 |
| AIC | −244.09 | −247.73 | −199.67 | −201.67 | −202.02 | |
| Magnolia × soulangeana (n = 9) | RMSE | 0.001066 | 0.000614 | 0.001031 | 0.002510 | 0.002529 |
| AIC | −89.64 | −95.58 | −88.26 | −74.24 | −72.10 | |
| Cucumis melo var. agrestis (n = 35) | RMSE | 0.001629 | 0.000654 | 0.000769 | 0.000778 | 0.001190 |
| AIC | −342.05 | −401.99 | −392.59 | −393.76 | −362.02 | |
| Setaria viridis (n = 144) | RMSE | 0.000480 | 0.000456 | 0.000972 | 0.001157 | 0.001694 |
| AIC | −1784.25 | −1795.15 | −1579.08 | −1530.83 | −1418.96 | |
| Temperate trees (n = 81) | RMSE | 0.000664 | 0.000347 | 0.000446 | 0.003821 | 0.003667 |
| AIC | −947.58 | −1048.44 | −1010.12 | −664.02 | −668.68 |
Disclaimer/Publisher’s Note: The statements, opinions and data contained in all publications are solely those of the individual author(s) and contributor(s) and not of MDPI and/or the editor(s). MDPI and/or the editor(s) disclaim responsibility for any injury to people or property resulting from any ideas, methods, instructions or products referred to in the content. |
© 2024 by the authors. Licensee MDPI, Basel, Switzerland. This article is an open access article distributed under the terms and conditions of the Creative Commons Attribution (CC BY) license (https://creativecommons.org/licenses/by/4.0/).
Share and Cite
Shi, P.; Deng, L.; Niklas, K.J. Rotated Lorenz Curves of Biological Size Distributions Follow Two Performance Equations. Symmetry 2024, 16, 565. https://doi.org/10.3390/sym16050565
Shi P, Deng L, Niklas KJ. Rotated Lorenz Curves of Biological Size Distributions Follow Two Performance Equations. Symmetry. 2024; 16(5):565. https://doi.org/10.3390/sym16050565
Chicago/Turabian StyleShi, Peijian, Linli Deng, and Karl J. Niklas. 2024. "Rotated Lorenz Curves of Biological Size Distributions Follow Two Performance Equations" Symmetry 16, no. 5: 565. https://doi.org/10.3390/sym16050565
APA StyleShi, P., Deng, L., & Niklas, K. J. (2024). Rotated Lorenz Curves of Biological Size Distributions Follow Two Performance Equations. Symmetry, 16(5), 565. https://doi.org/10.3390/sym16050565


