Article

Accelerated Stability Testing in Food Supplements Underestimates Shelf Life Prediction of Resveratrol with Super-Arrhenius Behavior

by
Andrea Biagini
1,2,
Nicola Refrigeri
3,
Concetta Caglioti
1,2,
Paola Sabbatini
2,
Silvia Ticconi
3,
Giada Ceccarelli
4,
Rossana Giulietta Iannitti
4,
Federico Palazzetti
2,* and
Bernard Fioretti
2,*
1
Department of Medicine and Surgery, Perugia Medical School, University of Perugia, Piazza Lucio Severi 1, 06132 Perugia, Italy
2
Department of Chemistry, Biology and Biotechnologies, University of Perugia, Via dell’Elce di Sotto 8, 06123 Perugia, Italy
3
La Sorgente del Benessere srl, Via Prenestina 141, 03014 Fiuggi, Italy
4
S&R Farmaceutici S.p.A., Via dei Pioppi 2, 08063 Bastia Umbra, Italy
*
Authors to whom correspondence should be addressed.
Symmetry 2024, 16(4), 493; https://doi.org/10.3390/sym16040493
Submission received: 20 February 2024 / Revised: 26 March 2024 / Accepted: 8 April 2024 / Published: 18 April 2024

Abstract

:
Thermo-oxidative stability testing plays a critical role in accurately predicting shelf life. These tests are performed in real time and under stress conditions, where degradation processes are accelerated by increasing storage conditions. In this study, high-performance liquid chromatography (HPLC) analyses were performed to evaluate the degradation of resveratrol in nutraceutical tablets as a function of time under different storage conditions in terms of temperature and relative humidity (RH), namely 25 °C/60% RH, 30 °C/65% RH, and 40 °C/75% RH. The latter is an accelerated test and is used to estimate shelf life for long-term storage. Resveratrol is present in both pure form and as a solid dispersion on magnesium dihydroxide microparticles (Resv@MDH). Degradation kinetic constants were determined at 25 °C, 30 °C, and 40 °C, and the Arrhenius behavior of the kinetic constants as a function of temperature was verified. The main results of this work are as follows: (i) the stability of resveratrol in nutraceutical tablets is affected by temperature; (ii) the dependence of the kinetic constants on temperature does not follow the Arrhenius equation, determining an overestimation of the degradation rate at 25 °C; in this regard a modified version of the Arrhenius equation that takes into account the deviation from linearity has been used to estimate the dependence of the kinetic constant on the temperature. These results suggest that accelerated testing does not provide a general model for predicting the shelf life of foods and dietary supplements. The reason may be due to possible matrix effects that result in different degradation mechanisms depending on the temperature. In this regard, symmetry relationships in the kinetics of chemical reactions resulting from microscopic reversibility and their relationship to the deviation from the Arrhenius equation are discussed. However, further research is needed to characterize the degradation mechanisms at different temperatures. The results of these studies would allow accurate prediction of food degradation to improve food safety and risk management and reduce food waste. In addition, knowledge of stability processes is necessary to ensure the maintenance of physiological processes by dietary supplements.

1. Introduction

Shelf life is defined as the length of time a product can be stored without becoming unfit for use or consumption. The labels currently used on food and beverage products provide an expected shelf life based on kinetic models designed to predict thermo-oxidative stability. Stability refers to the ability of a product to retain its specified properties during storage and use [1]. It considers how storage conditions such as temperature and humidity affect a product and predicts how long a product will last [2,3]. Stability studies must take into account several factors such as drug substance stability, excipient interactions, manufacturing processes, dosage forms, and packaging and storage conditions. Degradation reactions (e.g., oxidation, hydrolysis, racemization, reduction) depend on various parameters such as temperature and humidity, which can negatively affect product stability [4,5]. Combined with appropriate kinetic models and data extrapolation based on Arrhenius plots, stability tests are performed to predict shelf life to improve the safety, reliability, and sustainability of food supplements and reduce food waste [6,7,8]. Experimental observation has shown that the Arrhenius equation is sometimes not suitable for describing kinetic models because of the lack of linear dependence of the kinetic constants on temperature. Many formulations have been proposed to describe and interpret experiments, often developed specifically for the system under study, not only for chemical reactions but also for applications in food storage. For a review of non-Arrhenius equations and applications, see J. Kohout [9]. Stability studies are essential in the pharmaceutical industry to ensure the quality, safety, and efficacy of a product throughout its shelf life. These studies follow guidelines from organizations such as the International Conference on Harmonization (ICH) and the World Health Organization (WHO) [10,11,12]. Specific tests are carried out under humidity and temperature conditions typical of certain climatic zones to determine the shelf life and expiry date of products [1], through the use of real-time and accelerated stability tests [13]. The former are carried out by keeping the product under normal storage conditions to study degradation below its specification, while the latter consist of storing products under stress conditions such as elevated temperatures, or humidity, light, agitation, gravity, or pH variations to accelerate degradation [13,14].
In this work, a stability study was carried out to evaluate the degradation of resveratrol, a well-known nutraceutical compound contained in a food supplement. The interest in this study stems from the fact that accelerated tests may not provide an accurate estimate of component degradation under the conditions considered in determining shelf life. Resveratrol, one of the most widely used nutraceuticals in food supplements, was chosen. Resveratrol (3,4′,5′-trihydroxystilbene) is a stilbene consisting of two aromatic rings linked by an ethylene bridge. It is also classified as a phytoalexin because it is produced by higher plants in response to infection or other stressors to act as an antibiotic [15].
Resveratrol occurs naturally in both cis and trans forms. Trans-resveratrol is the most stable and biologically active form and is found in several plants and fruits [16]. It owes its fame to the “French paradox” [17] and its ability to exert beneficial effects at micromolar concentrations [18,19]. In addition to its role in cardioprotection [17,20], resveratrol is also important in cancer therapy [21,22,23], fertility [24,25,26], as a modulator of the human gut microbiota [27], and cellular immune response [28]. Previous studies have shown that the resveratrol content in fruits can be degraded after cooking or heat processing [29], or when dissolved in solution at a pH above 6.8 [30]. In addition, phenolic compounds are susceptible to thermal degradation or oxidation due to their structure [5,31]. Stability studies of resveratrol and its glycon were performed on a mixture with a whole grape extract stored at 25 °C/60% RH and 40 °C/75% RH for up to 42 months [32] and on samples of solid crystalline material of pure resveratrol (and trans-resveratrol glucoside) stored at 40 °C/75% RH for 3 months [33]. In both cases, the results showed that resveratrol is a stable compound.
Here, for the first time, the degradation of resveratrol in nutraceutical tablets [24,26] at different storage temperatures and times was determined. Kinetic constants for the three storage temperatures were derived from the degradation as a function of time. The dependence of the kinetic constant, k, on temperature, T, was then checked to see if it followed the Arrhenius equation, and since the dependence between ln k and 1/T was not linear, the constants were fitted with an equation that took into account deviations from Arrhenius law. This allows consideration of accelerated stability tests conducted at 40 °C and 75% humidity, which in this case tend to overestimate the degradation of resveratrol at a storage temperature of 25 °C.
The problem of symmetry relations in the chemical kinetics of time-reversible processes is discussed in view of a prospective study of the relationship between the symmetry of reversible processes and non-Arrhenius behaviors [34].
The article is structured as follows: Section 2 summarizes the materials and methods; Section 3 reports the results; Section 4 presents the discussion; finally, Section 5 concludes the article.

2. Materials and Methods

2.1. Materials

Reagents and solvents from commercial suppliers (Carlo Erba Reagents, Cornaredo, MI, Italy) were used directly without further purification. High-performance liquid chromatography (HPLC)-grade solvents were used. Resveratrol powder was purchased from Sigma Aldrich (St. Louis, MO, USA, purity > 98%). For the degradation study, the resveratrol contained in tablets of a nutraceutical preparation was used [24,26], where the resveratrol is present as a combination of a pure form and a form that is supported on microparticles of a magnesium dihydroxide formulation, Resv@MDH [18,19,35], according to the declared composition. The microparticle formulation has the advantage of improving dissolution kinetics in gastric simulant fluid [19].

2.2. Apparatus

The following instruments were used for resveratrol extraction from tablets: ultrasonic bath (AU-65, Argo Lab, Carpi, MO, Italy), centrifuge (5418R, Eppendorf, Hamburg, Germany). For the analysis of resveratrol degradation, a Varian ProStar Model 210 (Spectralab Scientific Inc., Markhan, ON, Canada) HPLC instrument was used, equipped with an Agilent Eclipse plus reversed-phase column (C18, 4.6 × 100 mm, 3.5 μm; Santa Clara, CA, USA), and a variable wavelength detector set at 260 nm.

2.3. Degradation Experiments

Tablets were stored at 25 °C and 60% RH, 30 °C and 65% RH, 40 °C and 75% RH. Analyses were performed on the tablets at t0 (fresh batch), after three months (t3), and after six months’ (t6) storage for tablets stored at 25 °C, 30 °C, and 40 °C; and after twelve months (t12) and twenty-four months (t24) for tablets stored at 25 °C and 30 °C.

2.4. Extraction of Resveratrol from Tablets

Resveratrol was analyzed by adapting the procedures reported in refs. [36,37]. For each analysis, three tablets of the finished nutraceutical product were independently weighed and ground with a pestle in a mortar. A 0.05 g portion of the powder was diluted with 1 mL of a 75:25 ethanol/water mixture, vortexed for 15 s, and treated in an ultrasonic bath for 15 min. The solution was then centrifuged at 7000 rpm for 10 min, and the supernatant was collected and diluted in 1 mL of the above mixture. The mixture was vortexed and treated again in an ultrasonic bath. The supernatants were combined and 20 μL was diluted in 980 μL of an ethanol/water mixture.

2.5. Chromatographic Experiments

2.5.1. Preparation of Calibration Solutions

A 0.4 mg/mL stock solution of resveratrol was prepared by dissolving the reference powder in a solvent solution containing water and 0.1% formic acid. Calibration solutions were prepared at the following concentrations: 0.01, 0.025, 0.050, 0.075, 0.100 mg/mL. These concentrations correspond to those expected in the solutions prepared from the sample.

2.5.2. HPLC Analysis

Isocratic elution was carried out using a mobile phase consisting of a solution (A) of methanol with 0.05% v/v formic acid and a solution (B) of acetonitrile with 0.05% v/v formic acid. The two solutions were in the ratio A:B, 30:70, and the eluent flow was 1 mL/min.

2.5.3. Calculation and Expression of Results

The composition of resveratrol was determined by interpolating the peak response area given by the sample solution, As, in the calibration curve: composition (AsA0)/m, where A0 is the intercept of the curve and m is the slope.

2.6. Arrhenius Equation

Accelerated stability tests allow the degradation rate at a given temperature to be estimated using the Arrhenius equation (Equation (1)),
k = A × e E a R T
where k is the kinetic constant of the degradation process, A is called the frequency factor or pre-exponential factor, Ea is the activation energy of the chemical reaction(s) governing the degradation process, R is the universal gas constant (0.008314 kJ/mol), and T is the absolute temperature.
In the Arrhenius equation, the kinetic constant has an exponential dependence on the reciprocal of the temperature. The Arrhenius equation is used to estimate the stability at a given storage temperature for a given time, based on observed degradation at a higher temperature for a shorter storage time [3,38]. The Arrhenius equation is often expressed in logarithmic form (Equation (2)),
ln k = ln A E a R T
which shows the linear relationship between ln k and 1/T, allowing a direct evaluation of ln A and Ea, the intercept and slope of the line, respectively.
All results are expressed as mean ± standard error (SE), where the standard error is expressed as the standard deviation divided by (n − 1)1/2, where n is the number of values.

3. Results

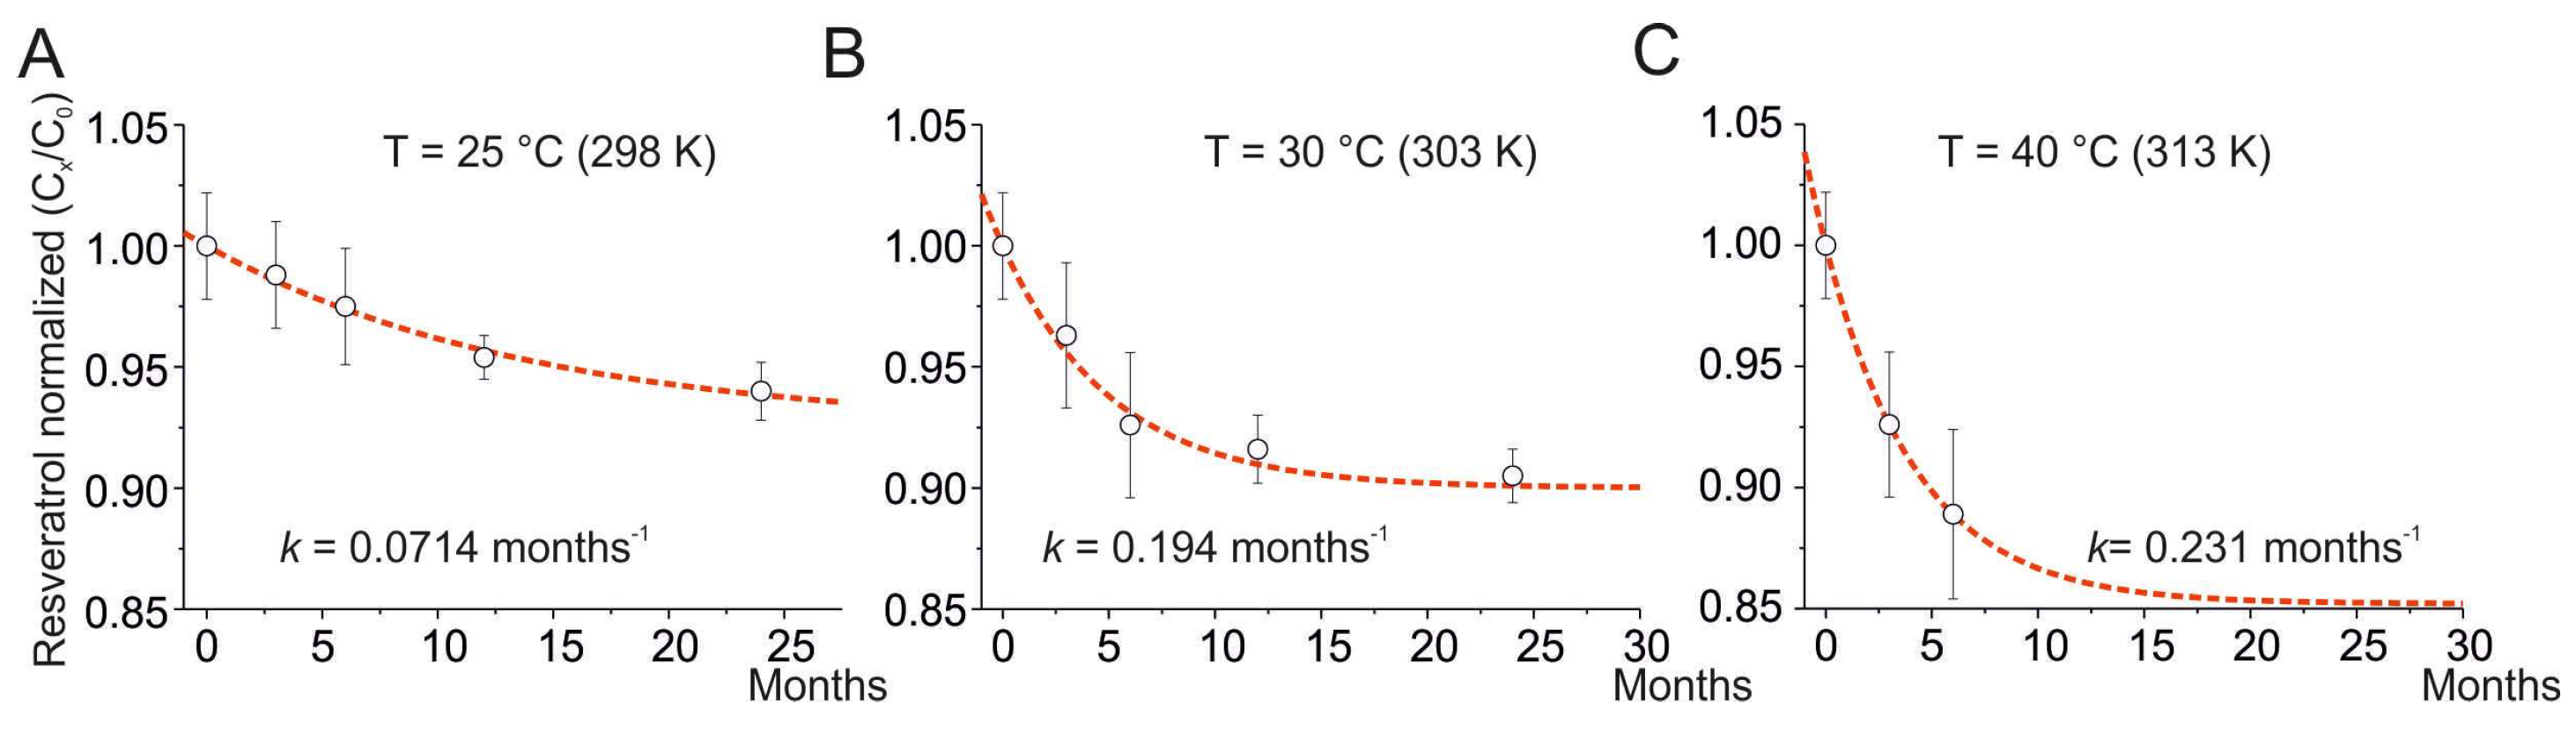
3.1. Degradation of Resveratrol under Different Storage Conditions

The recovery of resveratrol from tablets was greater than 98%. HPLC analyses showed a progressive degradation of resveratrol at 25 °C, 30 °C, and 40 °C according to a mono-exponential kinetic equation (Equation (3)):
y = A + ( 1 A ) e k t
where y is the normalized resveratrol content, A is the component not involved in degradation, k is the kinetic constant in months−1, and t is the time in months. All the values obtained from this equation describing the degradation of resveratrol at different temperatures and the regression coefficient R2 are given in Table 1. Table 2 shows the normalized resveratrol content at various temperatures and storage times.
For T = 25 °C, the degradation rate was estimated to be k = 0.07140 ± 0.00007 months−1, R2 = 0.99785, and A = 0.926 (Figure 1A). For T = 30 °C, the degradation rate was estimated to be k = 0.1937 ± 0.0002 months−1, R2 = 0.98299, and A = 0.904 (Figure 1B). For T = 40 °C, the degradation rate was estimated to be k = 0.231 ± 0.002 months−1, R2 = 0.99785, and A = 0.8525 (Figure 1C). The degradation of resveratrol has been estimated for storage at 36 months using Equation (3) and resulted in a decrease of 6.8% for T = 25 °C, 9.6% for T = 30 °C, and 14.7% for T = 40 °C. For the three storage temperatures, the kinetics of the degradation processes follow first-order kinetics, indicating unimolecular processes. The kinetic constants vary with temperature, while the pre-exponential factor, A, represents the asymptotic limit of degradation (at large values of time) and increases with temperature, although to a lesser extent than the kinetic constants.
In Figure 2, the chromatogram for resveratrol stored at T = 25 °C, 60% RH, for 24 months is reported. The retention time is about 5 min.

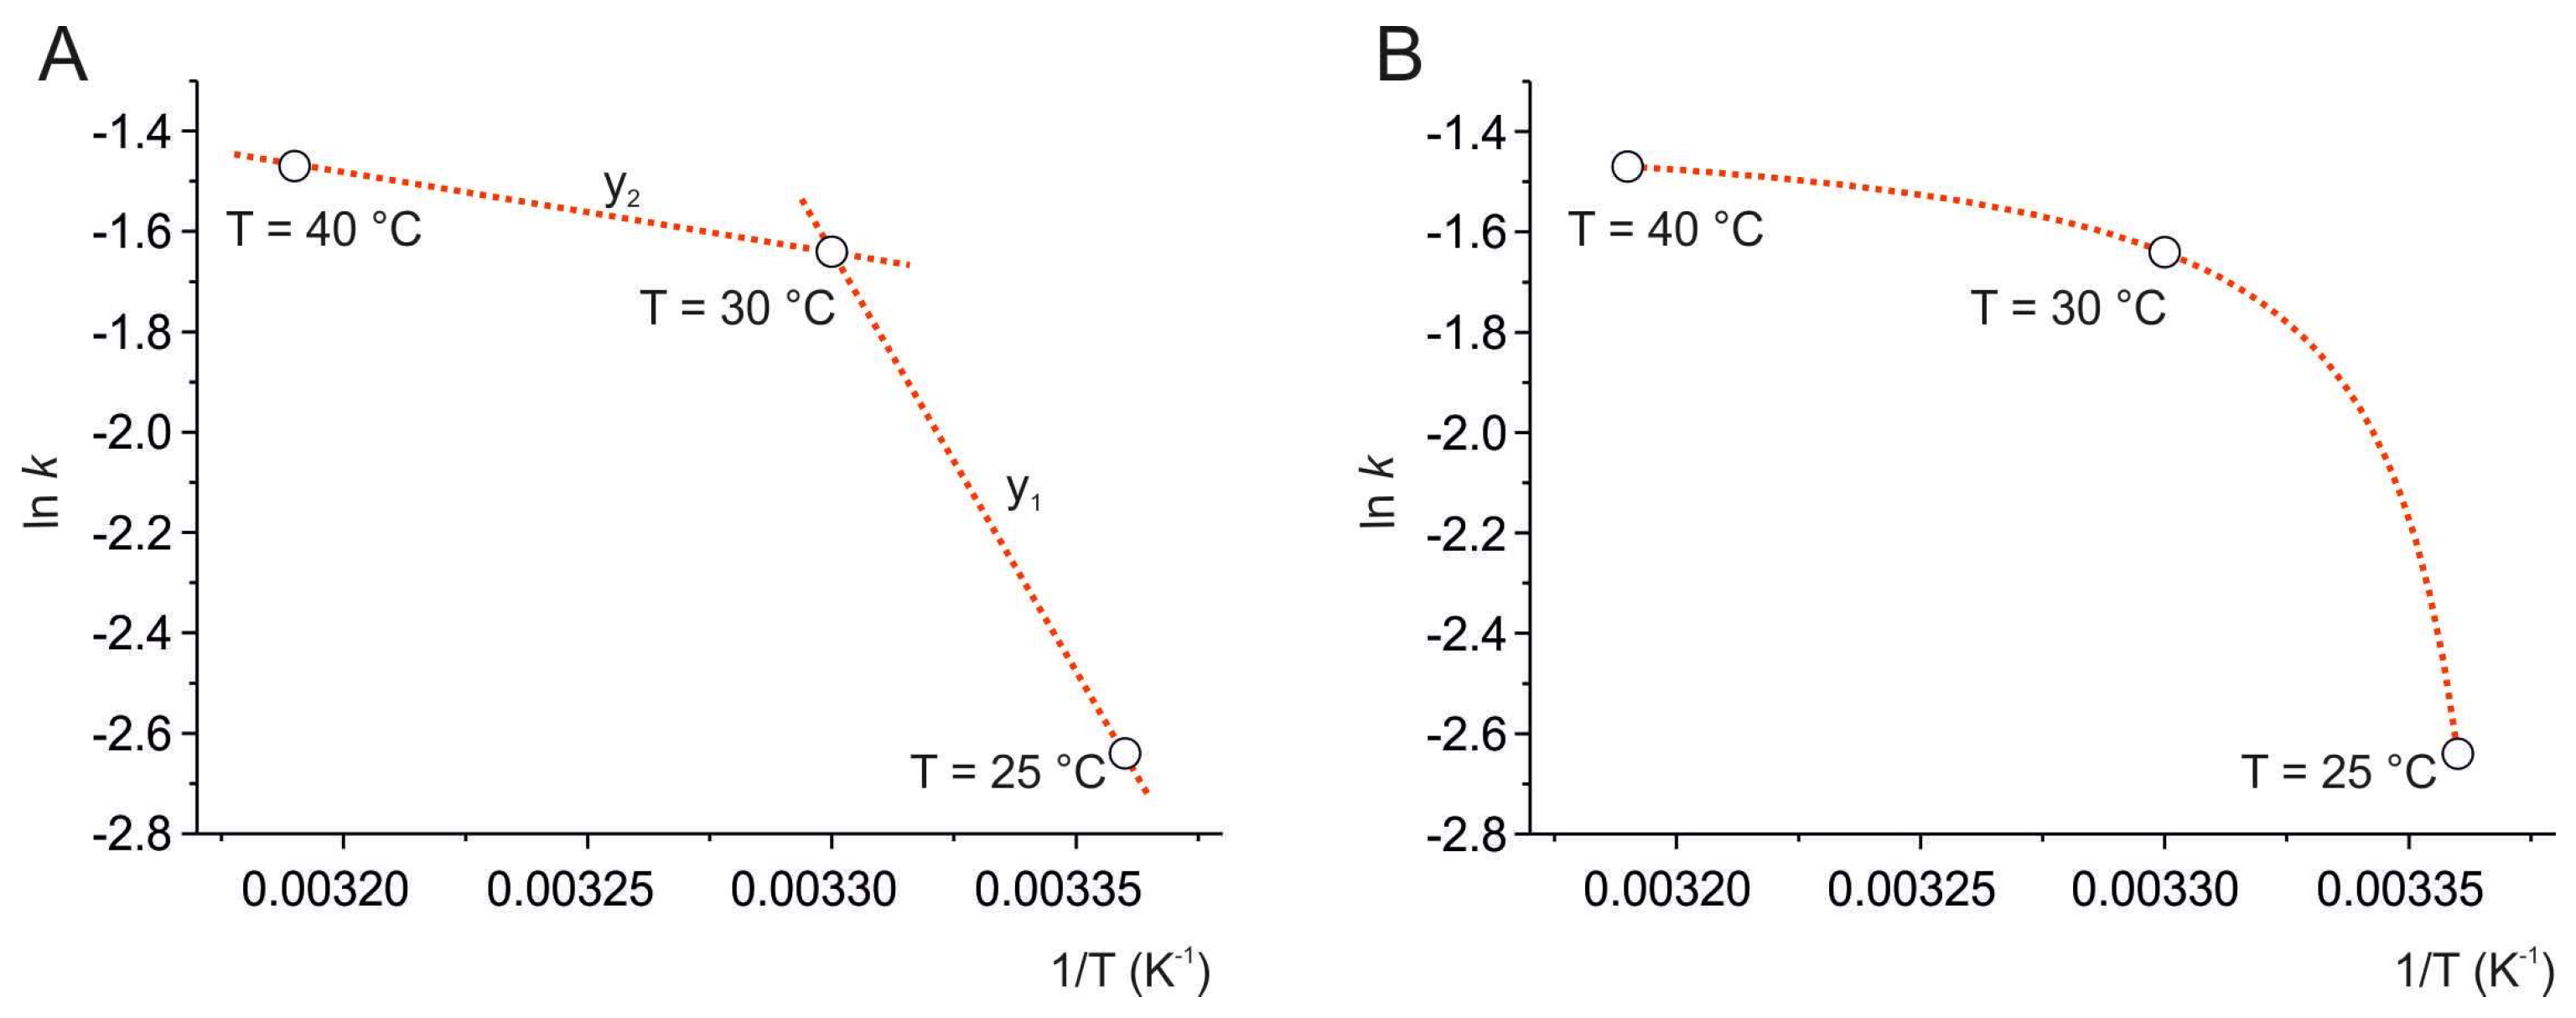
3.2. Dependence of the Kinetic Constant on the Temperature: The Arrhenius Equation

The natural logarithm of the kinetic constants (k from Equation (3)) was plotted as a function of reciprocal temperature, according to an Arrhenius plot, ln k vs. 1/T (Figure 3A). The three points were connected by two linear functions, according to the equation (Equation (4)):
y = m x + q
where m is the slope and the q is the intercept with the ordinate axis.
For the line between 25 °C and 30 °C (y1), m1 = −12,420.9 and q1 = 27.6; for the line between 30 °C and 40 °C (y2), m2 = −2770.6 and q2 = −4.2.
The three points show a nonlinear trend, indicating a non-Arrhenius behavior of the degradation process of resveratrol, which can be classified as a super-Arrhenius behavior, as it can be described by a convex curve [9,39].
Here, a variant of the Arrhenius equation (Equation (5)) was adopted that reproduces the experimental values of ln k vs. 1/T (Figure 3B), as proposed by Kohout et al. [9]. The formula introduces the parameter T0, which is subtracted from T, as follows:
ln k = ln k E R ( T T 0 )
where k = 0 when TT0.
The best fit was found by plotting ln k = −2.640 ± 0.001 at 25 °C, ln k = −1.640 ± 0.001 at 30 °C, and ln k = −1.470 ± 0.007 at 40 °C, and describes a curve that is defined by three parameters, where ln k = −1.355, −Ea/R = 1.991, and T0 = 296.068 K, corresponding to approximately 23 °C.

4. Discussion

Resveratrol has two geometric isomers, cis and trans-resveratrol. The latter is the most stable and the biologically active form. Both isomers possess the C1 group of symmetry: the three hydroxyl groups strongly reduce the symmetry in stilbene. The structure of trans-resveratrol is shown in Figure 4.
Resveratrol as a polyphenol can be used as a preservative, but it is also known that resveratrol is particularly unstable at pH ≥ 8, when exposed to UV light, high humidity, or high temperatures [29,30,40,41,42]. Whole grape extract enriched with 10% resveratrol complex was found to be stable when stored at 25 °C/60% RH and 40 °C/75% RH for up to 42 months [32]. Similar results were observed when pure resveratrol or its glycone form was stored at 40 °C/75% RH for 3 months [33]. The present work focused on the degradation of resveratrol as a combination of pure and microparticle-supported magnesium dihydroxide resveratrol formulation in a supplementary food, during long-term (25 and 30 °C) and accelerated (40 °C) stability tests, mimicking ICH Zone II conditions typical of Mediterranean and subtropical areas [43]. The results show a degradation process that follows a mono-exponential function for resveratrol over the test period: 24 months at 25 °C and 30 °C, and 6 months at 40 °C. Comparison with the results from refs. [32,33] shows that the degradation of resveratrol in the present investigation increases with the temperature, suggesting a possible role played by the matrix. The plot of the kinetic constants as a function of reciprocal temperature shows a nonlinear trend suggesting a non-Arrhenius behavior in the degradation of resveratrol. This behavior is probably due to a second reaction [44], or other mechanisms that take place at temperatures higher than 25 °C (Figure 3). Non-Arrhenius behavior, similar to that found in this study, has been reported for other products, such as red onion and strawberry, in storage [9,45].
The results show that the pre-exponential factor is only slightly affected by temperature, while the kinetic constant increases with temperature, although the dependence is not linear within the limited temperature range considered (from 25 °C to 40 °C). The increase of the kinetic constant is pronounced from 25 °C to 30 °C; it is about three times, while from 30 °C to 40 °C, it increases by a factor of about 1.2.
It could be assumed that there are different degradation processes depending on the temperature [46]. There are many cases in the literature where the kinetics cannot be adequately described by the Arrhenius model [47], and in such cases, a model is needed that takes into account deviations from the Arrhenius equation [9]. Fitting the experimental data with the modified Arrhenius equation given in Equation (5) (Figure 3B) confirms a non-Arrhenius behavior of the process. Such a behavior could be attributed to multiple reaction pathways depending on the temperature or to matrix effects. On this basis, the interpretation of the parameters derived from the plot is not direct. The Ea/R parameter for Arrhenius behavior corresponds to the activation energy of the reaction, while for non-Arrhenius behavior, the interpretation requires further study. As far as the T0 parameter is concerned, as stated in [9], a physical interpretation cannot be made. For the moment, it can be noted that T0 allows the absolute zero temperature to be shifted to values close to 296 K, which shifts the nonlinear behavior to the temperature range of interest in this work. It has been observed that a temperature below T0 is the condition for better long-term storage [9].
Usually, first-order reactions describe degradation processes [48,49]. As already seen with other polyphenols, such as anthocyanins [50,51,52], the k values increased with increasing temperature [51], but the degradation rate constants fitted an Arrhenius-type equation [51,52]. Ascorbic acid (vitamin C), which is chemically different from polyphenols, also follows the Arrhenius relationship when exposed to temperature [53], with its degradation increasing with increasing storage temperature [54], as has been observed for the thermal degradation of carotenoids [55]. These studies, in agreement with the one presented here, follow first-order degradation kinetics.
The main result of this study is that the degradation rate constant (ln k) does not depend linearly on the reciprocal temperature; the reasons for this need to be investigated. The change in the kinetics during the long-term stability tests at higher temperatures or the accelerated tests raises some doubts about the use of these tests themselves, as they seem to show some weakness in the guarantee of an accurate prediction of the shelf life of food products, given the Arrhenius plot obtained. In this work, a modified version of the Arrhenius equation was used to predict the stability of resveratrol (see Equation (5)). This alternative model allows for the reproduction of nonlinear behaviors such as those found in this stability study, and, thus, it can be argued that in stability studies, a linear dependence of degradation kinetics on temperature cannot be assumed, as this could lead to incorrect estimates.
The different asymptotic limits of degraded resveratrol for t∞ (see Figure 1 and parameter A in Table 1) indicate that the maximum amount of degraded product varies with temperature. This suggests that temperature affects not only the kinetics but also the equilibrium reaction. This aspect leads us to hypothesize that the reactions are microscopically reversible, although this will have to be studied more thoroughly in the future. The detailed equilibrium relationship states that for reversible unimolecular reactions, A B , the relationship K = k f / k r holds, where K is the equilibrium constant and is given by the ratio of the concentrations of the products and reactants at equilibrium, and kf and kr are the direct and inverse kinetic constants, respectively. This relationship can be applied only to elementary processes, i.e., those in which no intermediate complexes are formed, or even to processes in which intermediate complexes are formed, but in which the elementary steps of the reaction are identified. In Adib 2005 [34], it is shown that a relation similar to K = k f / k r also holds in the case of complex reactions in which detailed equilibrium requirements cannot be satisfied. The relationship in question is K = C f B ( t ) / C r A ( t ) , where C f B t   is the concentration of B in the forward reaction at time t and C r A t is the concentration of A in the forward reaction, also at time t. This equation establishes that a symmetry relationship can exist between direct AB and reverse BA reactions, even if they start from different experimental conditions. In the case of a process with non-Arrhenius behavior, the range of existence of this symmetry relationship may not always be verified, and certainly not in the case where deviation from linearity occurs because the system follows different reactive processes depending on the temperature, as is likely to be the case here. Therefore, in the case of reversible degradative processes of resveratrol, it will be necessary to establish symmetry relationships for “high temperatures”, which include the conditions at which the accelerated test takes place (40 °C) and for “low temperatures” characteristic of the conditions of the IIA zone (25 °C).

5. Conclusions

The objective of this work was to verify the reliability of accelerated testing to assess the stability of resveratrol in a dietary supplement. The degradation of resveratrol was measured under different storage conditions: at 25 °C and 60% RH for 24 months, at 30 °C and 75% RH for 24 months, at 40 °C and 75% RH for 6 months. For each degradation process, the kinetic constant, k, was determined to be 0.07140 months−1 for storage at 25 °C, 0.1937 months−1 for storage at 30 °C, and 0.231 months−1 for storage at 40 °C. In all three cases, the kinetics are described by monoexponential functions representative of first-order kinetics. It was observed that the dependence of k on temperature, T, is not linear; in particular, the kinetic constants determined at 25 °C, 30 °C, and 40 °C do not follow the Arrhenius equation, ln k = ln AEa/RT. This means that an accelerated test estimates the degradation kinetics at 25 °C to be about an order of magnitude higher than the actual value. The stability of resveratrol has previously been studied on whole grape extract fortified with 10% resveratrol at 25 °C/60% RH and 40 °C/75% RH for 3 months, 24 months, and 42 months, and as a crystalline solid sample at 40 °C/75% RH 70 °C for up to 12 weeks. In the present work, resveratrol is available as a dietary supplement in tablet form, as a mixture of pure trans-resveratrol, and from a microparticle-supported magnesium dihydroxide formulation (Resv@MDH). In all cases, the studies showed that the compound is stable and essentially confirmed the results obtained in the present study, i.e., that resveratrol does not undergo severe degradation; there was an estimated degradation at 36 months of 7% of resveratrol stored at 25 °C, less than 10% of resveratrol stored at 30 °C, and approximately 15% of resveratrol stored at 40 °C. The role of temperature in increasing degradation kinetics is evident in these results. This effect may be due to matrix effects that reduce stability, especially at higher temperatures. The matrix effect could also determine the nonlinear behavior of ln k as a function of 1/T. This would affect the symmetry relations of the process, in case the processes themselves are reversible. In this case, the non-Arrhenius (specifically the super-Arrhenius) behavior would be precisely indicative of a breakdown of the symmetry relations in the degradative process. It will, therefore, be interesting in the future to conceptualize the relationship between Arrhenius behavior and symmetry. The main message of this study is that the Arrhenius equation does not always allow the determination of the degradation kinetics, so that accelerated tests can lead to incorrect estimates, as in the present case, resulting in an overestimation of the degradation. The use of a nonlinear model based on a variant of the Arrhenius equation allows the inclusion of deviations from linearity that satisfactorily reproduce the experimental data. Future work will focus on investigating the presence of possible matrix effects and a detailed characterization of the kinetic mechanisms leading to the stability of resveratrol.

Author Contributions

Conceptualization, A.B., F.P. and B.F.; methodology, F.P. and C.C.; software, F.P. and B.F.; validation, A.B., R.G.I. and G.C.; formal analysis, F.P.; investigation, A.B., C.C., S.T. and N.R.; resources, A.B.; data curation, A.B. and C.C.; writing—original draft preparation, A.B., F.P. and B.F.; writing—review and editing, B.F., P.S. and R.G.I.; visualization, A.B.; supervision, F.P. and B.F.; project administration, F.P.; funding acquisition, B.F. All authors have read and agreed to the published version of the manuscript.

Funding

This project is funded by Fondo Ricerca di Base di Ateneo, University of Perugia, Perugia, Italy, and by European Union—NextGenerationEU under the Italian Ministry of University and Research (MUR) National Innovation Ecosystem grant ECS00000041–VITALITY–CUP J97G22000170005 to B.F. The research is also part of a PNRR (Piano Nazionale di Ripresa e Resilienza) scholarship entitled “Shelf-life enhancer”, supported by the Italian Ministry for Universities and Research (n° 38-0333-23-DOT1323112-2293).

Data Availability Statement

Data are contained with the article.

Conflicts of Interest

Authors Nicola Refrigeri and Silvia Ticconi, were employed by the company La Sorgente del Benessere srl. Giada Ceccarelli and Rossana Giulietta Iannitti were employed by the company S&R Farmaceutici S.p.A. The remaining authors declare that the research was conducted in the absence of any commercial or financial relationships that could be construed as a potential conflict of interest.

References

  1. Bajaj, S.; Singla, D.; Sakhuja, N. Stability Testing of Pharmaceutical Products. J. Appl. Pharm. Sci. 2012, 2, 129–138. [Google Scholar] [CrossRef]
  2. Aashigari, S.; Goud, R.; Sneha, S.; Vykuntam, U.; Potnuri, N. Stability Studies of Pharmaceutical Products. World J. Pharm. Res. 2019, 8, 479–492. [Google Scholar]
  3. Zothanpuii, F.; Rajesh, R.; Selvakumar, K. A Review on Stability Testing Guidelines of Pharmaceutical Products. Asian J. Pharm. Clin. Res. 2020, 13, 3–9. [Google Scholar] [CrossRef]
  4. Sengupta, P.; Chatterjee, B.; Tekade, R.K. Current Regulatory Requirements and Practical Approaches for Stability Analysis of Pharmaceutical Products: A Comprehensive Review. Int. J. Pharm. 2018, 543, 328–344. [Google Scholar] [CrossRef] [PubMed]
  5. ElGamal, R.; Song, C.; Rayan, A.M.; Liu, C.; Al-Rejaie, S.; ElMasry, G. Thermal Degradation of Bioactive Compounds during Drying Process of Horticultural and Agronomic Products: A Comprehensive Overview. Agronomy 2023, 13, 1580. [Google Scholar] [CrossRef]
  6. Taormina, P.; Hardin, M. Food Safety and Quality-Based Shelf Life of Perishable Foods; Springer: Berlin, Germany, 2021; ISBN 978-3-030-54374-7. [Google Scholar]
  7. Teshome, E.; Forsido, S.F.; Rupasinghe, H.P.V.; Olika Keyata, E. Potentials of Natural Preservatives to Enhance Food Safety and Shelf Life: A Review. Sci. World J. 2022, e9901018. [Google Scholar] [CrossRef]
  8. Turner, E.R.; Luo, Y.; Buchanan, R.L. Microgreen Nutrition, Food Safety, and Shelf Life: A Review. J. Food Sci. 2020, 85, 870–882. [Google Scholar] [CrossRef] [PubMed]
  9. Kohout, J. Modified Arrhenius Equation in Materials Science, Chemistry and Biology. Molecules 2021, 26, 7162. [Google Scholar] [CrossRef]
  10. WHO Drug Information—Volume 35, No. 1. Available online: https://www.who.int/publications-detail-redirect/9789240022881 (accessed on 3 December 2023).
  11. Murphy, J.R.; Hofer, J.D. Establishing Shelf Life, Expiry Limits, and Release Limits. Ther. Innov. Regul. Sci. 2002, 36, 769–781. [Google Scholar] [CrossRef]
  12. Quinlan, M.; Stroup, W.; Schwenke, J.; Christopher, D. Evaluating the Performance of the ICH Guidelines for Shelf Life Estimation. J. Biopharm. Stat. 2013, 23, 881–896. [Google Scholar] [CrossRef]
  13. Magari, R.T. Estimating Degradation in Real Time and Accelerated Stability Tests with Random Lot-to-Lot Variation: A Simulation Study. J. Pharm. Sci. 2002, 91, 893–899. [Google Scholar] [CrossRef] [PubMed]
  14. Anderson, G.; Scott, M. Determination of Product Shelf Life and Activation Energy for Five Drugs of Abuse. Clin. Chem. 1991, 37, 398–402. [Google Scholar] [CrossRef] [PubMed]
  15. Baur, J.A.; Sinclair, D.A. Therapeutic Potential of Resveratrol: The In Vivo Evidence. Nat. Rev. Drug Discov. 2006, 5, 493–506. [Google Scholar] [CrossRef] [PubMed]
  16. Kiskova, T.; Kubatka, P.; Büsselberg, D.; Kassayova, M. The Plant-Derived Compound Resveratrol in Brain Cancer: A Review. Biomolecules 2020, 10, 161. [Google Scholar] [CrossRef] [PubMed]
  17. Bonnefont-Rousselot, D. Resveratrol and Cardiovascular Diseases. Nutrients 2016, 8, 250. [Google Scholar] [CrossRef] [PubMed]
  18. Iannitti, R.G.; Floridi, A.; Lazzarini, A.; Tantucci, A.; Russo, R.; Ragonese, F.; Monarca, L.; Caglioti, C.; Spogli, R.; Leonardi, L.; et al. Resveratrol Supported on Magnesium DiHydroxide (Resv@MDH) Represents an Oral Formulation of Resveratrol with Better Gastric Absorption and Bioavailability Respect to Pure Resveratrol. Front. Nutr. 2020, 7, 570047. [Google Scholar] [CrossRef] [PubMed]
  19. Spogli, R.; Bastianini, M.; Ragonese, F.; Iannitti, R.G.; Monarca, L.; Bastioli, F.; Nakashidze, I.; Brecchia, G.; Menchetti, L.; Codini, M.; et al. Solid Dispersion of Resveratrol Supported on Magnesium DiHydroxide (Resv@MDH) Microparticles Improves Oral Bioavailability. Nutrients 2018, 10, 1925. [Google Scholar] [CrossRef] [PubMed]
  20. Gal, R.; Deres, L.; Toth, K.; Halmosi, R.; Habon, T. The Effect of Resveratrol on the Cardiovascular System from Molecular Mechanisms to Clinical Results. Int. J. Mol. Sci. 2021, 22, 10152. [Google Scholar] [CrossRef]
  21. Zucchi, A.; Claps, F.; Pastore, A.L.; Perotti, A.; Biagini, A.; Sallicandro, L.; Gentile, R.; Caglioti, C.; Palazzetti, F.; Fioretti, B. Focus on the Use of Resveratrol in Bladder Cancer. Int. J. Mol. Sci. 2023, 24, 4562. [Google Scholar] [CrossRef]
  22. Ren, B.; Kwah, M.X.-Y.; Liu, C.; Ma, Z.; Shanmugam, M.K.; Ding, L.; Xiang, X.; Ho, P.C.-L.; Wang, L.; Ong, P.S.; et al. Resveratrol for Cancer Therapy: Challenges and Future Perspectives. Cancer Lett. 2021, 515, 63–72. [Google Scholar] [CrossRef]
  23. Dionigi, L.; Ragonese, F.; Monarca, L.; Covino, S.; de Luca, A.; Iannitti, R.G.; Bastioli, F.; Moulas, A.N.; Allegretti, M.; Fioretti, B. Focus on the Use of Resveratrol as an Adjuvant in Glioblastoma Therapy. Curr. Pharm. Des. 2020, 26, 2102–2108. [Google Scholar] [CrossRef] [PubMed]
  24. Gerli, S.; Della Morte, C.; Ceccobelli, M.; Mariani, M.; Favilli, A.; Leonardi, L.; Lanti, A.; Iannitti, R.G.; Fioretti, B. Biological and Clinical Effects of a Resveratrol-Based Multivitamin Supplement on Intracytoplasmic Sperm Injection Cycles: A Single-Center, Randomized Controlled Trial. J. Matern. Fetal Neonatal Med. 2022, 35, 7640–7648. [Google Scholar] [CrossRef] [PubMed]
  25. Ragonese, F.; Monarca, L.; De Luca, A.; Mancinelli, L.; Mariani, M.; Corbucci, C.; Gerli, S.; Iannitti, R.G.; Leonardi, L.; Fioretti, B. Resveratrol Depolarizes the Membrane Potential in Human Granulosa Cells and Promotes Mitochondrial Biogenesis. Fertil. Steril. 2021, 115, 1063–1073. [Google Scholar] [CrossRef] [PubMed]
  26. Illiano, E.; Trama, F.; Zucchi, A.; Iannitti, R.G.; Fioretti, B.; Costantini, E. Resveratrol-Based Multivitamin Supplement Increases Sperm Concentration and Motility in Idiopathic Male Infertility: A Pilot Clinical Study. J. Clin. Med. 2020, 11, 4017. [Google Scholar] [CrossRef] [PubMed]
  27. Inchingolo, A.D.; Malcangi, G.; Inchingolo, A.M.; Piras, F.; Settanni, V.; Garofoli, G.; Palmieri, G.; Ceci, S.; Patano, A.; De Leonardis, N.; et al. Benefits and Implications of Resveratrol Supplementation on Microbiota Modulations: A Systematic Review of the Literature. Int. J. Mol. Sci. 2022, 23, 4027. [Google Scholar] [CrossRef] [PubMed]
  28. Alesci, A.; Nicosia, N.; Fumia, A.; Giorgianni, F.; Santini, A.; Cicero, N. Resveratrol and Immune Cells: A Link to Improve Human Health. Molecules 2022, 27, 424. [Google Scholar] [CrossRef] [PubMed]
  29. Lyons, M.M.; Yu, C.; Toma, R.B.; Cho, S.Y.; Reiboldt, W.; Lee, J.; van Breemen, R.B. Resveratrol in Raw and Baked Blueberries and Bilberries. J. Agric. Food Chem. 2003, 51, 5867–5870. [Google Scholar] [CrossRef] [PubMed]
  30. Zupančič, Š.; Lavrič, Z.; Kristl, J. Stability and Solubility of Trans-Resveratrol Are Strongly Influenced by pH and Temperature. Eur. J. Pharm. Biopharm. 2015, 93, 196–204. [Google Scholar] [CrossRef]
  31. Teles, A.S.C.; Chávez, D.W.H.; Gomes, F.d.S.; Cabral, L.M.C.; Tonon, R.V. Effect of Temperature on the Degradation of Bioactive Compounds of Pinot Noir Grape Pomace during Drying. Braz. J. Food Technol. 2017, 21, e2017059. [Google Scholar] [CrossRef]
  32. Prokop, J.; Abrman, P.; Seligson, A.L.; Sovak, M. Resveratrol and Its Glycon Piceid Are Stable Polyphenols. J. Med. Food 2006, 9, 11–14. [Google Scholar] [CrossRef]
  33. Jensen, J.S.; Wertz, C.F.; O’Neill, V.A. Preformulation Stability of Trans-Resveratrol and Trans-Resveratrol Glucoside (Piceid). J. Agric. Food Chem. 2010, 58, 1685–1690. [Google Scholar] [CrossRef] [PubMed]
  34. Artur, A.B. Symmetry Relations in Chemical Kinetics Arising from Microscopic Reversibility. Phys. Rev. Lett. 2006, 96, 028307. [Google Scholar] [CrossRef]
  35. Spogli, R.; Biagini, A.; Presciutti, F.; Petracci, A.; Ragonese, F.; Iannitti, R.G.; Ceccarelli, G.; Brecchia, G.; Menchetti, L.; Codini, M.; et al. New Insights on Resveratrol Supported by Magnesium Dihydroxide (Revifast®). Ital. J. Food Sci. 2024, 36, 175–179. [Google Scholar] [CrossRef]
  36. Li, Y.-G.; Liu, H.; Wang, Z.-T. A Validated Stability-Indicating HPLC with Photodiode Array Detector (PDA) Method for the Stress Tests of Monascus purpureus-Fermented Rice, Red Yeast Rice. J. Pharm. Biomed. Anal. 2005, 39, 82–90. [Google Scholar] [CrossRef] [PubMed]
  37. Ramalingam, P.; Ko, Y.T. Validated LC–MS/MS Method for Simultaneous Quantification of Resveratrol Levels in Mouse Plasma and Brain and Its Application to Pharmacokinetic and Brain Distribution Studies. J. Pharm. Biomed. Anal. 2016, 119, 71–75. [Google Scholar] [CrossRef] [PubMed]
  38. Bott, R.F.; Oliveira, W.P. Storage Conditions for Stability Testing of Pharmaceuticals in Hot and Humid Regions. Drug Dev. Ind. Pharm. 2007, 33, 393–401. [Google Scholar] [CrossRef] [PubMed]
  39. Rosa Junior, A.C.P.; Cruz, C.; Santana, W.S.; Moret, M.A. Characterization of the Non-Arrhenius Behavior of Supercooled Liquids by Modeling Nonadditive Stochastic Systems. Phys. Rev. E 2019, 100, 022139. [Google Scholar] [CrossRef] [PubMed]
  40. Bancuta, O.R.; Chilian, A.; Bancuta, I.; Setnescu, R.; Setnescu, T.; Ion, R.M. Thermal Characterization of Resveratrol. Rev. Chim. 2018, 69, 1346–1351. [Google Scholar] [CrossRef]
  41. Silva, R.d.C.; Teixeira, J.A.; Nunes, W.D.G.; Zangaro, G.A.C.; Pivatto, M.; Caires, F.J.; Ionashiro, M. Resveratrol: A Thermoanalytical Study. Food Chem. 2017, 237, 561–565. [Google Scholar] [CrossRef]
  42. Zhou, H.; Wang, Y.; Li, S.; Lu, M. Improving Chemical Stability of Resveratrol in Hot Melt Extrusion Based on Formation of Eutectic with Nicotinamide. Int. J. Pharm. 2021, 607, 121042. [Google Scholar] [CrossRef]
  43. Huynh-Ba, K.; Zahn, M. Understanding ICH Guidelines Applicable to Stability Testing. In Handbook of Stability Testing in Pharmaceutical Development: Regulations, Methodologies, and Best Practices; Springer: New York, NY, USA, 2009. [Google Scholar] [CrossRef]
  44. Truhlar, D.G.; Kohen, A. Convex Arrhenius Plots and Their Interpretation. Proc. Natl. Acad. Sci. USA 2001, 98, 848–851. [Google Scholar] [CrossRef] [PubMed]
  45. Manuel Sá, M.; Sereno, A.M. The Kinetics of Browning Measured during the Storage of Onion and Strawberry. Int. J. Food Sci. Technol. 1999, 34, 343–349. [Google Scholar] [CrossRef]
  46. Celina, M.; Gillen, K.T.; Assink, R.A. Accelerated Aging and Lifetime Prediction: Review of Non-Arrhenius Behaviour Due to Two Competing Processes. Polym. Degrad. Stab. 2005, 90, 395–404. [Google Scholar] [CrossRef]
  47. Ebrahim, A.; DeVore, K.; Fischer, T. Limitations of Accelerated Stability Model Based on the Arrhenius Equation for Shelf Life Estimation of In Vitro Diagnostic Products. Clin. Chem. 2021, 67, 684–688. [Google Scholar] [CrossRef] [PubMed]
  48. Visuthiwan, S.; Assatarakul, K. Kinetic Modeling of Microbial Degradation and Antioxidant Reduction in Lychee Juice Subjected to UV Radiation and Shelf Life during Cold Storage. Food Control 2021, 123, 107770. [Google Scholar] [CrossRef]
  49. Cui, F.; Zheng, S.; Wang, D.; Tan, X.; Li, Q.; Li, J.; Li, T. Recent Advances in Shelf Life Prediction Models for Monitoring Food Quality. Compr. Rev. Food Sci. Food Saf. 2023, 22, 1257–1284. [Google Scholar] [CrossRef] [PubMed]
  50. Cisse, M.; Vaillant, F.; Acosta, O.; Dhuique-Mayer, C.; Dornier, M. Thermal Degradation Kinetics of Anthocyanins from Blood Orange, Blackberry, and Roselle Using the Arrhenius, Eyring, and Ball Models. J. Agric. Food Chem. 2009, 57, 6285–6291. [Google Scholar] [CrossRef] [PubMed]
  51. Loypimai, P.; Moongngarm, A.; Chottanom, P. Thermal and pH Degradation Kinetics of Anthocyanins in Natural Food Colorant Prepared from Black Rice Bran. J. Food Sci. Technol. 2016, 53, 461–470. [Google Scholar] [CrossRef]
  52. Wang, W.-D.; Xu, S.-Y. Degradation Kinetics of Anthocyanins in Blackberry Juice and Concentrate. J. Food Eng. 2007, 82, 271–275. [Google Scholar] [CrossRef]
  53. Uddin, M.S.; Hawlader, M.N.A.; Ding, L.; Mujumdar, A.S. Degradation of Ascorbic Acid in Dried Guava during Storage. J. Food Eng. 2002, 51, 21–26. [Google Scholar] [CrossRef]
  54. Remini, H.; Mertz, C.; Belbahi, A.; Achir, N.; Dornier, M.; Madani, K. Degradation Kinetic Modelling of Ascorbic Acid and Colour Intensity in Pasteurised Blood Orange Juice during Storage. Food Chem. 2015, 173, 665–673. [Google Scholar] [CrossRef] [PubMed]
  55. Ahmed, J.; Shivhare, U.; Sandhu, K. Thermal Degradation Kinetics of Carotenoids and Visual Color of Papaya Puree. J. Food Sci. 2002, 67, 2692–2695. [Google Scholar] [CrossRef]
Figure 1. Degradation of resveratrol at different storage temperatures. Time course of the normalized amount of resveratrol at 25 °C (A), 30 °C (B), and 40 °C (C). Normalized composition is the ratio of resveratrol content at time x (Cx) to time 0 (C0). The dotted line represents the best fit of the experimental data using Equation (3). The k obtained from the fits is superimposed in each panel. Data are presented as mean ± SE.
Symmetry 16 00493 g001
Figure 2. Chromatogram of resveratrol at storage condition T = 25 °C, 60% RH, time 24 months. The retention time (RT) is ca. 5 min.
Symmetry 16 00493 g002
Figure 3. Arrhenius plot at 25 °C, 30 °C, and 40 °C. The data points, ln k vs. 1/T, were connected by two linear functions (red dotted lines) (A) and then fitted by the modified Arrhenius equation (red dotted curve) according to Equation (5) (B).
Symmetry 16 00493 g003
Figure 4. Molecular structure of trans-resveratrol. Carbon atoms are represented by grey spheres, hydrogen atoms by white spheres, and oxygen atoms by red spheres.
Symmetry 16 00493 g004
Table 1. Effect of temperature on the degradation of resveratrol. The table shows the values of the equation describing the degradation of resveratrol at 25 °C, 30 °C, and 40 °C. All data are expressed as mean ± SE. A is the component not involved in degradation; k is the kinetic constant in months−1; R2 is the regression coefficient.
25 °C30 °C40 °C
A0.926 ± 0.0150.904 ± 0.0120.8525 ± 0.018
k (months−1)0.07140 ± 0.000070.1937 ± 0.00020.231 ± 0.002
R20.997850.982990.99785
Table 2. The normalized resveratrol content at 3, 6, 12, and 24 months for food supplement stored at 25 °C and 30 °C, and at 3 and 6 months for food supplement stored at 40 °C. The initial content is 81.2 ± 2.5 mg (normalized 1.000 ± 0.031). Data are presented as mean ± SE.
Time, t (Months)25 °C30 °C40 °C
30.99 ± 0.030.96 ± 0.040.93 ± 0.04
60.98 ± 0.030.93 ± 0.040.89 ± 0.05
120.96 ± 0.010.92 ± 0.01
240.94 ± 0.010.91 ± 0.01
Disclaimer/Publisher’s Note: The statements, opinions and data contained in all publications are solely those of the individual author(s) and contributor(s) and not of MDPI and/or the editor(s). MDPI and/or the editor(s) disclaim responsibility for any injury to people or property resulting from any ideas, methods, instructions or products referred to in the content.

