Article

Determination of Na+ Cation Locations in Nanozeolite ECR-1 Using a 3D ED Method

1
Institut de Science des Matériaux de Mulhouse (IS2M), UMR CNRS 7361, Université de Haute-Alsace, 15 Rue Jean Starcky, 68100 Mulhouse, France
2
Université de Strasbourg, 67000 Strasbourg, France
3
IFP Energies Nouvelles-Etablissement de Lyon, Rond-Point de l’Échangeur de Solaize, BP 3, 69360 Solaize, France
4
Institut de Recherches sur la Catalyse et l’Environnement de Lyon (IRCELYON), UMR CNRS 5256, Université Lyon 1, 2 Avenue Einstein, 69626 CEDEX Villeurbanne, France
*
Author to whom correspondence should be addressed.
Symmetry 2024, 16(4), 477; https://doi.org/10.3390/sym16040477
Submission received: 30 January 2024 / Revised: 11 March 2024 / Accepted: 28 March 2024 / Published: 15 April 2024
(This article belongs to the Special Issue Electron Diffraction and Structural Imaging II)

Abstract

:
Until now, the comprehensive structural analysis of single crystals of zeolite ECR-1, an aluminosilicate with the EON topology, has been hindered owing to the submicron dimensions of the obtained crystals. Additionally, this zeolite, which is characterized by a topology comprising alternating periodic building units of MAZ and MOR layers, exhibits stacking faults that impede accurate refinement through the Rietveld method. In this report, we present, for the first time, the structure of ECR-1 elucidated by studying a nanocrystal with a significantly reduced number of stacking faults. The sample used was synthesized hydrothermally using trioxane as the organic structure-directing agent. The structure determination was conducted using precession electron diffraction (PED) at 103 K. Partial dehydration occurred owing to the high vacuum conditions in the TEM sample chamber. From the dynamical refinement (Robs = 0.097), 8.16 Na+ compensating cations were localized on six distinct crystallographic sites, along with approximately four water molecules per unit cell. Furthermore, a canonical Monte Carlo computational study was conducted to compare the experimental cationic distribution and location of water molecules with the simulation.

1. Introduction

Zeolites, which are microporous aluminosilicate materials, have extensive applications in adsorption, catalysis, and cation exchange for water treatment [1,2]. The overall negative electrical charge of zeolite frameworks allows them to accommodate charge-compensating cations in their pores and cages. The locations and natures of these cations significantly influence their physicochemical properties. For instance, faujasite-type zeolites with FAU topology [3] can be used in various industrial processes, depending on their Si/Al ratios and the nature of the compensating cations [4]. A notable example is lithium-exchanged LSX (Low Silica X), a faujasite with a Si/Al ratio of one, serving as the primary adsorbent for oxygen production from air [5]. Faujasites with higher Si/Al ratios, such as Y zeolites, also play crucial roles as catalysts, with key applications in cracking, isomerization, and hydrocarbon synthesis. In particular, in different enhanced forms, zeolite Y serves as the cracking component in FCC (fluid catalytic cracking) catalysts [6]. Many zeolites with distinct topologies have been synthesized to meet the ever-growing demands of industrial processes. ECR-1, discovered in 1987 [7], is one example. Zeolites with EON topology feature a 2-dimensional pore system defined by straight 12-membered ring (12-MR) channels interconnected through 8-membered ring (8-MR) openings. As illustrated in Figure 1, this topology can be viewed as a strict alternation of periodic building units (PerBU), namely MAZ (PerBU1) and MOR (PerBU2) layers. PerBU1 comprises columns along the a-axis of gme composite building units (CBUs) that are linked to each other via 6-MRs [8]. ECR-1 can be synthesized using various organic structure-directing agents (OSDAs), including bis-(2-hydroxyethyl)- or bis-(2-hydroxypropyl)-dimethylammonium cations [7], adamantane-containing diquaternary alkylammonium iodides [9], and tetramethylammonium [10]. It can even be produced without an organic molecule, thereby reducing production costs [11,12]. ECR-1 has been also produced efficiently via a radicalized seeds-assist route [12]. ECR-1 holds potential applications in the petroleum industry [12] and seawater desalination [13].
The crystal structure of ECR-1 was initially modeled based on high-resolution transmission electron microscopy (HRTEM) imaging [14]. Subsequent refinement from synchrotron powder diffraction data using the Rietveld method confirmed a structure consisting of alternating mazzite and mordenite layers with a 1:1 stacking sequence ratio [10]. However, variations in synthesis conditions and crystal growth kinetics led to different stacking fault densities. Cation locations were determined during the same Rietveld study [10] conducted on the hydrated form and under ambient conditions. Despite the use of multiple synthesis methods, no structural study from diffraction techniques on single crystal ECR-1 could be carried out owing to the submicron scale of the crystals obtained.
In a recent study, we explored the use of small, six-ring cyclic ether molecules as the organic structure-directing agent (OSDA) to synthesize omega (a synthetic analog of the zeolite mazzite) and ECR-1 zeolites [15]. Notably, 1,3,5-trioxane was employed to synthesize ECR-1. The resulting nanoscale crystals were too small for proper structural analysis from single-crystal X-ray diffraction. Moreover, in the case of ECR-1, diffraction-line broadening owing to the nanosized crystals and overlapping and stacking faults is highly problematic for proper structural analysis using the Rietveld method. For this reason, 3D electron diffraction (3D ED), which is an ensemble of methods in continuous development for the last 20 years, has been proposed for the structural analysis of nanosized single crystals [16]. Indeed, conventional electron diffraction on transmission electron microscopes (TEM) is well established for the characterization of nanoscale materials. However, dynamical scattering observed in electron diffraction does not allow conventional structure analysis to be employed routinely for X-ray diffraction data. To address this, emerging techniques like precession electron diffraction (PED) [17,18], automated diffraction tomography (ADT) [19], rotation electron diffraction (RED) [20], continuous rotation electron diffraction (cRED), and serial rotation electron diffraction (SerialRED) [21] aim to reduce the dynamic effects on observed intensities. Several reviews describe these 3D ED methods and their recent evolutions [21,22,23,24,25,26,27]. These methods have proved highly effective in resolving the structures of many zeolites. They have also been commonly used in combination with X-ray powder diffraction data and/or high-resolution transmission electron microscopy (HRTEM) to elucidate the structure of many zeolitic materials with varying degrees of disorder, such as IM-17, IM-18, MZS-1, zeolite beta, and RUB-5 [28,29,30,31,32].
The objective of the present study was to solve the structure of ECR-1 from a nanosized single crystal (with significantly reduced stacking faults) and to locate the positions of the sodium compensation cations using a 3D ED method (PED), which was chosen owing to its advantages over powder diffraction.

2. Materials and Methods

The ECR-1 of topology EON [3] used in this study was obtained using hydrothermal synthesis following the protocol described by Chatelard et al. [15]. In brief, a gel composed of 10 SiO2–Al2O3–7.5 trioxane–1.7 Na2O–140 H2O was stirred at ambient temperature for 3 h before being placed in an autoclave, which was then fixed in an oven equipped with a rotating mechanism for crystallization at 115 °C for 7 days under dynamic conditions (60 rpm). Scanning electron microscopy on the as-synthesized sample showed that the powder was composed of bundles of more or less elongated needle-like crystals of a few hundred nm long and varying diameters [15].
Energy dispersive X-ray spectroscopy (EDX) analysis was performed at a voltage of 15 kV using a JSM-7900F scanning electron microscope (SEM) (JEOL, Tokyo, Japan) equipped with a Quantax analyzer system (BRUKER, Berlin, Germany) made of two XFlash 6-30 detectors. Prior to analysis, the sample was coated with a thin film of carbon using a Baltec SCD004 coater (Balzers, Bal Tec AG, Fürstentum, Lichtenstein).
The high-resolution synchrotron powder-diffraction pattern (SPDP) of the ECR-1 sample was obtained at the ID22 beamline of the ESRF in Grenoble, France [33]. The setup involved a bank of nine scintillation detectors, each preceded by nine Si 111 analyzer crystals, using vertical scanning to measure the diffracted intensity as a function of 2θ, with the channels nominally spaced 2° apart. This Debye–Scherrer capillary geometry configuration guarantees an instrumental contribution to the full width at half-maximum (FWHM) of the diffracted peaks, typically around 0.003° (2θ) in optimal conditions. ECR-1 powder was placed in a thin-walled glass capillary (1 mm in diameter) mounted on a spinner on the axis of the powder diffractometer. A Le Bail refinement [34] was conducted using the free software suite GSAS-II [35].
The PED measurements were conducted using a CM200 TEM (Philips, Eindhoven, The Netherlands) equipped with a DigiStar P2010 (NanoMEGAS, Brussels, Belgium) precession system. Data were recorded by a side entry Phurona CMOS (EMSIS, Münster, Germany) camera (12 M pixel model). An acceleration voltage of 200 kV was applied, and the camera length was set at 1200 mm. A 40 μm condenser aperture and a spot size of 3 were used, and the beam illuminating the sample had a diameter of 105 nm. A Gatan Elsa single-tilt cryo-transfer sample holder was used, enabling data acquisition at a temperature of 103 K. The sample was ground and deposited directly on a carbon-coated Cu grid without prior sonification of the powder in a solvent. In “precession tomography” mode, diffraction patterns were consecutively acquired by manually tilting (without the use of automated acquisition software) the same crystal along the α-axis of the single-tilt cryo-transfer sample holder while precessing the beam. The tilting step size was 1°, and the crystal was rotated in an angular range of −57° to +48°. During rotation, the electron beam was deviated to minimize the exposure time of the sample. Data reduction and integration were performed using PETS2.0 software [36].
We measured 14 crystals, which exhibited different degrees of diffuse scattering in the 00l direction of the reconstructed sections 0kl and h0l (data not shown). For the sake of simplicity, results from one crystal, which exhibited a negligible amount of diffuse scattering, will be discussed in the following. The crystal size used for the data collection had dimensions of ~400 × ~200 nm (see Figure S1), rendering it well-suited for the chosen method. During the data-collection process, the electron exposure duration (500 ms per step) was insufficient to cause observable degradation of the zeolite crystals. As a result, potential disruptions to the quality of the collected data were effectively minimized. The merging was carried out in the Laue class mmm, yielding Rint = 0.1837 for nobs = 439 (nall = 4428) reflections. The reconstructed reciprocal-space sections were calculated using PETS2, and sections hk0, 0kl, and h0l are shown in Figure 2a–c. Utilizing the Jana2020 software [37], the structural solution, derived through the charge-flipping algorithm applied to the extracted intensities, directly provided the atomic positions of silicon and oxygen atoms of the ECR-1 framework with EON topology. However, this process required additional steps, including successive difference Fourier map calculations and recycling, to precisely determine the positions of the extra-framework species (compensating Na+ cations and water molecules). The refinement process included kinematic least-squares refinements on squared amplitudes, denoted as|F|2, and was carried out using the Jana2020 software. To obtain the most accurate model from electron diffraction data, accounting for dynamical diffraction effects, a subsequent dynamical refinement was conducted. In accordance with the dynamical theory of diffraction, the experimentally observed intensities are influenced not only by structural factors but also by the crystal’s orientation and thickness. This introduces complexity to the relationship between observed intensities and calculated structural factors. Various parameters must be incorporated during the refinement procedure to account for these effects. The Jana2020 software provides options for dynamical refinement, and the specific details of this method are reported elsewhere [22]. The illustrations of the structures were produced using Vesta [38] or Diamond [39] software.
In order to investigate the distributions of sodium cations and water molecules throughout various crystallographic sites in the ECR-1 structure, we employed the Monte Carlo (MC) simulation technique using the procedure previously employed for potassium-exchanged faujasite zeolite (KX) [40]. The MC simulations were performed in the canonical ensemble (NVT), where the number of simulated particles N and the simulation cell volume V are kept fixed throughout the simulation, and temperature T is the temperature of the 3D ED experiment (103 K), applying the 8.0.0 version of the Towhee code [41]. The initial microscopic model for the ECR-1 zeolite was derived from the experimental structure with a unit cell chemical composition given by the formula Na11Si49Al11O120 and unit cell parameters of a = 7.4865 Å, b = 17.8463 Å, and c = 25.6545 Å. The aluminum atoms were then distributed according to the Loewenstein rule [42], and various starting Na+ charge-compensating cation distributions were prepared.
The partial-charge distribution through the atoms of a semi-ionic zeolite structure are given in Table 1. To model the inter-molecular zeolite/zeolite, water/zeolite, and water/water interactions, we employed an expression containing a repulsion–dispersion term and an electrostatic potential term. These contributions were described using the Lennard–Jones (LJ) and Coulombic formulae, respectively. For the ECR-1 zeolite, we extracted the whole set of LJ and Coulombic parameters (q, ε, and σ) from the Clay force field [43]. For the water molecule, a five-point potential TIP5P model was employed [44]. In this model, which can reproduce the water liquid density, only oxygen atoms constitute LJ interaction sites. Moreover, it maintains the molecule rigid with the geometrical parameters set on the experimentally observed values in the gas phase (O-H bond length of 0.9572 Å and HOH angle of 104.52°). Finally, we used the Lorentz–Berthelot combination rules in order to determine the LJ interaction parameters for any pair of unlike atoms.
The simulation box consisted of the unit cell multiplied by four in the x-direction and two in the y-direction (29.9460 Å, 35.6926 Å, and 25.6545 Å) and contained 32 water molecules (corresponding to the experimental loading of 4 H2O molecules per unit cell). During the MC simulations, the framework atoms (Si, Al, and O) were fixed, whereas the charge-compensating cations and the water molecules were able to displace. An equilibration phase of a Monte Carlo run consisted of 1.0 × 10⁷ steps, while a production phase consisted of 2.0 × 10⁷ steps. The following MC moves were employed: a cation translation and cation intra-box swap move, a water molecule center of mass translation, and a center of mass rotation and water molecule intra-box swap move [41]. The targeted acceptance rate of approximately 50% was maintained by regulating the maximum allowed translations and rotations, which were adjusted during the equilibration phase of the MC run. Periodic boundary conditions were applied in all three spatial directions. Ewald summation was employed to account for Coulombic interactions. Additionally, a cut-off distance of 12.5 Å was considered for Van der Waals interactions.

3. Results and Discussion

As demonstrated in Figure 3, the high-resolution SPDP acquired reveals the existence of trace amounts of nanosized mazzite and mordenite zeolites in the ECR-1 sample. Furthermore, consistent with the findings of Leonowicz and Vaughan [14], our sample displays stacking disorder, as evidenced by the results of the Le Bail refinement (Figure 3).
It is important to highlight that the observed peak broadening is not solely attributable to crystal size/shape effects; rather, there is an anisotropic peak broadening along the c-axis, similar to the findings in the structural study conducted by Gualtiri et al. [10]. The FWHM of the reflections showed this marked anisotropy, where reflections with l ≠ 0 are broad and those with l = 0 are sharper. To accurately reproduce the observed powder pattern and account for stacking faults, a DIFFaX [45] simulation is imperative [10] in this case. Accordingly, we conducted a structural study using the 3D ED technique. Our objective was to isolate a nanocrystal with minimal stacking faults, allowing us to directly determine the structure of ECR-1 with EON topology. Furthermore, this approach to structural resolution from single-crystal data provides greater ease in locating compensation cations compared with powder-diffraction methods.
Following kinematical refinement, the final Robs was determined to be 0.1690, and the refined composition was identified as Na8.84Si60O120. Additional statistical indicators and refinement parameter details can be found in Table 2. In the kinematical structure refinement, all extra-framework species were refined as compensating cations without considering the presence of water molecules. This oversight was rectified in the dynamical refinement by examining the short Na…Na distances around 2.5 Å and replacing the corresponding sodium atoms with oxygen atoms of water molecules. The post-refinement composition was determined as (Ow)4.52Na8.16Si60O120 (where Ow represents the water molecule). Further details regarding the dynamical refinement parameters are shown in the right column of Table 2. The positional parameters, including x, y, and z coordinates, occupancies, and atomic displacement parameters, are provided in Tables S1 and S2 for the kinematical and dynamical refinements, respectively.
For the treatment of 3D ED data, the persistence of the dynamical effects in kinematical refinement is reflected in the relatively high R values. This phenomenon is commonly observed in electron diffraction techniques, even extending to 3D ED methods, where Robs values of approximately 0.2 or higher are routinely encountered during kinematical refinements [30,46,47,48]. However, for the dynamical refinements, the Robs value substantially decreases, reaching as low as 0.097, as shown in Table 2. This fact confirms that high R values obtained during kinematical refinements are mainly due to dynamical effects. Another noteworthy point is the proximity of the atomic scattering factors for Si and Al. This proximity poses a challenge in refining Si and Al positions separately, particularly in the case of mixed tetrahedral site occupancies. Accordingly, in both kinematical and dynamical refinements, all tetrahedral atoms in the framework are refined as Si.
The dynamical refinement method yields superior figures of merit, provides a more comprehensive explanation of the observed electron diffraction intensities, and more accurately represents the crystal structure. As a result, the remainder of the discussion will focus on the outcomes derived from the dynamical refinement process.
As indicated in Table 2, the dynamical refinement results in a composition of Na8.16Si60O124.52, where 4.52 oxygen atoms are from adsorbed water molecules. This chemical composition, in terms of sodium content, deviates from the average chemical composition of Na10.40A110.40Si49.60O120, as determined by EDX (see Figure S2). Approximately 78.5% of the cations are located in the structure, distributed across six distinct crystallographic sites, with occupancies ranging from ~0.08 to ~0.8. The disparity between the chemical analysis of the powder and the result of the structural study on an individual nanocrystal can be attributed to the non-uniform distribution of aluminum atoms throughout the sample, potentially altering the number of negative charges within the framework that require compensation.
In a prior study, based on powder XRD data and using the Rietveld method, Gualtieri et al. identified different crystallographic sites for Na+ in a hydrated zeolite ECR-1 with a similar chemical formula of Na10.97Ca0.36(H2O)x[Al11.54Si48.46O120] per unit cell [10]. Figure S3 illustrates the structure refined in this study and that of Gualtieri et al. [10]. The high vacuum conditions in the TEM sample chamber (~10−5 Pa) led to partial dehydration, as evidenced by the notable difference in the number of water molecules between the two structures: around 37.5 in the Rietveld study [10] compared with 4.5 in the present structural analysis using 3D ED. In the hydrated state of the ECR-1 sample, the observed weight loss on the thermogravimetric curve after dehydration is approximately 12%, corresponding to roughly 30 water molecules per unit cell [15]. The bond distances between both structures are reported in Table 1Sa in ref. [10] and in Table S3. The average Si—O bond lengths change significantly between the two framework structures, with averages of 1.64 Å in the Rietveld study and 1.61 Å in the current 3D ED study. The O-Si-O angles exhibit similar deformations of the silicon tetrahedrons, where they vary from 95.2° to 122.5° in the Rietveld study and from 101.4° to 122.1° in the present work after dynamical refinement.
Table 3 shows that both crystallographic studies reveal consistent interactions among the compensating Na+ cations, water molecules, and the framework oxygen atoms. The average shortest distances recorded are 2.58 Å and 2.62 Å in the Rietveld study and the current 3D ED study, respectively. Notably, the Na…O distances exhibit a range, with minimum values of 2.25 Å and 2.29 Å and maximum values of 3.06 Å and 3.08 Å in the former Rietveld and current 3D ED crystallographic studies, respectively.
However, there is variation in the distribution within the porosity, as depicted in Figure 4. In the hydrated ECR-1, as studied by Gualtieri et al. [10], 67.4% of the cations (C1, C3a, and C3b) are localized in the straight 12MRs channels (Figure 4a).
For the remaining cations, 12.4% are distributed in the 8MRs channels (C4), connecting PerBU1 and PerBU2, and 20.2% within the 8MRs channels (C2) of PerBU2 (Figure 4b). In our present 3D ED study, after partial dehydration, only 32.4% of the cations are located inside the 12MRs (Na3, Na4, and Na6, Figure 4c). The other cations are situated as follows: 4.0% inside the 8MRs opening in PerBU1 (Na5); 38.7% in the 8MRs channels connecting PerBU1 and PerBU2 (Na2) in a site close to C4; and 24.9% within the 8MRs channels of PerBU2 (Na1) (Figure 4d) equivalent to C2. The water molecules remaining after partial dehydration under the vacuum of the TEM are predominantly confined in cavities with openings at 8MRs. This implies an accelerated and facilitated evacuation process when these molecules are situated within the 12MRs channels.
We initially anticipated the presence of trioxane molecules within the pores of ECR-1. Indeed, following the thermogravimetric analysis under air, Chatelard et al. proposed its location in the gme composite building units, possibly as a [Na+-trioxane] complex [15]. However, Fourier difference maps did not reveal corresponding residual electron densities in the gme cage, in the straight 12MRs channels, or elsewhere. This outcome is attributed to the facile evacuation of the neutral trioxane molecules under vacuum. Nevertheless, it is not improbable that the electron beam has induced the reduction of trioxane molecules into carbon monoxide, which can be more readily evacuated through the 8MRs windows of the gme units than trioxane itself. Such damage from electron beams on zeolites is frequent, more specifically for the organic part [49].
The averaged cationic distributions of the experimentally determined crystallographic sites in both totally dehydrated and partially hydrated ECR-1 zeolite structures are summarized in Table 4. Comparing the simulated and experimental distributions reveals that cationic site occupancies exhibit similar behavior. Sites Na1 and Na2 are the most populated, followed by sites Na3, Na6, and Na4. In contrast, site Na5, which was unoccupied in the simulation, has the lowest experimental occupancy.
Table 5 provides a comprehensive overview of the average distribution of water molecules across various crystallographic sites in ECR-1 zeolite. Despite the non-negligible probability of finding water molecules in the straight 12MRs channels, as depicted in Figure 5, the calculated locations around the cationic sites align well with the experimental trend. While a slight disparity exists between the simulated and experimental cationic distribution and the positioning of water molecules, it is crucial to acknowledge that the Monte Carlo simulation relied on a generic force field. Additionally, the distribution of aluminum atoms within the framework can impact cationic locations. Therefore, given the simplicity of the computational approach, the simulation demonstrates a commendable agreement with the experimental results.

4. Conclusions

The first structural analysis of ECR-1 zeolite using the 3D ED technique PED has revealed significant insights into its composition, crystal structure, and distribution of charge-compensating cations and water molecules within its framework. The final dynamical refinement (Robs = 0.097) led to a chemical composition of Na8.16Si60O124.52, with 4.52 oxygen atoms attributed to adsorbed water molecules. This composition differs from the average chemical composition determined by EDX, indicating a non-uniform distribution of aluminum atoms within the sample. Comparison with a prior Rietveld study highlights the impact of the dehydration phenomenon in the microscope on the crystal structure of ECR-1. The distribution of cations within the ECR-1 framework varies, with the remaining water molecules predominantly confined to cavities that connect 12MRs straight channels. The absence of OSDA trioxane used for the synthesis was attributed to its facile evacuation under the vacuum. However, the possibility of electron beam-induced damage cannot be disregarded. Overall, the experimental findings align well with simulated distributions of cations and water molecules, despite slight disparities that are attributed to the complexity of the framework and computational limitations. The study underscores the importance of advanced structural analysis techniques in elucidating the complex nature of zeolite frameworks and provides valuable insights for further understanding their properties and potential applications.

Supplementary Materials

The following supporting information can be downloaded at: https://www.mdpi.com/article/10.3390/sym16040477/s1, Figure S1: TEM image of the measured ECR-1 crystal. Figure S2: Energy dispersive X-ray spectroscopy (EDX) analyses of ECR-1 zeolite. Figure S3: Projections along the [100] plane of the ECR-1 zeolite (Gualtieri et al. [10] and this 3D ED study, dynamical refinement). Table S1: Fractional atomic coordinates and isotropic displacement parameters (Å2) of ECR-1 (3D ED, kinematical refinement). Table S2: Fractional atomic coordinates and isotropic displacement parameters (Å2) of ECR-1 (3D ED, dynamical refinement). Table S3: Si-O bond lengths and angles of ECR-1 (3D ED, dynamical refinement), a CIF file, and the corresponding checkCIF file.

Author Contributions

Conceptualization, J.-L.P.; investigation, T.Ö., I.D., C.C., M.D., A.T., R.M.-F. and J.-L.P.; writing—original draft preparation, T.Ö., I.D. and J.-L.P.; writing—review and editing, J.-L.P.; visualization, T.Ö., I.D. and J.-L.P.; supervision, J.-L.P. All authors have read and agreed to the published version of the manuscript.

Funding

This research received no external funding.

Data Availability Statement

CSD 2338838 contains the supplementary crystallographic data for this paper. These data can be obtained free of charge from FIZ Karlsruhe via www.ccdc.cam.ac.uk/structures. (accessed on 8 March 2024).

Acknowledgments

We express our heartfelt gratitude to Pierre Durand of Eloïse S.A.S. for his invaluable contributions in adapting the DigiStar P2010 (NanoMEGAS) precession system and his dedicated efforts in maintaining our CM200 microscope. Special thanks go to Loïc Benariac-Doumal, Catherine Dejoie, and Andrew Fitch from ESRF for their invaluable assistance in obtaining the high-resolution powder diffractogram on ID22. Additionally, we extend our appreciation to Laurent Legras, Gatan-EDAX Sales Manager in France, and Ludovic Josien from IS2M for the loan of the single-tilt cryo-transfer sample holder and the EDX measurement, respectively. The authors would like to acknowledge the High-Performance Computing Center of the University of Strasbourg for supporting this work by providing scientific support and access to computing resources.

Conflicts of Interest

The authors declare no conflicts of interest.

References

  1. Li, Y.; Li, L.; Yu, J. Applications of zeolites in sustainable chemistry. Chem 2017, 3, 928–949. [Google Scholar] [CrossRef]
  2. Li, Y.; Yu, J. Emerging applications of zeolites in catalysis, separation and host–guest assembly. Nat. Rev. Mater. 2021, 6, 1156–1174. [Google Scholar] [CrossRef]
  3. Database of Zeolite Structures. Available online: http://www.iza-structure.org/databases/ (accessed on 15 December 2023).
  4. Frising, T.; Leflaive, P. Extraframework cation distributions in X and Y faujasite zeolites: A review. Microporous Mesoporous Mater. 2008, 114, 27–63. [Google Scholar] [CrossRef]
  5. Chao, C.C. Process for Separating Nitrogen from Mixtures Thereof with Less Polar Substances. U.S. Patent 4,859,217, 22 August 1989. [Google Scholar]
  6. Vogt, E.T.C.; Weckhuysen, B.M. Fluid catalytic cracking: Recent developments on the grand old lady of zeolite catalysis. Chem. Soc. Rev. 2015, 44, 7342–7370. [Google Scholar] [CrossRef] [PubMed]
  7. Vaughan, D.E.W.; Strohmaier, K.G. Crystalline Zeolite (ECR-1) and Process for Preparing It. U.S. Patent 4,657,748, 14 April 1987. [Google Scholar]
  8. Database of Zeolite Structures—Building Scheme for EON. Available online: http://www.iza-structure.org/databases/ModelBuilding/EON.pdf (accessed on 15 December 2023).
  9. Hsia Chen, C.S.; Schlenker, J.L.; Wentzek, S.E. Synthesis and characterization of synthetic zeolite ECR-1. Zeolites 1996, 17, 393–400. [Google Scholar] [CrossRef]
  10. Gualtieri, A.F.; Ferrari, S.; Galli, E.; Di Renzo, F.; van Beek, W. Rietveld structure refinement of zeolite ECR-1. Chem. Mater. 2006, 18, 76–84. [Google Scholar] [CrossRef]
  11. Song, J.; Dai, L.; Ji, Y.; Xiao, F.-S. Organic template free synthesis of aluminosilicate zeolite ECR-1. Chem. Mater. 2006, 18, 2775–2777. [Google Scholar] [CrossRef]
  12. Lu, T.; Wang, Z.; Zhang, H.; Qin, J.; Yang, Y.; Cheng, P.; Zhao, Z. Radicalized seeds-assist route for the rapid synthesis of zeolite ECR-1 in the absence of organic templates. Microporous Mesoporous Mater. 2022, 341, 112071. [Google Scholar] [CrossRef]
  13. Zhang, Y.J.; Chen, H.; He, P.Y.; Juan Li, C. Developing silica fume-based self-supported ECR-1 zeolite membrane for seawater desalination. Mater. Lett. 2019, 236, 538–541. [Google Scholar] [CrossRef]
  14. Leonowicz, M.E.; Vaughan, D.E.W. Proposed synthetic zeolite ECR-1 structure gives a new zeolite framework topology. Nature 1987, 329, 819–821. [Google Scholar] [CrossRef]
  15. Chatelard, C.; Dodin, M.; Martinez-Franco, R.; Tuel, A. Di- and trioxacyclohexane as structure directing molecules in the synthesis of zeolites omega and ECR-1. Microporous Mesoporous Mater. 2021, 318, 111015. [Google Scholar] [CrossRef]
  16. Weirich, T.E.; Lábár, J.L.; Zou, X. Electron Crystallography: Novel Approaches for Structure Determination of Nanosized Materials; Springer: Dordrecht, The Netherlands, 2006; p. 536. [Google Scholar]
  17. Vincent, R.; Midgley, P.A. Double conical beam-rocking system for measurement of integrated electron diffraction intensities. Ultramicroscopy 1994, 53, 271–282. [Google Scholar] [CrossRef]
  18. Midgley, P.A.; Eggeman, A.S. Precession electron diffraction—A topical review. IUCrJ 2015, 2, 126–136. [Google Scholar] [CrossRef] [PubMed]
  19. Mugnaioli, E.; Gorelik, T.; Kolb, U. “Ab initio” structure solution from electron diffraction data obtained by a combination of automated diffraction tomography and precession technique. Ultramicroscopy 2009, 109, 758–765. [Google Scholar] [CrossRef] [PubMed]
  20. Wan, W.; Sun, J.; Su, J.; Hovmoller, S.; Zou, X. Three-dimensional rotation electron diffraction: Software RED for automated data collection and data processing. J. Appl. Cryst. 2013, 46, 1863–1873. [Google Scholar] [CrossRef] [PubMed]
  21. Wang, B.; Zou, X.; Smeets, S. Automated serial rotation electron diffraction combined with cluster analysis: An efficient multi-crystal workflow for structure determination. IUCrJ 2019, 6, 854–867. [Google Scholar] [CrossRef] [PubMed]
  22. Palatinus, L.; Petříček, V.; Corrêa, C.A. Structure refinement using precession electron diffraction tomography and dynamical diffraction: Theory and implementation. Acta Crystallogr. Sect. A Found. Adv. 2015, 71, 235–244. [Google Scholar] [CrossRef]
  23. Gemmi, M.; Mugnaioli, E.; Gorelik, T.E.; Kolb, U.; Palatinus, L.; Boullay, P.; Hovmöller, S.; Abrahams, J.P. 3D electron diffraction: The nanocrystallography revolution. ACS Cent. Sci. 2019, 5, 1315–1329. [Google Scholar] [CrossRef] [PubMed]
  24. Gruene, T.; Mugnaioli, E. 3D electron diffraction for chemical analysis: Instrumentation developments and innovative applications. Chem. Rev. 2021, 121, 11823–11834. [Google Scholar] [CrossRef]
  25. Samperisi, L.; Zou, X.; Huang, Z. Three-dimensional electron diffraction: A powerful structural characterization technique for crystal engineering. CrystEngComm 2022, 24, 2719–2728. [Google Scholar] [CrossRef]
  26. Klar, P.B.; Krysiak, Y.; Xu, H.; Steciuk, G.; Cho, J.; Zou, X.; Palatinus, L. Accurate structure models and absolute configuration determination using dynamical effects in continuous-rotation 3D electron diffraction data. Nat. Chem. 2023, 15, 848–855. [Google Scholar] [CrossRef]
  27. Cho, J.; Willhammar, T.; Zou, X. The synergistic development of electron crystallography and zeolite discovery. Microporous Mesoporous Mater. 2023, 358, 112400. [Google Scholar] [CrossRef]
  28. Lorgouilloux, Y.; Dodin, M.; Mugnaioli, E.; Marichal, C.; Bats, N.; Caullet, P.; Kolb, U.; Paillaud, J.-L. IM-17: A new zeolitic material, synthesis and structure elucidation from electron diffraction ADT data and Rietveld analysis. RSC Adv. 2014, 4, 19440–19449. [Google Scholar] [CrossRef]
  29. Cichocka, M.O.; Lorgouilloux, Y.; Smeets, S.; Su, J.; Wan, W.; Caullet, P.; Bats, N.; McCusker, L.B.; Paillaud, J.-L.; Zou, X. Multidimensional disorder in zeolite IM-18 revealed by combining transmission electron microscopy and X-ray powder diffraction analyses. Cryst. Growth Des. 2018, 18, 2441–2451. [Google Scholar] [CrossRef]
  30. Steciuk, G.; Schäf, O.; Tortet, L.; Pizzala, H.; Hornfeck, W.; Palatinus, L.; Paillaud, J.-L. A new lithium-rich zeolitic 10-MR zincolithosilicate MZS-1 hydrothermally synthesized under high pressure and characterized by 3D electron diffraction. Eur. J. Inorg. Chem. 2021, 2021, 628–638. [Google Scholar] [CrossRef]
  31. Krysiak, Y.; Barton, B.; Marler, B.; Neder, R.B.; Kolb, U. Ab initio structure determination and quantitative disorder analysis on nanoparticles by electron diffraction tomography. Acta Crystallogr. Sect. A Found. Adv. 2018, 74, 93–101. [Google Scholar] [CrossRef]
  32. Krysiak, Y.; Marler, B.; Barton, B.; Plana-Ruiz, S.; Gies, H.; Neder, R.B.; Kolb, U. New zeolite-like RUB-5 and its related hydrous layer silicate RUB-6 structurally characterized by electron microscopy. IUCrJ 2020, 7, 522–534. [Google Scholar] [CrossRef]
  33. Fitch, A.; Dejoie, C.; Covacci, E.; Confalonieri, G.; Grendal, O.; Claustre, L.; Guillou, P.; Kieffer, J.; de Nolf, W.; Petitdemange, S.; et al. ID22—The high-resolution powder-diffraction beamline at ESRF. J. Synchrotron Radiat. 2023, 30, 1003–1012. [Google Scholar] [CrossRef]
  34. Le Bail, A.; Duroy, H.; Fourquet, J.L. Ab-initio structure determination of LiSbWO6 by X-ray powder diffraction. Mater. Res. Bull. 1988, 23, 447–452. [Google Scholar] [CrossRef]
  35. Toby, B.H.; Von Dreele, R.B. GSAS-II: The genesis of a modern open-source all purpose crystallography software package. J. Appl. Cryst. 2013, 46, 544–549. [Google Scholar] [CrossRef]
  36. Palatinus, L.; Brázda, P.; Jelínek, M.; Hrdá, J.; Steciuk, G.; Klementová, M. Specifics of the data processing of precession electron diffraction tomography data and their implementation in the program PETS2.0. Acta Crystallogr. Sect. B Struct. Sci. Cryst. Eng. Mater. 2019, 75, 512–522. [Google Scholar] [CrossRef] [PubMed]
  37. Petříček, V.; Palatinus, L.; Plášil, J.; Dušek, M. Jana2020—A new version of the crystallographic computing system Jana. Z. Kristallogr. Cryst. Mater. 2023, 238, 271–282. [Google Scholar] [CrossRef]
  38. Momma, K.; Izumi, F. VESTA 3 for three-dimensional visualization of crystal, volumetric and morphology data. J. Appl. Cryst. 2011, 44, 1272–1276. [Google Scholar] [CrossRef]
  39. Brandenburg, K.; Putz, H. Diamond—Crystal and Molecular Structure Visualization; Version 3.2k4; Crystal Impact: Bonn, Germany, 2018; Available online: https://www.crystalimpact.de/diamond (accessed on 3 December 2023).
  40. Ammouli, T.; Paillaud, J.-L.; Nouali, H.; Stephan, R.; Hanf, M.-C.; Sonnet, P.; Deroche, I. Insights into water adsorption in potassium-exchanged X-type faujasite zeolite: Molecular simulation and experiment. J. Phys. Chem. C 2021, 125, 19405–19416. [Google Scholar] [CrossRef]
  41. Martin, M.G. MCCCS Towhee: A tool for Monte Carlo molecular simulation. Mol. Simul. 2013, 39, 1212–1222. [Google Scholar] [CrossRef]
  42. Loewenstein, W. The distribution of aluminum in the tetrahedra of silicates and aluminates. Am. Mineral. 1954, 39, 92–96. Available online: https://pubs.geoscienceworld.org/msa/ammin/article-abstract/39/1-2/92/539331 (accessed on 21 October 2023).
  43. Cygan, R.T.; Liang, J.-J.; Kalinichev, A.G. Molecular models of hydroxide, oxyhydroxide, and clay phases and the development of a general force field. J. Phys. Chem. B 2004, 108, 1255–1266. [Google Scholar] [CrossRef]
  44. Mahoney, M.W.; Jorgensen, W.L. A five-site model for liquid water and the reproduction of the density anomaly by rigid, nonpolarizable potential functions. J. Chem. Phys. 2000, 112, 8910–8922. [Google Scholar] [CrossRef]
  45. Treacy, M.M.J.; Newsam, J.M.; Deem, M.W.; Treacy, M.M.J.; Newsam, J.M.; Deem, M.W. A General recursion method for calculating diffracted intensities from crystals containing planar faults. Proc. Math. Phys. Sci. 1991, 433, 499–520. [Google Scholar] [CrossRef]
  46. Kolb, U.; Gorelik, T.E.; Mugnaioli, E.; Stewart, A. Structural characterization of organics using manual and automated electron diffraction. Polym. Rev. 2010, 50, 385–409. [Google Scholar] [CrossRef]
  47. Palatinus, L.; Jacob, D.; Cuvillier, P.; Klementova, M.; Sinkler, W.; Marks, L.D. Structure refinement from precession electron diffraction data. Acta Crystallogr. Sect. A Found. Cryst. 2013, 69, 171–188. [Google Scholar] [CrossRef] [PubMed]
  48. Ge, M.; Wang, Y.; Carraro, F.; Liang, W.; Roostaeinia, M.; Siahrostami, S.; Proserpio, D.M.; Doonan, C.; Falcaro, P.; Zheng, H.; et al. High-throughput electron diffraction reveals a hidden novel metal–organic framework for electrocatalysis. Angew. Chem. Int. Ed. 2021, 60, 11391–11397. [Google Scholar] [CrossRef] [PubMed]
  49. Girelli Consolaro, V.; Rouchon, V.; Ersen, O. Electron beam damages in zeolites: A review. Microporous Mesoporous Mater. 2024, 364, 112835. [Google Scholar] [CrossRef]
Figure 1. EON topology (left) along the a-axis, with PerBU1 and PerBU2 shown in purple and blue, respectively. Perpendicular view (right) illustrates a column formed by stacking three gme CBUs. These columns are interconnected through 8-MRs, resulting in the characteristic wavy appearance of PerBU1.
Symmetry 16 00477 g001
Figure 2. Reconstructed reciprocal-space sections along three different directions (ac).
Symmetry 16 00477 g002
Figure 3. Le Bail refinement plot of ECR-1 (λ = 0.354196 (3) Å, a = 7.56159 (6) Å, b = 18.1016 (2) Å, c = 26.0313 (4) Å, wR = 4.8%) showing the presence of trace amounts of mazzite (MAZ)◢ and mordenite (MOR) Symmetry 16 00477 i001 zeolites. The Miller indices are indicated alongside the FWHM values in parentheses for representative reflections.
Symmetry 16 00477 g003
Figure 4. Perspectives showing the cation sites in ECR-1 (a,b) after the Rietveld analysis by Gualteri et al. [10], where Na+ cations are labeled as C1 to C4, and (c,d) from the present crystallographic study using 3D ED. The interatomic distances (Na…O dashed bonds) between the cations and oxygen atoms of the framework, as well as the water molecules, are provided in Table 3.
Symmetry 16 00477 g004
Figure 5. Perspective along the a-axis featuring 4000 superposed configurations of H2O within the simulation box of ECR-1 zeolite at a loading of 4 H2O per unit cell. Each grey dot corresponds to an oxygen atom of a water molecule.
Symmetry 16 00477 g005
Table 1. The applied parameters of the Lennard–Jones interaction potential (ε, σ) and the partial atomic charges (q) distributed on atoms of adsorbent [43] and adsorbate [44] species.
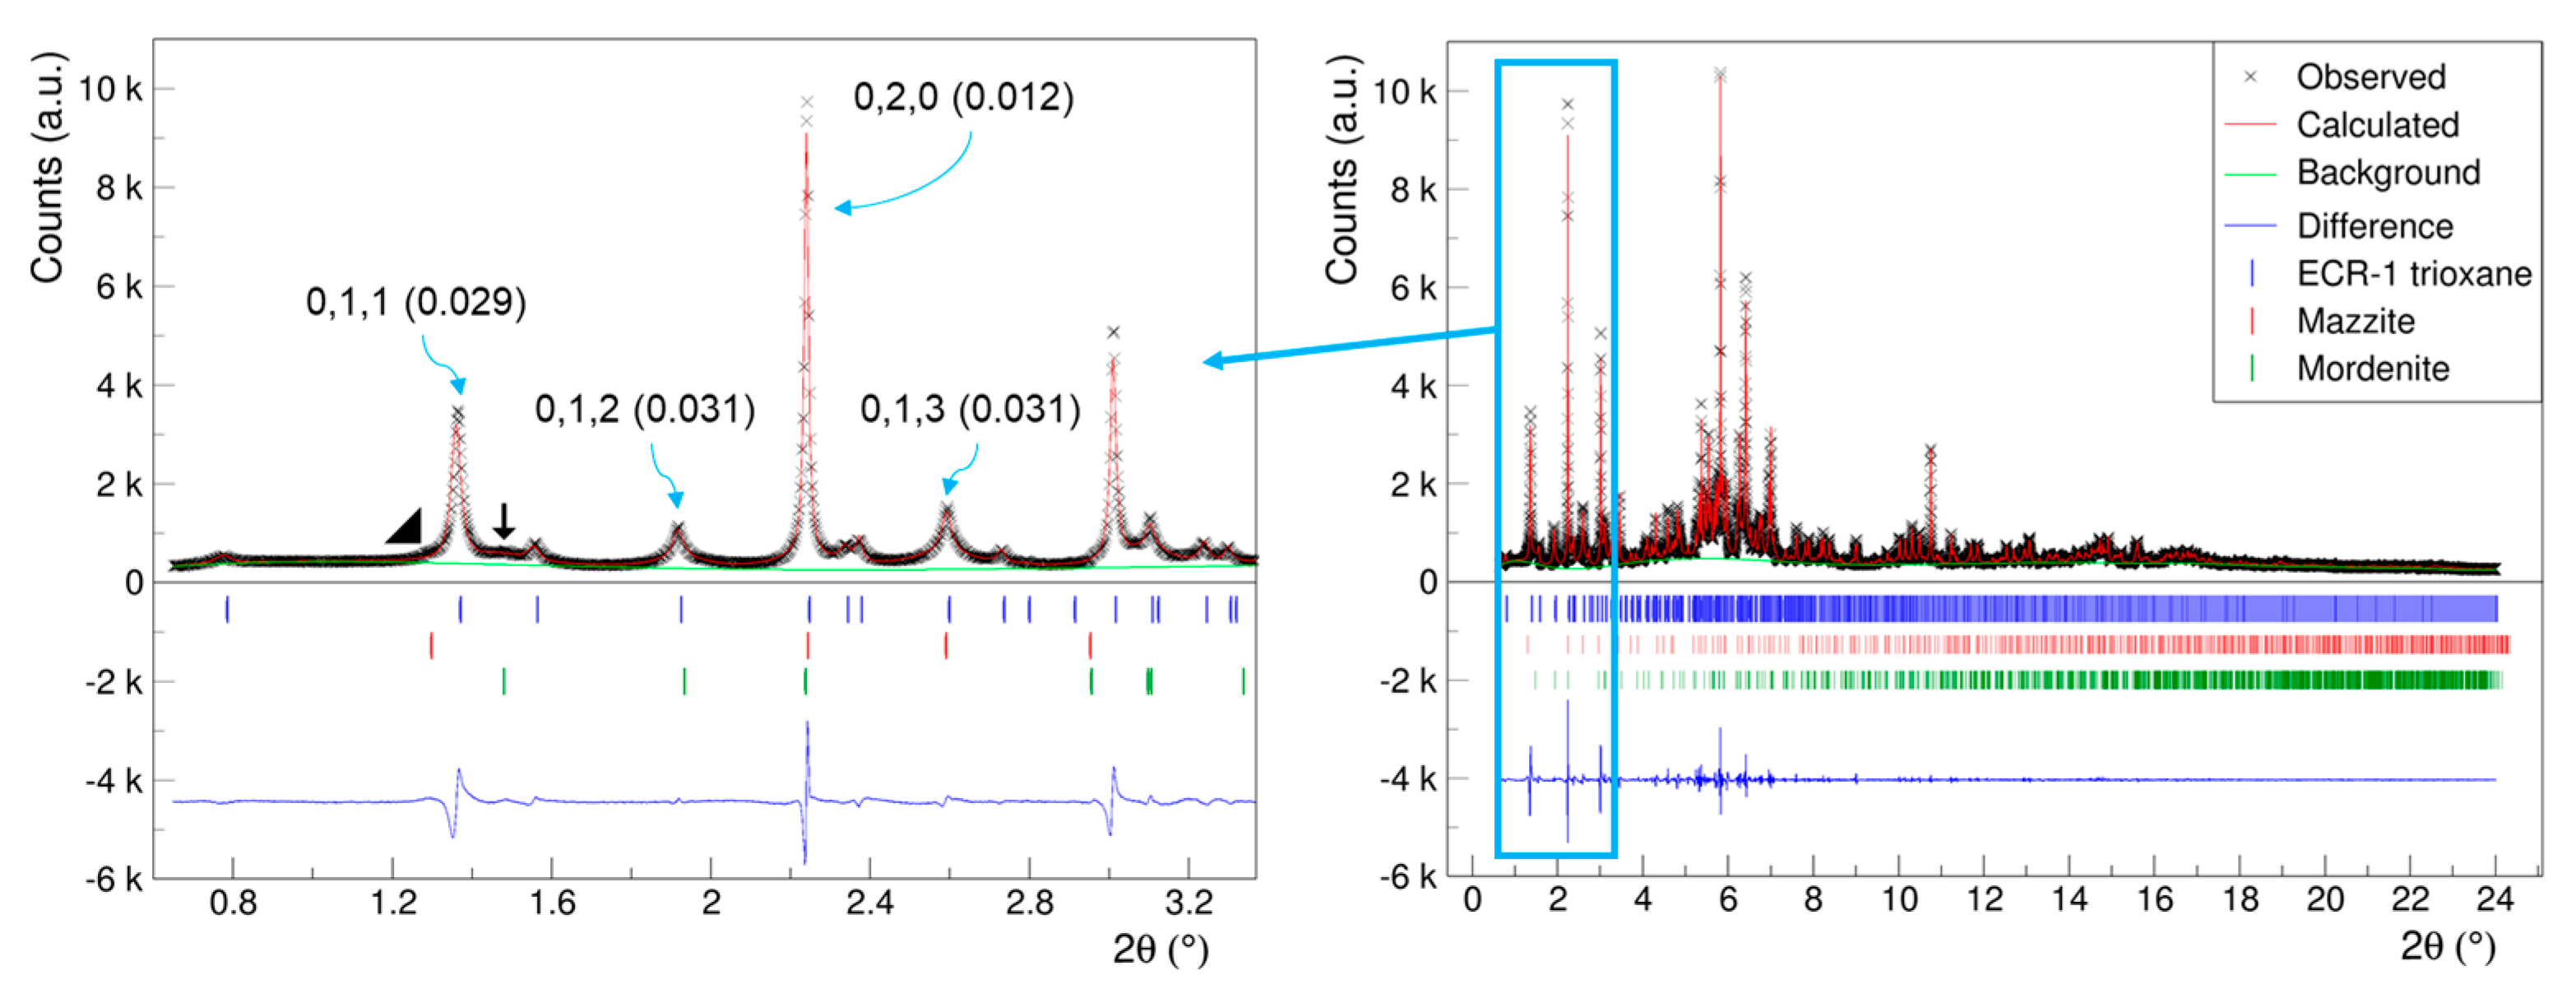
Parameters for the Non-Bonded Interactions
Atom ε/kB (K)σ (Å)q (e)
H(H2O) 000.241
O(H2O) 80.523.120
L(H2O) (lone pair interaction site) 00−0.241
O (zeolite) 78.203.17−1.094
Si (zeolite) 0.93 × 10−33.302.10
Al (zeolite)0.93 × 10−33.301.58
Na+ 65.472.351.00
Table 2. Crystal and structural refinement data for ECR-1, with two distinct columns highlighting the values that differ between kinematical and dynamical refinements.
Kinematical RefinementDynamical Refinement
Refined empirical formulaNa8.84Si60O120Na8.16Si60O124.52
Formula weight3802.03869.5
Temperature/K103.0
Crystal systemorthorhombic
Space groupPmmn (#59)
a/Å7.487 (3)
b/Å17.846 (12)
c/Å25.655 (8)
α = β = γ/°90
V/Å33427.60 (15)
Z1
ρcalc g/cm31.842 1.875
F(000)629.896 635.553
Crystal size/nm~400 × ~200
Data collectionTEM Philips CM200,
Collection modePrecession-assisted 3D ED
Source (wavelength)electrons (λ = 0.02508 Å)
2θ range for data collection/°0.05 to 1.01
Index ranges−8 ≤ h ≤ 9, −23 ≤ k ≤ 23, −31 ≤ l ≤ 26
Reflections collected4367 17,481
Independent reflections438 (Rint = 0.1837)1040 (no averaging done)
Data coverage for sinθ/λ = 0.6 Å−192.4% 93%
Data/restraints/constraints/parameters4367/0/137 17481/17/32/275
Avg./Min/Max crystal thickness-526/25/2386 Å
gmax, RSg(max)-1.3, 0.5
Goodness-of-fit on F2obs: 2.34, all: 1.281 obs: 2.62, all: 0.7976
Final R values [I ≥ 3σ(I)]Robs = 0.169, wR2obs = 0.358Robs = 0.097, wR2obs = 0.1798
Final R values [all data]Rall = 0.604, wR2all = 0.641Rall = 0.517, wR2all = 0.2245
Table 3. Comparison of Na…O shortest distances after dynamical refinements at 103 K with the Rietveld analysis by Gualtieri et al. [10] at room temperature. Na+ cations are labeled as C1 to C4.
Gualtieri et al. [10]This Work
C1O132.25(4)Na1Ow32.48(8)
H2O102.36(9) O222.72(4)
O82.36(5) O102.98(2)
O52.95(7)Na2Ow22.29(2)
O113.03(7) Ow12.32(3)
C2O112.28(4) O22.64(1)
H2O12.65(2) O132.66(2)
O62.76(2) O92.79(2)
H2O63.06(5) O162.85(2)
C3H2O42.35(2)Na3O142.41(6)
H2O52.49(4) O112.59(5)
O202.58(3)Na4O62.46(6)
O142.62(3) O142.52(5)
C3bO162.40(4) O12.57(5)
H2O42.47(4)Na5Ow22.44(1)
O192.50(4) O132.73(1)
C4H2O72.37(6) O162.83(8)
H2O32.51(4) O183.08(1)
O222.954(4)Na6O142.33(3)
O72.41(6)
O112.84(4)
Table 4. Average computed number of charge-compensating Na+ cations located proximal to the corresponding experimentally determined crystallographic sites per unit cell.
H2O/Unit Cell Na1Na2Na3Na4Na5Na6Others
0Nb. of cations3.052.791.500.030.000.493.14
s.o.f. (MC@103 K) a0.760.700.380.010.000.16
4Nb. of cations2.413.001.130.160.000.353.95
s.o.f. (MC@103 K) a 0.600.750.280.040.000.09
s.o.f. (3D ED) b0.5070.7890.2120.2090.0820.240
a Site occupancy factors from the canonical Monte Carlo simulation; b site occupancies factor from the 3D ED crystallographic study.
Table 5. Average computed number of water molecules in experimentally determined crystallographic sites.
Ow1Ow2Ow3Ow4Na5Others
Nb. of H2O molecules0.500.380.890.130.322.10
s.o.f. (MC-103K) a0.250.190.110.060.16
a Site occupancy factors from the canonical Monte Carlo simulation.
Disclaimer/Publisher’s Note: The statements, opinions and data contained in all publications are solely those of the individual author(s) and contributor(s) and not of MDPI and/or the editor(s). MDPI and/or the editor(s) disclaim responsibility for any injury to people or property resulting from any ideas, methods, instructions or products referred to in the content.

