Abstract
Seismic-resistant design incorporates measures to ensure that structures perform adequately under specific limit states, focusing on seismic forces derived from both the equivalent static and spectral modal methods. This study examined buildings on slopes in densely built urban areas, a common scenario in Latin American cities with high seismic risks. The adjustment of high-rise buildings to sloping terrains induces structural asymmetry, leading to plan and elevation irregularities that significantly impact their seismic response. This paper explores the asymmetry in medium-height reinforced concrete frame buildings on variable inclines (0°, 15°, 30°, and 45°) and its effect on their nonlinear response, assessed via displacements, rotations, and damage. Synthetic accelerograms matched with Chile’s high seismic hazard design spectrum, scaled for different performance states and seismic records from the Chilean subduction zone, were applied. The findings highlight structural asymmetry’s role in influencing nonlinear response parameters such as ductility, transient interstory drifts, and roof rotations, and uncover element demand distributions surpassing conventional analysis and in earthquake-resistant design expectations.
1. Introduction
A detailed understanding of the seismic response of reinforced concrete (RC) structures on hillside terrains is crucial for advancing seismic engineering, particularly in light of the interaction between topography, structure, and soil. Recent studies highlight the essential role of considering complex effects such as seismic amplification induced by topography and the interaction between soil and structure for an accurate assessment of these structures’ seismic vulnerability [1,2,3]. This understanding is particularly relevant in Chile, which is situated along the Pacific subduction zone, where frequent large-magnitude earthquakes, such as the 1960 Valdivia earthquake (Mw 9.5), the 1985 Algarrobo earthquake (Mw 8.0), and the 2010 Maule earthquake (Mw 8.8), underscore the country’s high seismic risk. The research underscores the necessity of an integrated approach that includes both topographic and geological considerations due to their significant impact on the seismic response magnitude [4,5]. Such studies are often situated in developing countries, including those in Latin America, which have witnessed the devastating effects of earthquakes on slope constructions, thereby underscoring the relevance of incorporating these considerations into seismic design and analysis practices.
Recurrent earthquakes have historically led to significant human and material losses, particularly associated with the vulnerability of structures. The implementation of modern building codes, underpinned by research into material behaviors and their interactions with the dynamic loads imposed by earthquakes, has significantly reduced the number of losses during major seismic events. However, certain structural typologies, when adapted to specific topographical conditions, produce alterations in how structures respond to earthquake actions. Thus, the response of a building classified as regular by seismic codes can be significantly altered if the building’s structure is modified to adapt to hillside locations. Additionally, research has been conducted on the dynamic amplification that topographic irregularities can introduce to foundations [6,7,8,9]. This aspect, however, remains beyond the scope of this research.
The assessment of the vulnerability of RC buildings on precarious hillsides to the combined action of ground shaking and seismic-induced landslides has led to the development of specific methodologies that incorporate the analysis of permanent ground displacements and topographic amplification. Such methodologies aim to generate fragility curves that effectively consider these combined effects, thus offering a more realistic evaluation of seismic hazards [7,10]. Conducting parametric studies examining the influence of structural configuration and geological and topographic conditions is underlined by the necessity to optimize design practices to enhance the resilience of structures against seismic events [4,11,12,13]. However, it is necessary to indicate that the findings of these recent studies have not yet been incorporated into global seismic codes and, therefore, into common design practice for structures located on hillsides [14,15,16,17].
Soil–structure interactions have proven to be a determining factor in modifying the seismic response, emphasizing the importance of considering this effect in seismic design to ensure structural safety [18,19,20,21]. Studies that include this interaction suggest a more holistic and detailed design approach, which is crucial for structures situated on hillsides [6,22,23]. On the other hand, seismic microzonation emerges as an essential tool for identifying risk areas and formulating mitigation strategies based on specific site characteristics [24,25,26], which can encompass areas with similar geological and topographic conditions that require the consideration of specific design conditions.
Research on the seismic response and vulnerability of structures on inclined terrains has significantly advanced in recent times, incorporating complex analyses that consider the variability in slope inclination, soil–structure interactions, and structural configurations [27,28,29]. These recent studies have broadened the understanding of the problem, addressing the location-specific seismic microzonation relative to the slope and detailed analyses of the nonlinear structural response under specific seismic loads [27,30,31,32].
The interaction between topography and structure is crucial for evaluating the seismic response of buildings located on hillsides, where topography can significantly alter the ground motion amplification pattern. Research has shown that the proximity to crests or valleys can influence the magnitude of the seismic response, requiring an informed and adapted structural design for these specific conditions [24,32,33]. The influence of topography on seismic amplification, combined with soil–structure interactions, highlights the need for more sophisticated design approaches that integrate these effects in a comprehensive manner [33,34,35].
Furthermore, the analysis of the seismic vulnerability of structures on inclined terrains has evolved towards more complex models that consider not only the structure itself but also the geological and topographic environment in which it is located. These models seek to more accurately predict the behavior of structures during seismic events, considering effects such as the induction of ground displacements and the dynamic interaction between the soil and structure [36,37]. Three-dimensional simulations and nonlinear analysis have provided valuable insights into how these interactions affect the safety and performance of structures during and after seismic events [28,29,38,39,40,41].
The seismic design of structures is conducted through regulatory precepts aimed at ensuring safety for the occupants, the building, and its contents. The continuous improvement of construction standards has allowed for the incorporation of principles intended to rectify the failures observed during previous catastrophic seismic events, preventing such failures from affecting buildings throughout their lifespan. Currently, the design is based on results from linear dynamic analyses, where seismic demands are introduced through design spectra corresponding to a specific demand level for the building’s location [16,42,43,44]. These demands must be met by the structure’s overall capacity and that of its individual components, necessitating the structural engineer to conduct careful design and detailing, taking into account the characteristics of the materials constituting the structure. Regarding existing buildings, it is necessary under certain circumstances to carry out capacity upgrade processes, in which case, a seismic capacity assessment is required, for which, analyses in both linear and nonlinear ranges are often applied [45,46].
Among the limitations of this study, the following can be mentioned. The structural typology corresponds to medium-height buildings with reinforced concrete frames, designed for areas of high seismic threat (0.4 g), situated on terrains with variable inclinations (between 0° and 45°), representing a wide range of slopes. The challenges of the research are to capture the nonlinear response of buildings that are assumed to be regular, but due to the necessity of adapting to the local topography, acquire certain characteristics of asymmetry that are not covered by current standards, and are therefore, lacking specific prescriptions for their analysis and design. This could lead to nonlinear structural performances that cause unexpected damage during the occurrence of strong earthquakes, putting the safety of people and property at risk.
In this context, the present study focused on the application of detailed numerical analyses to evaluate the seismic response of RC frame building archetypes located on hillsides, using a methodological approach that incorporates both nonlinear dynamic analyses and static analyses to assess the nonlinear structural response under combined loading conditions. This approach allows for a comprehensive evaluation of the effects of the structural irregularity caused by the geometric asymmetry found in buildings on slopes, specifically considering the combined effects of gravitational actions with ground movements during strong earthquakes. By employing such analyses, this study aspires to significantly contribute to the body of knowledge in seismic engineering, offering valuable insights for the design and evaluation of RC structures on inclined terrains, and aimed at mitigating seismic hazards and protecting lives and properties.
2. Methodology
To analyze the influence of structural asymmetry on the nonlinear response of buildings, the study began with the conception and design of a series of representative archetypes of typical structures located on terrains with different slopes. To make the responses obtained comparable, the general geometry was kept constant, with variations only in the slope of the terrain. The archetypes were sized and structurally designed to be competent against the combined impacts of gravitational and seismic effects, according to conventional normative procedures. For this purpose, spectral modal analysis was initially carried out, considering the demand that was defined according to the seismic hazard level of the location.
The buildings’ responses were evaluated using analysis methods based on nonlinear responses, starting with an incremental pushover analysis, which preliminarily allows us to capture the effects of nonlinearity under a pattern of statically applied loads. Subsequently, a dynamic analysis was carried out, for which, two sets of accelerograms (artificial and from seismic records) were used.
The parameters chosen to evaluate the nonlinear response, which are typically used to determine the displacements that evidence damage [30,44,47], are given in the following list:
- Interstory drifts;
- Roof rotations;
- Demand–capacity ratios of structural elements.
With the selected parameters, an assessment of the influence of structural irregularity caused by the modification of the archetypes’ geometry on the seismic responses of these archetypes was carried out.
At this point, it is crucial to note that the archetypes were conventionally designed, considering the implications that irregularities in both plan and elevation, which were generated by adapting the structure to the slope of the terrain. Regarding regulatory considerations related to slopes, only Eurocode 8 [43] provides recommendations that consider the presence of slopes, but these are limited to the foundation design process. As for the main international standards, there are no specific recommendations for the design of structures situated on slopes [14,16,44].
2.1. Description of the Archetypes
The archetypes studied consisted of regular reinforced concrete buildings, designed for a high seismic hazard zone, located on terrains with different inclinations, the latter of which were defined by the slope of the terrain. The study began with a basic archetype consisting of a frame building located on non-inclined terrain; its response was used as a point of comparison.
Geometry of the Archetypes
The archetypes, regardless of the terrain inclination, had nine levels with a height of 3.00 m each. The structuring of the buildings was carried out using moment-resisting frames, defined according to an orthogonal arrangement with five axes in the X direction, spaced equidistantly every 6.00 m, and four axes in the Y direction, spaced every 5.00 m, see Figure 1.
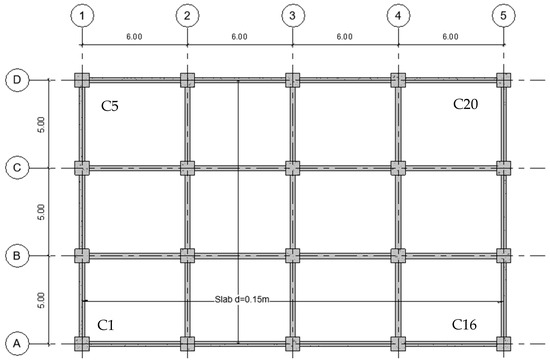
Figure 1.
View of the typical floor plan of the archetypes.
The slope of the terrain influences the structuring. It is assumed that the buildings will have a general access from the lower part of the building, not from some intermediate level. Accordingly, the structure adapts to the slope of the terrain by reducing the height of the columns from the access facade towards the rear facade. This even leads to, for buildings on steeper slopes, the slabs of the first levels, in some cases, having to be reduced in their extension or simply eliminated for not being able to include them within the support structure, see Figure 2a–d.
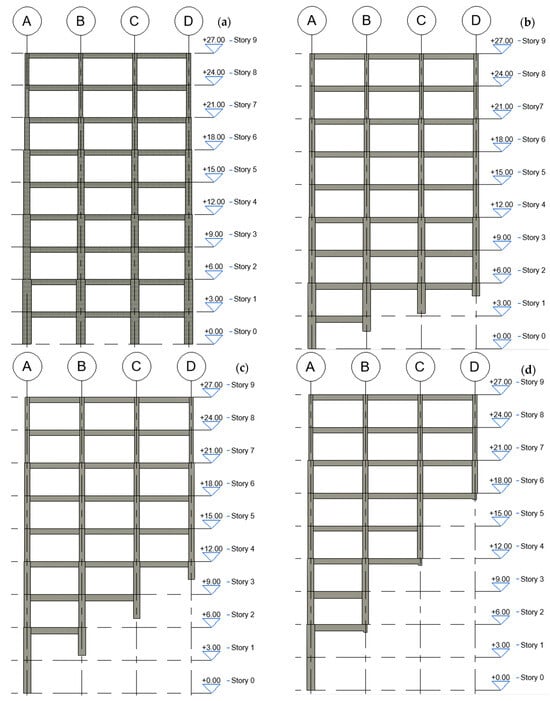
Figure 2.
Elevation views of the archetypes: (a) 0° archetype, (b) 15° archetype, (c) 30° archetype, and (d) 45° archetype. In this figure, A, B, C and D are structural axis.
The removal of floors as a result of adapting the structure to the slope is not directly limited or regulated by standards. However, it should be noted that when a floor is partially or completely removed, structural regularity is altered in two ways. The first involves the alteration of regularity in elevation; when an entire floor is removed, it results in floors with heights that can double those of existing floors, altering the building’s dynamic response. Additionally, double-height floors produce the undesired effect of a weak story due to their reduced stiffness, thus creating a weak link within the structural chain. The second alteration concerns irregularity in the plan. If a floor is partially removed, its center of gravity shifts relative to the centers of gravity of the unaltered floors, leading to uncoupled vibration that creates torsional effects on the columns connecting those floors. These torsional effects tend to concentrate in the columns located at the periphery of the floors, making it especially important to study the displacement demands on such columns.
The structural elements of the archetypes were modeled using nonlinear constitutive parameters corresponding to the materials that represent the reinforced concrete in the analysis and design. Firstly, there is concrete, designated as G30, whose mechanical characteristics are provided in Table 1. To model the nonlinear behavior of concrete, the constitutive parameters by Mander et al. [48] has been employed. On the other hand, the reinforcing steel corresponds to the designation A630-420H, whose mechanical characteristics can be observed in Table 2. The constitutive parameters of this material are from Menegotto and Pinto [49].

Table 1.
Constitutive model parameters by Mander et al. for concrete grades G25, G30, and G35.
Table 2.
Constitutive model parameters by Menegotto and Pinto for A630-420H-grade steel.
Table 3 shows the resulting sections of the structural elements. It is noted that, for design reasons, the column sections were kept as squares and with the same dimensions on each floor. The dimensions progressively decreased with height. For the beams, the same cross-sectional shapes were adopted for both the X and Y directions, adopting rectangular shapes. It is also noted that these too decreased with height.
Table 3.
Sections resulting from the design of the archetypes. All the dimensions are in cm.
2.2. Analysis Type
To study the response of the archetypes, various types of analyses have been applied to assess their response to earthquake action. The first of these, defined according to the Chilean seismic code NCh433 [42], is the spectral modal analysis, which was required for the design of the archetypes. In this work, there were different types of definitions for the representative elements of the concrete slabs of the levels. These slabs were defined using rigid diaphragms and shell-type elements, so that the use of different elements in the modal response of the archetypes can be evaluated.
On the other hand, to assess the adequacy of the seismic response of the archetypes, it was necessary to carry out analyses considering the nonlinear behavior, for both the geometric and constitutive parameters of the elements and materials, respectively. The nonlinear analyses applied in this study are as follows:
- Nonlinear static analysis with incremental pushover;
- Nonlinear dynamic time-history analysis using artificial accelerograms;
- Nonlinear dynamic time-history analysis using recorded events.
2.2.1. Static Non-Linear Analysis
The nonlinear static analysis was conducted as a preliminary approach to determine the response of structures to lateral loads induced by ground motion from earthquakes [28,39,40]. In this study, this analysis was carried out considering two advanced aspects. The first pertains to the fact that the pattern of incremental lateral forces assumes a shape that corresponds to the modal displacements of the fundamental mode of vibration of the building in each of the analysis directions [50]. The second aspect considers the accidental eccentricity of the floors, for which, the following cases were considered:
+Modal Distribution in X + Eccentricity in Y;
+Modal Distribution in X − Eccentricity in Y;
−Modal Distribution in X + Eccentricity in Y;
−Modal Distribution in X − Eccentricity in Y;
+Modal Distribution in Y + Eccentricity in X;
+Modal Distribution in Y − Eccentricity in X;
−Modal Distribution in Y + Eccentricity in X;
−Modal Distribution in Y − Eccentricity in X.
For the capacity curves obtained through the static nonlinear analysis, a set of performance points was determined by applying the ASCE 41-17 [30] procedure, which allows us to obtain these points based on the seismic hazards defined through the elastic design spectrum for various return periods. In this study, the elastic design spectrum defined in the NCh433 for very stiff soil was considered, scaling the spectral ordinates according to the following return periods:
where Sα is the response spectrum acceleration at the effective fundamental period and damping ratio of the building in the direction under consideration, as calculated by the methods in Sections 2.4.1 or 2.4.2 of ASCE 41-17.
C0: Modification factor that relates the spectral displacement of the equivalent single degree of freedom (SDOF) system with the roof displacement of the building’s multiple degree of freedom (MDOF) system.
C1: Modification factor to relate expected maximum inelastic displacements to displacements calculated for linear elastic response.
C2: Modification factor to represent the effect of pinched hysteresis shape, cyclic stiffness degradation, and strength deterioration on the maximum displacement response.
2.2.2. Time-History Non-Linear Dynamic Analysis Using Artificial Accelerograms
A set of short-duration synthetic accelerograms (10 s) was used, generated using the elastic design spectrum defined in the Chilean seismic code NCh433 for various hazard levels corresponding to different performance levels. The performance levels are shown in Table 4 along with the associated exceedance probability, with the acceptable performance levels located in the cells highlighted in green [30,44,45].
Table 4.
Definition of performance limit states with their corresponding associated exceedance probabilities.
2.2.3. Time-History Non-Linear Dynamic Analysis Using Seismic Records
Finally, a nonlinear time-history analysis was conducted using a set of accelerograms from seismic records of earthquakes that occurred in the subduction zone in Chile, matched with the elastic design spectrum for the building sites.
The records chosen to carry out the nonlinear time-history analyses mentioned in the previous section correspond to strong earthquakes that occurred during the last two decades in the subduction zone that have affected Chile. The records were applied using their two horizontal components, leaving the inclusion of the vertical component for a subsequent study to avoid introducing an additional variable [32,46,51]. Table 5 displays the characteristics of the seismic records.
Table 5.
Descriptive summary of Chilean records used.
Figure 3 summarizes the response spectra calculated from the records used in the analyses (set of gray lines). These spectra are shown along with the average calculated spectrum plus and minus one standard deviation. Also, for comparison purposes, the elastic design spectrum for stiff soil (soil type B), which is the type of soil idealized for the placement of the archetypes, was added. Eleven pairs of records were chosen to meet the requirements of ASCE 7, which requires at least this number of records to perform analyses in the nonlinear range, thereby allowing for the comparison of the design limit values against the averages of the characteristics calculated with these records [39,40]. Note that the pairs of records were applied simultaneously in the two main structural directions of each archetype. The records were downloaded from the CESMD database [52] and were corrected using the SeismoSpect [53] and SeismoMatch [54] programs to match these records with the elastic design spectrum.
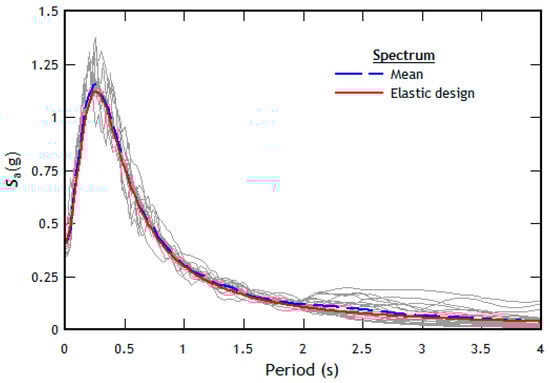
Figure 3.
Response spectra of the matched records, with the SB soil elastic design spectrum and the mean spectrum.
As a result of the process of matching seismic records with the elastic design spectrum, the modified accelerograms were obtained (see Figure 3). Response spectra (continuous gray lines) were determined for these accelerograms, and with these, the average spectrum (blue long-dash line) was calculated; it can be seen that they are quite closely aligned with the elastic design spectrum. This good alignment has allowed for the validation of the record matching process through the requirements of ASCE 7, which, in the case of using a minimum of 11 pairs of records, enables the comparison with the average of the response spectra.
3. Results and Discussion
The results of the analyses are presented below, grouped according to the type of response. Firstly, the results of the linear analyses are shown, followed by the results of the nonlinear analyses. The analyses have been conducted using the SeismoStruct [55] and SeismoBuild [56] programs.
3.1. Results of Linear Analysis
The results obtained from the linear analysis of the structure showed the effect of asymmetry on the dynamic response of the buildings. This became evident when establishing the minimum number of vibration modes that ensured that the participative modal mass was at least equal to 95%.
It can be observed in Figure 4 that considering slabs modeled as rigid diaphragms implies a relatively low number of vibration modes necessary to obtain a participative mass of at least 95%, compared to the consideration of semi-rigid or shell-type diaphragms. Additionally, it can be noted that as the slope of the terrain increased, and hence the buildings lost their regularity both in plan and elevation, the number of modes required to meet the participative mass criterion increased dramatically [57].
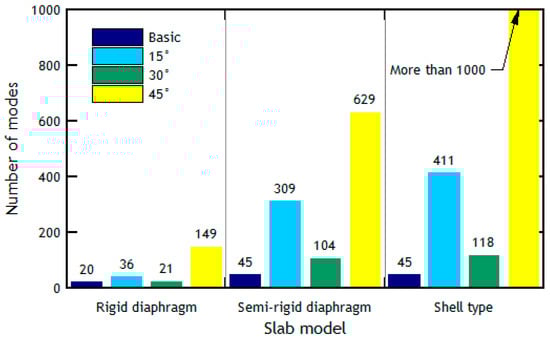
Figure 4.
Minimum number of modes to achieve a minimum participative mass of 95%.
3.2. Results from Non-Linear Analysis
The results corresponding to the nonlinear analysis with incremental pushover verified that, in both the X and Y directions, the archetypes exhibited adequate ductility. Figure 5 shows the capacity curves obtained through the pushover analysis with the combinations + Modal Distribution in X + Eccentricity in Y and + Modal Distribution in Y + Eccentricity in X (light blue and pink lines, respectively). Idealized capacity curves (blue and red lines) were determined for these capacity curves, and the locations of the performance points, defined using Equation (1) for the different limit states defined in Table 4, were also found [46,58]. To make the results of the different buildings comparable, the capacity curves were normalized with respect to the total height and seismic weight of the buildings [59,60,61].
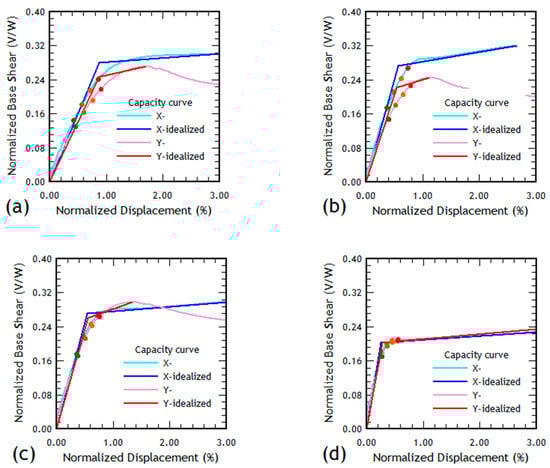
Figure 5.
Capacity curves of the analyzed archetypes: (a) 0° Archetype, (b) 15° Archetype, (c) 30° Archetype, (d) 45° Archetype. In this figure, the light green dot represents the performance point for the limit state of the operational level (1-A), while the dark green, orange, and red dots represent the limit states of immediate occupancy (1-B), life safety (3-C), and collapse prevention (5-D), respectively.
The displacements (normalized with respect to the height of the archetypes) of the performance points corresponding to the limit states evaluated in this study are summarized in Table 6. Note that these displacements for each direction of the static nonlinear analysis represents those shown in Figure 5.
Table 6.
Normalized displacements of the performance points calculated for the different archetypes and limit states.
From the capacity curves and their idealized forms, it is possible to determine the displacement ductility and the reserve of strength [50,59,60]. It was noted that the ductility developed for the building located on a terrain inclined at 45° showed values much higher than those achieved by buildings located on less inclined soils (see Figure 6). As for the reserve of strength reached, the results did not show a great variation. This allows us to deduce that the asymmetry generated by the irregularity both in plan and elevation of the studied buildings affects the nonlinear displacement response more than the nonlinear strength response [62,63].
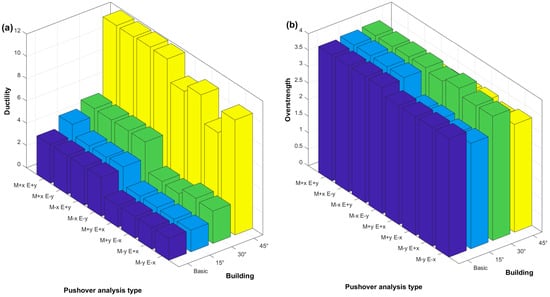
Figure 6.
Results of the pushover analyses: (a) ductility and (b) overstrength. In this figure, the blue bars represent the drifts of the Basic Archetype, the light blue bars represent the drifts of the 15° Archetype, the green bars represent the drifts of the 30° Archetype, and the yellow bars represent the drifts of the 45° Archetype.
3.2.1. Interstory Drift Control
Seismic design standards employ dynamic nonlinear analyses to achieve a closer approximation of the seismic response of buildings. To counteract the high variability present in the seismic records used for these analyses, ASCE 7 requires the use of at least 11 records, with criteria that allow for the rejection of results, especially in cases where numerical convergence of the analyses is not achieved.
From the results of the dynamic nonlinear analysis, it was possible to calculate the transient interstory drifts, which were compared against thresholds to determine the damage to structural elements located at different stories of the building. The greater the transient interstory drift, the greater the damage achieved and the more the elements engaged in nonlinear behaviors.
The results must be analyzed in the two main structural directions, corresponding to the X and Y axes. Figure 7 shows the results of the maximum transient interstory drifts reached at the nine stories of the basic archetype in the X direction for each pair of records used in this research. The results were plotted for the four columns at the corners of the archetype, identifying them according to the intersection of the axes in Figure 1. Thus, in Figure 7, the drifts corresponding to columns C1 (A-1), C5 (D-1), C16 (A-5), and C20 (D-5) are shown. The review of the interstory drifts of these columns aimed to capture the effect of asymmetry and structural irregularity on the dynamic response, which tended to be magnified in the columns located at the corners of the buildings, where torsional effects increasingly manifested.
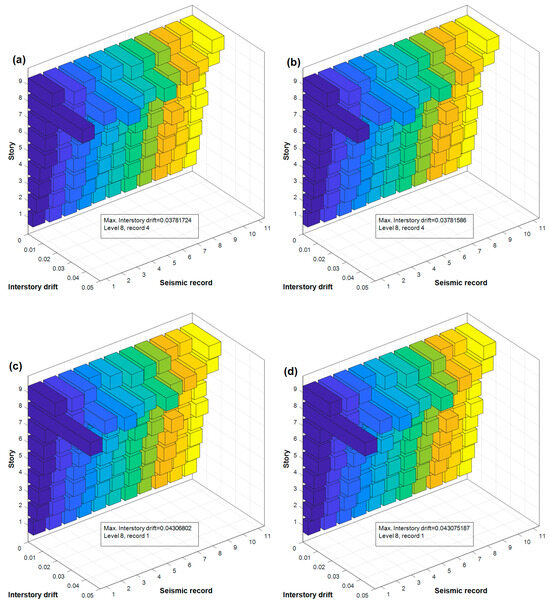
Figure 7.
Maximum interstory drift in X direction of columns (a) C1, (b) C5, (c) C16, and (d) C20. In this figure, each color represents the interstory drifts calculated using each pair of seismic records.
In this figure, on the x-axis (horizontal and to the right), the 11 pairs of records used in this research are shown; on the y-axis (horizontal and to the left), the values of the maximum transient drifts achieved at the different levels of the studied archetype are displayed. Lastly, on the z-axis (vertical), the levels of the archetype are presented.
It was noted that the greatest interstory drifts occur, regardless of the records and the location of the columns, on the eighth story of the basic archetype. This is due to the reduction in the cross-sectional area of the columns at this level, with the maximum drift value being slightly above 0.04 for record 1 (see Table 5) for column C20. It can also be noted that the drifts of the lower stories maintained small values, indicating that significant damage did not occur at these levels. A similar behavior was observed in the results of the interstory drifts calculated in the Y direction, where the maximum value was also slightly above 0.04 for record 1 from Table 5, this time for column C1 (see Figure 8). Due to space limitations, it was not possible to show the results for all the archetypes, but can be made available for interested readers by correspondence.
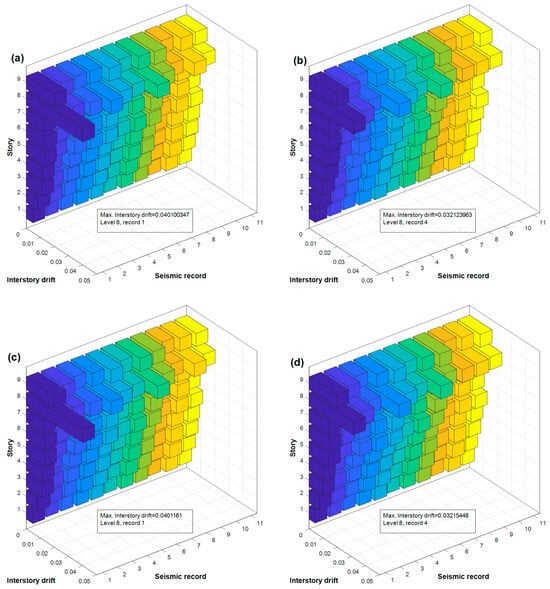
Figure 8.
Maximum interstory drift in Y direction of columns (a) C1, (b) C5, (c) C16, and (d) C20. In this figure, each color represents the interstory drifts calculated using each pair of seismic records.
The consideration of the suitability of the structural design was carried out through the evaluation of the average interstory drifts, thanks to the use of 11 pairs of records (ASCE 7). Thus, the average results of the basic archetype in the X and Y directions for columns C1, C5, C16, and C20 discussed earlier can be appreciated. As expected, the maximum drifts were reached on the eighth story, in the analyses for both directions (see Figure 9). Similarly, Figure 10, Figure 11 and Figure 12 show the average interstory drifts of the 15°, 30°, and 45° archetypes. Note that in these cases, the maximum average drifts occurred on the eighth story, but unlike the basic archetype, there were null drifts at the first level of these archetypes, due to the presence of supports placed on the slope, which nullifies the displacements of these initial levels. Despite this characteristic, it can be noted that the average interstory drifts reached in both directions were comparable in all the case studies.
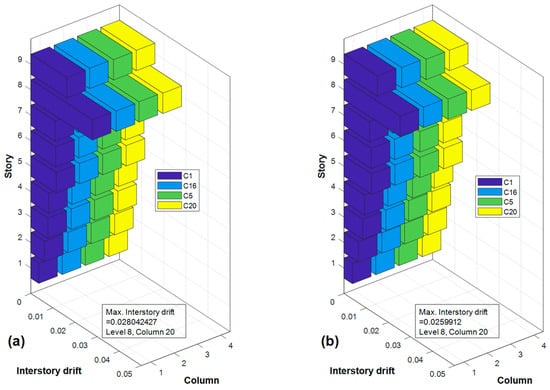
Figure 9.
Mean interstory drift in (a) X and (b) Y directions of the basic archetype.
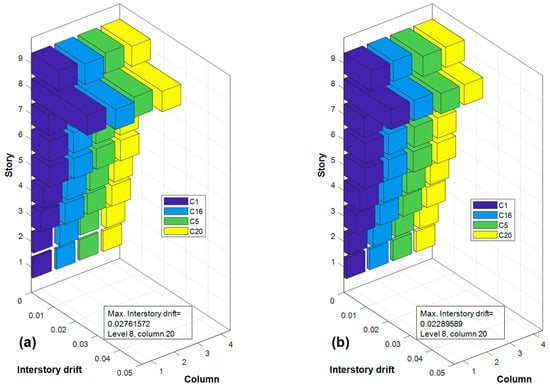
Figure 10.
Mean interstory drift in (a) X and (b) Y directions of the 15° archetype.
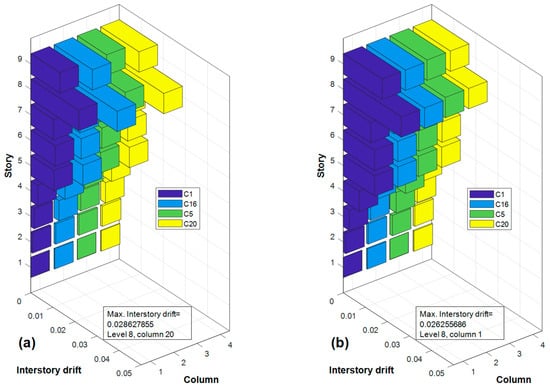
Figure 11.
Mean interstory drift in (a) X and (b) Y directions of the 30° archetype.
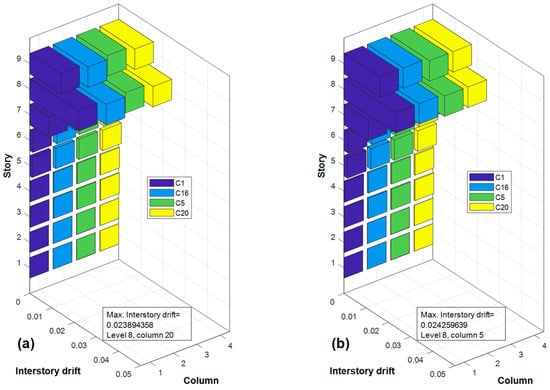
Figure 12.
Mean interstory drift in (a) X and (b) Y directions of the 45° archetype.
In Figure 9, Figure 10, Figure 11 and Figure 12, on the x-axis (horizontal to the right), the four columns located at the corners of the archetypes’ floors, whose locations have already been indicated, are shown. On the y-axis (horizontal to the left), the average values of the maximum transient drifts achieved at the different levels of the studied archetype, using the eleven pairs of records, are displayed. Finally, on the z-axis (vertical), the levels of the archetype are presented.
3.2.2. Acceptance Criteria Based on the Transient Interstory Drift
The limits imposed by ASCE 7 for transient floor drifts are provided in the table in Section 12.12 [44]. For reinforced concrete buildings structured with frames, a limit value of has been established. The average transient floor drift should not exceed twice the value of the floor drift expressed in Table 12.12-1 of ASCE 7. Similarly, for buildings exceeding 30 m in height, the average transient drift should not surpass the value calculated using the following expression:
where is the interstory height and is the total height of the structure, both measured in meters. Although the application of this equation is valid only for buildings that exceed 30 m in height and the study cases only reached 27 m, it has been decided to apply it to have a referential comparison value as an acceptance criterion. The result of the above equation should not be less than:
Using the data from the studied archetypes, a limit value for the average transient floor drift of was obtained, which is greater than the value obtained from the right term of the previous equation (0.09 m). This value, which is applicable to the drifts of all floors, implies that the maximum interstory drift for an interstory height of 3 m is 0.04. As can be observed in Figure 8, Figure 9, Figure 10 and Figure 11, none of the average floor values reached this limit value.
Regarding the acceptance criterion for analyses based on transient interstory drifts, if an analysis yields a maximum transient interstory drift value greater than 150% of the value calculated using the equation, it will be necessary to discard the results of that analysis in the calculation of the building’s performance. The maximum limit of the transient floor drift was then calculated, yielding a value of 0.184 m, which, when converted to interstory drift, gave a value of 0.06. Comparing this maximum value with the results reported in Figure 7 and Figure 8, it can be noted that none of the floors exceeded this value, allowing for the consideration of all the results of the dynamic time-history analyses.
The other acceptance criterion was for residual floor drift. ASCE 7 sets an acceptance value of for drifts remaining in the structure when it reaches rest. In the interest of brevity, the results of these calculations are not shown, but it can be mentioned that the values of the residual floor drift in the different archetypes did not exceed the indicated limit value.
3.2.3. Rotation Control
Design standards do not use floor rotations as acceptance criteria [4,19,64,65]. The authors believe that such rotations can provide an interesting approximation for the response associated with torsion induced by the asymmetry of the archetypes. For this purpose, the maximum relative rotations between the roof level and the foundation level of each archetype for each pair of records used in the dynamic analysis were calculated, see Figure 13. It is noted that, contrary to expectations, the most irregular archetype (45°) did not exhibit the highest rotations, but rather it was the 30° archetype. To prevent the elevated values of the latter from overshadowing those of the 45° archetype, it was necessary to modify the order of result presentation in Figure 13.
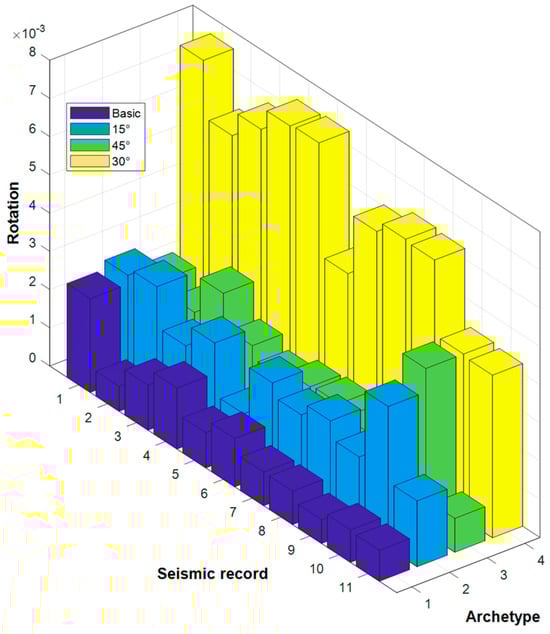
Figure 13.
Maximum rotations reached in the gravity center of the roof in each archetype.
3.2.4. Damage Control
Damage control was studied based on the outcomes of all the analyses utilized in this study. The demand versus capacity ratio was determined for each of the structural elements under the various types of applied loads, whether these were incremental lateral loads (from the pushover analysis) or loads induced by accelerations imposed on the archetypes, either defined by artificial accelerograms or by seismic records.
The results of the damage control were extensive, and in the interest of brevity, only some are shown, which illustrate two of the main issues detected in the analyses: the stiffness reduction of the eighth floor and the short columns that originate in the archetypes inclined at 30° and 45°. In Figure 14, the elements of the archetypes that have exceeded a value of one in the demand versus capacity ratio for the analyses using artificial accelerograms can be observed. These results correspond to the limit states of the operational level (1-A) and immediate occupancy (1-B). In the case of the limit states for life safety (3-C) and collapse prevention (5-D), exceeding the value of one for the demand versus capacity ratios was not observed, indicating that these limit states were adequately protected in the conventional design applied [1,18,66]. The reader may notice that the 30° archetype presented deeper degrees of damage than the rest of the archetypes. Although, as previously mentioned, the 45° archetype exhibited greater irregularity due to the asymmetry created by the steeper slope, the presence of supports that restrict displacements prevented the occurrence of relative displacements that are responsible for producing the most severe damage.
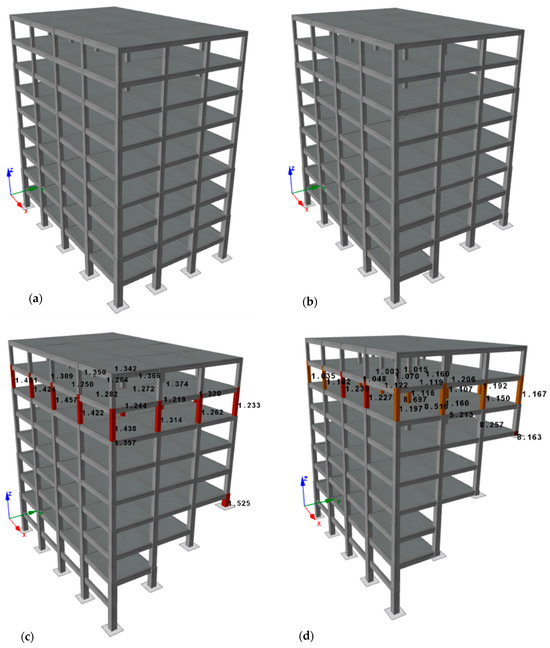
Figure 14.
Elements that exceed the limit for the demand-capacity relationship in the archetypes (a) 0°, (b) 15°, (c) 30°, and (d) 45° subjected to the action of synthetic accelerograms for the Immediate Occupancy limit state (1-B).
4. Conclusions
The study further confirms the complexity of the nonlinear response of buildings to seismic loads, which has a significant dependence on structural symmetry. The adaptation of buildings to sloped terrains introduces inherent asymmetries, even when attempts are made to maintain the regularity of the building’s geometry. The identified irregularities, such as misaligned centers of gravity across successive stories, increased mass with height, double-story heights due to the impossibility of placing slabs on certain floors, and the formation of short columns due to vertical support shortening on slopes, underscore the challenges posed by slope-induced asymmetry.
Based on the comprehensive results and discussions presented in this study, the following conclusions can be drawn:
- Influence of Asymmetry on Dynamic Response: The linear analysis indicated a significant impact of asymmetry on the dynamic response of the buildings, a factor that becomes increasingly critical as the slope of the terrain, and hence the irregularity of the buildings in both plan and elevation, increases. This underscores the need for considering a higher number of vibration modes to accurately capture the seismic behavior of structures located on sloped terrains.
- Nonlinear Ductility and Capacity: The nonlinear analyses, particularly with incremental pushover, demonstrated that the archetypes exhibited adequate ductility in both the X and Y directions. This finding is pivotal, as it suggests that despite the geometric complexities introduced by slope-induced asymmetry, the designed archetypes can still achieve the desirable level of seismic performance.
- Transient Interstory Drift and Damage Control: The dynamic nonlinear analysis, essential for closely approximating the seismic response of buildings, highlights the significance of transient interstory drift as a critical measure of seismic damage. This study confirmed that the maximum allowable drift values, as dictated by ASCE 7, were not exceeded, ensuring that all the dynamic time-history analyses results can be considered reliable for performance evaluation.
- Acceptance Criteria and Structural Design Suitability: The application of ASCE 7 acceptance criteria based on transient interstory drift offers a robust framework for evaluating the seismic suitability of structural designs. Our findings reveal that despite the potential increases in drift due to architectural asymmetry, the structural integrity remains within safe limits, affirming the effectiveness of conventional design practices in mitigating seismic risks.
- Rotations Control and Irregularity Effects: Contrary to expectations, archetypes with higher degrees of irregularity (45°) did not exhibit the highest rotations, challenging the preconceived notions about the relationship between structural asymmetry and torsional responses. This suggests that the presence of structural supports and the method of displacement restriction play a significant role in mitigating potential damage, especially in highly irregular structures.
- Comprehensive Damage Analysis: The extensive damage control analysis, considering both demand versus capacity ratios and specific architectural features like short columns and reduced stiffness on upper stories, provides a nuanced understanding of seismic vulnerability. This approach allows for a detailed examination of how structural and non-structural elements contribute to the overall seismic resilience of buildings on sloped terrains.
- Incorporation into Current Standards: There is a pressing need for current seismic design standards to include provisions that directly address the design of buildings located on slopes, ensuring that their dynamic response and the irregularity caused by asymmetry are considered in conventional design procedures. This inclusion would enhance the seismic safety and performance of such structures, acknowledging the unique challenges posed by sloped terrains.
In conclusion, this study contributes valuable insights into the seismic performance of reinforced concrete buildings on sloped terrains, emphasizing the critical role of asymmetry, structural ductility, and the application of dynamic nonlinear analyses in enhancing seismic design codes. The findings underscore the importance of integrating comprehensive dynamic analyses and conventional design practices with specific guidelines for sloped terrain construction to ensure the safety, durability, and resilience of structures in seismically active regions. In line with this, further studies are required on the response of buildings situated on slopes, including other structural typologies, materials, and configurations.
Author Contributions
Conceptualization, E.G.D.-S. and J.C.V.; Methodology, J.C.V.-Q., E.G.D.-S. and J.C.V.; Software, J.C.V.-Q.; Validation, E.G.D.-S. and J.C.V.; Formal analysis, J.C.V.-Q. and J.C.V.; Investigation, E.G.D.-S. and J.C.V.; Resources, J.C.V.-Q., E.G.D.-S. and J.C.V.; Data curation, J.C.V.-Q.; Writing—original draft, J.C.V.-Q., E.G.D.-S. and J.C.V.; Writing—review & editing, J.C.V.-Q., E.G.D.-S. and J.C.V.; Visualization, E.G.D.-S. and J.C.V.; Supervision, E.G.D.-S. and J.C.V.; Project administration, E.G.D.-S. and J.C.V.; Funding acquisition, E.G.D.-S. and J.C.V. All authors have read and agreed to the published version of the manuscript.
Funding
This research was funded by the Agencia Nacional de Investigación y Desarrollo (ANID Chile), grant number FOVI 210063. Council of the International Geoscience Program (UNESCO): Grant number 701: 2020-2022.
Data Availability Statement
The data from this research are available to interested parties upon request to the corresponding author.
Acknowledgments
The authors thank the Pontificia Universidad Católica de Valparaíso for the support provided in the development of the research, as well as the support in the publication of the article. The authors also acknowledge the support of the PUCV School of Civil Engineering in whose facilities the research activities that gave rise to this article have been carried out. The authors acknowledge accessing strong-motion data through the Center for Engineering Strong Motion Data (CESMD), last visited on 5 May 2023. The networks or agencies providing the data used in this report are the California Strong Motion Instrumentation Program (CSMIP) and the USGS National Strong Motion Project (NSMP).
Conflicts of Interest
The authors declare no conflicts of interest.
References
- Fotopoulou, S.D.; Pitilakis, K.D. Vulnerability Assessment of Reinforced Concrete Buildings at Precarious Slopes Subjected to Combined Ground Shaking and Earthquake Induced Landslide. Soil Dyn. Earthq. Eng. 2017, 93, 84–98. [Google Scholar] [CrossRef]
- Tripe, R.; Kontoe, S.; Wong, T.K.C. Slope Topography Effects on Ground Motion in the Presence of Deep Soil Layers. Soil Dyn. Earthq. Eng. 2013, 50, 72–84. [Google Scholar] [CrossRef]
- Bourdeau, C.; Havenith, H.-B. Site Effects Modelling Applied to the Slope Affected by the Suusamyr Earthquake (Kyrgyzstan, 1992). Eng. Geol. 2008, 97, 126–145. [Google Scholar] [CrossRef]
- Mohammad, Z.; Baqi, A.; Arif, M. Seismic Response of RC Framed Buildings Resting on Hill Slopes. Procedia Eng. 2017, 173, 1792–1799. [Google Scholar] [CrossRef]
- Zaidi, S.A.; Naqvi, T.; Ibrahim, S.M. Study on the Effects of Seismic Soil-Structure Interaction of Concrete Buildings Resting on Hill Slopes. Mater. Today Proc. 2021, 43, 2250–2254. [Google Scholar] [CrossRef]
- Fatahi, B.; Huang, B.; Yeganeh, N.; Terzaghi, S.; Banerjee, S. Three-Dimensional Simulation of Seismic Slope-Foundation-Structure Interaction for Buildings near Shallow Slopes. Int. J. Geomech. 2020, 20, 04019140. [Google Scholar] [CrossRef]
- Shabani, M.J.; Shamsi, M.; Ghanbari, A. Slope Topography Effect on the Seismic Response of Mid-Rise Buildings Considering Topography-Soil-Structure Interaction. Earthq. Struct. 2021, 20, 187–200. [Google Scholar] [CrossRef]
- Assimaki, D.; Kausel, E. Modified Topographic Amplification Factors for a Single-Faced Slope Due to Kinematic Soil-Structure Interaction. J. Geotech. Geoenviron. Eng. 2007, 133, 1414–1431. [Google Scholar] [CrossRef]
- Paolucci, R. Amplification of Earthquake Ground Motion by Steep Topographic Irregularities. Earthq. Engng. Struct. Dyn. 2002, 31, 1831–1853. [Google Scholar] [CrossRef]
- Schmitz, M.; Hernández, J.J.; Rocabado, V.; Domínguez, J.; Morales, C.; Valleé, M.; García, K.; Sánchez-Rojas, J.; Singer, A.; Oropeza, J.; et al. The Caracas, Venezuela, Seismic Microzoning Project: Methodology, Results, and Implementation for Seismic Risk Reduction. Prog. Disaster Sci. 2020, 5, 100060. [Google Scholar] [CrossRef]
- Patel, M.U.F. A Performance Study and Seismic Evaluation of RC Frame Buildings on Sloping Ground. IOSR J. Mech. Civ. Eng. (IOSR-JMCE) 2018, 2014, 51–58. [Google Scholar] [CrossRef]
- Vijayanarayanan, A.R.; Goswami, R. Floor Acceleration Spectrum for RC Moment Frame Buildings on Slopes. In Proceedings of the 17th World Conference on Earthquake Engineering, 17WCEE, Sendai, Japan, 13–18 September 2020. [Google Scholar]
- Lang, D.; Singh, Y.; Molina, S.; Surana, M. Peculiarities of Seismic Risk in Hilly Regions: Topographic Effects on Hazard and Vulnerability. In Progresses in European Earthquake Engineering and Seismology; Vacareanu, R., Ionescu, C., Eds.; Springer Proceedings in Earth and Environmental Sciences; Springer International Publishing: Cham, Switzerland, 2022; pp. 295–307. ISBN 978-3-031-15103-3. [Google Scholar]
- Standards New Zealand. Structural Design Actions. Part 5, Earthquake Actions: New Zealand: Commentary; Standards New Zealand: Wellington, New Zealand, 2004; ISBN 978-1-86975-019-0.
- Athanasopoulou, A.; Fardis, M.; Pinto, P.; Aucun, B.; Tsionis, G.; Somja, H.; Plumier, A.; Pecker, A.; Franchin, P.; Carvalho, E.; et al. Eurocode 8: Seismic Design of Buildings—Worked Examples; Publications Office: Luxembourg, 2012; ISBN 978-92-79-23068-4. [Google Scholar]
- International Code Council. 2018 IBC: International Building Code; International Code Council, Inc.: Country Club Hills, IL, USA, 2017; ISBN 978-1-60983-735-8. [Google Scholar]
- Shabani, M.J.; Ghanbari, A. Comparison of Seismic Behavior of Steel Building Adjacent to Slope Topography by Considering Fixed-Base, SSI and TSSI. Asian J. Civ. Eng. 2020, 21, 1151–1169. [Google Scholar] [CrossRef]
- Aggarwal, Y.; Saha, S.K. Seismic Performance Assessment of Reinforced Concrete Hilly Buildings with Open Story. Structures 2021, 34, 224–238. [Google Scholar] [CrossRef]
- Bhasker, R.; Menon, A. Torsional Irregularity Indices for the Seismic Demand Assessment of RC Moment Resisting Frame Buildings. Structures 2020, 26, 888–900. [Google Scholar] [CrossRef]
- Raychowdhury, P.; Ray-Chaudhuri, S. Seismic Response of Nonstructural Components Supported by a 4-Story SMRF: Effect of Nonlinear Soil-Structure Interaction. Structures 2015, 3, 200–210. [Google Scholar] [CrossRef]
- Foti, D. Local Ground Effects in Near-Field and Far-Field Areas on Seismically Protected Buildings. Soil Dyn. Earthq. Eng. 2015, 74, 14–24. [Google Scholar] [CrossRef]
- Hasan, M.; Serker, N.H.M.K. Seismic Analysis of RC Buildings Resting on Sloping Ground with Varying Hill Slopes. In Proceedings of the International Conference on Planning, Architecture and Civil Engineering, Rajshahi, Bangladesh, 7–9 February 2019. [Google Scholar]
- Chhetri, S.; Adhikari, S. Seismic Performance of Step Back, Step Back Set Back and Set Back Buildings in Sloping Ground Base. Struct. Mech. Eng. Constr. Build. 2021, 17, 538–547. [Google Scholar] [CrossRef]
- Alitalesh, M.; Shahnazari, H.; Baziar, M.H. Parametric Study on Seismic Topography–Soil–Structure Interaction; Topographic Effect. Geotech. Geol. Eng. 2018, 36, 2649–2666. [Google Scholar] [CrossRef]
- Amendola, C.; Pitilakis, D. Urban Scale Risk Assessment Including SSI and Site Amplification. Bull. Earthq. Eng. 2022, 50, 133–141. [Google Scholar] [CrossRef]
- Daniel, J.; Sivakamasundari, S. Seismic Behaviour of Stiffness Irregular Building on Hill Slope. Int. J. Aerosp. Lightweight Struct. 2014, 4, 281–300. [Google Scholar]
- Jamle, S. Response of Multistory Building Located on 20 Degree and 30 Degree Sloping Ground under Seismic Loading. Int. Res. J. Eng. Technol. 2020, 6, 1178252. [Google Scholar] [CrossRef]
- Song, P.; Guo, S.; Zhao, W.; Xin, Q. Seismic Response Analysis of Reinforced Concrete Frame Structures Considering Slope Effects. Appl. Sci. 2023, 13, 5149. [Google Scholar] [CrossRef]
- Priyanshu, K.; Kumar, V. Seismic Response of Special Moment Resisting Frames Constructed on Plain and Sloping Ground. IOP Conf. Ser. Earth Environ. Sci. 2023, 1110, 012068. [Google Scholar] [CrossRef]
- American Society of Civil Engineers. Seismic Evaluation and Retrofit of Existing Buildings, 41st ed.; American Society of Civil Engineers: Reston, VA, USA, 2017; ISBN 978-0-7844-1485-9. [Google Scholar]
- Razi, M.A.; Mohammad, Z.; Ali, S.A. Seismic Analysis of Hill Buildings. In Proceedings of the International Conference on Advances in Construction Materials and Structures (ACMS-2018), Uttarakhand, India, 7–8 March 2018. [Google Scholar]
- Fan, Z.; Liu, T.; Yang, S. Analysis on Performances of Frame Structures on Sloping Ground. Build. Struct. 2016, 46, 1–9. [Google Scholar]
- Ghosh, R.; Debbarma, R. Effect of Slope Angle Variation on the Structures Resting on Hilly Region Considering Soil–Structure Interaction. Int. J. Adv. Struct. Eng. 2019, 11, 67–77. [Google Scholar] [CrossRef]
- Jarapala, R.; Menon, A. Seismic Performance of Reinforced Concrete Buildings on Hill Slopes: A Review. J. Inst. Eng. India Ser. A 2023, 104, 721–745. [Google Scholar] [CrossRef]
- Farghaly, A.A. Evaluation of Seismic Performance of Buildings Constructed on Hillside Slope of Doronka Village-Egypt. ISRN Civ. Eng. 2014, 2014, 940923. [Google Scholar] [CrossRef]
- Ganie, M.A.; Gupta, S. Seismic Behavior of Short Columns of an RC-Frame on Plane and Sloping Ground: Review. In Proceedings of the 2018 5th International Conference on “Computing for Sustainable Global Development”, New Delhi, India, 14–16 March 2018. [Google Scholar]
- Singh, A.; Tolani, S.; Bharti, S.D.; Datta, T.K. Seismic Analysis of Flat Slab Buildings on Hilly Ground. ASPS Conf. Proc. 2022, 1, 775–779. [Google Scholar] [CrossRef]
- Aggarwal, Y.; Saha, S.K. An Improved Rapid Visual Screening Method for Seismic Vulnerability Assessment of Reinforced Concrete Buildings in Indian Himalayan Region. Bull. Earthq. Eng. 2023, 21, 319–347. [Google Scholar] [CrossRef]
- Gómez, M.A.; Díaz-Segura, E.G.; Vielma, J.C. Nonlinear Numerical Assessment of the Seismic Response of Hillside RC Buildings. Earthq. Eng. Eng. Vib. 2021, 20, 423–440. [Google Scholar] [CrossRef]
- Gómez, M.A.; Vielma, J.C.; Díaz-Segura, E.G. Evaluación numérica de la respuesta sísmica de estructuras fundadas en laderas. Obras Y Proy. 2022, 31, 68–76. [Google Scholar] [CrossRef]
- Patil, R.T.; Raghunandan, M. Seismic Collapse Risk of Reinforced Concrete Hillside Buildings in Indian Himalayan Belt. Bull Earthq. Eng 2021, 19, 5665–5689. [Google Scholar] [CrossRef]
- National Institute of Standardization. Diseño Sísmico de Edificios Nch 433; National Institute of Standardization: Santiago, Chile, 2009. (In Spanish) [Google Scholar]
- CEN. Eurocode 8: Design of Structures for Earthquake Resistance; European Committee for Standardization: Brussels, Belgium, 2005. [Google Scholar]
- ASCE. Minimum Design Loads and Associated Criteria for Buildings and Other Structures: ASCE/SEI 7-22; ASCE, American Society of Civil Engineer (Reston, Virginia), Ed.; American Society of Civil Engineers: Reston, VA, USA, 2022; ISBN 978-0-7844-1578-8. [Google Scholar]
- Cook, D.; Sen, A.; Liel, A.; Basnet, T.; Creagh, A.; Koodiani, H.K.; Berkowitz, R.; Ghannoum, W.; Hortacsu, A.; Kim, I.; et al. ASCE/SEI 41 Assessment of Reinforced Concrete Buildings: Benchmarking Nonlinear Dynamic Procedures with Empirical Damage Observations. Earthq. Spectra 2023, 39, 1721–1754. [Google Scholar] [CrossRef]
- Vielma-Quintero, J.C.; Carvallo, J.; Vielma, J.C. Comparative Assessment of Performance-Based Design Methodologies Applied to a R.C. Shear-Wall Building. Buildings 2023, 13, 1492. [Google Scholar] [CrossRef]
- Bhasker, R.; Menon, A. Characterization of Ground Motion Intensity for the Seismic Fragility Assessment of Plan-Irregular RC Buildings. Structures 2020, 27, 1763. [Google Scholar] [CrossRef]
- Mander, J.B.; Priestley, M.J.N.; Park, R. Theoretical Stress-Strain Model for Confined Concrete. J. Struct. Eng. 1998, 114, 1804–1826. [Google Scholar] [CrossRef]
- Menegotto, M.; Pinto, M. Method of Analysis for Cyclically Loaded, R.C. Plane Frames Including Changes in Geometry and Nonelastic Behavior of Elements under Combined Normal Force and Bending; ETH Zürich: Zurich, Switzerland, 1973; pp. 15–22. [Google Scholar]
- Vielma-Perez, J.; Mulder, M. Improved Procedure for Determining the Ductility of Buildings under Seismic Loads. RIMNI 2018, 34, 1–27. [Google Scholar] [CrossRef]
- Hosseinpour, F.; Abdelnaby, A.E. Effect of Different Aspects of Multiple Earthquakes on the Nonlinear Behavior of RC Structures. Soil Dyn. Earthq. Eng. 2017, 92, 706–725. [Google Scholar] [CrossRef]
- Center for Engineering Strong Motion Data (CESMD). 2023. Available online: https://www.strongmotioncenter.org/index.html (accessed on 5 May 2023).
- Seismosoft Ltd. SeismoSpect. A Computer Program for Post-Processing of Groups of Earthquake Records. Pavia, Italy. 2021. Available online: https://seismosoft.com/ (accessed on 1 February 2021).
- Seismosoft Ltd. SeismoMatch. A Computer Program for Spectrum Matching of Earthquake Records. Pavia, Italy. 2021. Available online: https://seismosoft.com/ (accessed on 1 February 2021).
- Seismosoft Ltd. SeismoStruct 2021 User Manual—A Computer Program for Static and Dynamic Nonlinear Analysis of Framed Structures. Pavia, Italy. 2021. Available online: https://seismosoft.com/ (accessed on 1 February 2021).
- Seismosoft Ltd. SeismoBuild. A Computer Program for Seismic Assessment of Reinforced Concrete Framed Structures. Pavia, Italy. 2021. Available online: https://seismosoft.com/ (accessed on 1 February 2021).
- Khanal, B.; Chaulagain, H. Seismic Elastic Performance of L-Shaped Building Frames through Plan Irregularities. Structures 2020, 27, 22–36. [Google Scholar] [CrossRef]
- Vielma, J.C.; Porcu, M.C.; López, N. Intensity Measure Based on a Smooth Inelastic Peak Period for a More Effective Incremental Dynamic Analysis. Appl. Sci. 2020, 10, 8632. [Google Scholar] [CrossRef]
- Vielma, J.; Barbat, A.H.; Oller, S. Seismic Performance of Waffled-Slab Floor Buildings. Proc. Inst. Civ. Eng.—Struct. Build. 2009, 162, 169–182. [Google Scholar] [CrossRef]
- Vielma, J.C.; Barbat, A.H.; Oller, S. Seismic Safety of Low Ductility Structures Used in Spain. Bull Earthq. Eng 2010, 8, 135–155. [Google Scholar] [CrossRef]
- Uva, G.; Porco, F.; Fiore, A.; Ruggieri, S. Effects in Conventional Nonlinear Static Analysis: Evaluation of Control Node Position. Structures 2018, 13, 178–192. [Google Scholar] [CrossRef]
- De Stefano, M.; Mariani, V. Pushover Analysis for Plan Irregular Building Structures. Geotech. Geol. Earthq. Eng. 2014, 34, 429–448. [Google Scholar] [CrossRef]
- La Brusco, A.; Mariani, V.; Tanganelli, M.; Viti, S.; De Stefano, M. Seismic Assessment of a Real RC Asymmetric Hospital Building According to NTC 2008 Analysis Methods. Bull. Earthq. Eng. 2015, 13, 2973–2994. [Google Scholar] [CrossRef]
- Rezazadeh, H.; Amini, F.; Afshar, M.A. Effect of Inertia Nonlinearity on Dynamic Response of an Asymmetric Building Equipped with Tuned Mass Dampers. Earthq. Eng. Eng. Vib. 2020, 19, 499–513. [Google Scholar] [CrossRef]
- Kewalramani, M.A.; Syed, Z.I. Seismic Analysis of Torsional Irregularity in Multi-Storey Symmetric and Asymmetric Buildings. Eurasian J. Anal. Chem. 2018, 13, 286–292. [Google Scholar]
- Zavala, D.J.; Torres, C.J.; Moreno, J.D. Influence of the P-Delta Effect and Stiffness Irregularity on the Structural Behavior of Reinforced Concrete Buildings. J. Phys. Conf. Ser. 2022, 2287, 012047. [Google Scholar] [CrossRef]
Disclaimer/Publisher’s Note: The statements, opinions and data contained in all publications are solely those of the individual author(s) and contributor(s) and not of MDPI and/or the editor(s). MDPI and/or the editor(s) disclaim responsibility for any injury to people or property resulting from any ideas, methods, instructions or products referred to in the content. |
© 2024 by the authors. Licensee MDPI, Basel, Switzerland. This article is an open access article distributed under the terms and conditions of the Creative Commons Attribution (CC BY) license (https://creativecommons.org/licenses/by/4.0/).