
Detection of the Compromising Audio Signal by Analyzing Its AM Demodulated Spectrum

 ,
,  , , , and
Abstract
1. Introduction
2. Related Works
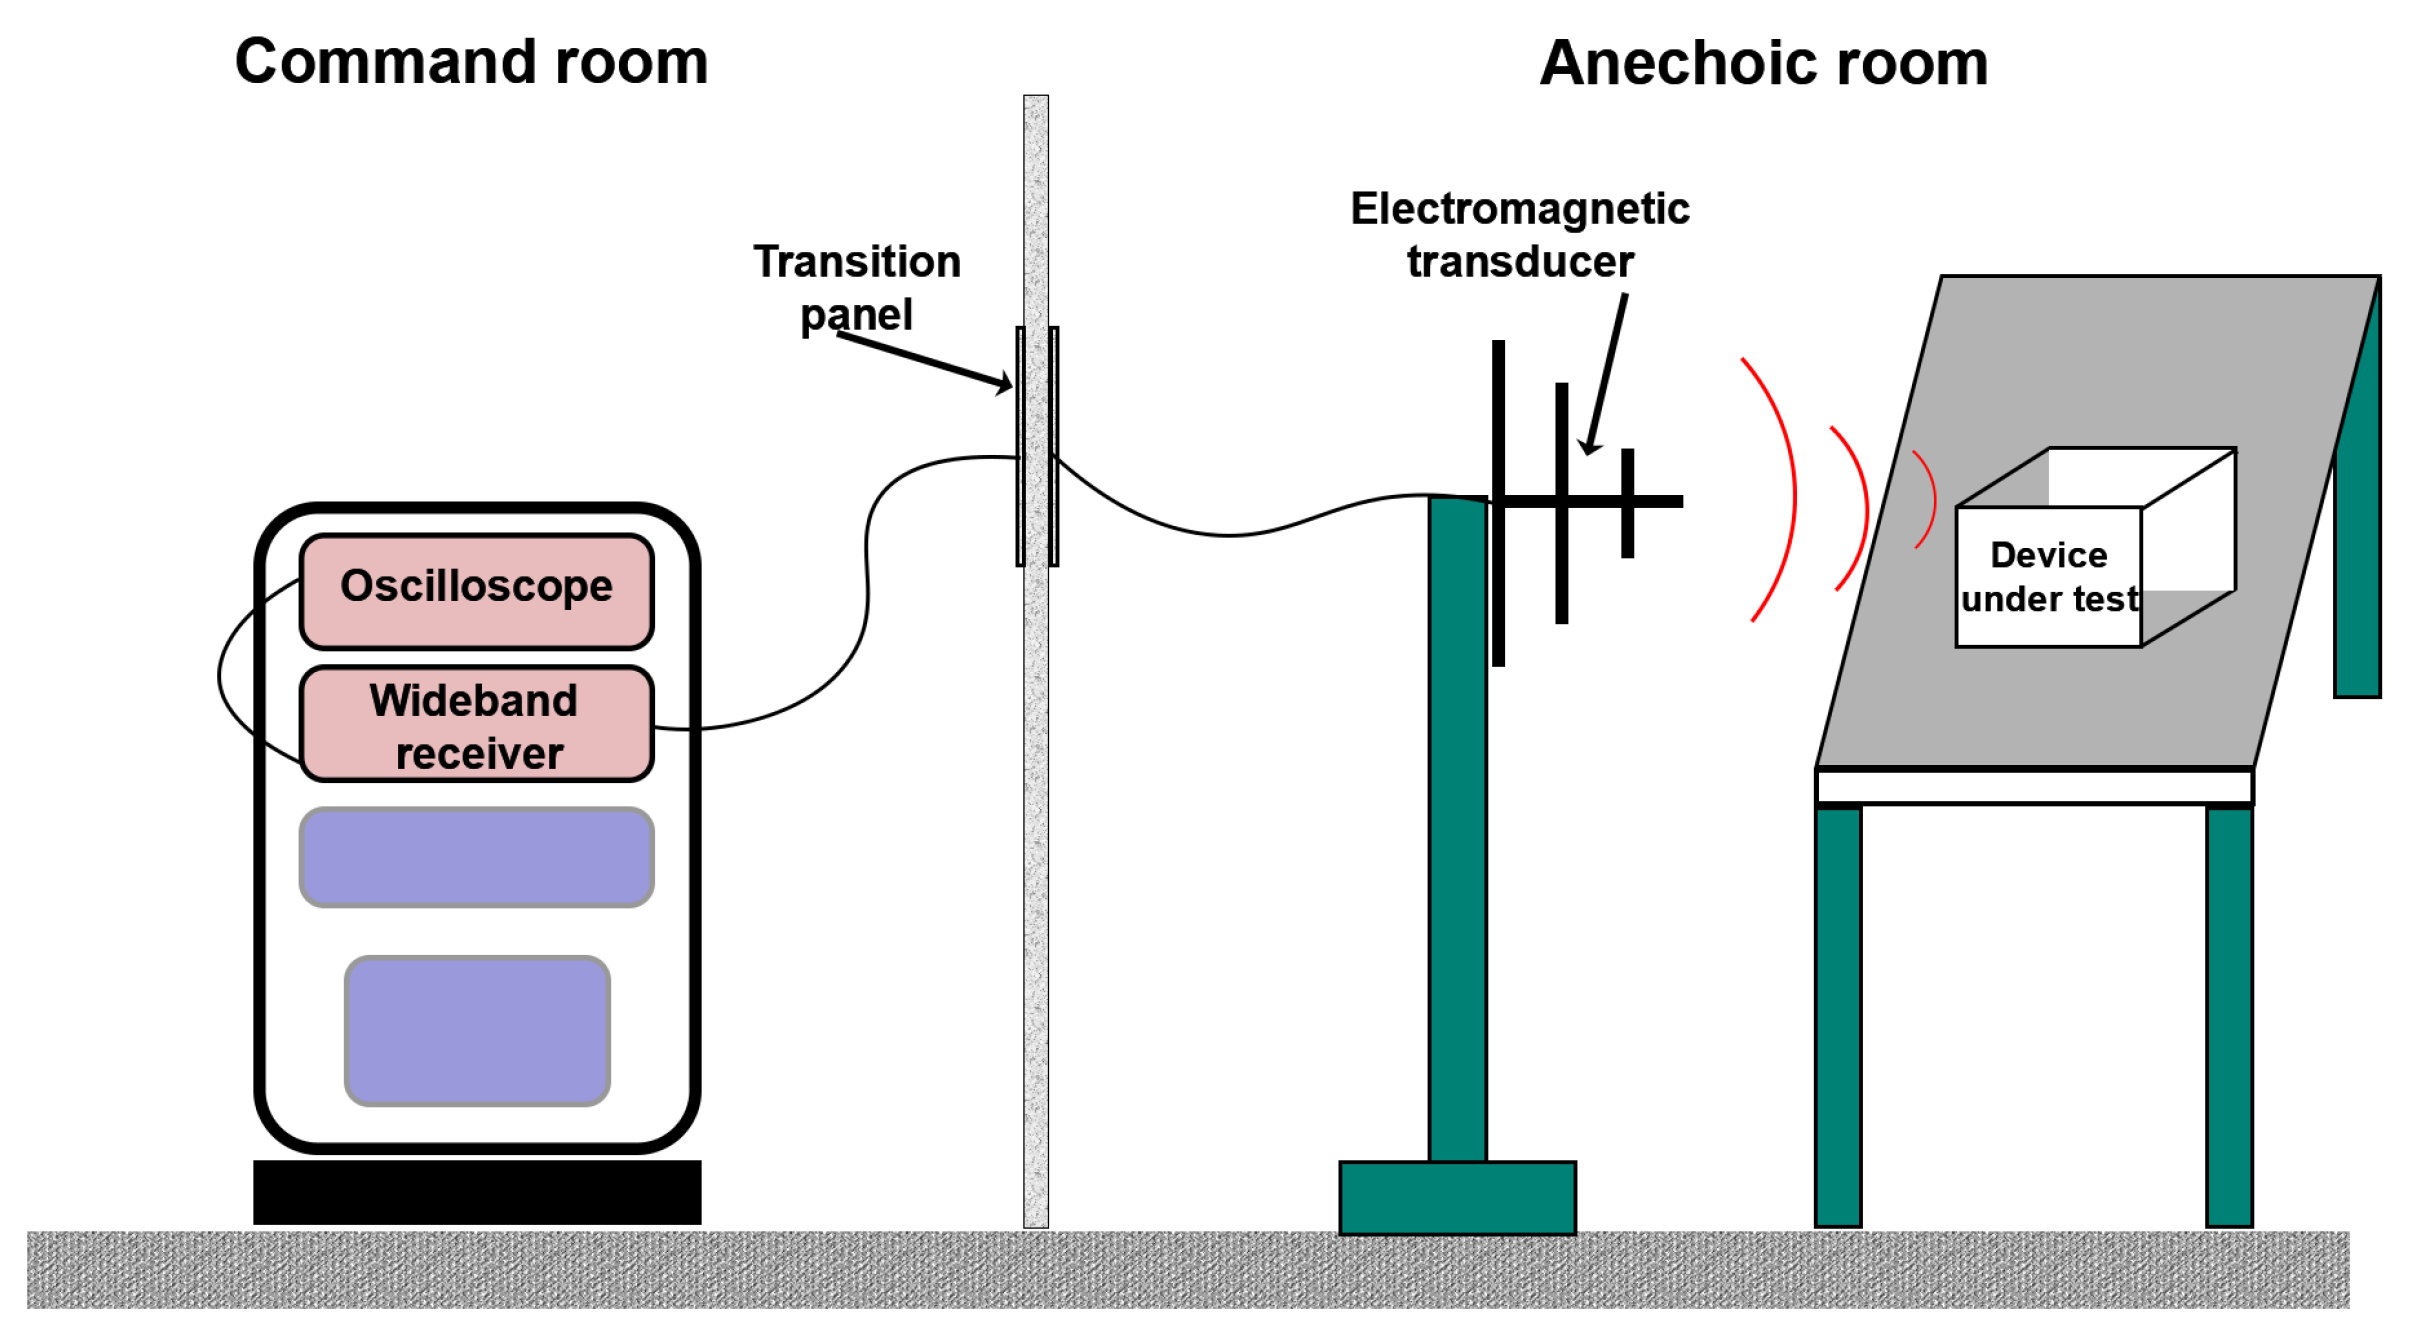
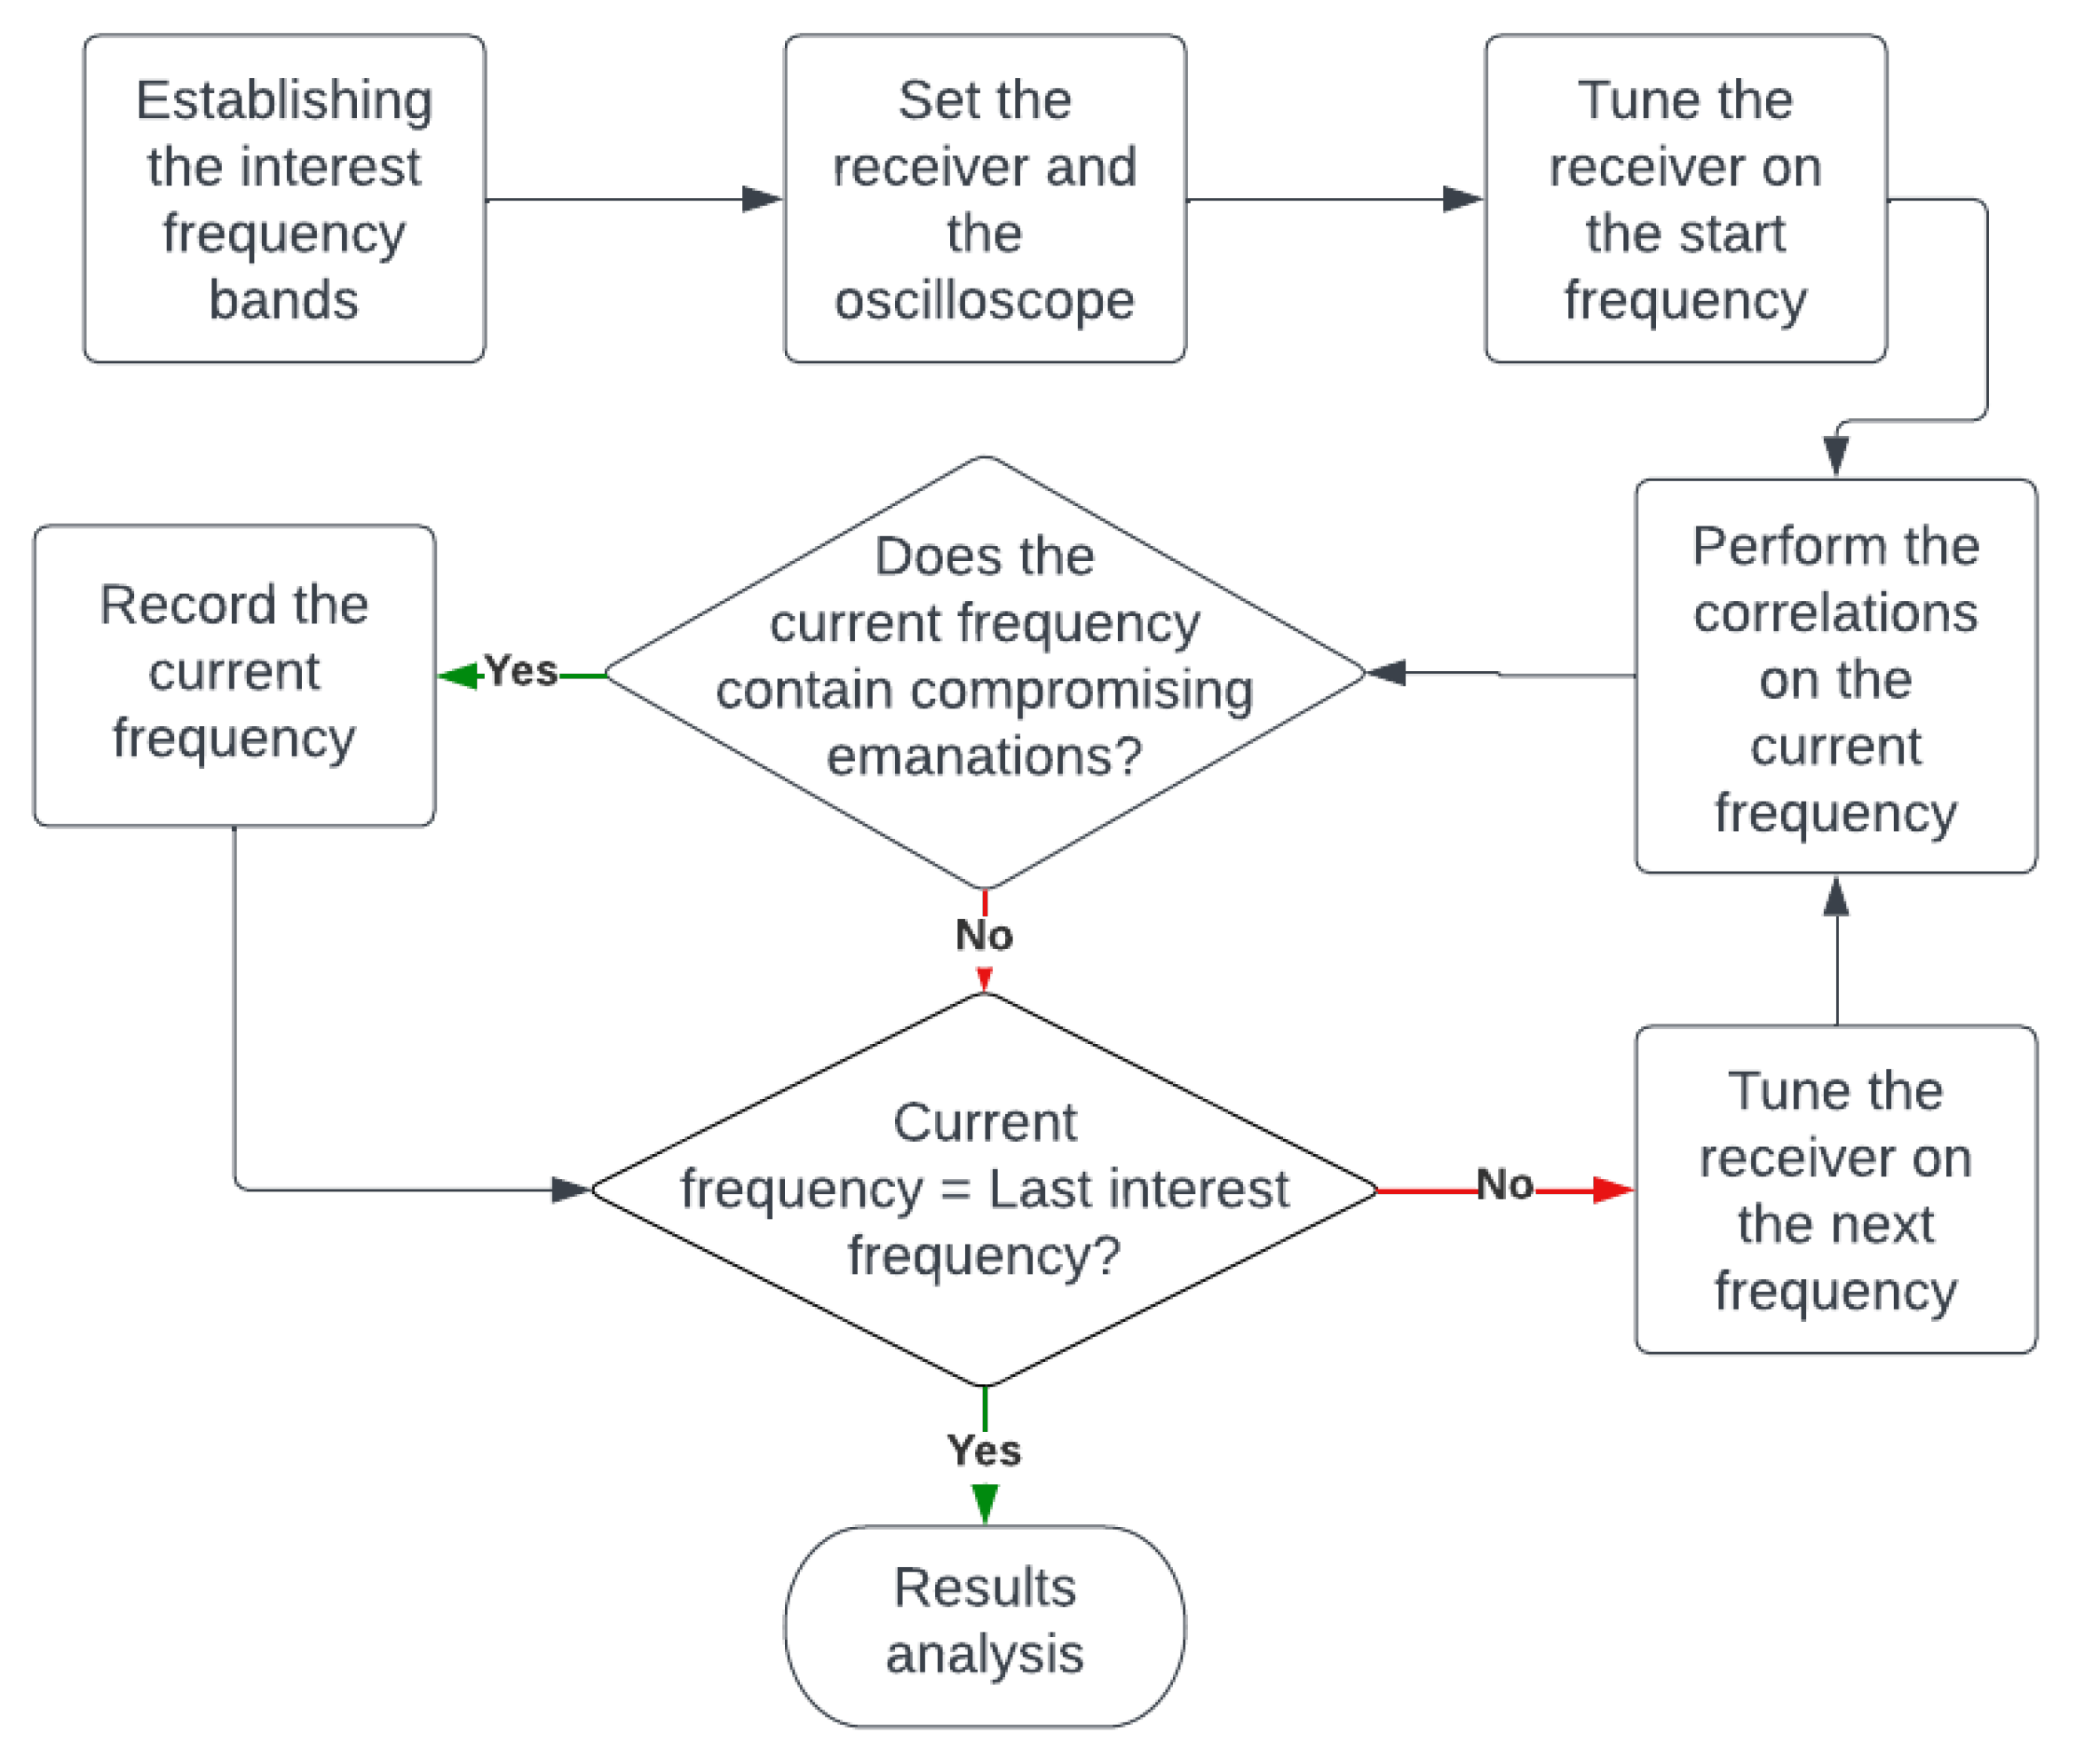
3. Actual Detection Process
4. Detection and Analysis of Compromised Audio Signal: Traditional and Novel Approaches
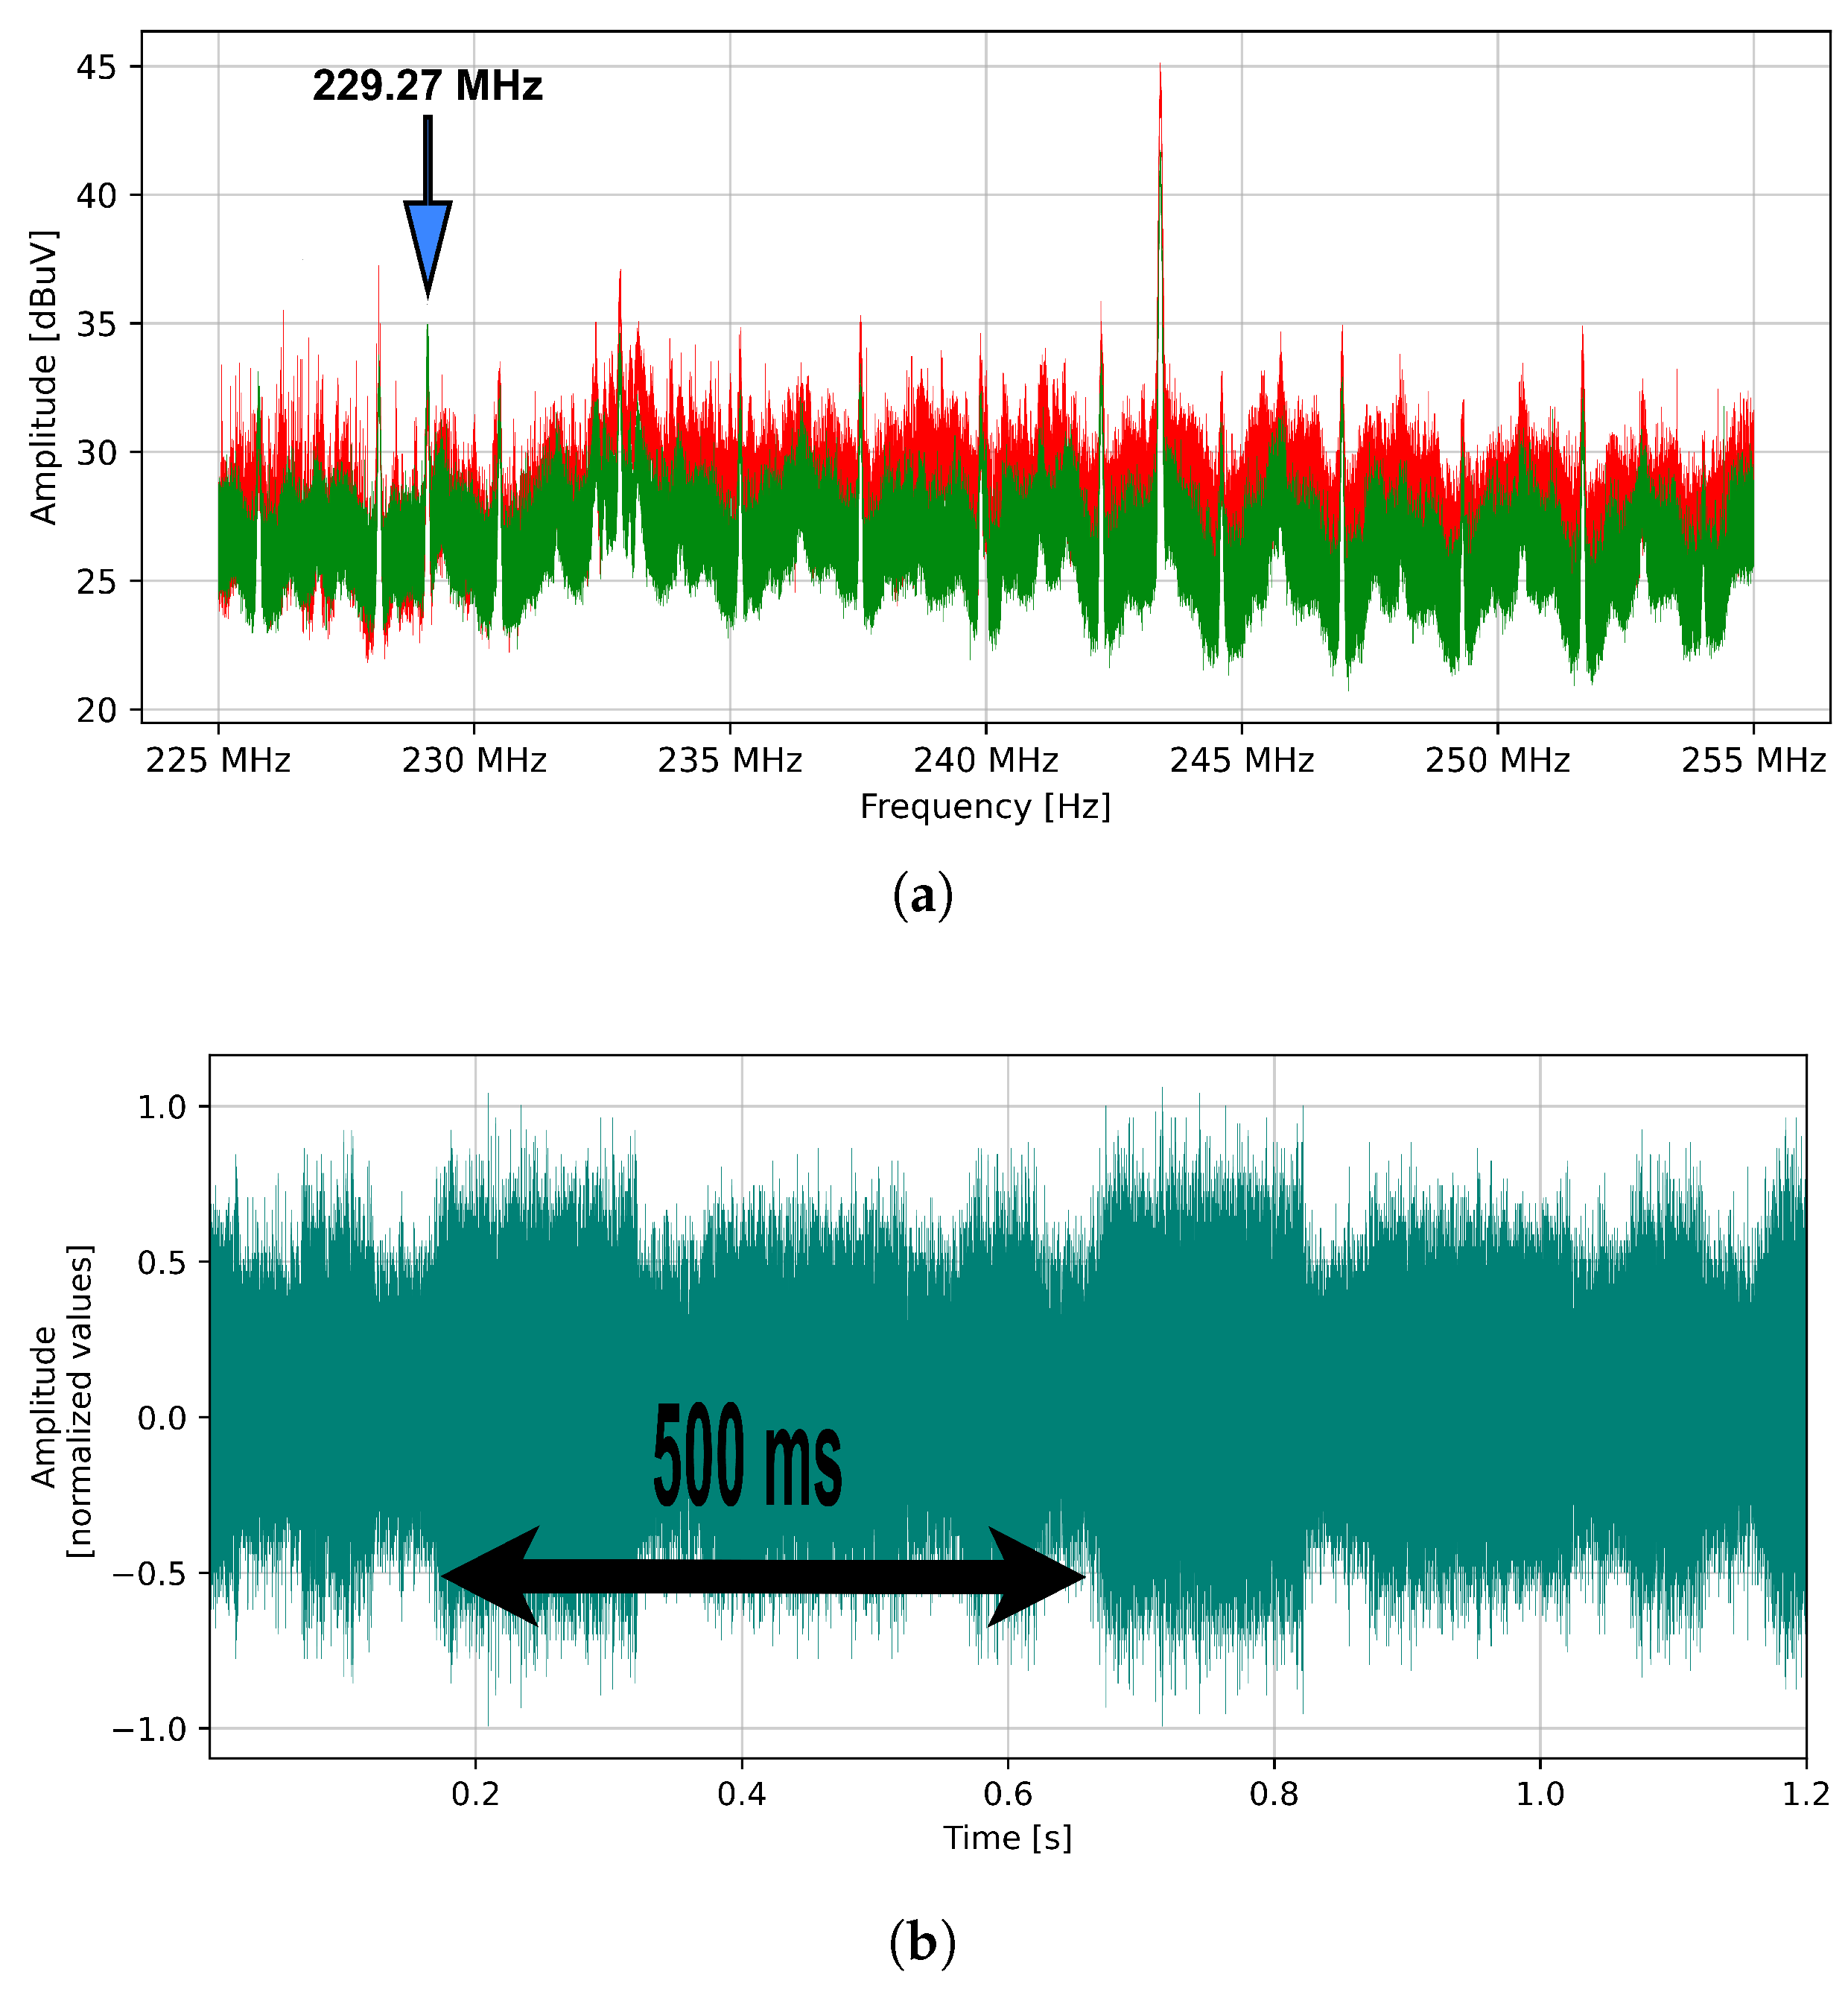
4.1. Audio Signal Analysis via Oscilloscope Employing Receiver’s IF Output
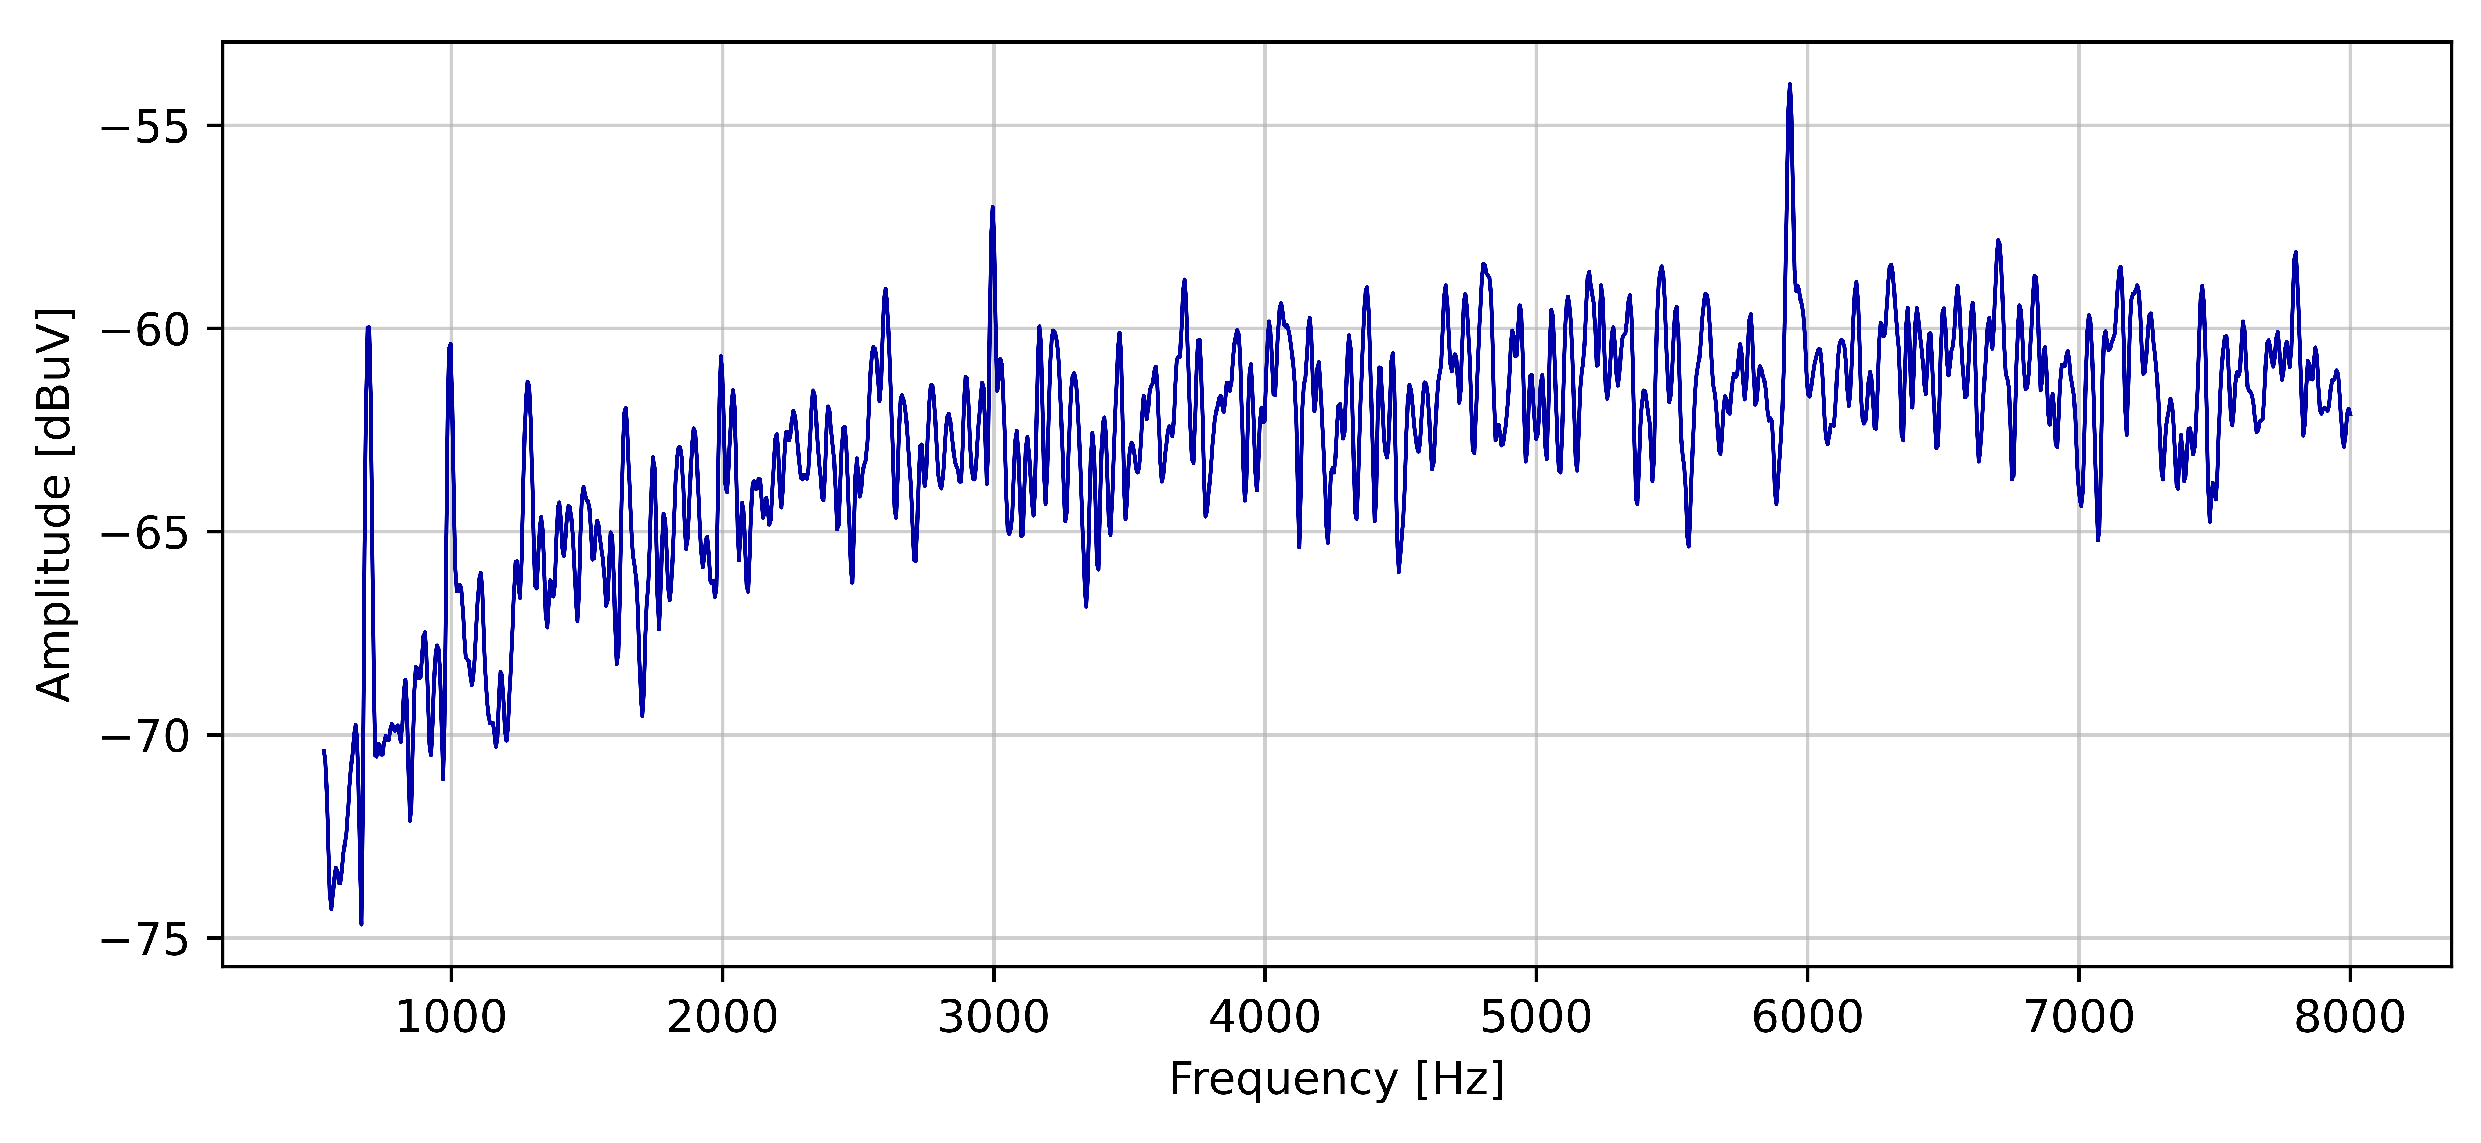
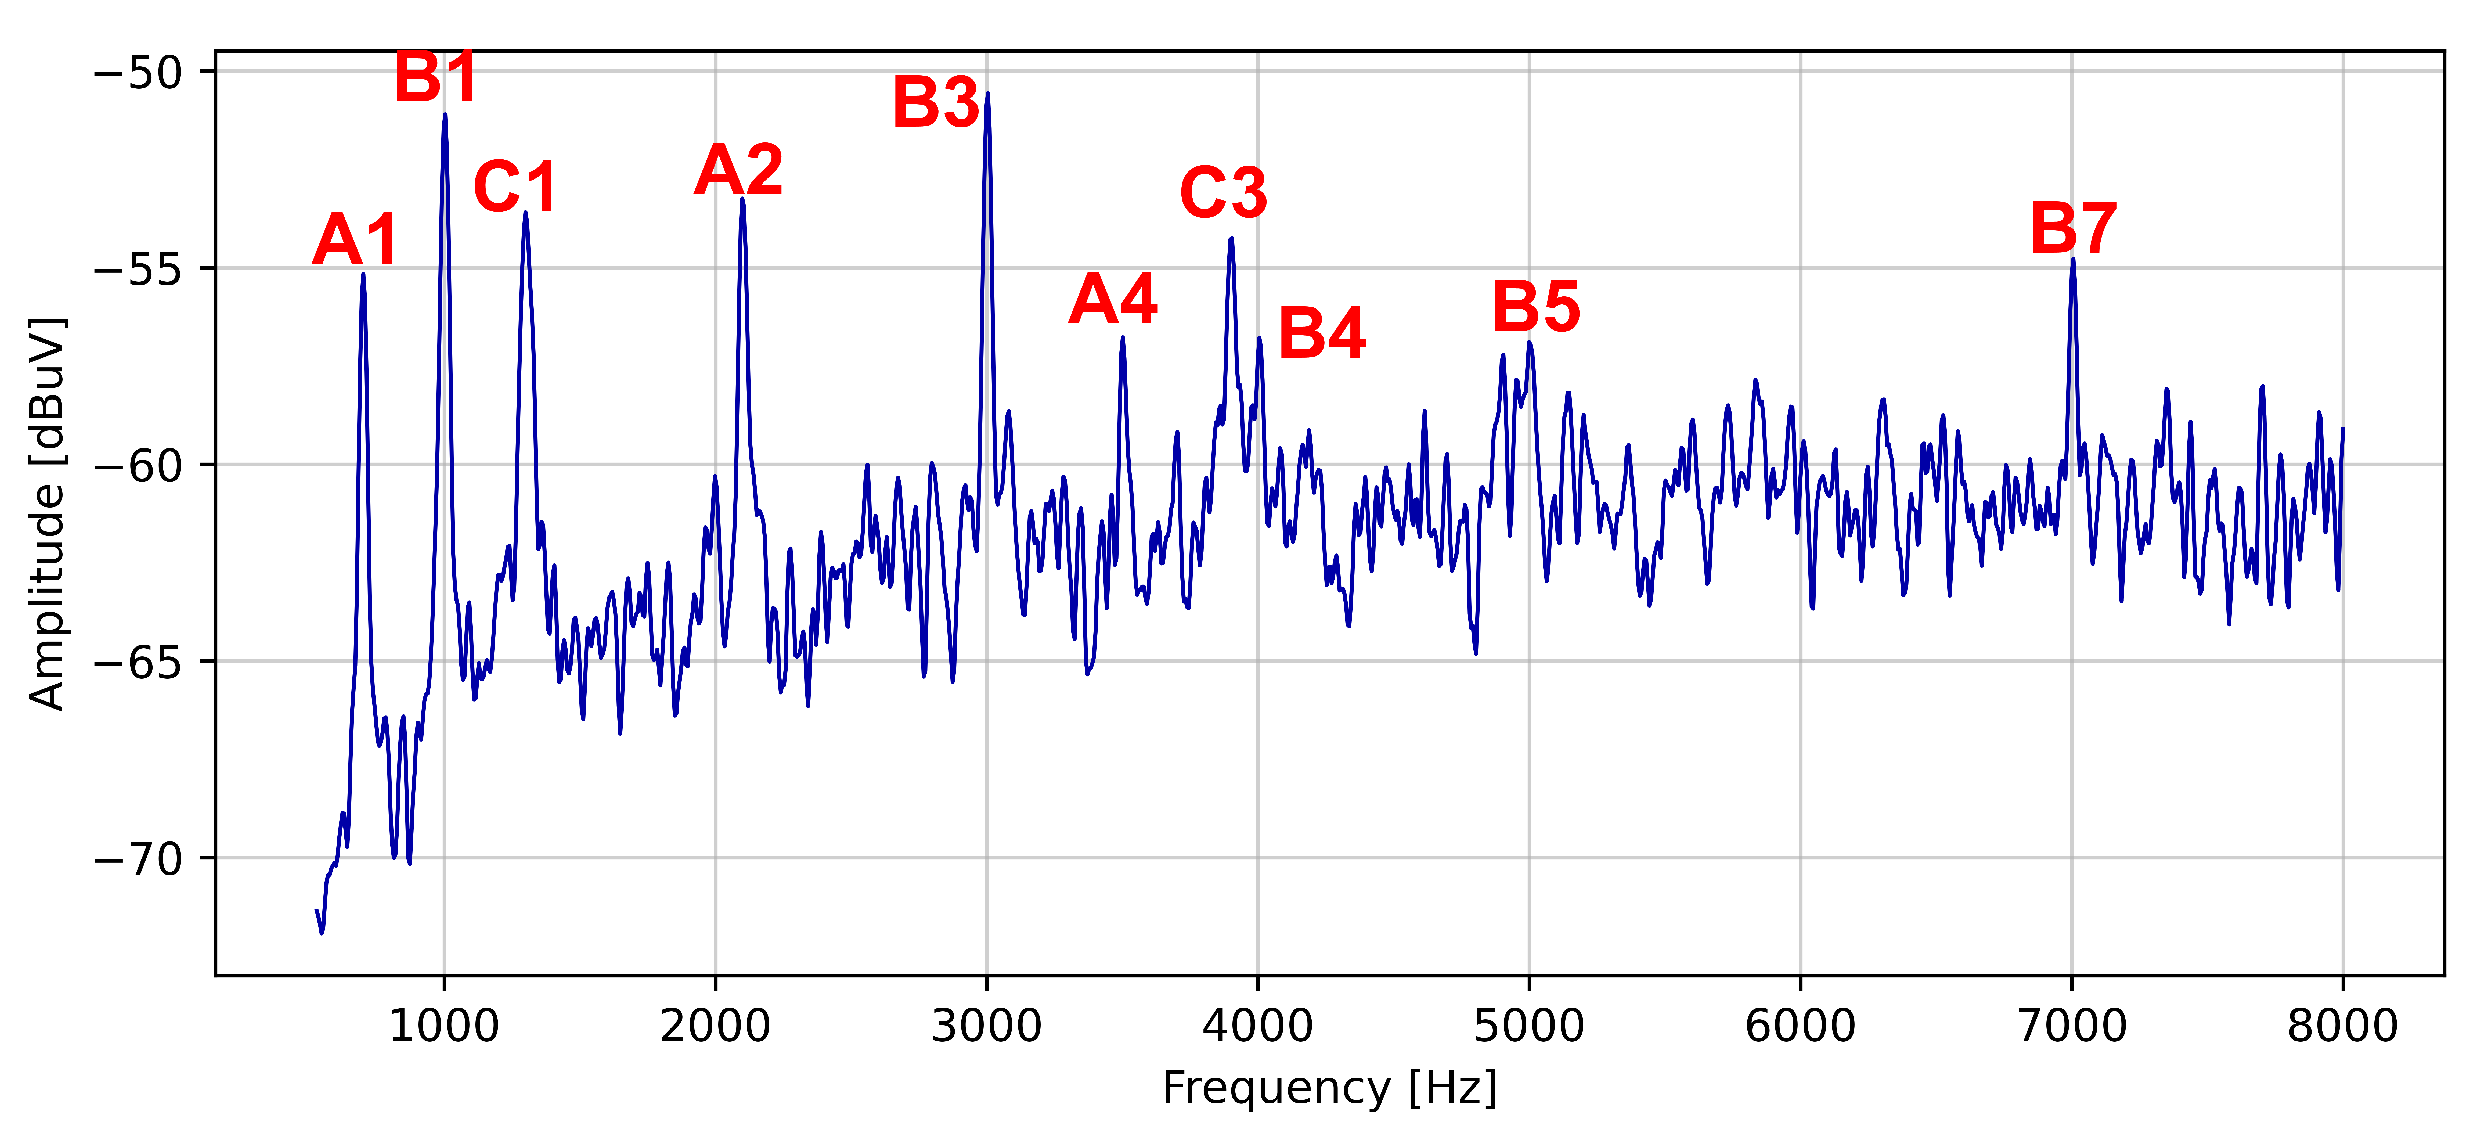
4.2. The Novel Approach: Detection of Compromised Audio Signal through Spectrum Analysis of AM Demodulated Signal
5. Reduction of Test Message Duration—Reduction of Correlation Time: New Approach Performance Evaluation
5.1. Improvement of the Test Patterns
5.2. Evaluation the Novel Approach Effectiveness: A Performance Analysis
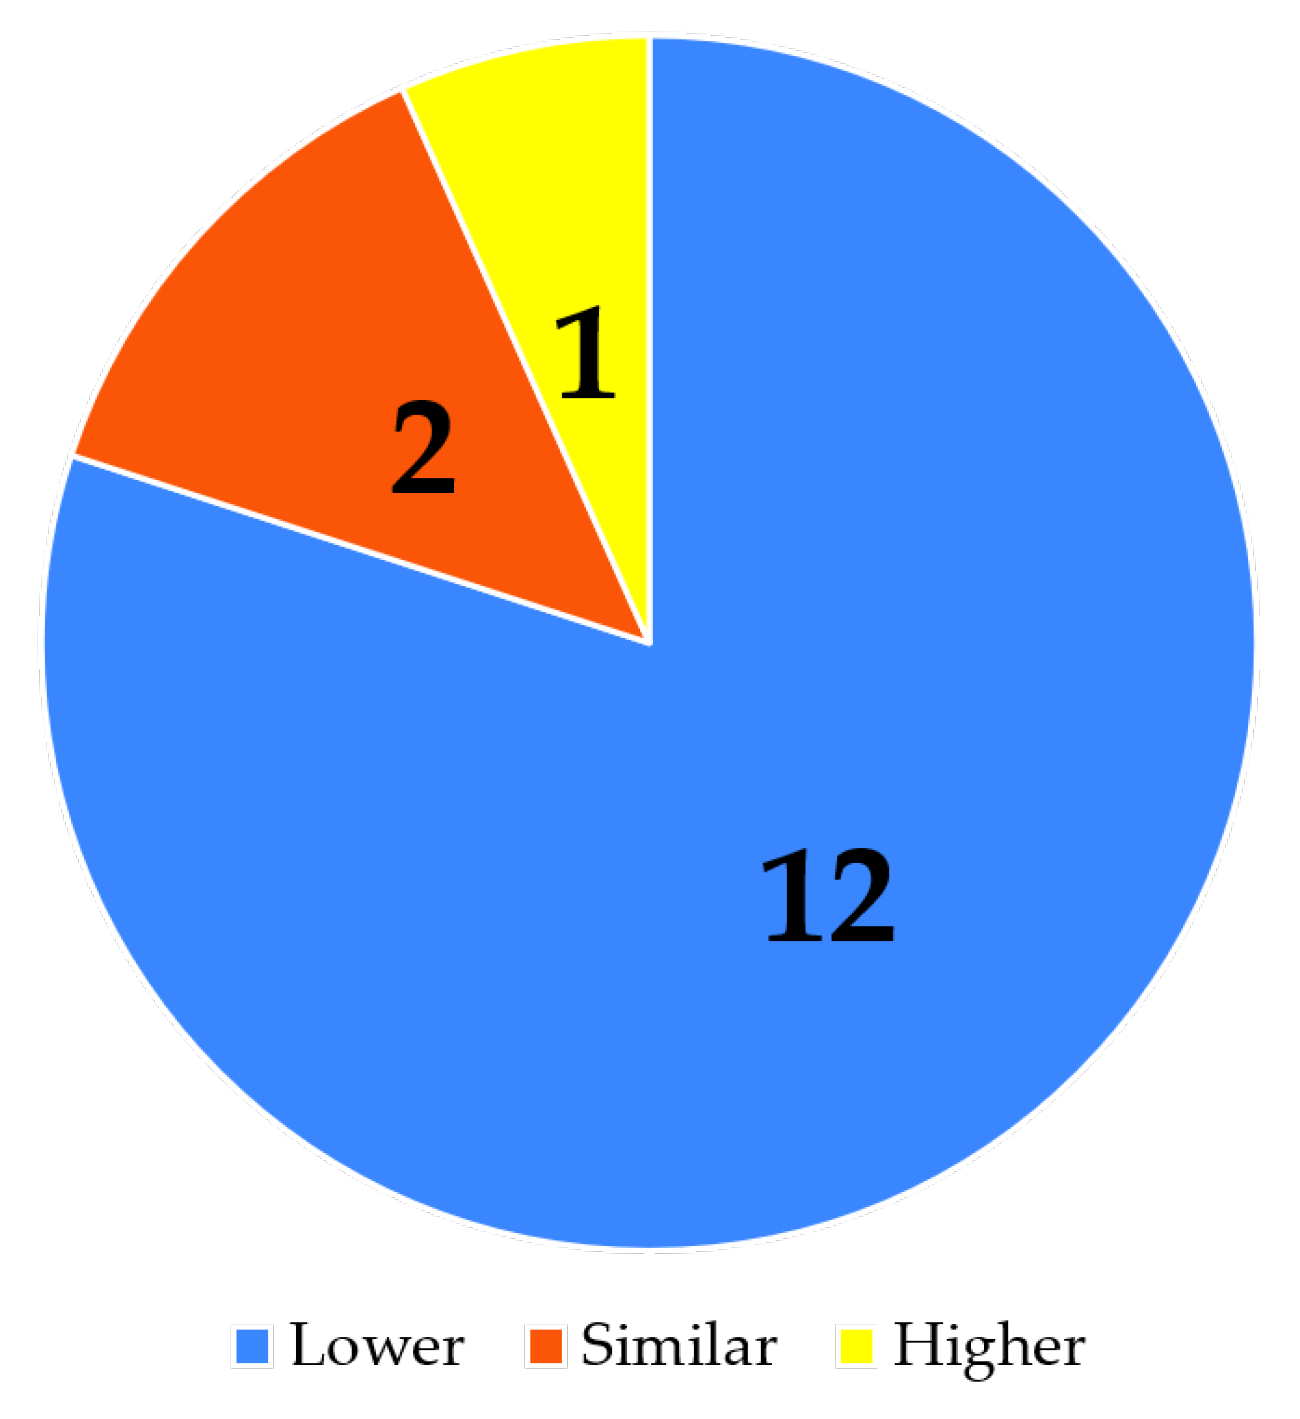
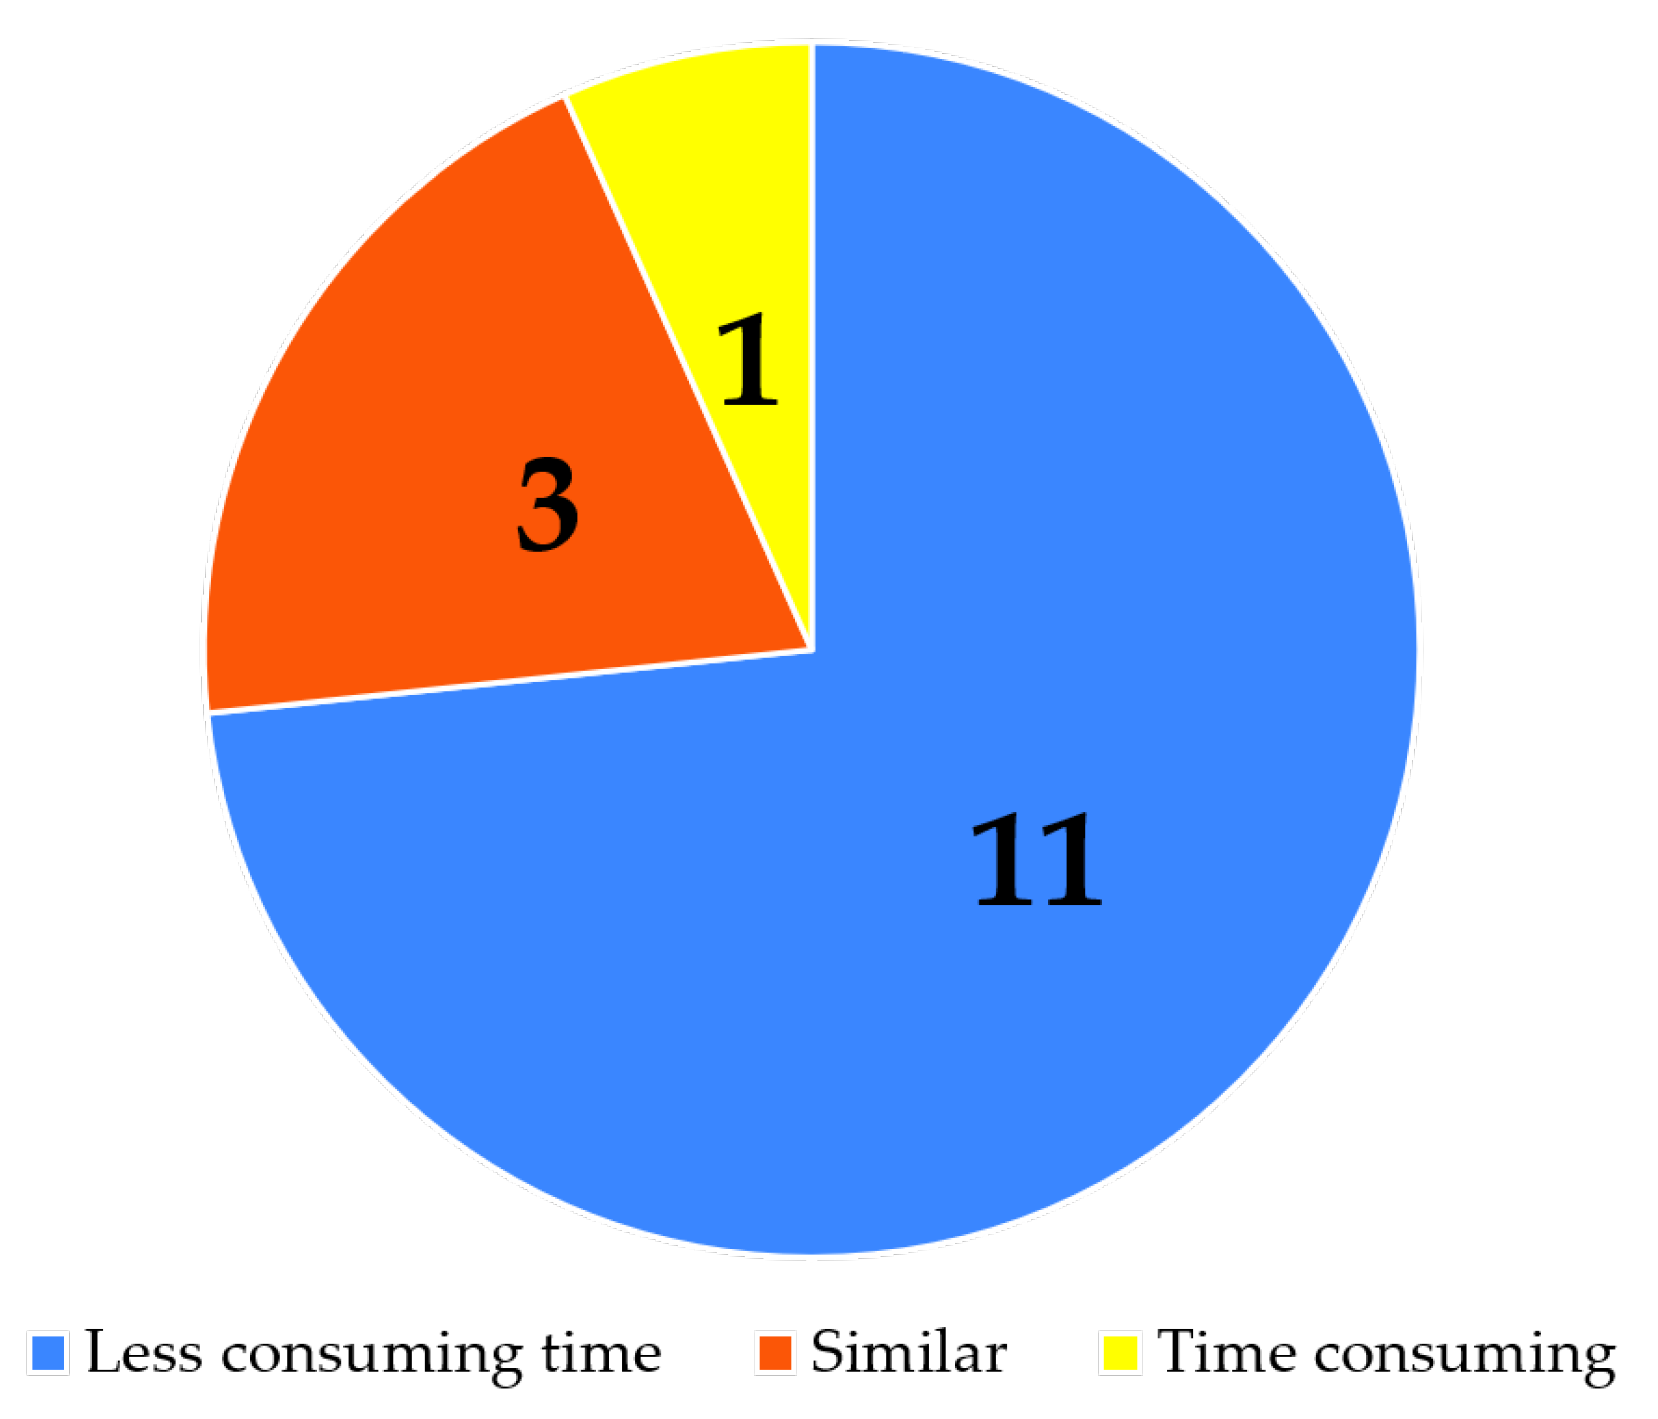
- How do you assess the time consumption of the proposed method in comparison to the previously used one?
- How do you evaluate the exhaustion level generated by the proposed method compared to the previously used one?
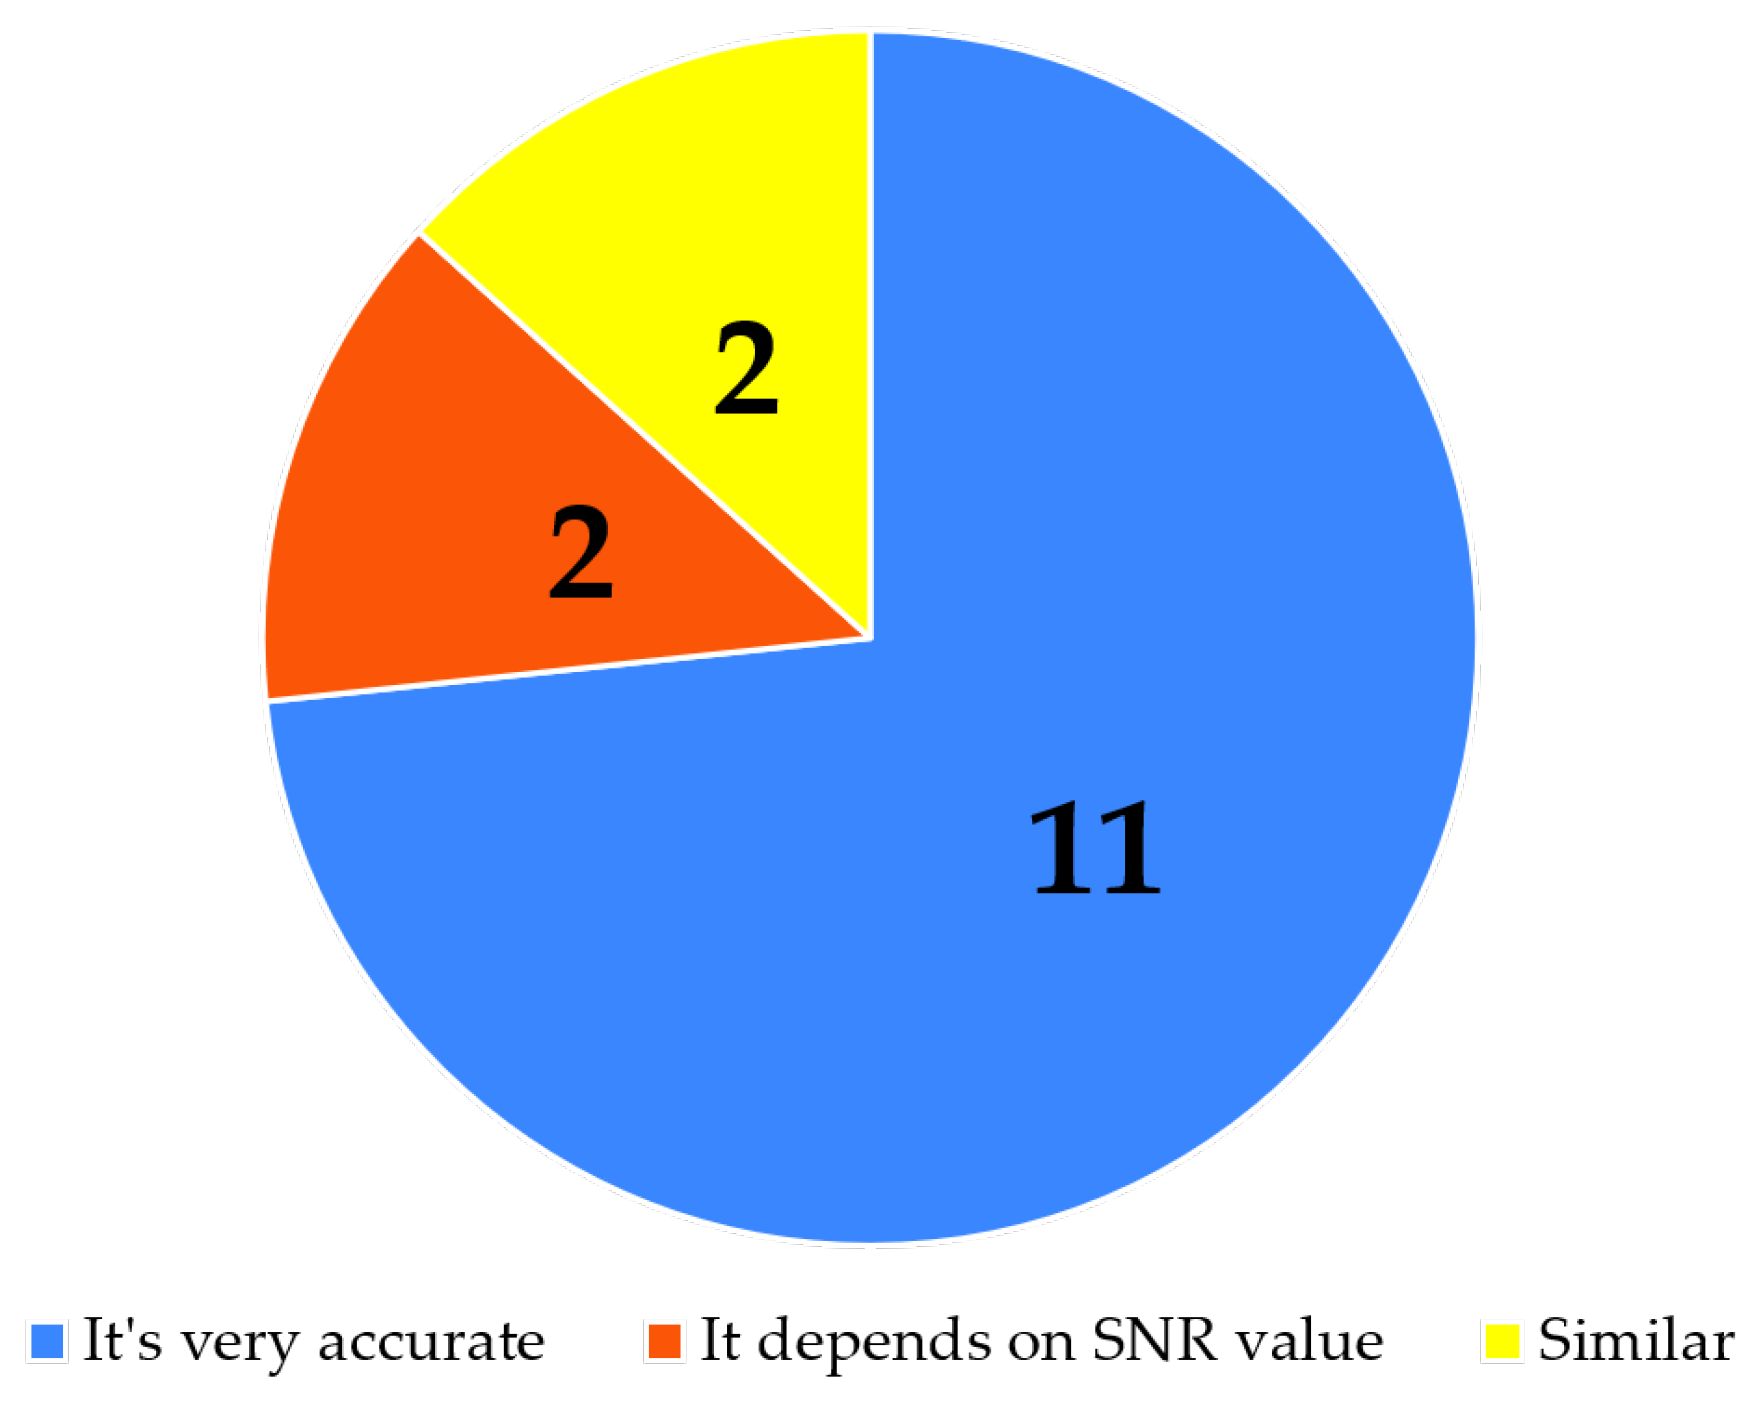
- How do you assess the efficiency of detection in the proposed method compared to the previously used one?
6. Conclusions
Author Contributions
Funding
Data Availability Statement
Conflicts of Interest
Abbreviations
| IT&C | Information technology and communications |
| CE | Compromised electromagnetic emanations |
| TEMPEST | Transient Electromagnetic Pulse Emanations Standard |
| UPS | Uninterruptible power supplies |
| SDR | Software-defined radio |
| DUT | Device under test |
| IC | Integrated circuit |
| RF | Radio frequency |
| SNR | Signal-to-noise ratio |
| f | Frequency |
| IF | Intermediate frequency |
| AM | Amplitude modulation |
| TV | Television |
| ML | Machine learning |
References
- Qualcomm Technologies. The 2022 State of Sound Report: A Global Analysis of Audio Consumer Behaviors and Desires; Technical Report; Qualcomm Technologies: San Diego, CA, USA, 2022. [Google Scholar]
- BlueWave Consulting. Wireless Headphones Market—Global Size, Share, Trend Analysis, Opportunity and Forecast Report, 2018–2028, Segmented by Product Type (In-Ear, Over-Ear Headphones, Others), Distribution Channel (Online, Offline), Application (Music & Entertainment, Gaming, Virtual Reality, Fitness, Others), Region (North America, Europe, Asia Pacific, Latin America, Middle East and Africa); Technical Report; BlueWave Consulting: Noida, India, 2022. [Google Scholar]
- National Research Council. Toward Better Usability, Security, and Privacy of Information Technology: Report of a Workshop; National Academies Press: Washington, DC, USA, 2010. [Google Scholar]
- Sandescu, C.; Dinisor, A.; Vladescu, C.V.; Grigorescu, O.; Corlatescu, D.; Dascalu, M.; Rughinis, R. Extracting exploits and attack vectors from cybersecurity news using NLP. UPB Sci. Bull. Ser. C Electr. Eng. Comput. Sci. Politech. Univ. Buchar. 2022, 84, 63–78. [Google Scholar]
- Birukawa, R.; Nagata, D.; Hayashi, Y.i.; Mizuki, T.; Sone, H. The Source Estimation of Electromagnetic Information Leakage from Information Devices. In Proceedings of the 2020 XXXIII General Assembly and Scientific Symposium of the International Union of Radio Science, Rome, Italy, 29 August–5 September 2020; pp. 1–4. [Google Scholar] [CrossRef]
- Zheng, K.; Luo, R.; Wang, Z.; Liu, X.; Yao, Y. Short-Term and Long-Term Throughput Maximization in Mobile Wireless-Powered Internet of Things. IEEE Internet of Things J. 2023. [Google Scholar] [CrossRef]
- Choi, J.; Yang, H.Y.; Cho, D.H. Tempest comeback: A realistic audio eavesdropping threat on mixed-signal socs. In Proceedings of the 2020 ACM SIGSAC Conference on Computer and Communications Security, Online, 9–13 November 2020; pp. 1085–1101. [Google Scholar]
- Liu, X.; Xu, B.; Zheng, K.; Zheng, H. Throughput Maximization of Wireless-Powered Communication Network With Mobile Access Points. IEEE Trans. Wirel. Commun. 2023, 22, 4401–4415. [Google Scholar] [CrossRef]
- Lavaud, C.; Gerzaguet, R.; Gautier, M.; Berder, O.; Nogues, E.; Molton, S. Whispering devices: A survey on how side-channels lead to compromised information. J. Hardw. Syst. Secur. 2021, 5, 143–168. [Google Scholar] [CrossRef]
- Bergsma, H.; Leferink, F. Using an in-line uninterruptable power supply as TEMPEST ‘filter’ for naval vessels. In Proceedings of the 2015 IEEE International Symposium on Electromagnetic Compatibility (EMC), Dresden, Germany, 16–22 August 2015; pp. 1106–1110. [Google Scholar] [CrossRef]
- Johnson, T.R. American Cryptology during the Cold War, 1945–1989; National Security Agency: Fort Meade, MD, USA, 2007.
- Martin, M.; Sunmola, F.; Lauder, D. Unintentional compromising electromagnetic emanations from IT equipment: A concept map of domain knowledge. Procedia Comput. Sci. 2022, 200, 1432–1441. [Google Scholar] [CrossRef]
- Kuhn, M.G.; Anderson, R.J. Soft Tempest: Hidden Data Transmission Using Electromagnetic Emanations. In Proceedings of the Information Hiding, Portland, OR, USA, 14–17 April 1998; Aucsmith, D., Ed.; Springer: Berlin/Heidelberg, Germany, 1998; pp. 124–142. [Google Scholar]
- Lindell, I.V.; Sihvola, A.H. Perfect Electromagnetic Conductor. J. Electromagn. Waves Appl. 2005, 19, 861–869. [Google Scholar] [CrossRef]
- NATO Military Committee Communication; Information Systems Security; Evaluation Agency (SECAN). NATO Standard (2009) SDIP-27/2: NATO TEMPEST Requirements and Evaluation Procedures; (Published March 2016 but Not for Public Use, NATOCONFIDENTIAL); NATO: Mons, Belgium, 2016. [Google Scholar]
- Kitazawa, T.; Kubo, H.; Hayashi, Y. A Method for Extracting Plausible Images from EM Leakage Measured at Low Sampling Rates. In Proceedings of the 2023 IEEE 7th Global Electromagnetic Compatibility Conference (GEMCCON), Nusa Dua, Indonesia, 19–20 January 2023; p. 34. [Google Scholar] [CrossRef]
- Lee, E.; Choi, D.H.; Nam, T.; Yook, J.G. Counter-TEMPEST: Information Spoofing based on the EM-leakage Signature of TMDS System. In Proceedings of the 2023 International Symposium on Electromagnetic Compatibility—EMC Europe, Krakow, Poland, 4–8 September 2023; pp. 1–5. [Google Scholar] [CrossRef]
- Kaji, S.; Fujimoto, D.; Kinugawa, M.; Hayashi, Y. Echo TEMPEST: EM Information Leakage Induced by IEMI for Electronic Devices. IEEE Trans. Electromagn. Compat. 2023, 65, 655–666. [Google Scholar] [CrossRef]
- Gaita, A.; David, E.; Buzo, A.; Grigore, M.; Burileanu, C.; Cucu, H.; Pelz, G. Convolutional neural network model used for aiding IC analog/mixed signal verification. UPB Sci. Bull. Ser. C Electr. Eng. Comput. Sci. Politech. Univ. Buchar. 2023, 85, 151–162. [Google Scholar]
- Kuhn, M.G. Electromagnetic Eavesdropping Risks of Flat-Panel Displays. In Proceedings of the Privacy Enhancing Technologies, Toronto, ON, Canada, 26–28 March 2004; Martin, D., Serjantov, A., Eds.; Springer: Berlin/Heidelberg, Germany, 2005; pp. 88–107. [Google Scholar]
- Boitan, A.; Kubiak, I.; Halunga, S.; Przybysz, A.; Stańczak, A. Method of Colors and Secure Fonts Used for Source Shaping of Valuable Emissions from Projector in Electromagnetic Eavesdropping Process. Symmetry 2020, 12, 1908. [Google Scholar] [CrossRef]
- Groot, R.; van Meeteren, D.; Leferink, F. TEMPEST Demo for Increasing Awareness. In Proceedings of the 2023 International Symposium on Electromagnetic Compatibility—EMC Europe, Krakow, Poland, 4–8 September 2023; pp. 1–5. [Google Scholar] [CrossRef]
- Zwicker, E.; Fastl, H. Psychoacoustics: Facts and Models; Springer Series in Information Sciences; Springer: Berlin/Heidelberg, Germany, 2007. [Google Scholar] [CrossRef]
- Flanagan, W.A. VoIP and Unified Communications Define the Future. In VoIP and Unified Communications: Internet Telephony and the Future Voice Network; Wiley: Hoboken, NJ, USA, 2011; pp. 139–169. [Google Scholar] [CrossRef]
- Trip, B.; Butnariu, V.; Velicu, V.; Halunga, S.; Boitan, A. Analysis of the Compromising Audio Signal From the Emission Security Perspective. In Proceedings of the 2020 13th International Conference on Communications (COMM), Bucharest, Romania, 18–20 June 2020; pp. 363–366. [Google Scholar] [CrossRef]
- Trip, B.; Butnariu, V.; Vizitiu, M.; Boitan, A.; Halunga, S. Analysis of Compromising Video Disturbances through Power Line. Sensors 2022, 22, 267. [Google Scholar] [CrossRef]
- Vizitiu, A.M.; Trip, B.C.; Butnariu, V.F.; Velicu, V.; Dobrescu, L.; Halunga, S. Analysis of the unintented propagation of audio signal emitted by wireless headphones. Rev. Roum. Sci. Tech.—Sér. Électrotech. Énergétique 2022, 67, 479–482. [Google Scholar]
- Kitazawa, T.; Takano, S.; Hayashi, Y. Reconstruction of Sound Information Leakage Signals Obtained from Multiple Demodulation Methods. In Proceedings of the 2023 IEEE Symposium on Electromagnetic Compatibility & Signal/Power Integrity (EMC + SIPI), Grand Rapids, MI, USA, 29 July–4 August 2023; pp. 480–484. [Google Scholar] [CrossRef]
- Collins, N. Handmade Electronic Music: The Art of Hardware Hacking; Taylor & Francis: New York, NY, USA, 2020. [Google Scholar]
- Przybysz, A.; Grzesiak, K.; Kubiak, I. Electromagnetic Safety of Remote Communication Devices—Videoconference. Symmetry 2021, 13, 323. [Google Scholar] [CrossRef]
- Kubiak, I.; Przybysz, A. An RGB Pseudo-Colorization Method for Filtering of Multi-Source Graphical Data. Electronics 2023, 12, 4583. [Google Scholar] [CrossRef]
- Zhang, N.; Lu, Y.; Cui, Q.; Wang, Y. Investigation of Unintentional Video Emanations From a VGA Connector in the Desktop Computers. IEEE Trans. Electromagn. Compat. 2017, 59, 1826–1834. [Google Scholar] [CrossRef]


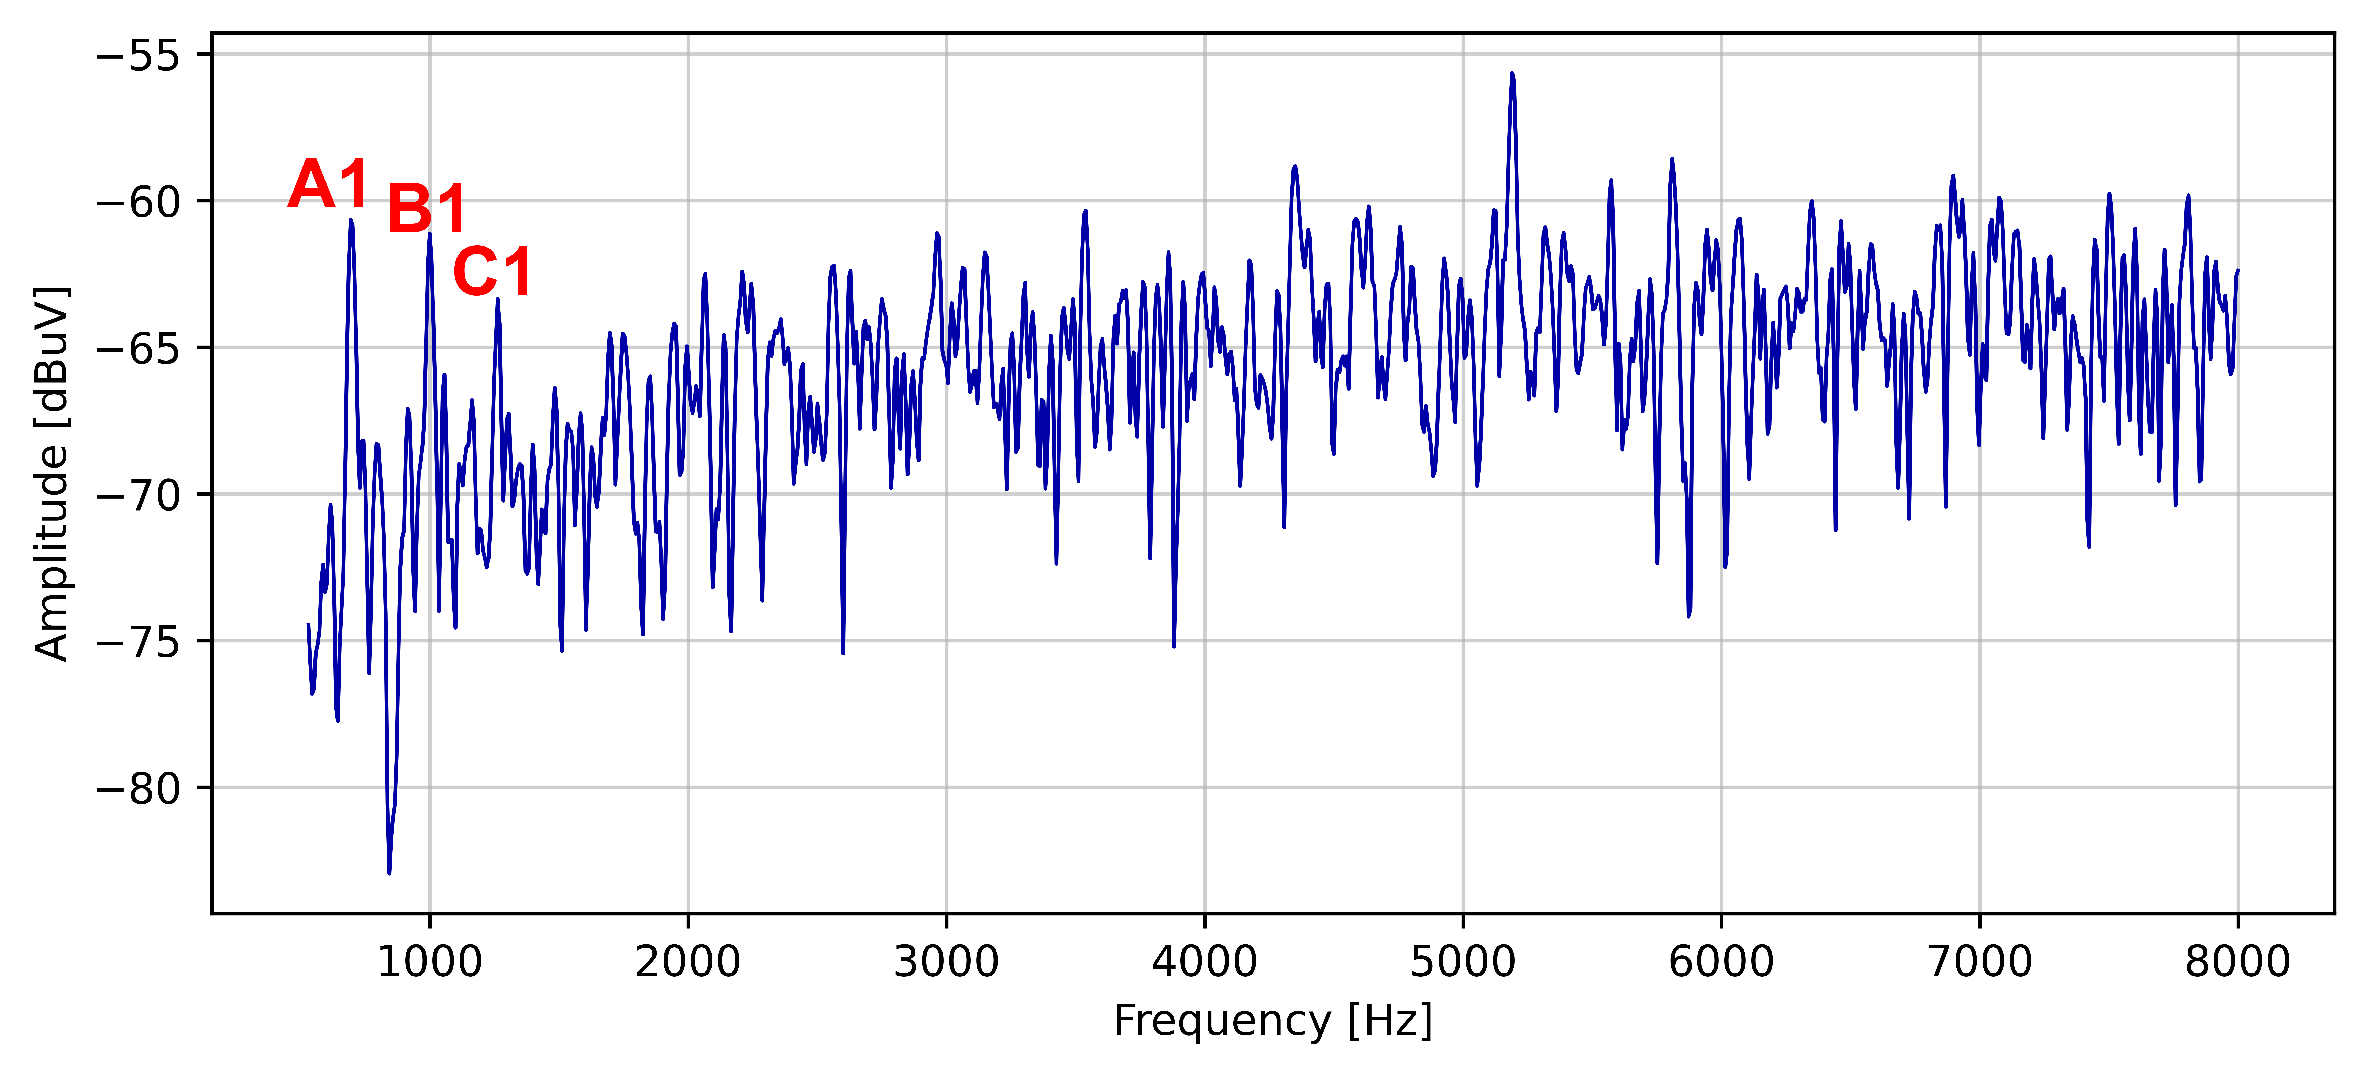
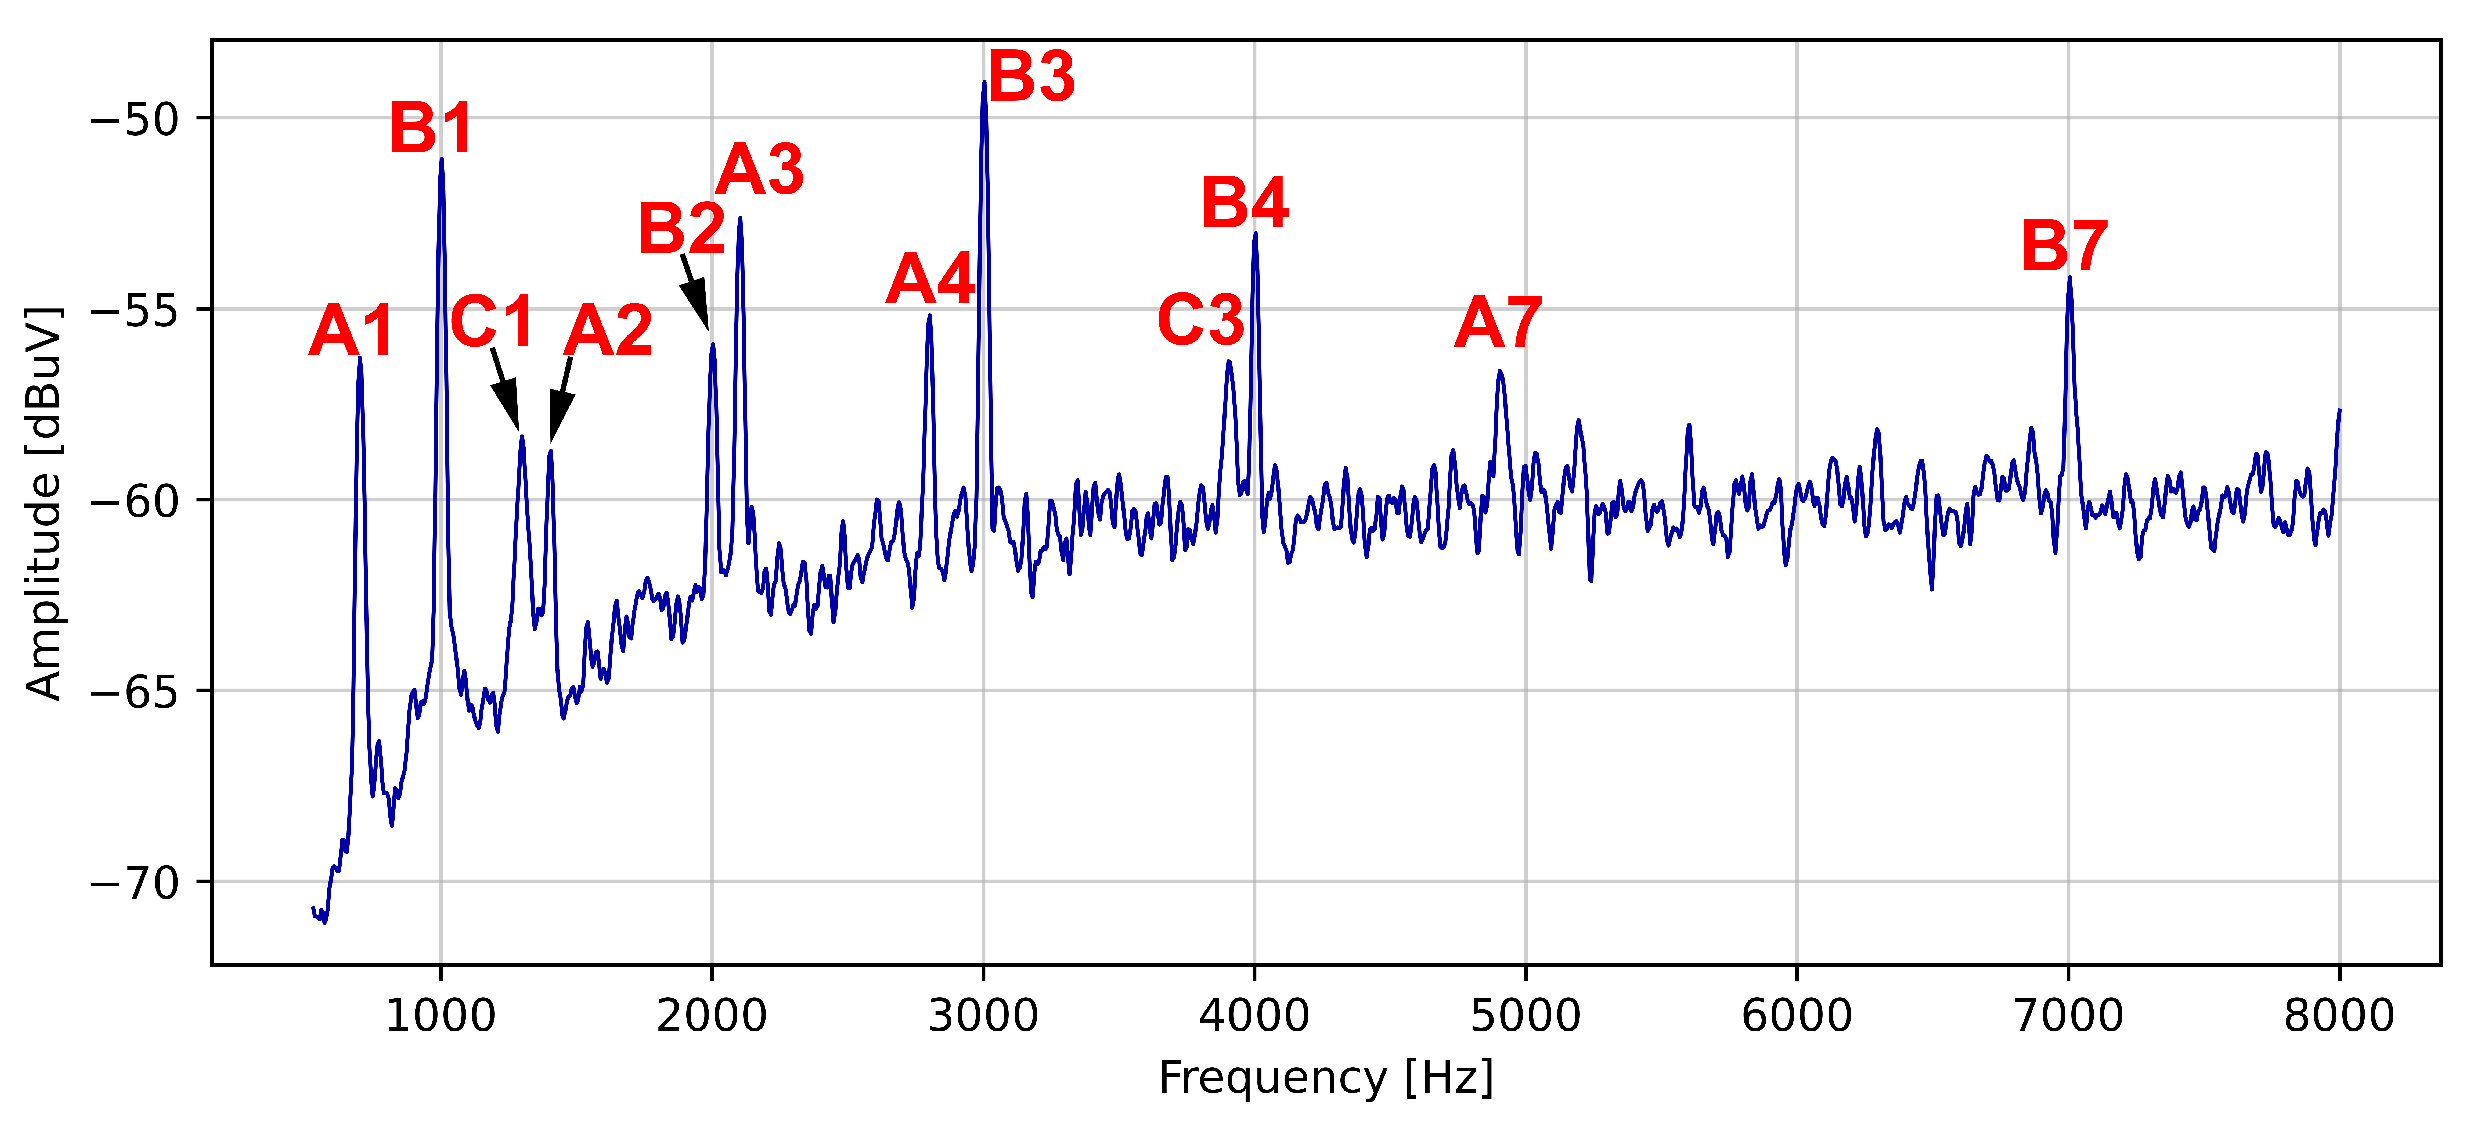
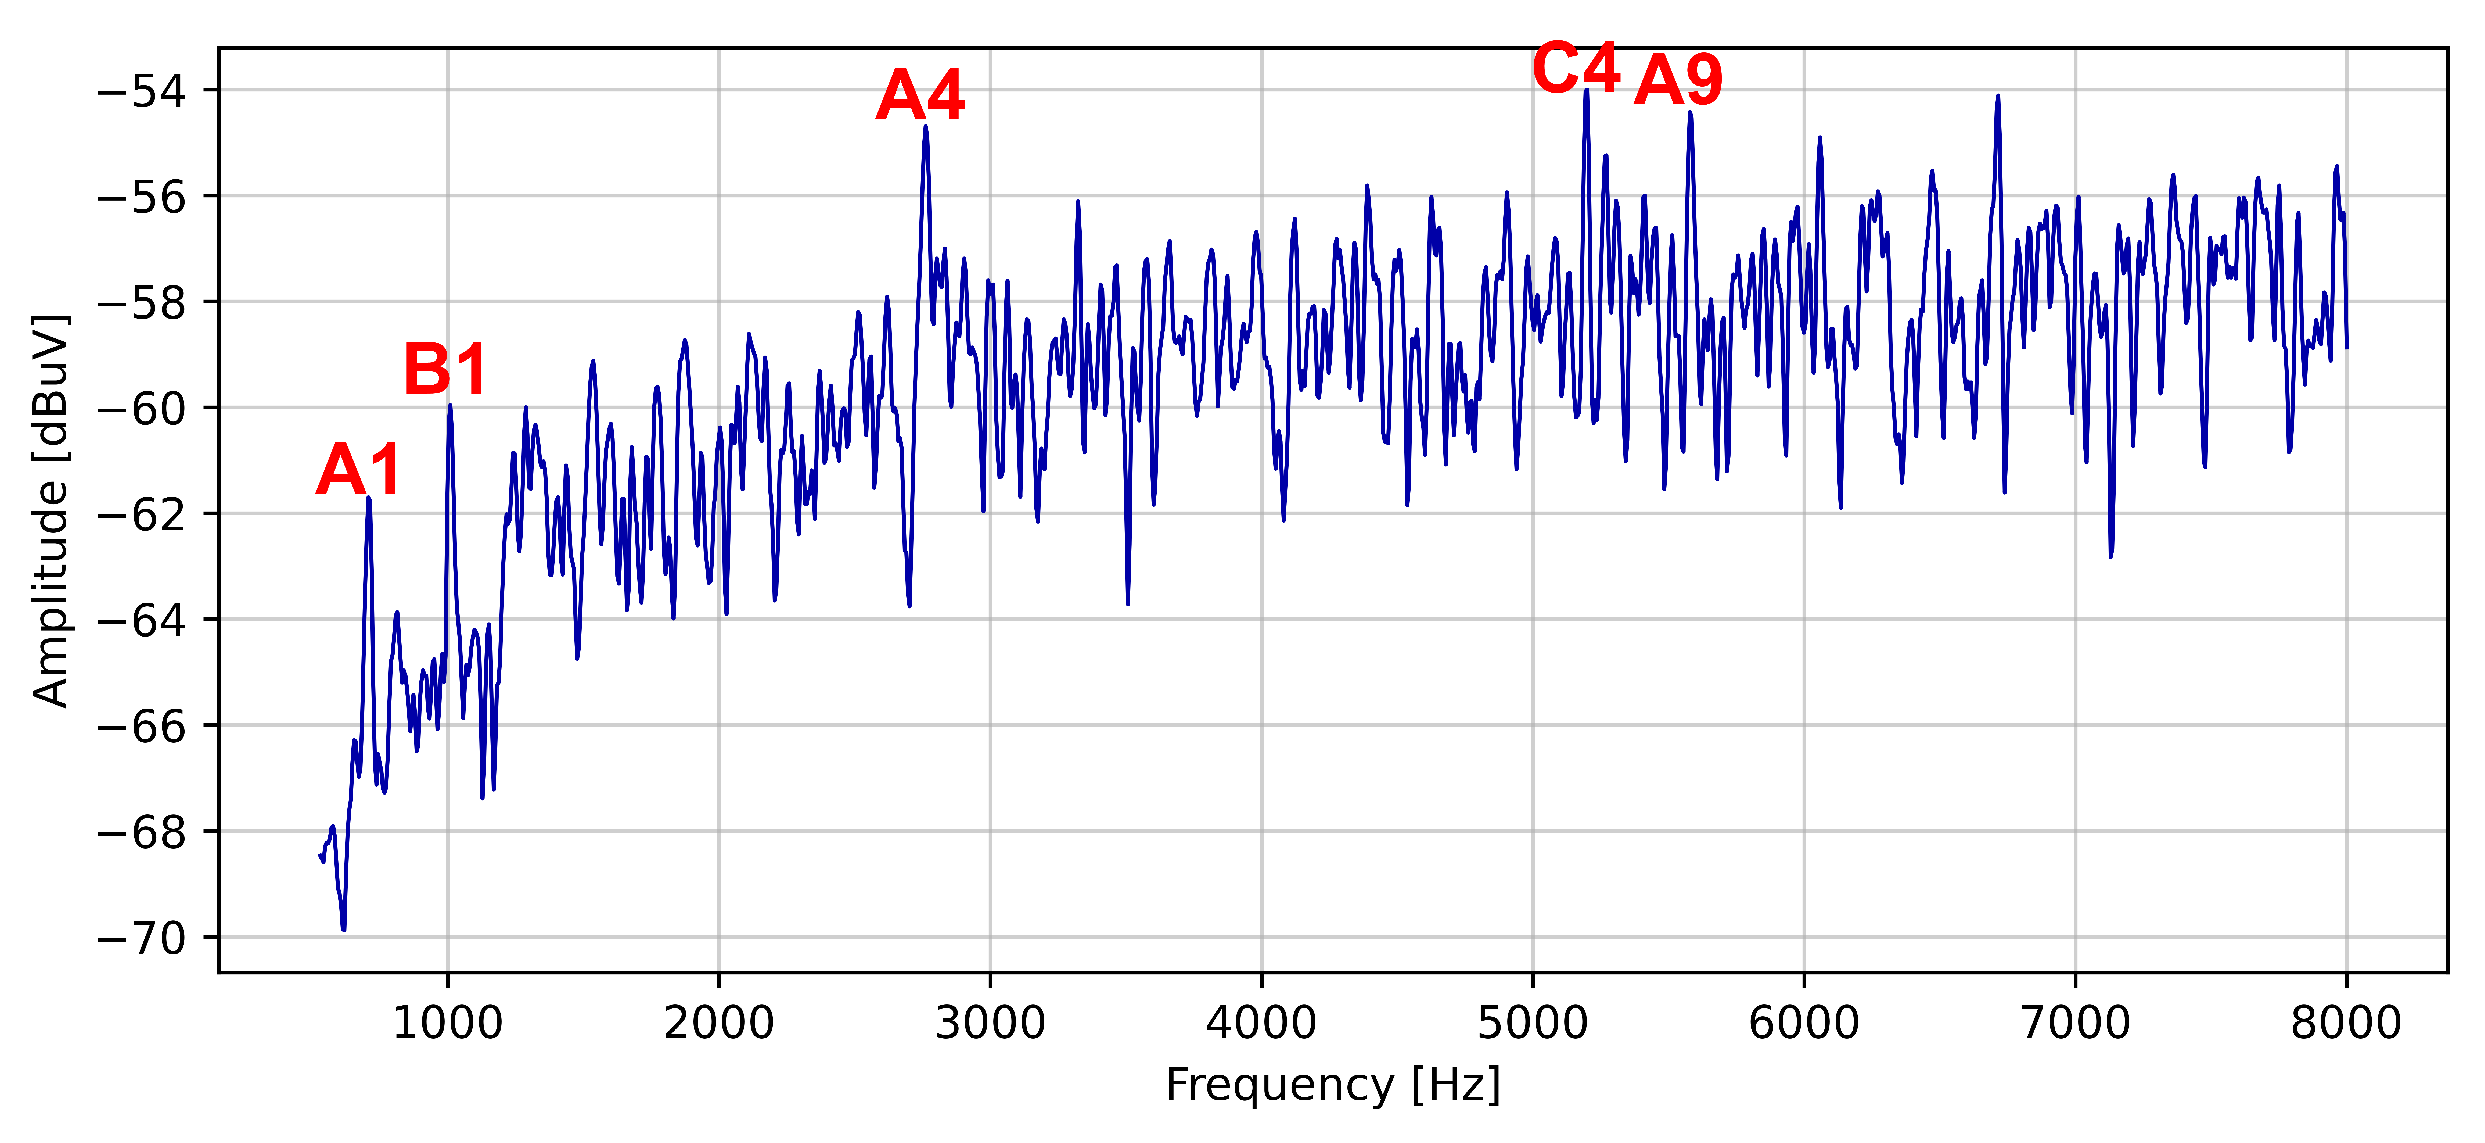
| Harmonic’s Order | Harmonic’s Frequency | Notation |
|---|---|---|
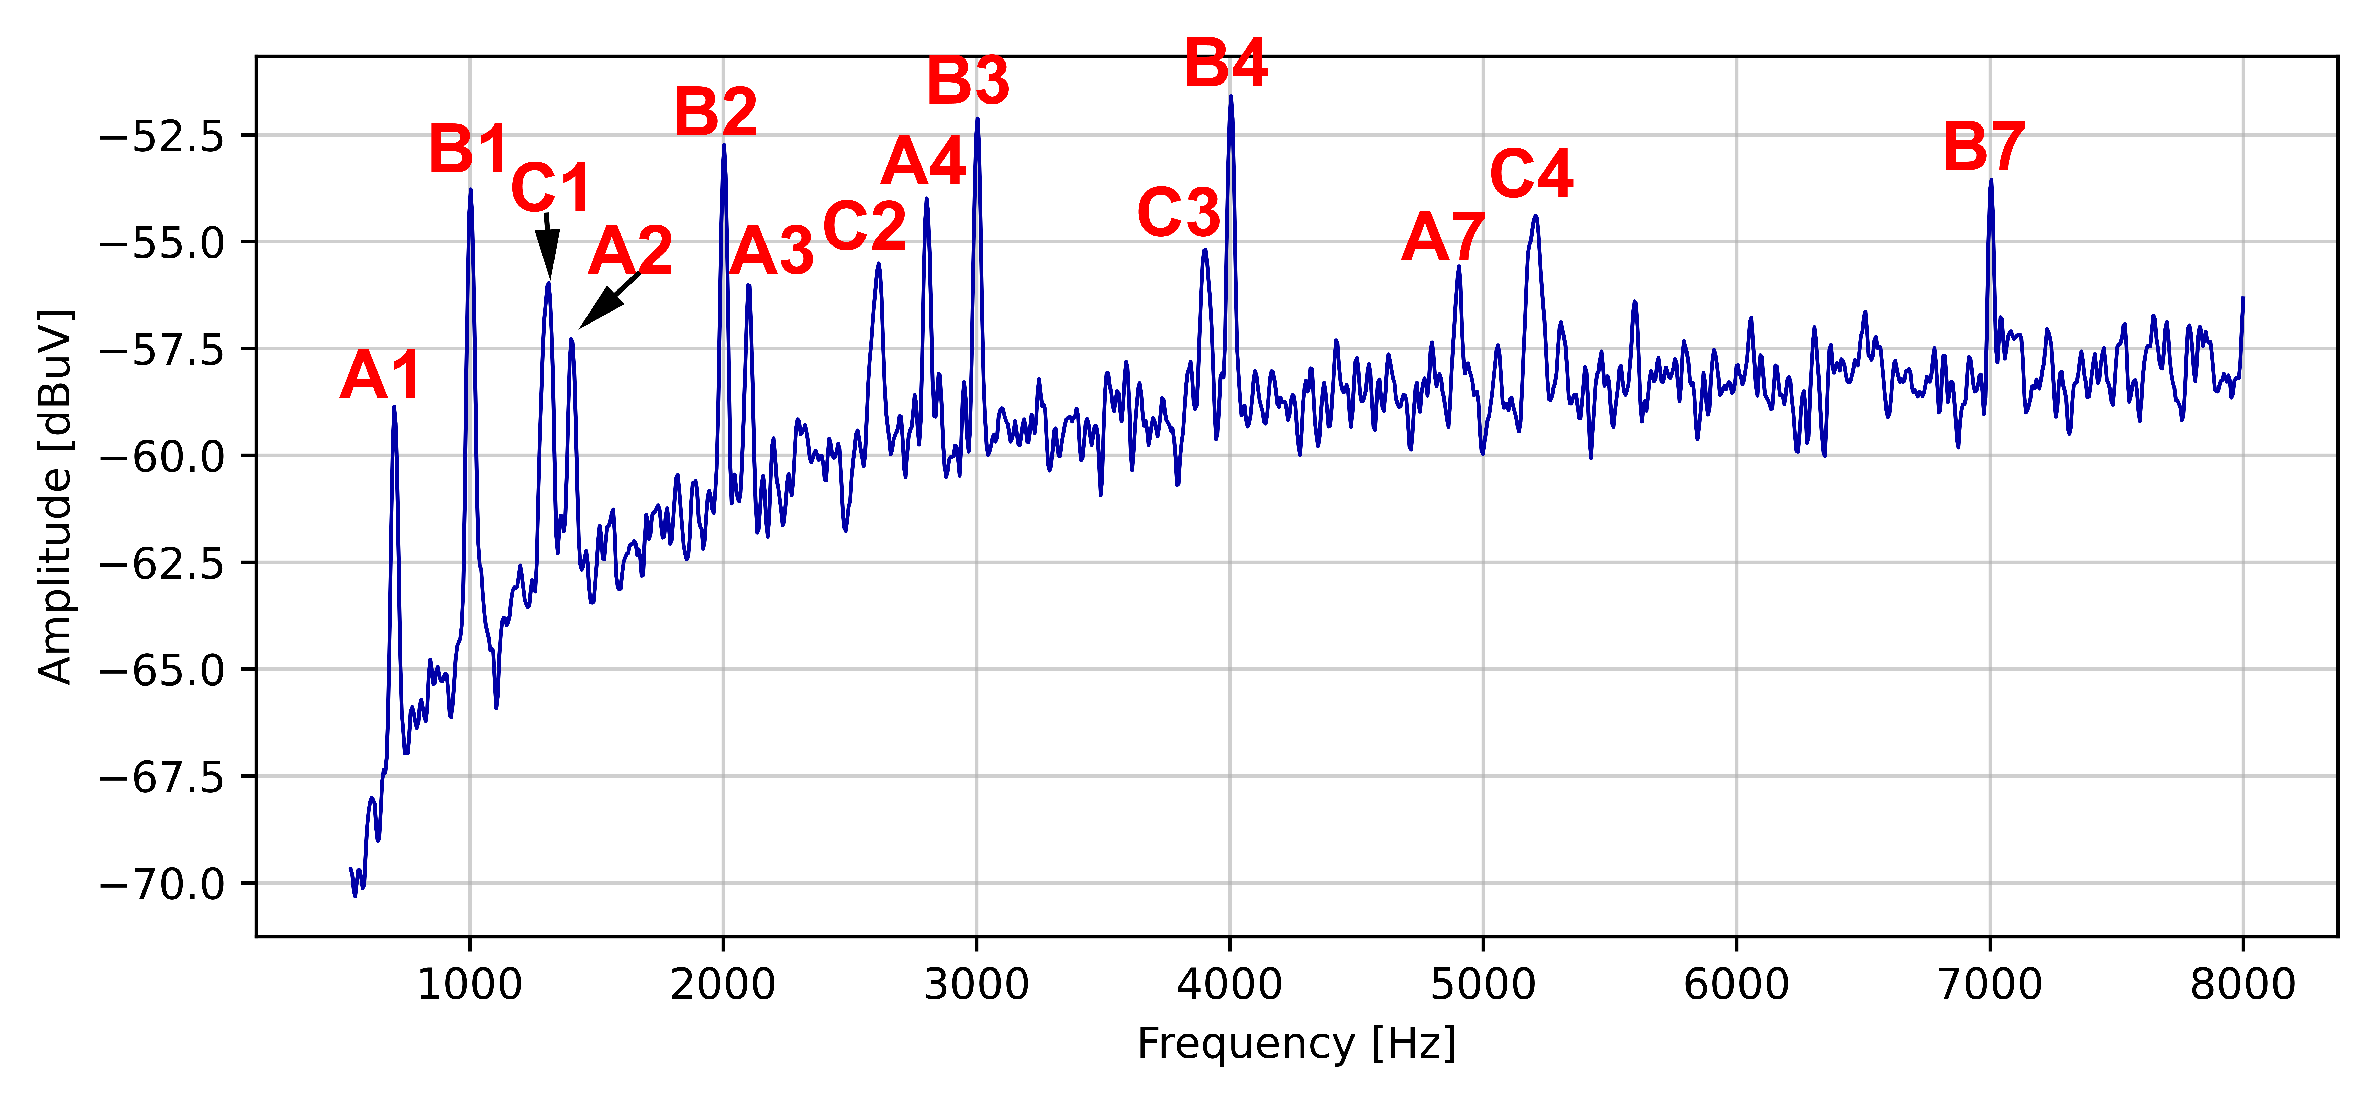
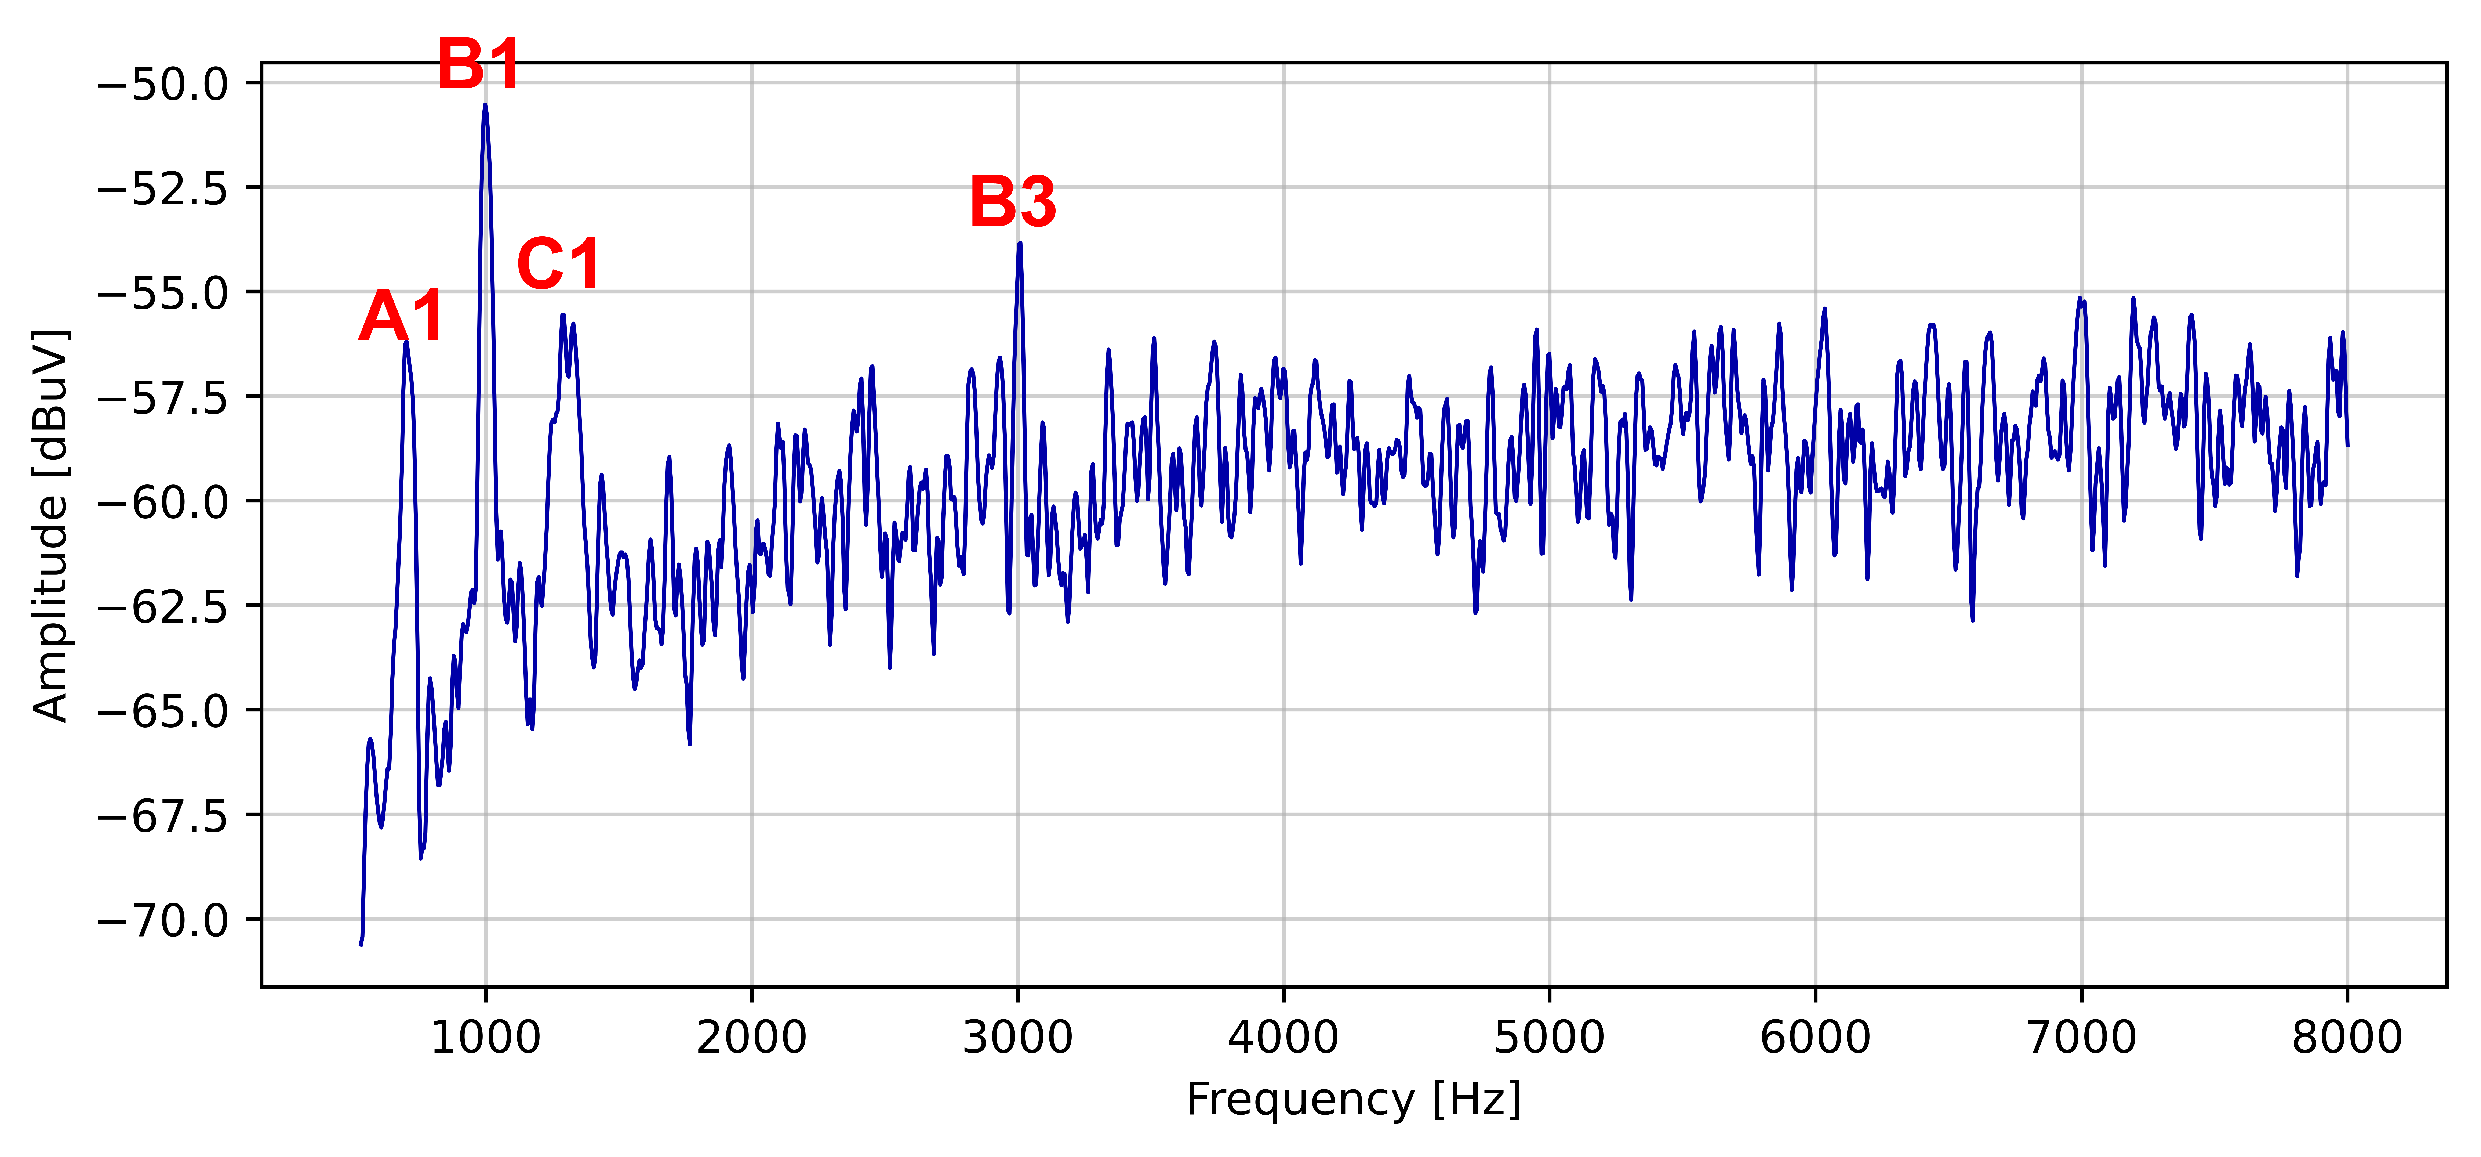
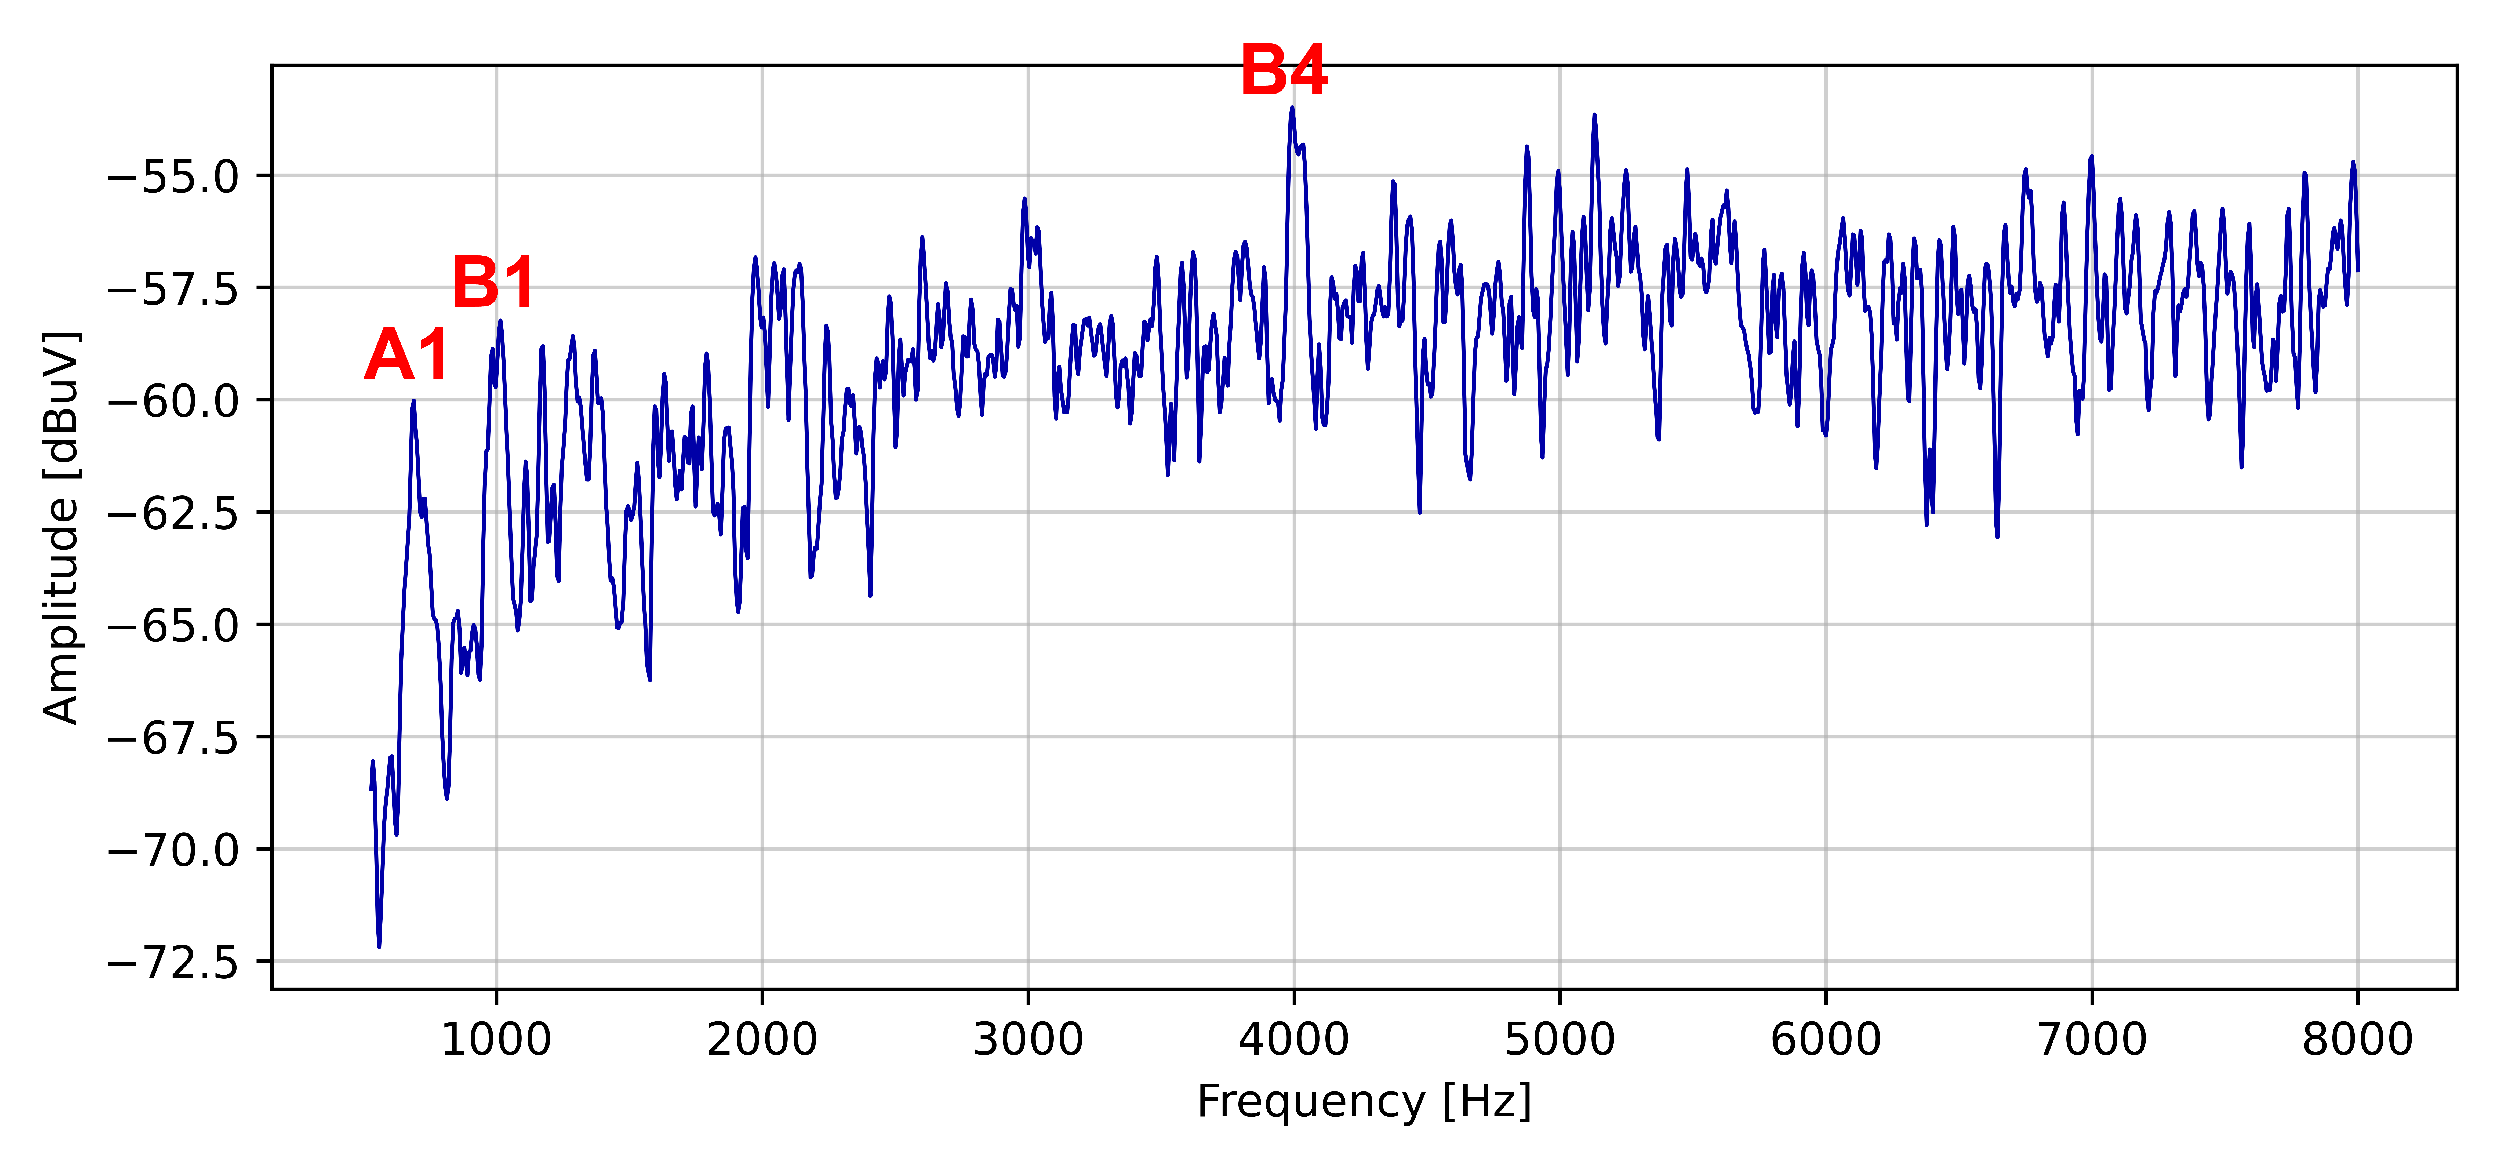
| 1 | 700 Hz | A1 |
| 2 | 1.4 kHz | A2 |
| 3 | 2.1 kHz | A3 |
| 4 | 2.8 kHz | A4 |
| 5 | 3.5 kHz | A5 |
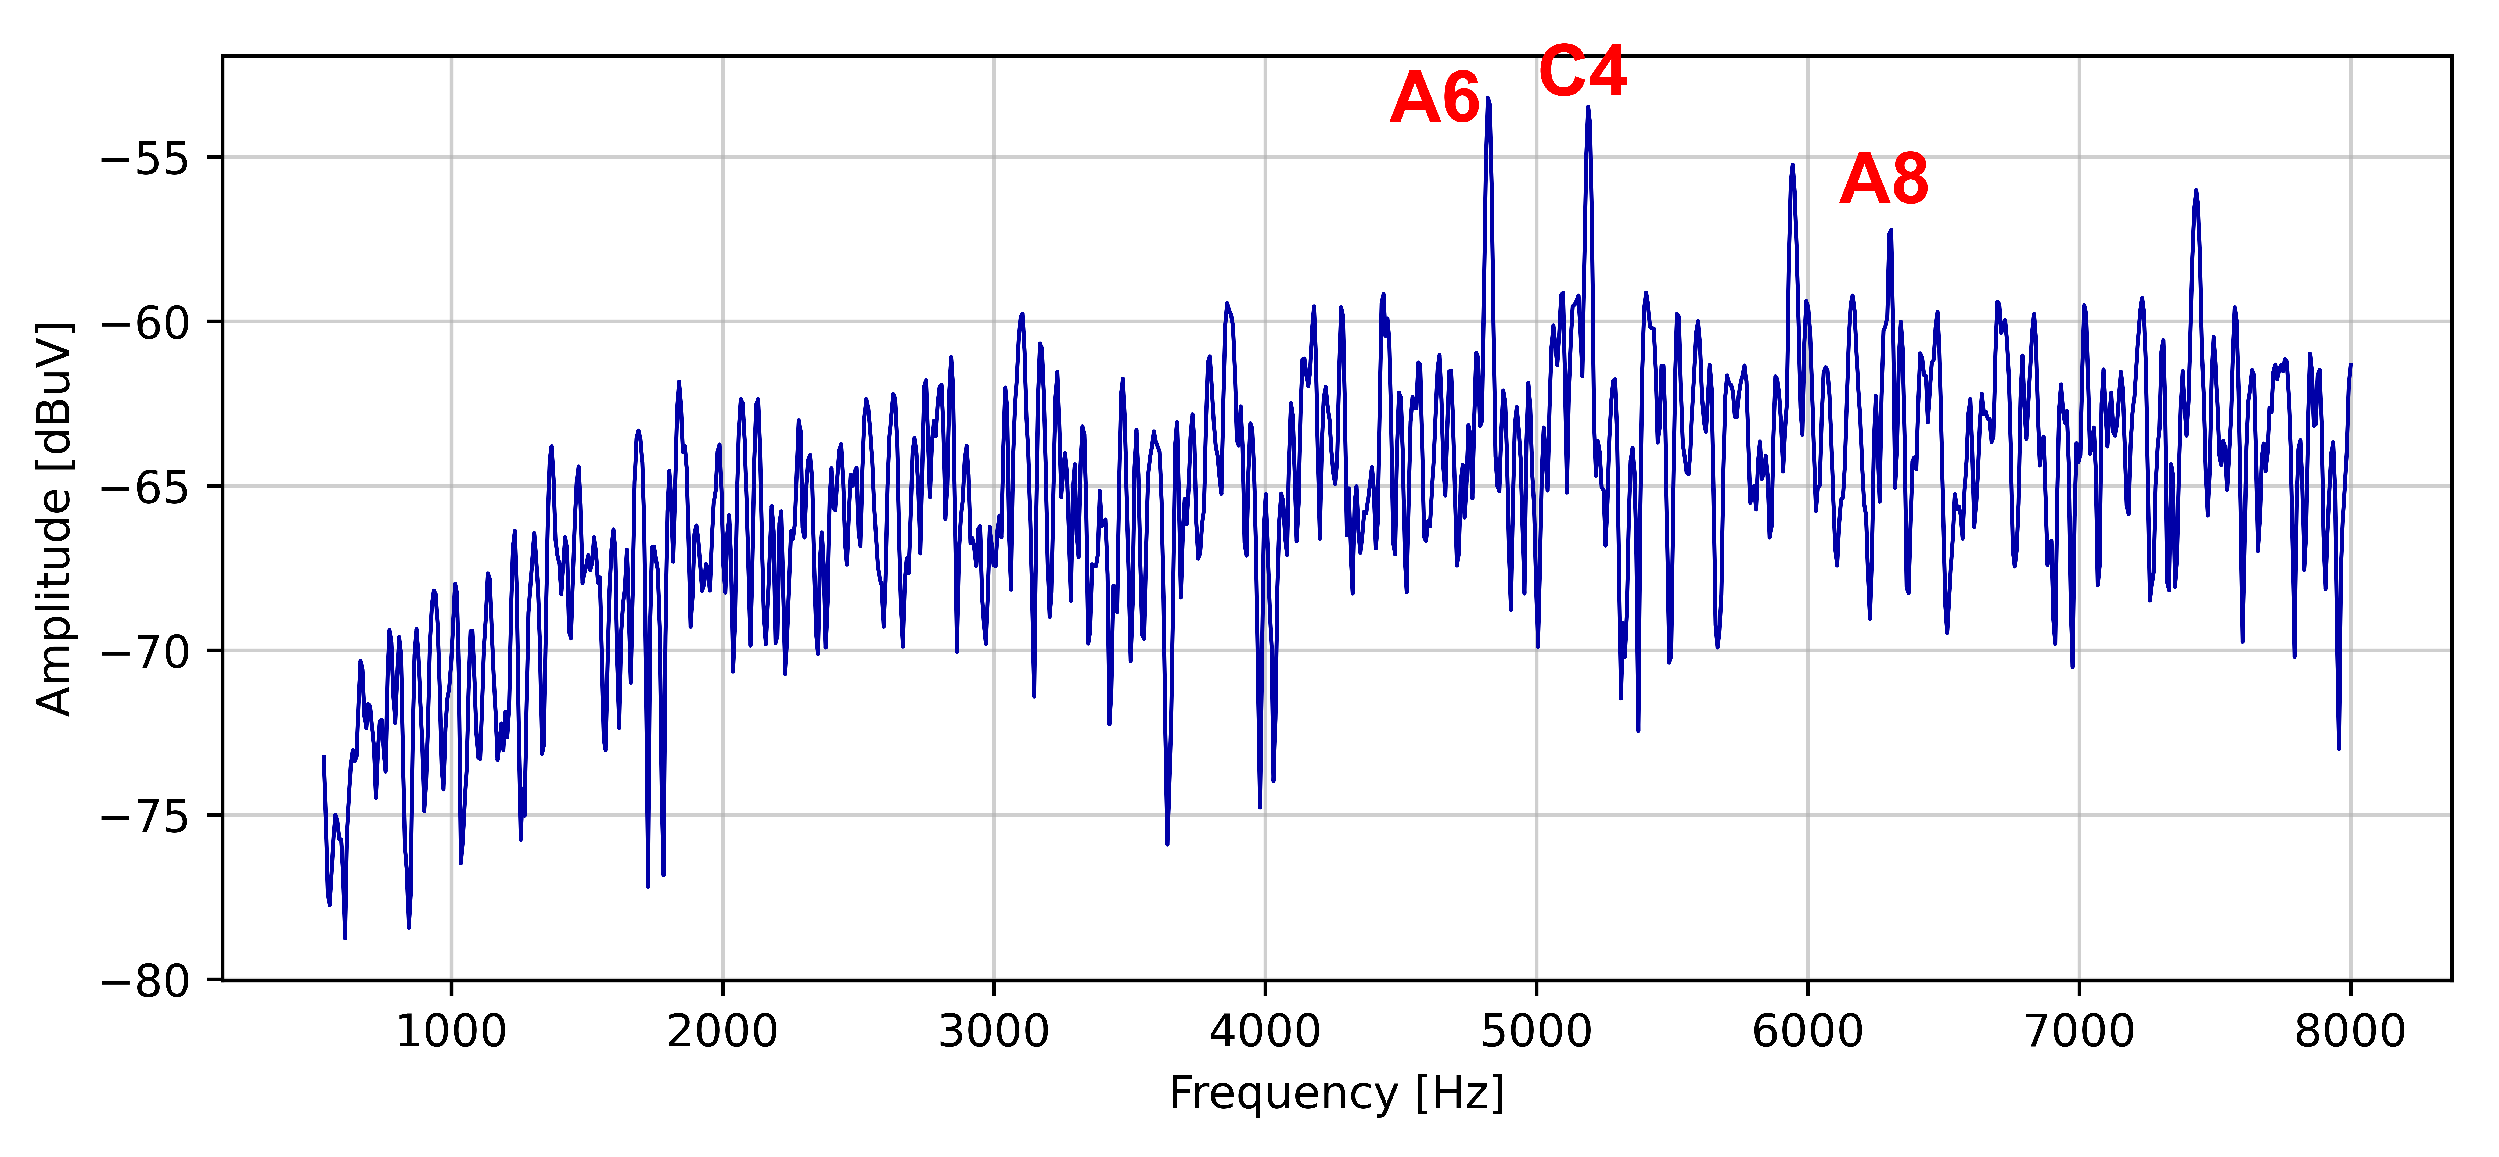
| 6 | 4.2 kHz | A6 |
| 7 | 4.9 kHz | A7 |
| 8 | 5.6 kHz | A9 |
| 9 | 6.3 kHz | A9 |
| 10 | 7 kHz | A10 |
| Harmonic’s Order | Harmonic’s Frequency | Notation |
|---|---|---|
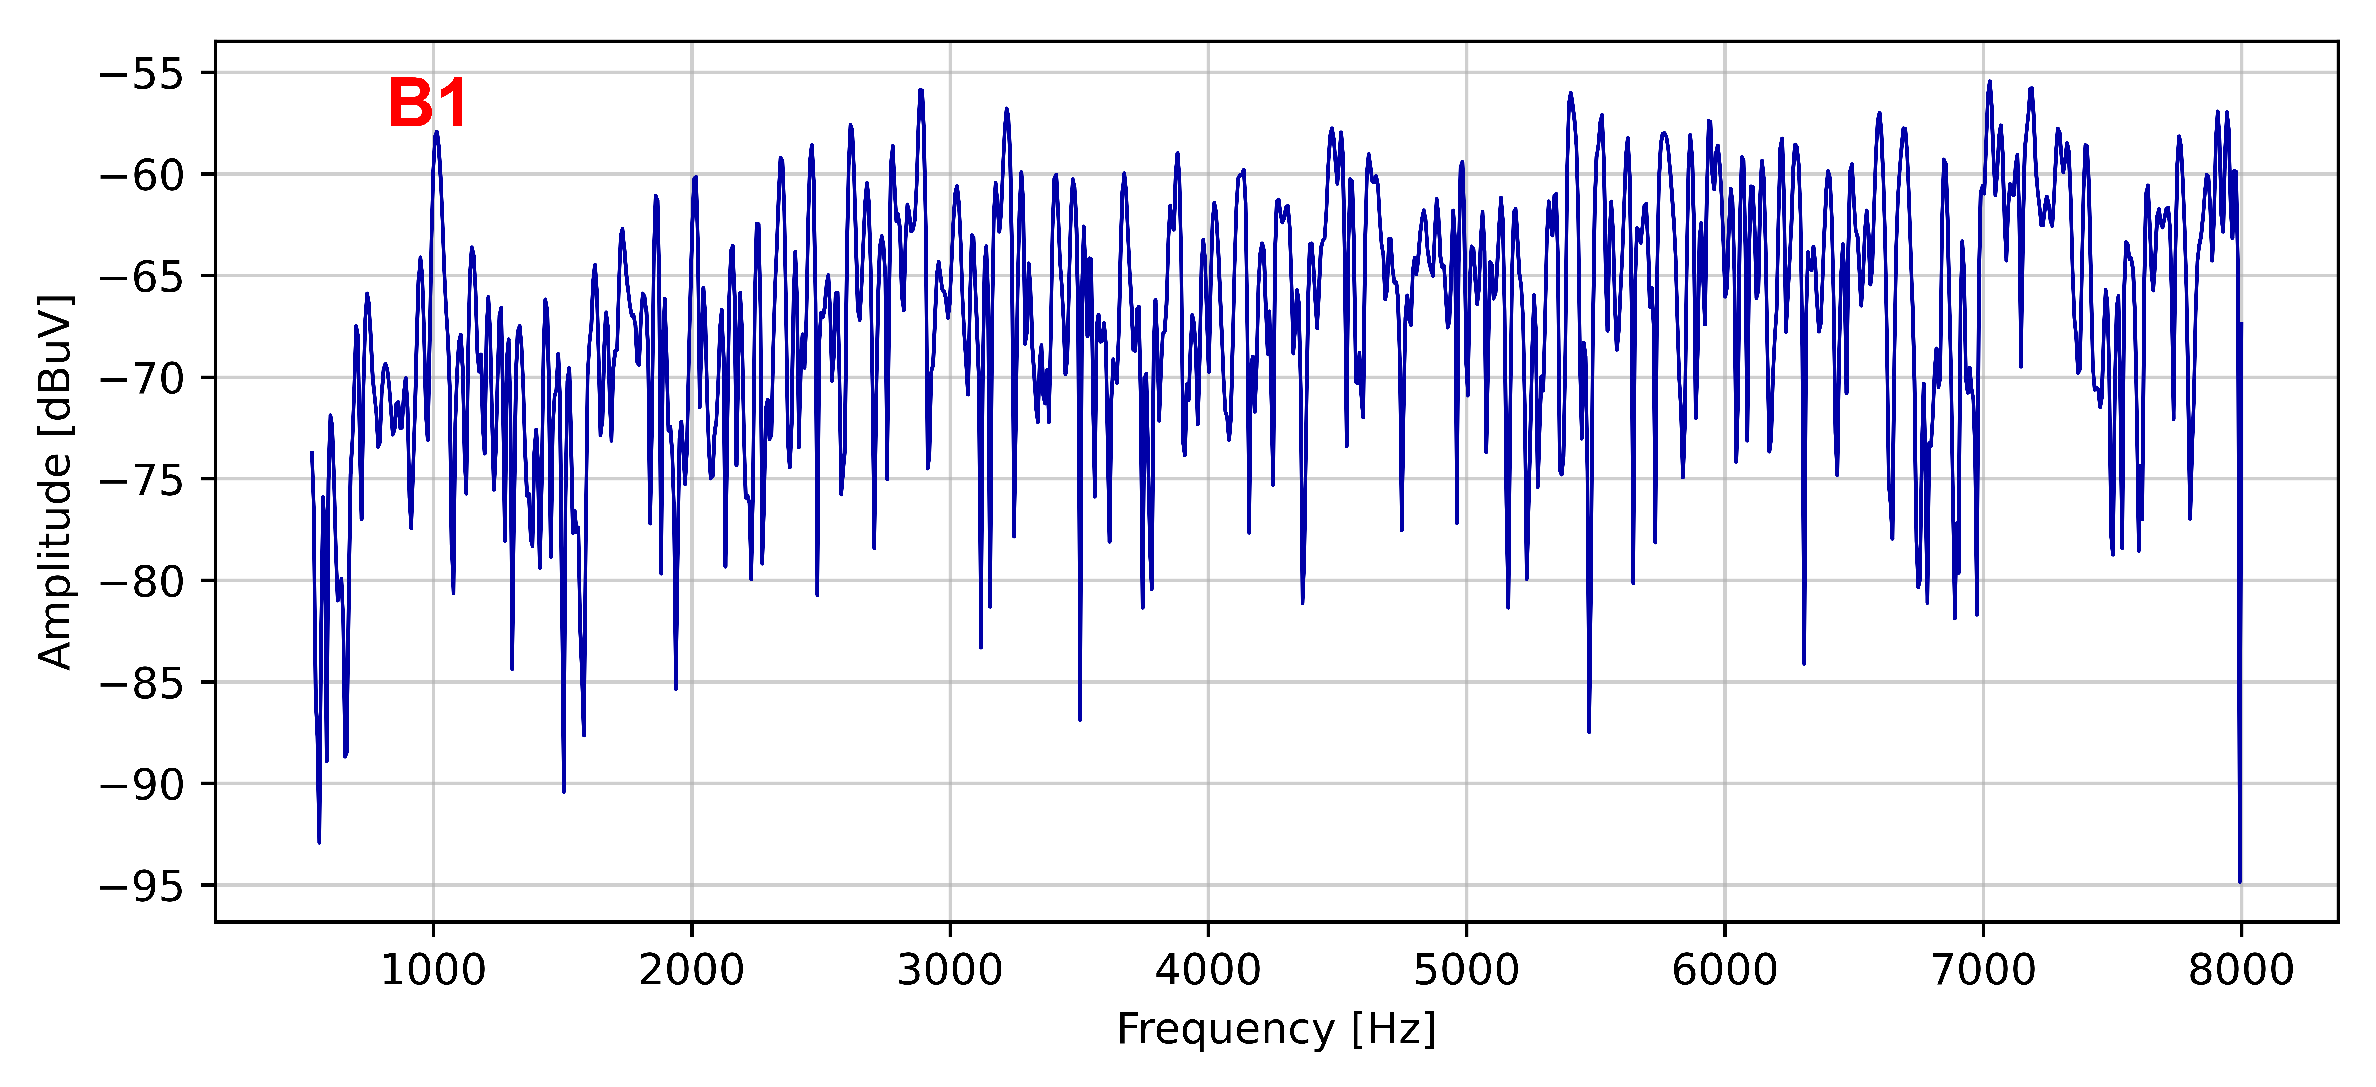
| 1 | 1 kHz | B1 |
| 2 | 2 kHz | B2 |
| 3 | 3 kHz | B3 |
| 4 | 4 kHz | B4 |
| 5 | 5 kHz | B5 |
| 6 | 6 kHz | B6 |
| 7 | 7 kHz | B7 |
| 8 | 8 kHz | B8 |
| Harmonic’s Order | Harmonic’s Frequency | Notation |
|---|---|---|
| 1 | 1.3 kHz | C1 |
| 2 | 2.6 kHz | C2 |
| 3 | 3.9 kHz | C3 |
| 4 | 5.2 kHz | C4 |
| 5 | 6.5 kHz | C5 |
| 6 | 7.8 kHz | C6 |
Disclaimer/Publisher’s Note: The statements, opinions and data contained in all publications are solely those of the individual author(s) and contributor(s) and not of MDPI and/or the editor(s). MDPI and/or the editor(s) disclaim responsibility for any injury to people or property resulting from any ideas, methods, instructions or products referred to in the content. |
© 2024 by the authors. Licensee MDPI, Basel, Switzerland. This article is an open access article distributed under the terms and conditions of the Creative Commons Attribution (CC BY) license (https://creativecommons.org/licenses/by/4.0/).
Share and Cite
Vizitiu, A.M.; Dobrescu, L.; Trip, B.C.; Butnariu, V.F.; Molder, C.; Halunga, S.V. Detection of the Compromising Audio Signal by Analyzing Its AM Demodulated Spectrum. Symmetry 2024, 16, 209. https://doi.org/10.3390/sym16020209
Vizitiu AM, Dobrescu L, Trip BC, Butnariu VF, Molder C, Halunga SV. Detection of the Compromising Audio Signal by Analyzing Its AM Demodulated Spectrum. Symmetry. 2024; 16(2):209. https://doi.org/10.3390/sym16020209
Chicago/Turabian StyleVizitiu, Alexandru Madalin, Lidia Dobrescu, Bogdan Catalin Trip, Vlad Florian Butnariu, Cristian Molder, and Simona Viorica Halunga. 2024. "Detection of the Compromising Audio Signal by Analyzing Its AM Demodulated Spectrum" Symmetry 16, no. 2: 209. https://doi.org/10.3390/sym16020209
APA StyleVizitiu, A. M., Dobrescu, L., Trip, B. C., Butnariu, V. F., Molder, C., & Halunga, S. V. (2024). Detection of the Compromising Audio Signal by Analyzing Its AM Demodulated Spectrum. Symmetry, 16(2), 209. https://doi.org/10.3390/sym16020209