Article

Offloading Strategy for Forest Monitoring Network Based on Improved Beetle Optimization Algorithm

1
School of Computer Science and Engineering, Guilin University of Technology, Guilin 541004, China
2
Guangxi Key Laboratory of Embedded Technology and Intelligent System, Guilin 541004, China
3
Guangxi Forestry Research Institute, Nanning 530002, China
*
Author to whom correspondence should be addressed.
Symmetry 2024, 16(12), 1569; https://doi.org/10.3390/sym16121569
Submission received: 20 October 2024 / Revised: 13 November 2024 / Accepted: 18 November 2024 / Published: 23 November 2024
(This article belongs to the Special Issue Symmetry and Asymmetry in Embedded Systems)

Abstract

:
In forest monitoring networks, the computational capabilities of sensors cannot meet the latency requirements for complex tasks, and the limited battery capacity of these sensors hinders the long-term execution of monitoring tasks. Mobile edge computing (MEC) acts as an effective solution for this issue by offloading tasks to edge servers, significantly reducing both task latency and energy consumption. However, the computational capacity of MEC servers and the bandwidth in the system are limited, and the communication environment in forested areas is complex. To simulate the complexity of the forest communication environment, we incorporate empirical path loss and multipath fading into the calculation of signal transmission rates. The computational offloading problem is then converted into a minimum-cost optimization problem with multiple constraints related to energy consumption and latency, which we formulate as an NP-hard problem. We propose a dung beetle optimization (DBO) strategy for computational offloading, enhancing it with an improved circle chaotic mapping, a dimension decomposition strategy, and Cauchy disturbance. This algorithm has the beauty of symmetry in the search range, and the symmetrical features can comprehensively search for existing solutions. Experimental results demonstrate that the improved dung beetle optimization algorithm (IDBO) achieves better convergence, lower complexity, and superior optimization outcomes compared to local offloading strategies and other metaheuristic algorithms, confirming the effectiveness of the proposed algorithm and ensuring the service quality of the forest monitoring network.

1. Introduction

The proposal of industry 4.0 has led various sectors to strive for intelligent operations [1]. Nevertheless, owing to limitations in device computing power and battery capacity, the development of this work has been somewhat restricted. With the maturation and advancement of edge computing technology, the low latency, high bandwidth, and high-security network services provided by edge computing offloading effectively address the issues of insufficient computational power and limited battery capacity in edge devices [2]. This offers compelling solutions for latency and energy consumption issues in scenarios such as smart industries [3], autonomous driving [4], smart healthcare [5], and smart homes [6]. A core challenge in edge computing is computing offloading, which has been the subject of numerous studies [7]. For instance, reference [8] uses a Dynamic Framing Offloading Algorithm based on Double Deep Q-Network (DFO-DDQN) to solve the latency problem in the Internet of Vehicles, while reference [9] employs an improved Binary Particle Swarm Optimization algorithm to tackle latency and energy consumption issues in industrial equipment. Despite the extensive research [10] on various problems in many scenarios, studies focusing specifically on forestry remain limited. Therefore, this paper aims to fill this gap by investigating computational offloading in forest monitoring networks.
In forest monitoring networks, dense sensors are deployed to collect information about the surrounding environment and soil and to analyze the results of forest monitoring. Although some tasks can be processed on local devices, complex or delay-sensitive tasks (such as image processing, fire alarm detection, and data analysis) [11] are difficult to complete, owing to the constrained computational capacity of the sensors. Moreover, frequent computations can significantly shorten the working duration of battery-powered sensors, posing challenges for ensuring service quality in forest monitoring networks. To address these issues, sensors can offload tasks to servers to minimize computation latency and energy usage. However, how to perform task offloading in the monitoring network while guaranteeing the service quality of the sensors requires the formulation of reasonable offloading decisions. When determining offloading targets, it is essential to consider how signal loss in the communication link affects transmission rates. In forest environments, complex conditions can impact the propagation of wireless signals. Obstacles like trees and rocks can cause signal attenuation, and the signal strength may decrease due to factors such as propagation distance and reflections or refractions on objects [12]. Additionally, the computational and communication resources allocated by each edge server and base station for processing offloaded tasks are limited. Therefore, how to allocate CPU resources and signal bandwidth effectively in edge services to reduce task latency and power consumption is the primary issue addressed in this study.
In addressing the previously mentioned issues, this paper considers the effects of path loss and multipath fading introduced by forest environments in the calculation of transmission rates. We establish a computational offloading model tailored for forest scenarios, where the model primarily constrains the computational resources of edge servers and communication bandwidth. The objective is to minimize the overall system expense, which comprises both latency and energy consumption. This optimization problem is classified as NP-hard. To effectively tackle this problem, we propose an offloading strategy based on an improved dung beetle optimization algorithm with symmetry features. The search range symmetry of DBO algorithm can comprehensively search for feasible solutions. And the improved algorithm initializes the population using an advanced circle chaotic mapping technique, thereby optimizing the quality of the initial population. Additionally, a dimensional decomposition strategy is employed during individual position updates to enhance the optimization capability. To overcome the drawbacks of the original algorithm’s tendency to converge to local optima, we incorporate Cauchy perturbation techniques to escape these local optima. Experimental results demonstrate that, compared to local offloading strategies, other metaheuristic algorithms, and the offloading strategies of DBO, IDBO exhibits significant advantages in both optimization convergence and solution quality. IDBO provides superior decision-making for offloading issues within forest monitoring networks. Therefore, the contributions of this paper are as follows:
  • A forest monitoring network task offloading model was designed to study the decision-making problem of sensor task offloading in the monitoring network. A method was proposed to simulate the impact of complex underground environments in mountainous forests on communication rates by incorporating path loss and multipath fading effects. The offloading decision problem of rational resource allocation is formulated as a multi-constraint minimum cost (consisting of latency and energy consumption) optimization problem to be solved.
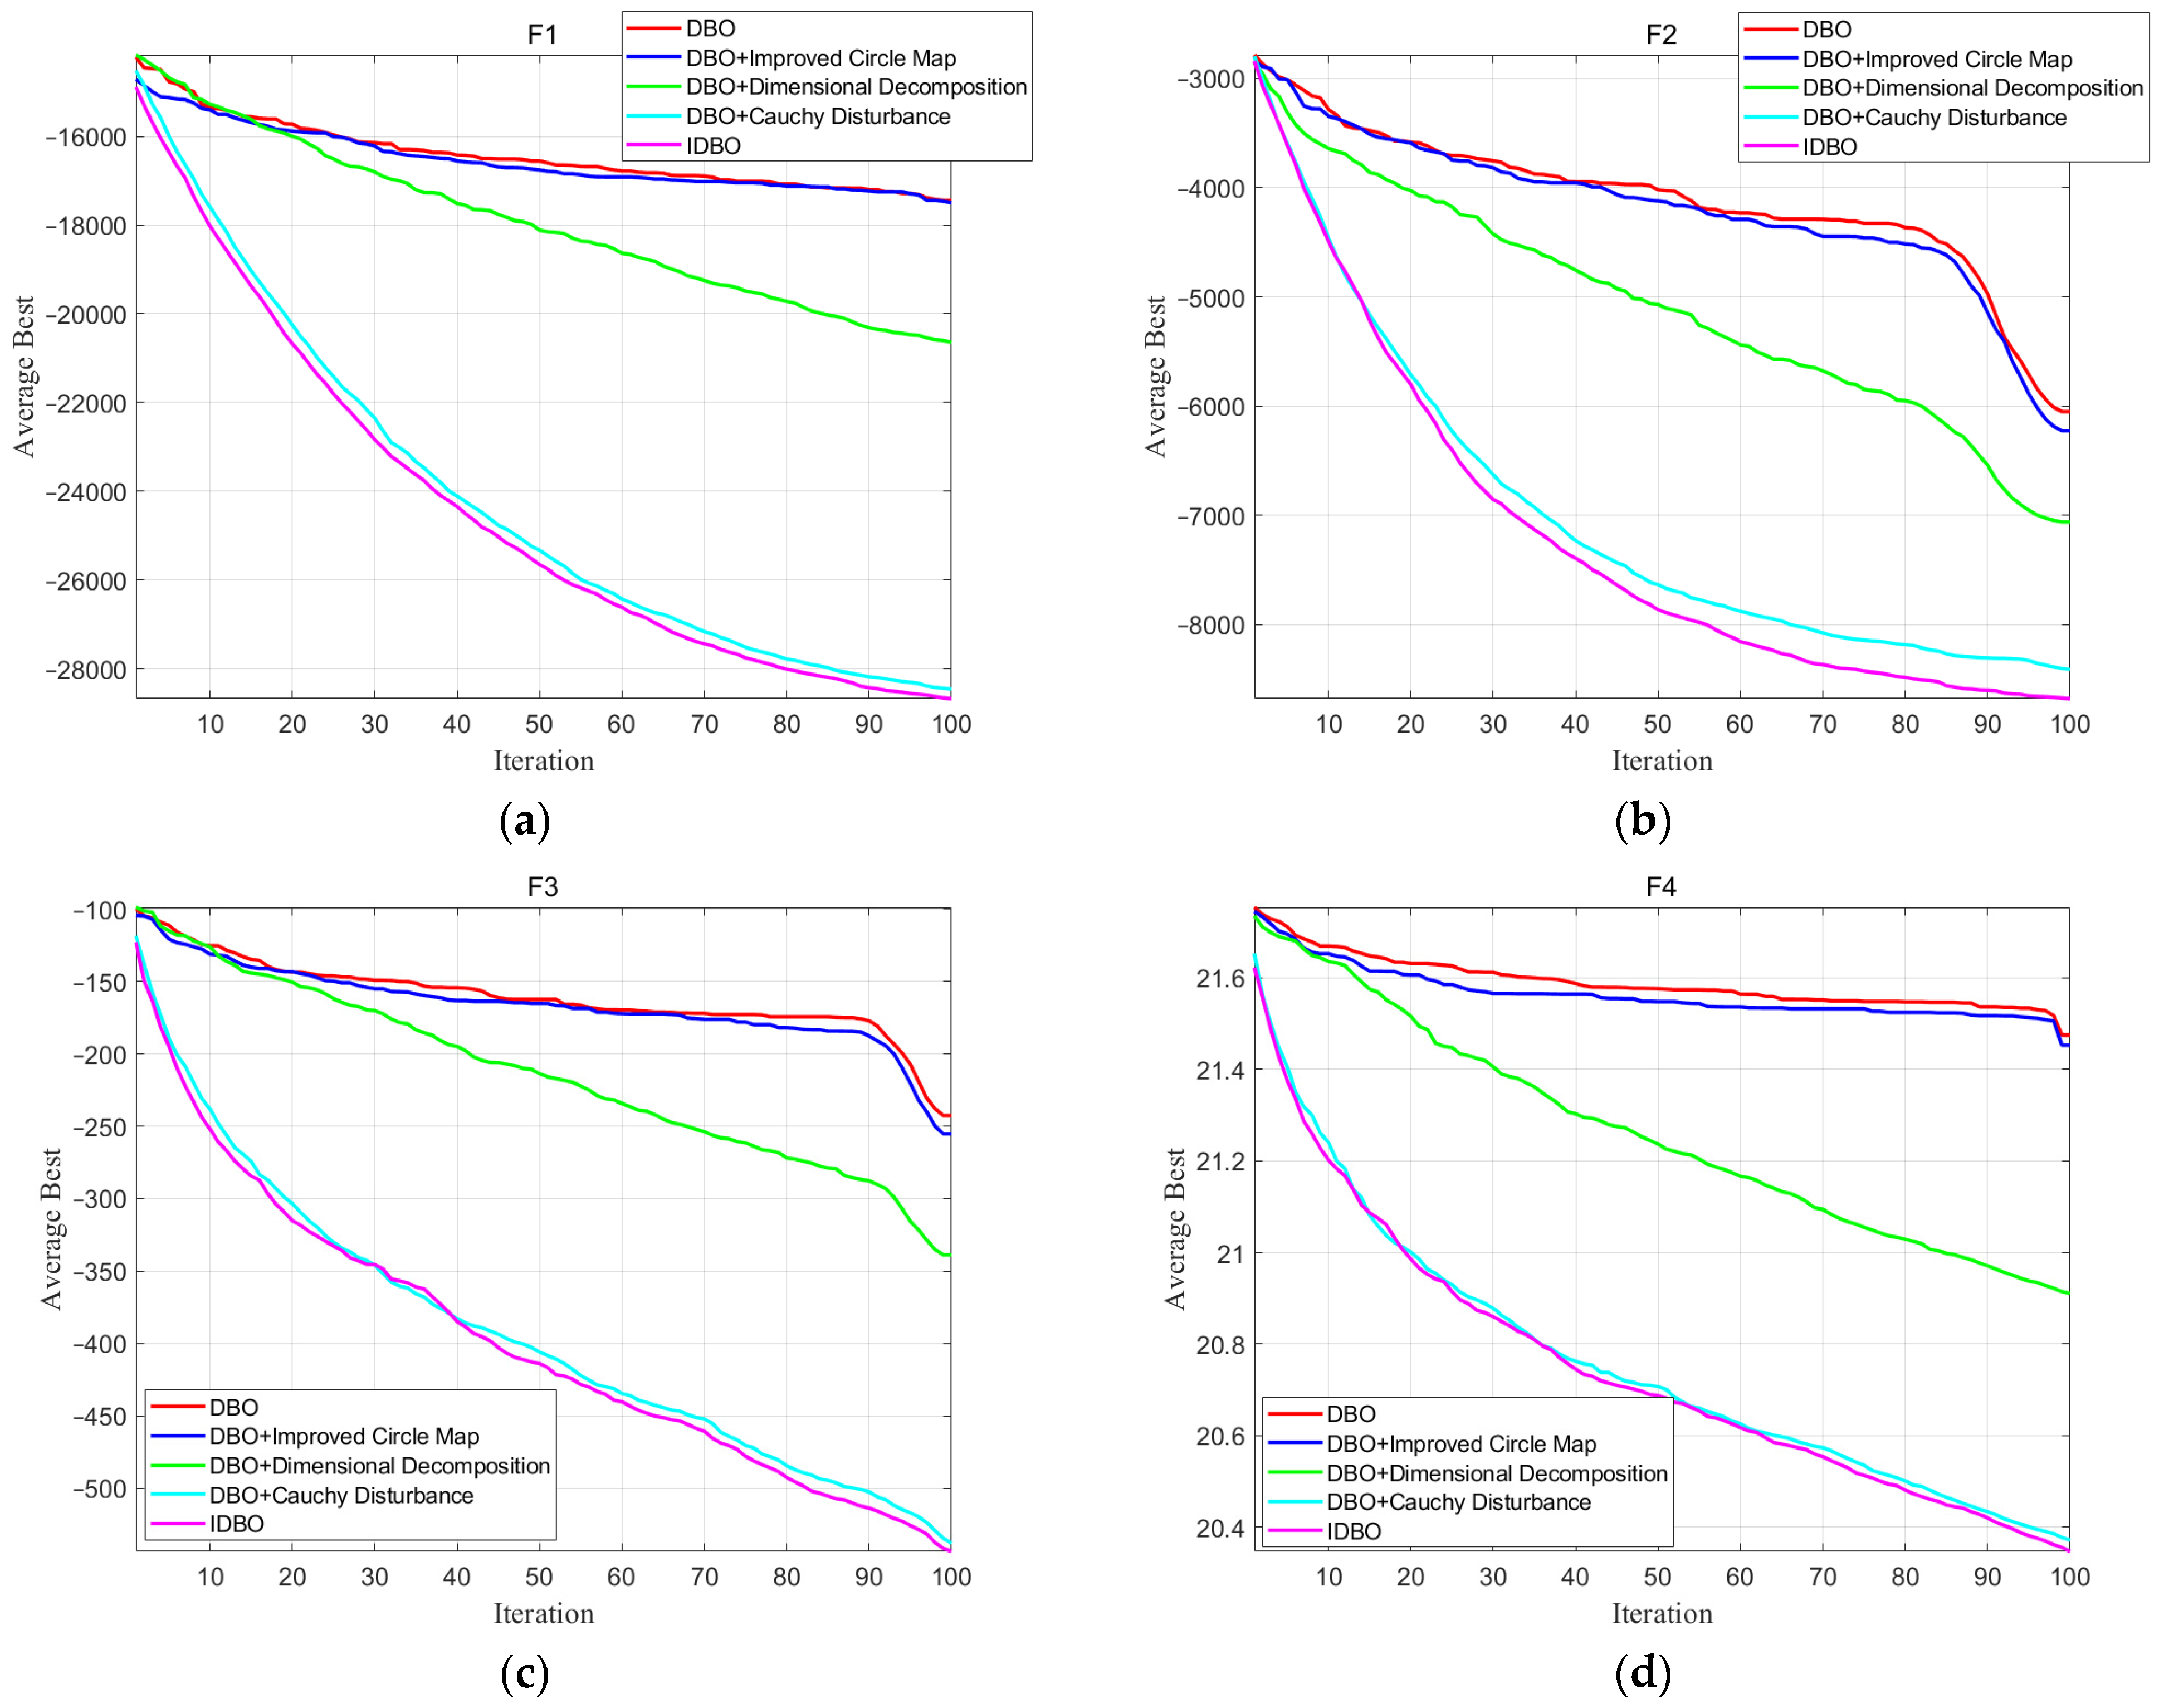
  • The cost optimization problem with multiple constraints is an NP-hard problem, and we propose the DBO algorithm to solve it. We improve the algorithm using an improved circle chaotic map, dimension decomposition strategy, and Cauchy perturbation strategy and demonstrate the effectiveness of the improvement measures using test functions.
  • Design simulation experiments to showcase the effectiveness of the IDBO algorithm in offloading tasks in forest monitoring networks. The experimental results show that, compared with local computing and other heuristic algorithms, the IDBO algorithm has excellent performance in offloading tasks in forest monitoring networks and can make better decisions. Finally, we discussed the limitations of IDBO and future work.

2. Related Work

In recent years, computational offloading has become a prominent topic in edge computing research. As a result, numerous researchers have conducted extensive studies on this issue [13,14,15].
In the study of optimization objectives, Yang et al. [16] addressed the demands of delay-sensitive tasks by selecting the shortest offloading time as a performance metric, formulating the offloading strategy as a Markov decision process (MDP), and employing an iterative algorithm for resolution. The results showed that this strategy optimizes traditional approaches. Huang et al. [17] focused on minimizing latency by training a Deep Neural Network (DNN) in a new MEC task scenario with a limited number of training samples. Dai et al. [18] proposed a multi-user edge cloud orchestration network and utilized a Deep Reinforcement Learning (DRL)-based approach to perform computational offloading and resource allocation under latency constraints, thereby minimizing energy consumption. The findings from real datasets demonstrated that this algorithm outperformed baseline strategies. Guo et al. [19] investigated the co-operative computational offloading problem in a centralized cloud and MEC environment under multi-channel interference, framing it as a constrained optimization problem aimed at minimizing energy consumption. They proposed an approximate co-operative offloading scheme based on a greedy strategy, combined with game theory to develop a distributed co-operative offloading strategy that optimizes system energy consumption. The results demonstrated superior offloading performance compared to existing MEC solutions under scenarios with a high number of computational tasks.
Many researchers have improved the heuristic algorithm and applied it to the offloading of edge computing. Dong et al. [20] applied quantum particle swarm optimization in a multi-user, multi-server context, achieving significant reductions in system energy consumption, task completion time, and performance duration compared to other methods. Mahenge et al. [21], while considering subcarrier, power, and bandwidth resource allocation, formulated an optimization problem focused on minimizing energy while accounting for latency constraints. They introduced a hybrid optimization method based on particle swarm optimization (PSO) and grey wolf optimization (GWO) for resolving resource allocation challenges, with results showcasing improved energy efficiency. Guo et al. [22] studied MEC systems with small cell networks (SCNs), targeting energy consumption minimization as an optimization goal. They introduced a combined genetic algorithm (GA) and PSO approach to design a suboptimal algorithm for jointly optimizing task offloading and computation resource distribution, thereby minimizing total energy consumption across all terminals. This illustrates that many researchers continue to enhance and optimize through traditional metaheuristic algorithms.
Various methods are applied in various application scenarios. Deng et al. [23] proposed two partial offloading approaches utilizing Q-learning and DDPG algorithms, targeting minimal optimization latency in the offloading of computation-intensive tasks within the context of the Industrial Internet of Things (IIoT), while considering various channel conditions and computational resources. Simulation results demonstrated that these two approaches effectively reduce latency in multi-user IIoT MEC systems. Chen et al. [24] introduced a hop-count k selection for candidate offloading vehicles in the vehicular network setting, modeling the problem as a generalized allocation model and proposing offloading strategies based on greedy algorithms and bat algorithms. Simulation results indicated latency performance advantages across varying task quantities, sizes, and required computational capabilities. Yu et al. [25] formulated the problem of UAV offloading as an optimization challenge, viewing the joint placement of IoT tasks across multiple UAVs as a nonconvex issue and utilizing a continuous convex approximation-based effective algorithm to obtain a suboptimal solution. Simulation results confirmed that this method outperforms baseline solutions. Zhao et al. [26] used chaos genetic optimization algorithm (QCGA) in an agricultural drip irrigation and fertilization sensor network to address the task offloading problem of wireless sensors in agriculture. This method improved the genetic algorithm GA and applied it to the task offloading of agricultural drip irrigation and fertilization, reducing the latency of tasks in the network.
Unlike the aforementioned literature, this paper will investigate the offloading scenarios of mountainous forest land that have been less discussed and attempt to optimize the latency and energy consumption in forest monitoring networks using a relatively new heuristic DBO. Additionally, some of the literature ignores the impact of complex environments on communication in complex scenarios, such as the agricultural scenario mentioned above. This paper takes into account this influencing factor in the research.

3. System Model

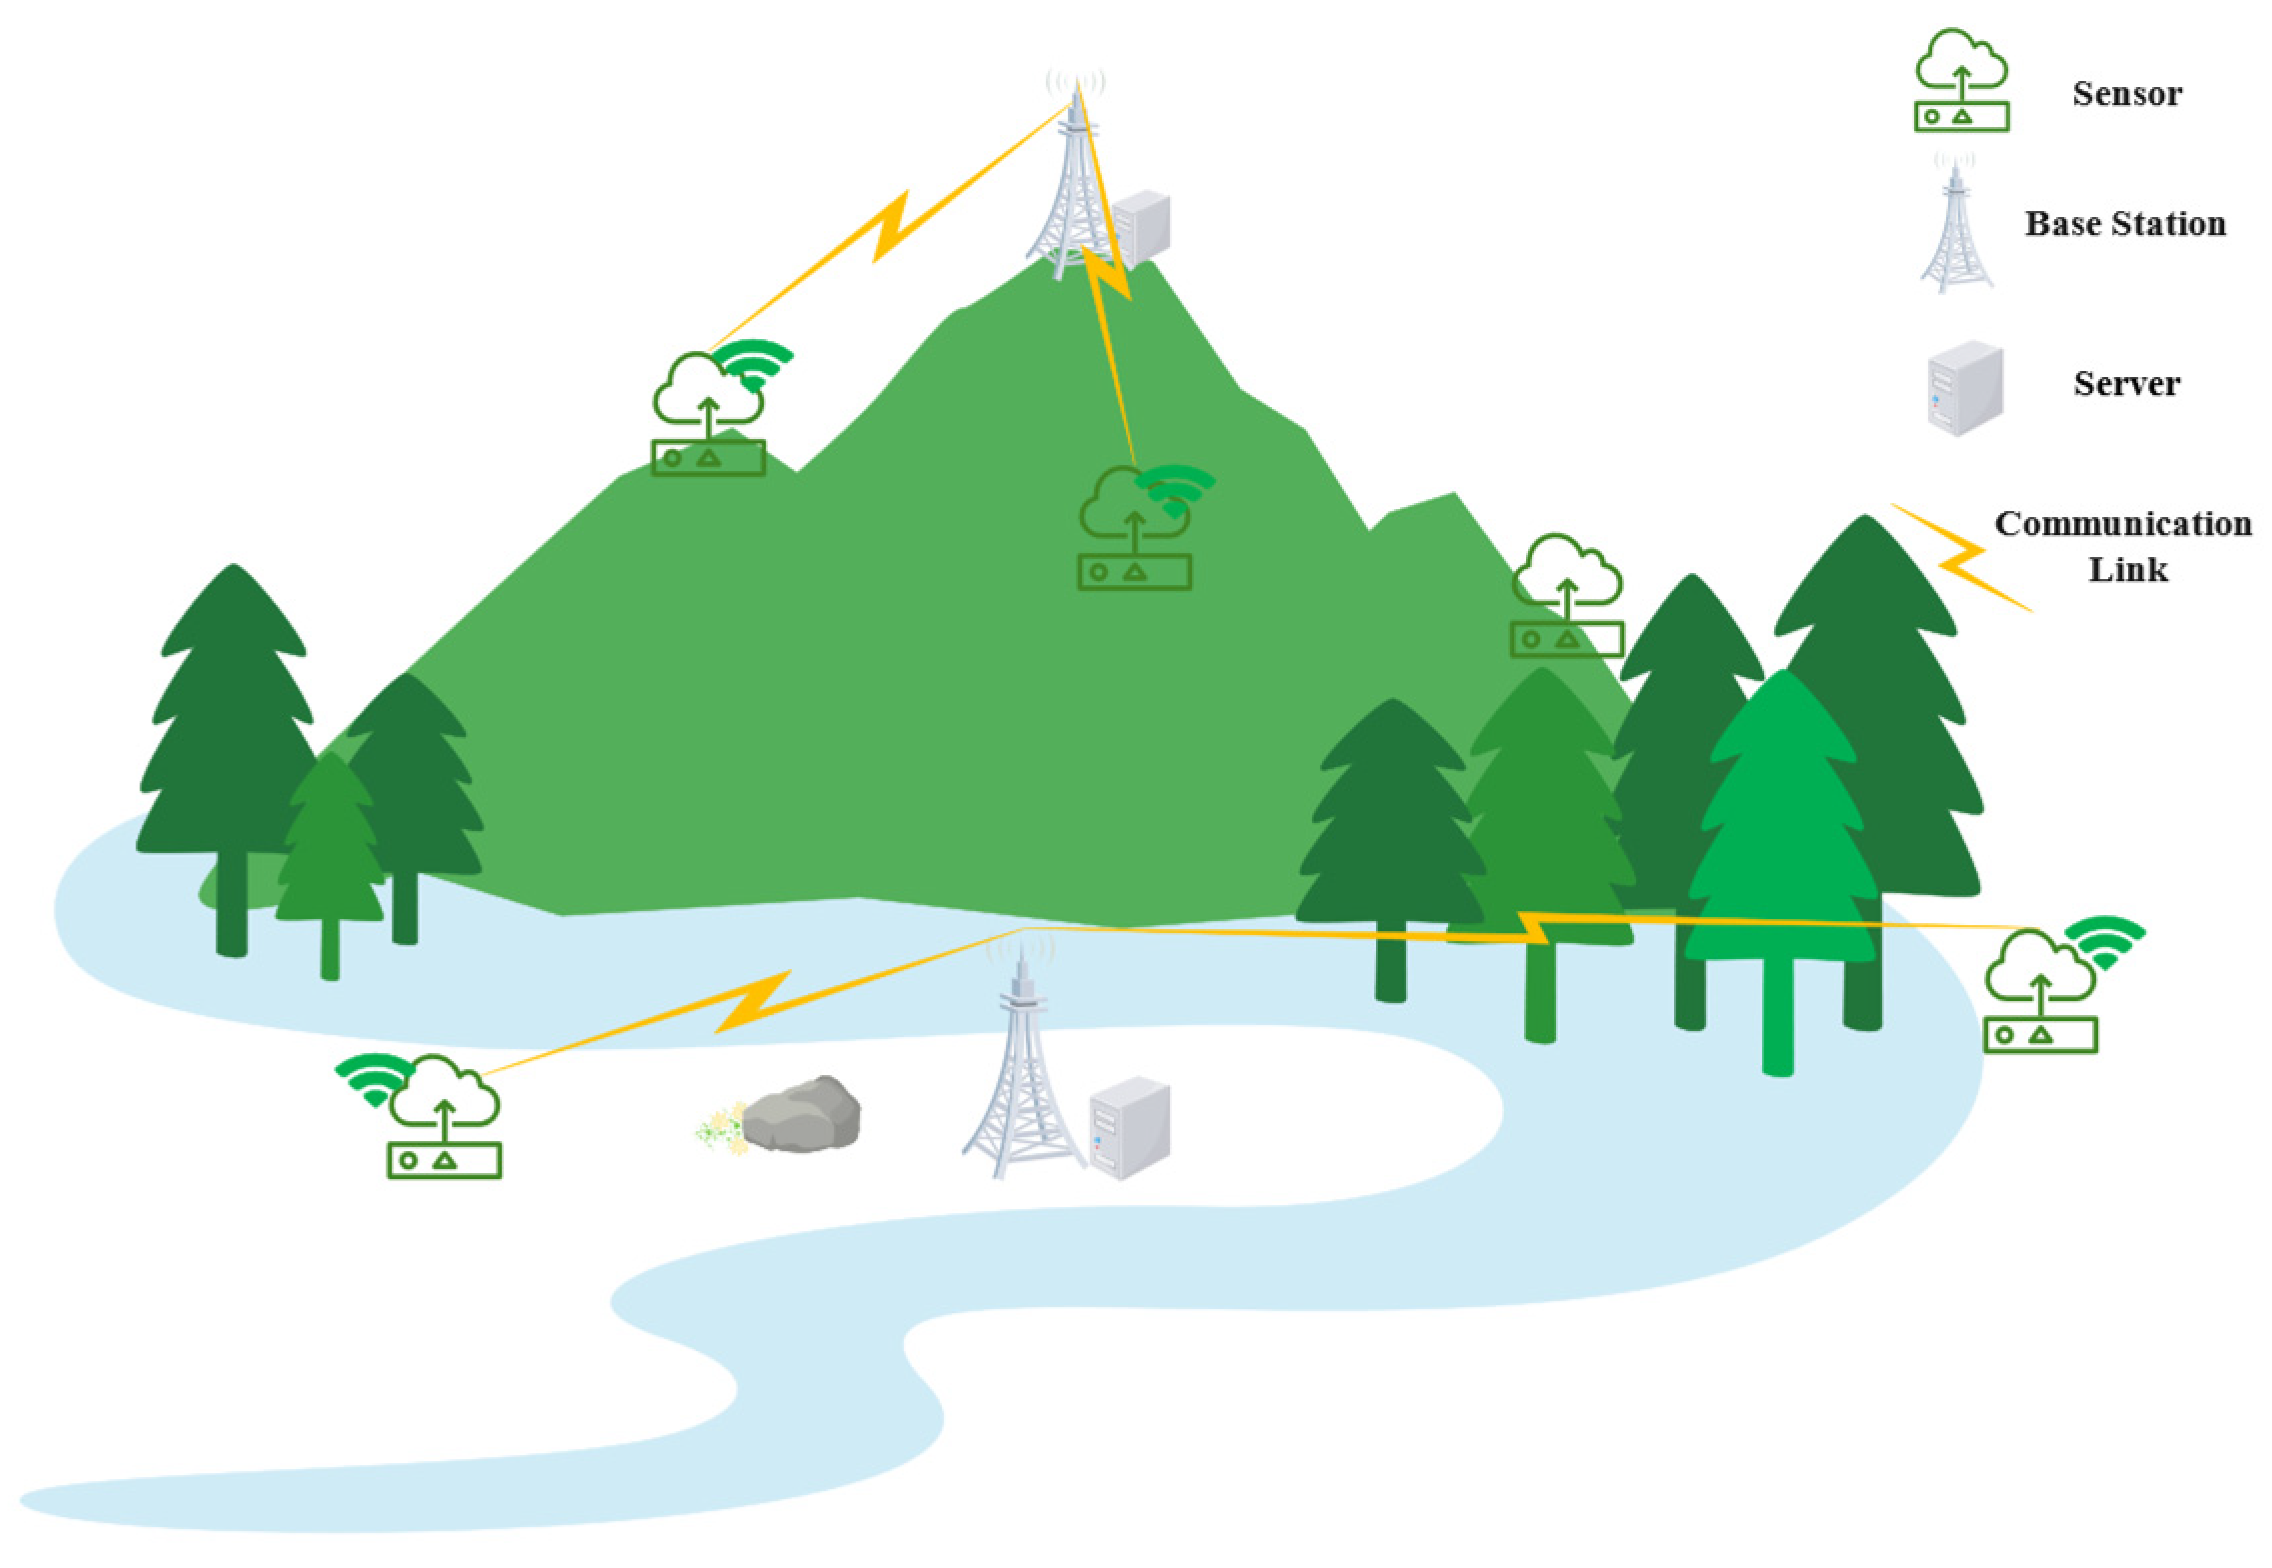
3.1. Scenario Desccription

This paper discusses and establishes a task offloading simulation model using mountainous forest farms in Guangxi as a scenario, assuming this forest area is equipped with a variety of sensors for the collection of diverse data types, including meteorological sensors, soil imaging devices, and fire alarm systems. Additionally, the network is supported by multiple edge computing servers and base stations to enhance data processing capabilities and communication efficiency. The layout of this monitoring network is illustrated in Figure 1. Assuming there are n sensors within the forest area, each device has only one pending task to be processed during a specific time interval, and this task is atomic in nature. We denote the task set as N = 1 , 2 , , n . Furthermore, it is assumed that there are m base stations (BS) and MEC servers distributed throughout the forest area, with the server set represented as M = 1 , 2 , , m . During computation, the devices have the option to transmit the computing tasks to the base station (BS), which can then relay them to an MEC server for processing, returning the results to the device. Alternatively, devices may choose to process tasks locally.
The task i can be described as a set T i = d i , c i , t i max , e i max , where d i represents the data size of task i , c i denotes the CPU cycles required to process one bit of data for task i , t i max indicates the maximum tolerable latency for task i , and e i max signifies the maximum tolerable energy consumption for task i . Let a i , j represent task offloading, the offloading of task i to the server is denoted as a i , j = 1 , while the case where the task is not offloaded to the server is represented as a i , j = 0 , and they satisfy:
a i , j = 1 , j M a i , j = 1 0 , j M a i , j = 0
Then, j = 1 m a i , j = 1 indicates that task i is offloaded for computation to a single server j , while j = 1 m a i , j = 0 represents that the task is computed locally.

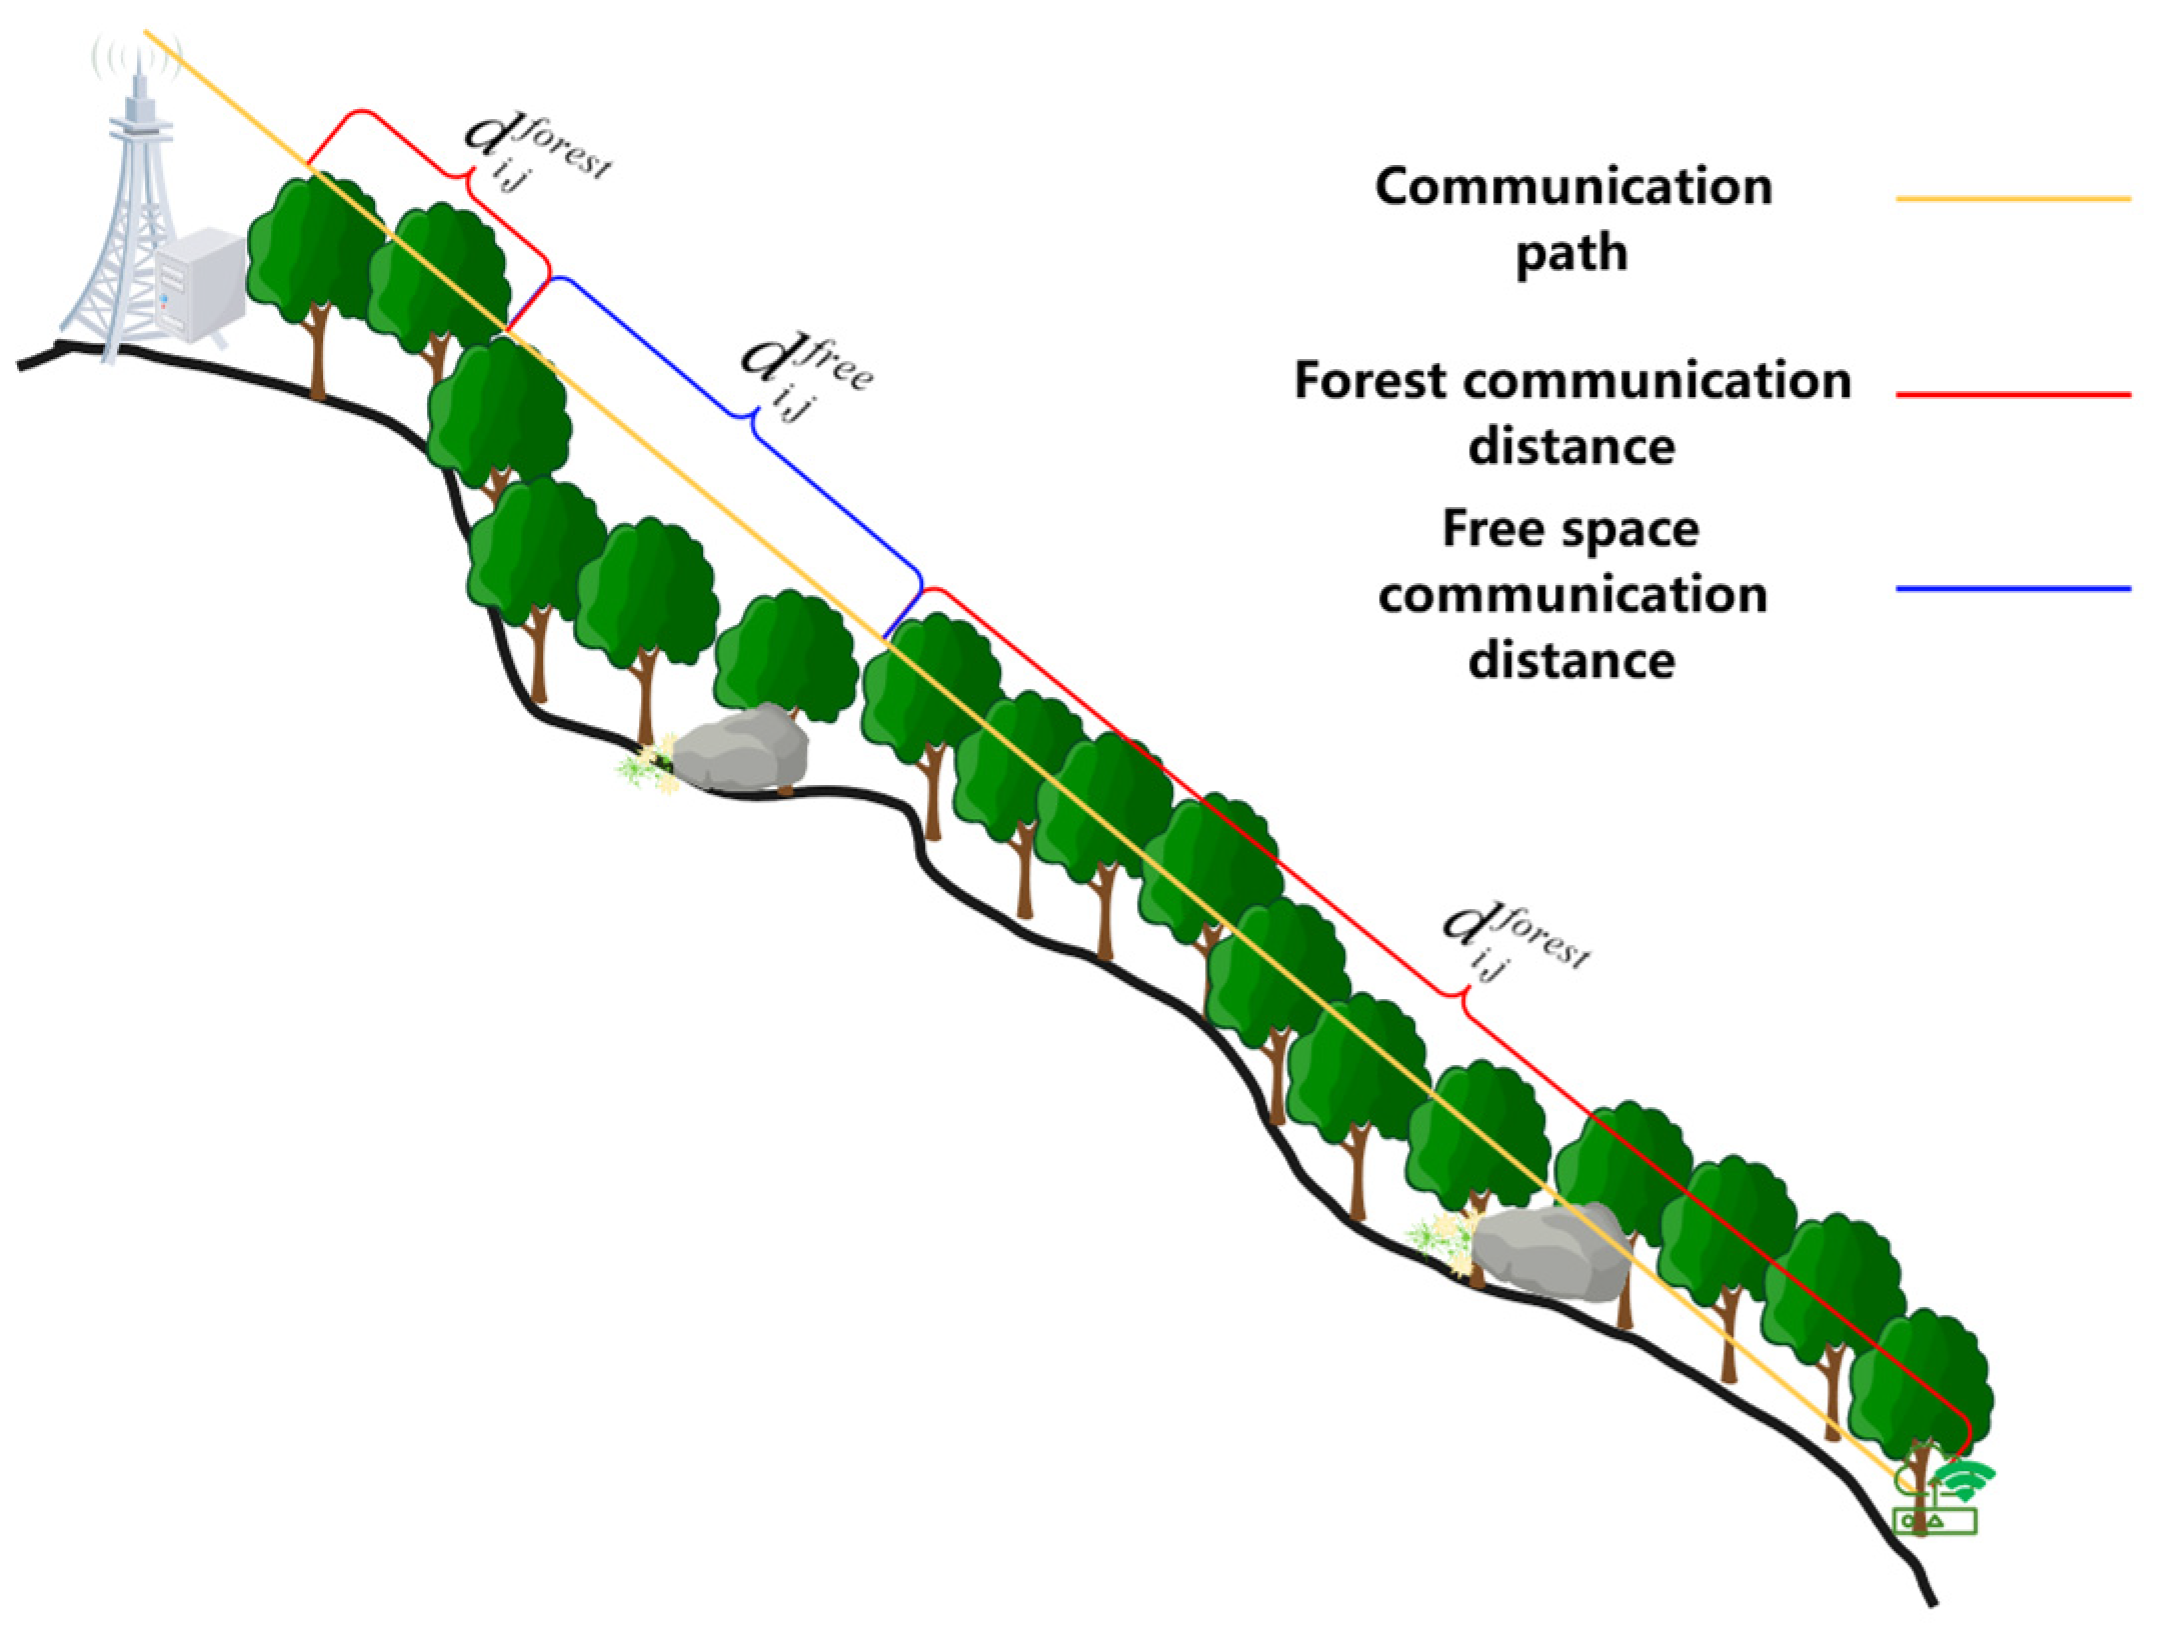
3.2. Communication Model

Let the monitoring network utilize Single-Carrier Frequency-Division Multiple Access (SC-FDM) technology for task data link transmission. Let W denote the system bandwidth available at each base station and let w i represent the bandwidth allocated to task i . The allocated bandwidth w i can then be derived from the following formula:
w i , j = W i N a i , j
where i N a i , j represents the total number of tasks offloaded to service j .
According to Shannon’s formula, as referenced in [27], the transmission rate for tasks transmitted to the MEC server j corresponding to the base station (BS) can be derived as follows:
r i , j = w i , j log 2 ( 1 + p i h i , j n 0 )
where w i , j is the bandwidth allocated to the task, p i is the transmission power of the device hosting task, n 0 is the background noise, and h i , j is the channel gain when task i is transmitted to the server j . The channel experienced during the transmission from the device to the edge server is modeled as a Rayleigh fading channel with forest propagation path loss, which can be calculated using Equation (4):
h i , j = H 2 L o s
In the complex environment of a forest, signal propagation is subject to multipath fading, H adheres to a Rayleigh distribution, and L o s results in path loss during the transmission of tasks i to the server j . The calculation formula for this path loss is as follows:
L o s = L o s fspl ( d i , j free ) + L o s I T U - R ( d i , j forest )
where L o s is the mountain-forest path loss model proposed in [28], which has shown a good fit with real mountainous forest data in experiments. L o s fspl is the free space path loss commonly used for calculating path loss and L I T U - R is the ITU-R empirical path loss model for forested areas. The respective calculation formulas for these models are as follows:
L o s fspl ( d i , j free ) = 32.4 + 20 log ( f ) + 20 log ( d )
L o s I T U - R ( d i , j forest ) = 0.2 × f 0.3 d 0.6
where f is the frequency of the signal and d i , j free and d i , j forest represent the distances over which the signal propagates in free space and within forested areas, respectively, between the device hosting the task i and server j . The signal propagation process is illustrated in Figure 2, where the signal may traverse both free space and forested regions during each propagation event.

3.3. Delay Model

In this paper, the delay in returning data is not considered. Assuming that the task i is processed locally on the device with a CPU frequency of f i l , the computation delay for the task on the local device is:
t i l = d i c i f i l
The task upload delay is mainly determined by the transmission rate r i , j during the signal propagation process; therefore, the transmission delay for uploading the task i to the server j is:
t i , j up = d i r i , j
To simplify the model, the computational resources assigned to the task i when offloaded to the server j are denoted as f i , j s , the edge server j averages the total computational resources among the arriving tasks, and the computation delay for the task on the server is:
t i s = d i c i f i , j s

3.4. Energy Consumption Model

This paper adopts the widely used CPU energy consumption model [29] to calculate the energy consumed by the task i during local computation; thus, the energy consumption formula for local computation is expressed as:
e i l = ε ( f i l ) 2 d i c i
Assuming the transmission power of the device i during task transmission is p i , the energy consumption calculation formula for transmitting the task i to the server j is:
e i up = p i t i up

4. Problem Formulation and Solution

Based on the system model, the computation offloading problem is formulated as an optimization problem constrained by computation resources, communication resources, and other factors. Subsequently, a complexity analysis of the formulated problem is conducted, followed by the proposal of IDBO algorithm to solve the problem.

4.1. Problem Formulation

Based on the aforementioned model, when a task i is offloaded to the server j , the total latency of the task is primarily composed of the server execution latency t i s and the data upload latency t i up . The energy consumption is mainly attributed to the energy expended during data transmission e i up . When the task opts for local computation, the latency is determined by the execution time t i l on the local device e i up . Therefore, the execution latency T i and energy consumption E i of the task i can be expressed as follows:
T i = δ t ω j M a i , j t i up + t i s + 1 j M a i , j t i l
E i = δ e ( 1 ω ) j M a i , j e i up + ( 1 j M a i , j ) e i l
where δ t and δ e represent the adjustment factors for delay and energy consumption metrics, respectively. These two factors can adjust the delay and energy consumption values in the model so that the calculated values of delay and energy consumption have a balanced impact on the results of the algorithm. This parameter can adjust the preference for delay and energy consumption during the optimization process. The larger its value, the more it tends to seek results that reduce task delay. Conversely, if its value is lower, it tends to seek results that reduce energy consumption, and ω denotes the weight factor for delay. The weight factors are utilized to modulate the preferences between energy consumption and latency.
Finally, the problem of co-ordinating computational resources and communication resources to reduce energy consumption and latency can be articulated as finding the optimal offloading decision a that minimizes the average cost of all tasks, expressed as Equation (15). In the equation, C 1 denotes the range of weights for energy consumption and delay in the cost function, C 2 indicates that task i adheres to the 0–1 offloading principle, and C 3 and C 4 , respectively, represent the distance from task i to edge server j through of free space and forest. Additionally, C 5 indicates that the computational resources distributed to the number of tasks offloaded to the server are equal to the CPU resources supported by that server, while C 6 signifies that the computational resources allocated to the tasks offloaded to a particular server must not exceed its maximum computational capacity. Furthermore, C 7 must not exceed the device’s maximum transmission power.
P : min a 1 n i N ( T i + E i ) s . t . C 1 : 0 ω 1 C 2 : j M a i , j 0 , 1 , i N C 3 : 0 d i , j free 500 , i N , j M C 4 : 0 d i , j forest 500 , i N , j M C 5 : i N f i , j = F j max , j M C 6 : 0 < p i p max , i N C 7 : i N w i , j = W , i N

4.2. Problem Analysis

The cost, consisting of both latency and energy consumption, comprises the optimization objective. This involves making offloading decisions for tasks within the forest monitoring network, allocating computational and communication resources to the tasks. The problem P is classified as NP-hard, making it impossible to find an optimal solution in polynomial time. Utilizing a metaheuristic algorithm is one approach to tackle NP-hard problems [30]. Therefore, this paper selects the dung beetle optimizer (DBO) for improvement to address the problem. DBO is a collective intelligence optimization algorithm and was proposed by Jiankai Xue et al. in 2022 [31], inspired by the biological behaviors of dung beetles; it has strong optimization abilities and rapid convergence rates, making it widely used to address various types of problems.

4.3. Computing Offloading Strategy Based on DBO

4.3.1. Algorithm Coding

Assuming p represents the dung beetle population, n denotes the number of tasks, m indicates the number of servers, t is the current iteration count, and T max represents the maximum number of iterations. Let X T = X 1 ( t ) , X 2 ( t ) , , X p ( t ) , X T be the dung beetle population, and X i ( t ) = x 1 , x 2 , , x n be the offloading scheme of the i-th dung beetle individual, where x n denotes the offloading location for the n task. Specifically, x n [ 0 , m ] can be expressed as, if the task is executed on the sensor, x i = 0 ; if the task i is offloaded to server m for execution, then x i = m . The mapping of X i ( t ) = x 1 , x 2 , , x n with respect to a is defined as follows:
If x i [ 1 , m ] and a i = a i , 1 , a i , 2 , a i , n , then the conversion between the offloading decisions a i , j and the location of the dung beetle individual is as follows:
a i , j 1 , j = x i , j M 0   , j x i , j M
If x i = 0 , then a i , j = 0 , j M .

4.3.2. Algorithm Fitness

When the latency or energy consumption of task i in the offloading strategy exceeds the maximum tolerable limits, it indicates that the DBO has entered an infeasible solution space. In this context, it is considered to incorporate penalty terms p e n t l y i = p e n i e + p e n i t as a measure for violations within this infeasible region. Here, p e n i t represents the penalty incurred when the total delay of task i exceeds the specified maximum delay, while p e n i e denotes the penalty for the overall energy consumption of task i exceeding the maximum energy limit. The constants g t and g e are the penalty factors associated with delay and energy consumption, respectively. By using penalty factors, the tolerance level for maximum energy consumption or maximum delay can be set during the optimization process, reducing the probability of exceeding the maximum delay or energy consumption in the sought solution, so that the obtained solution is within the range of maximum delay and energy consumption. The calculation formulas for p e n i t and p e n i e are provided in Equations (17) and (18):
p e n i t = 0 , T i T i max g t ( T i T i max ) , T i > T i max
p e n i e = 0 , E i E i max g e ( E i E i max ) , E i > E i max
Assuming the fitness of DBO is denoted as F i t , according to the problem description, the minimization of problem P and the search for the offloading strategy a can be expressed as finding the optimal dung beetle individual and minimizing the fitness value. Consequently, the fitness function of the dung beetle individual i can be formulated as follows:
F i t i ( t ) = 1 n min X i i N ( T i + E i + p e n t l y i )

4.3.3. Offloading Strategy Based on Dung Beetle Optimization

In the DBO algorithm for offloading, the population is categorized into four types: rolling beetles, reproductive beetles, foraging beetles, and kleptomaniac beetles. Each type of beetle simulates one of the four natural behaviors observed in dung beetles, rolling, oviposition, foraging, and stealing, to perform updates on the population’s locations. Finally, a greedy strategy is employed to retain the optimal offloading strategy.
Rolling beetles perform their rolling behavior based on factors such as sunlight and wind direction. To simulate this rolling behavior, it is necessary for the beetles to travel in a designated direction across the entire search space. The position update of the rolling beetles can be expressed as follows:
X i ( t + 1 ) = X i ( t ) + α × k × X i ( t ) + b × Δ X Δ X = X i ( t ) X w
In this equation, t represents the current iteration, k indicates the deviation coefficient, and k ( 0 , 0.2 ) . b is a constant that takes values within the range (0, 1). Furthermore, α is a natural coefficient, assigned a value of −1 or 1, X w indicates the position of the global fitness minimum, and Δ X is used to simulate variations in light intensity. When the beetles encounter obstacles that prevent further movement, they must engage in a dancing behavior to reorient themselves in search of an alternative path. To simulate this dancing behavior, the algorithm utilizes a tangent function to compute the new rolling direction. Consequently, the position update formula for the dancing rolling beetles can be expressed as follows:
X i ( t + 1 ) = X i ( t ) + tan ( θ ) X i ( t ) X i ( t 1 )
where θ 0 , π , when θ = 0 , π / 2 , π remains unchanged.
Breeding beetles in their natural environment select suitable and safe areas for oviposition, which are defined as the boundaries for egg-laying. These boundaries are delineated around the optimal solutions within the breeding beetle population. The specific definition is as follows:
L b * = max ( X * × ( 1 R ) , L b ) U b * = min ( X * × ( 1 + R ) , U b )
where X * denotes the local optimal position of the current breeding population of dung beetles, L b * and U b * are the lower and upper bounds of the oviposition area, respectively, and L P and U P represent the lower and upper bounds of the optimization problem, respectively. The calculation formula for R is given by:
R = 1 t 3 T max
Once the oviposition site is identified, the breeding dung beetles will choose to lay their eggs in the egg balls within this region. As indicated by Equation (24), the exploration area of the breeding dung beetles undergoes dynamic changes. The update equation for the oviposition location of the breeding dung beetles is expressed as follows:
X i ( t + 1 ) = X * + b 1 × ( X i ( t ) L b * ) + b 2 × ( X i ( t ) U b * )
Here, b 1 and b 2 represent two distinct random vectors of dimension 1 × D , where D represents the dimensionality of the optimization problem. X i ( t + 1 ) will spawn near X * , which means it will spawn near the local optimum, as shown Figure 3. It lays eggs within a symmetrical circle, resulting in diverse solutions.
Small dung beetles emerge from underground to forage, targeting the optimal foraging area, which is situated around the global optimum solution. The schematic diagram of the foraging behavior of the small dung beetle is shown in Figure 4. The food source of the small dung beetle during foraging is within a range symmetrical to the global optimal position and can comprehensively obtain solutions near the global optimal position. The boundaries of the optimal foraging area for the small dung beetles are specified as follows:
L b b = max ( X b × ( 1 R ) , L b ) U b b = min ( X b × ( 1 + R ) , U b )
where X b denotes the global best position, L b b and U b b represent the lower and upper limits of the optimal foraging area, respectively, and R is as defined above. Therefore, the position update formula for the juvenile dung beetles is:
X i ( t + 1 ) = X i ( t ) + C 1 × ( X i ( t ) L b b ) + C 2 × ( X i ( t ) U b b )
where C 1 denotes a random number that follows a normal distribution and C 2 is a vector belonging to the interval (0, 1). Some beetles, known as pilferers, will steal dung balls from other beetles. denotes the optimal food source and X b is the global best solution. Thief beetles will steal food from this optimal food source. Therefore, the position update information for the thief beetles is defined as follows:
X i ( t + 1 ) = X b + S × g × X i ( t ) X * + X i ( t ) X b
where g is a random vector of dimension 1 × D , which follows a normal distribution, and S represents a natural number.
As shown in Equation (20) and Figure 3 and Figure 4, the rolling beetle considers both directions when rolling the ball, while the breeding beetle and small beetle consider values on both sides of the local optimal solution during the breeding and foraging process. The foraging range and breeding range are symmetrical, and many designs of the DBO algorithm adopt the principle of symmetry. Therefore, in the optimization process, the DBO algorithm makes the obtained solutions more diverse and has stronger convergence. The convergence of the DBO algorithm is better than most algorithms, which is also one of the reasons why this paper chooses the DBO algorithm.
Finally, based on the updated positions, the fitness is calculated. Using a greedy strategy, the positions and fitness of the beetles are updated, culminating in the updates of the global optimal solution and local optimal solutions. The offloading strategy based on DBO involves five steps:
Step 1. Initialization of the beetle population and setting initial parameters;
Step 2. Calculation of initial fitness based on the objective function;
Step 3. Sequentially updating the positions of four types of beetles;
Step 4. Updating the optimal solutions and their fitness;
Step 5. Repeating the aforementioned steps until the maximum number of iterations T max .
The fitness and position update formulas based on the greedy strategy are as follows:
F i t i ( t + 1 ) ( = F i t i ( t + 1 ) , F i t i ( t + 1 ) F i t i ( t ) F i t i ( t ) , F i t i ( t + 1 ) < F i t i ( t )
X i ( t + 1 ) = X i ( t + 1 ) , F i t i ( t + 1 ) F i t i ( t ) X i ( t ) , F i t i ( t + 1 ) < F i t i ( t )

4.4. Improved Beetle Swarm Optimization Algorithm

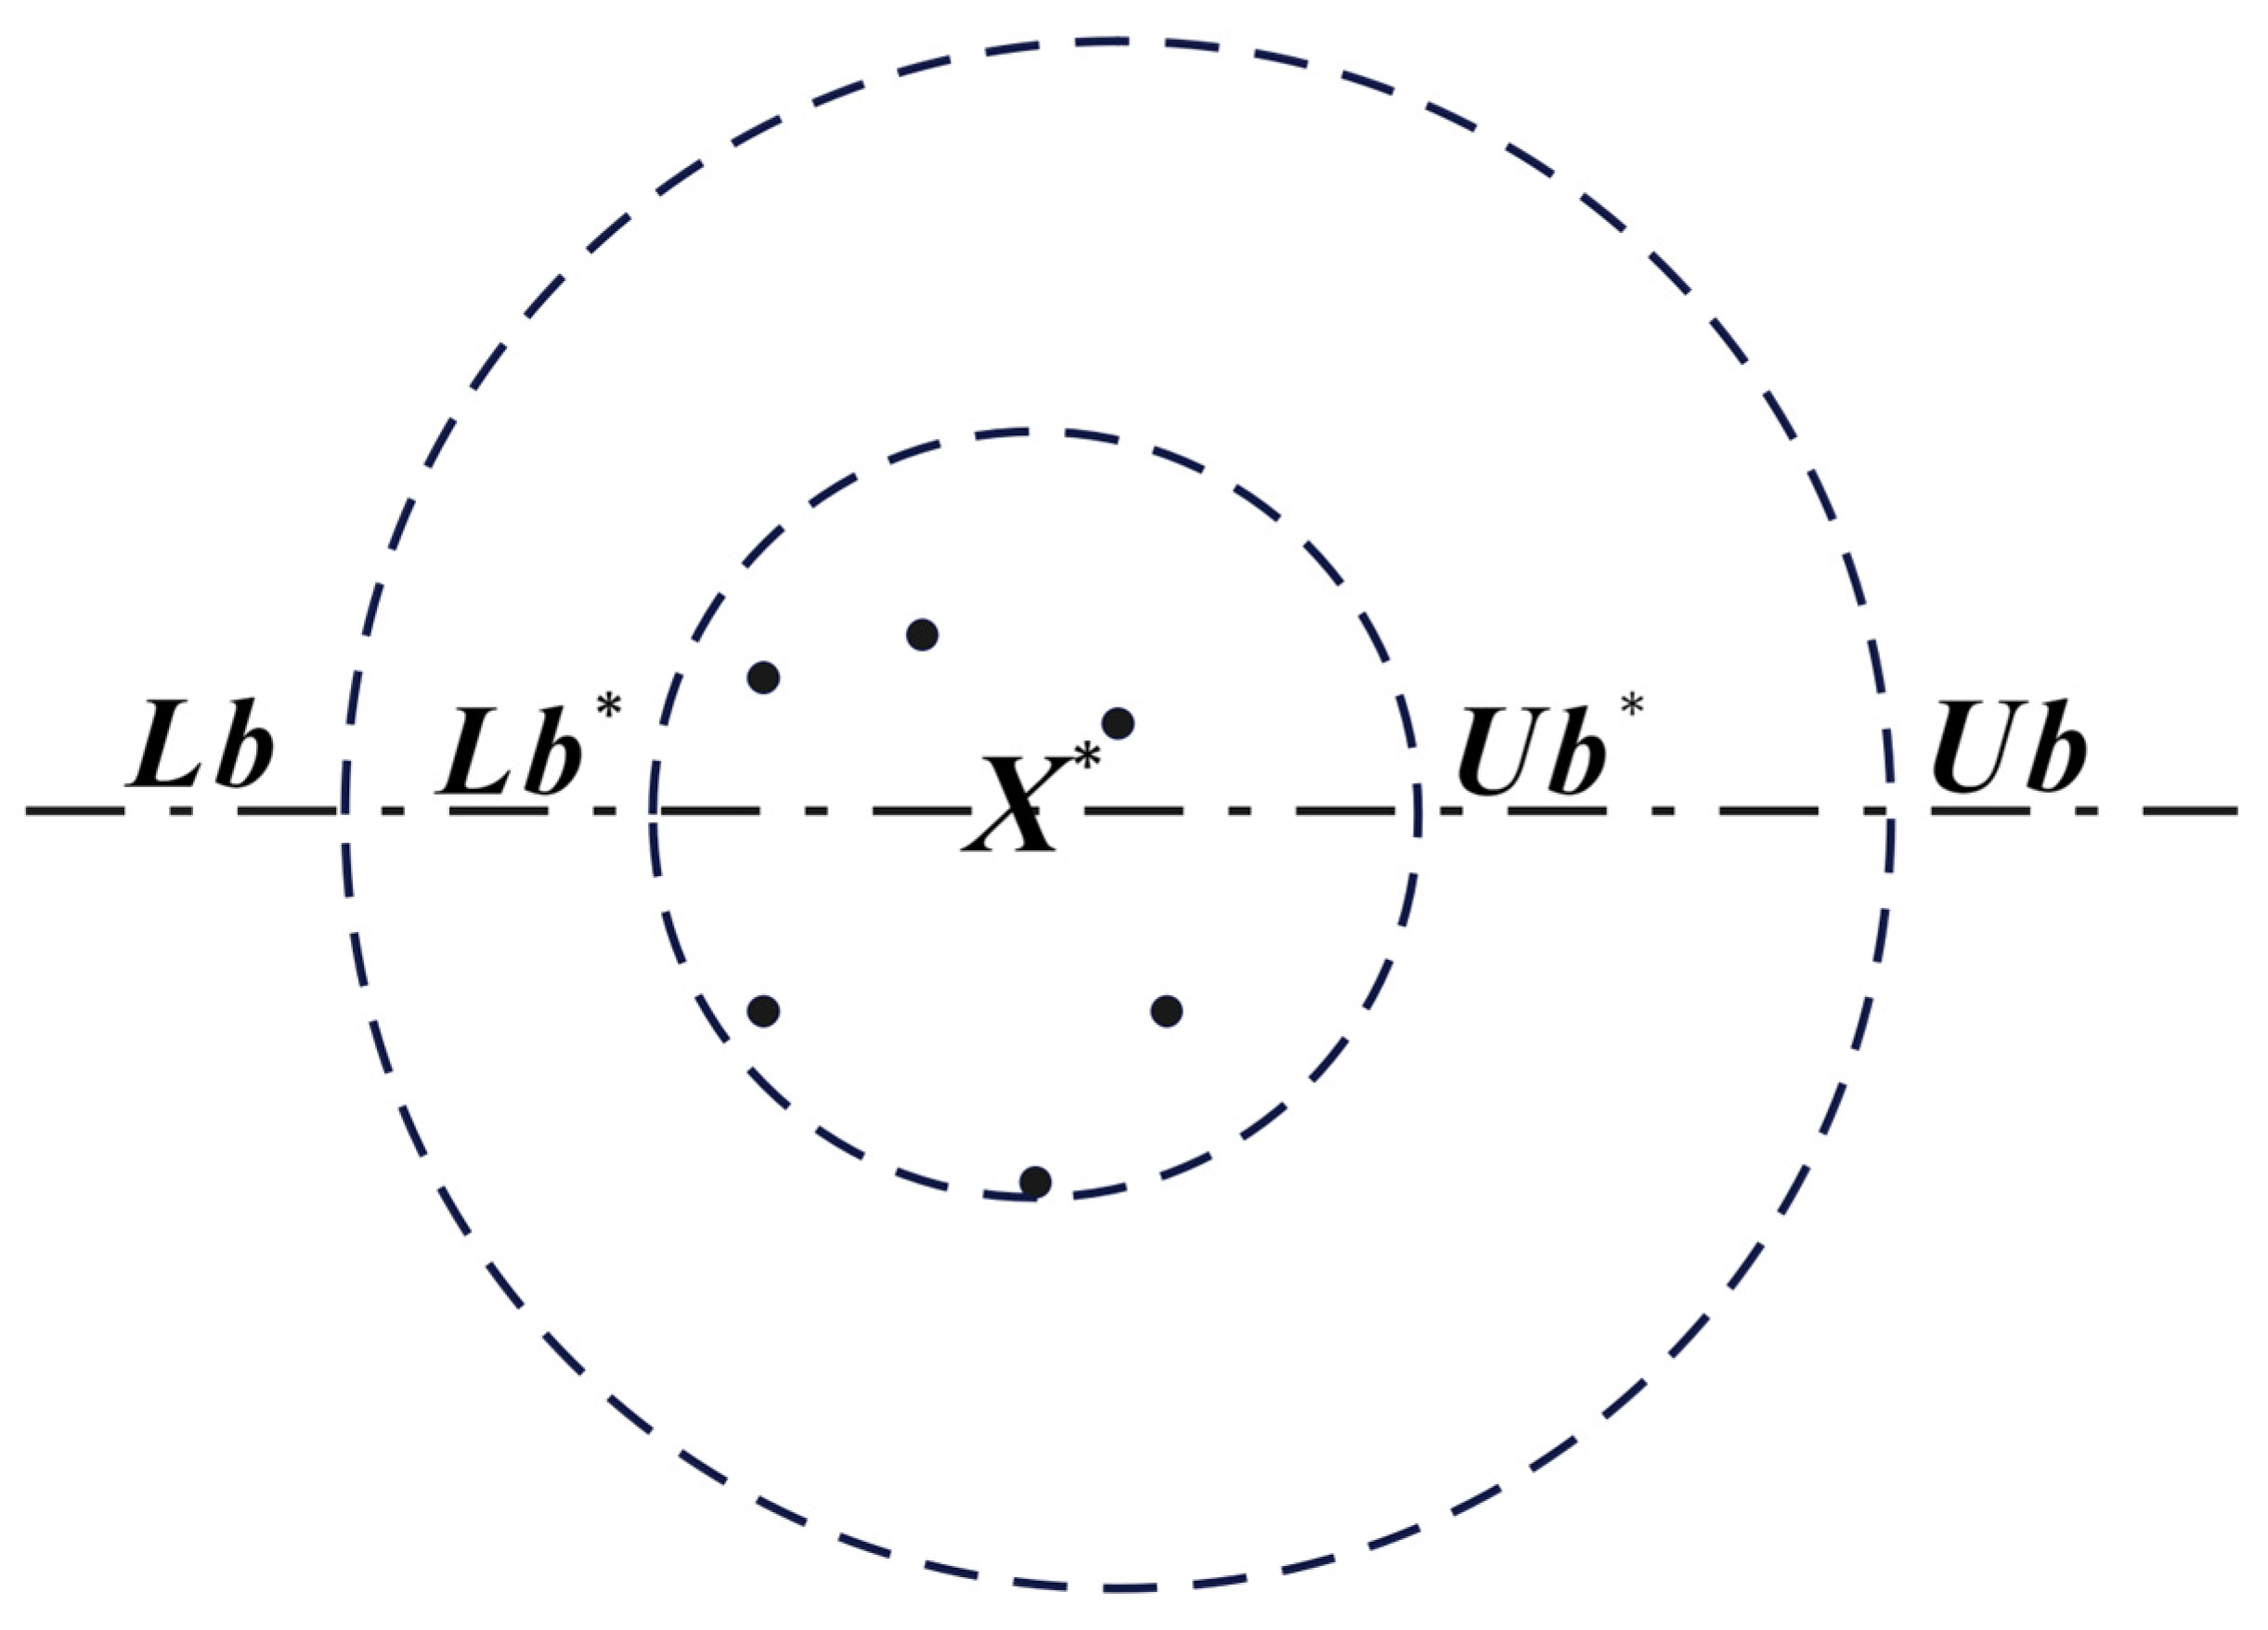
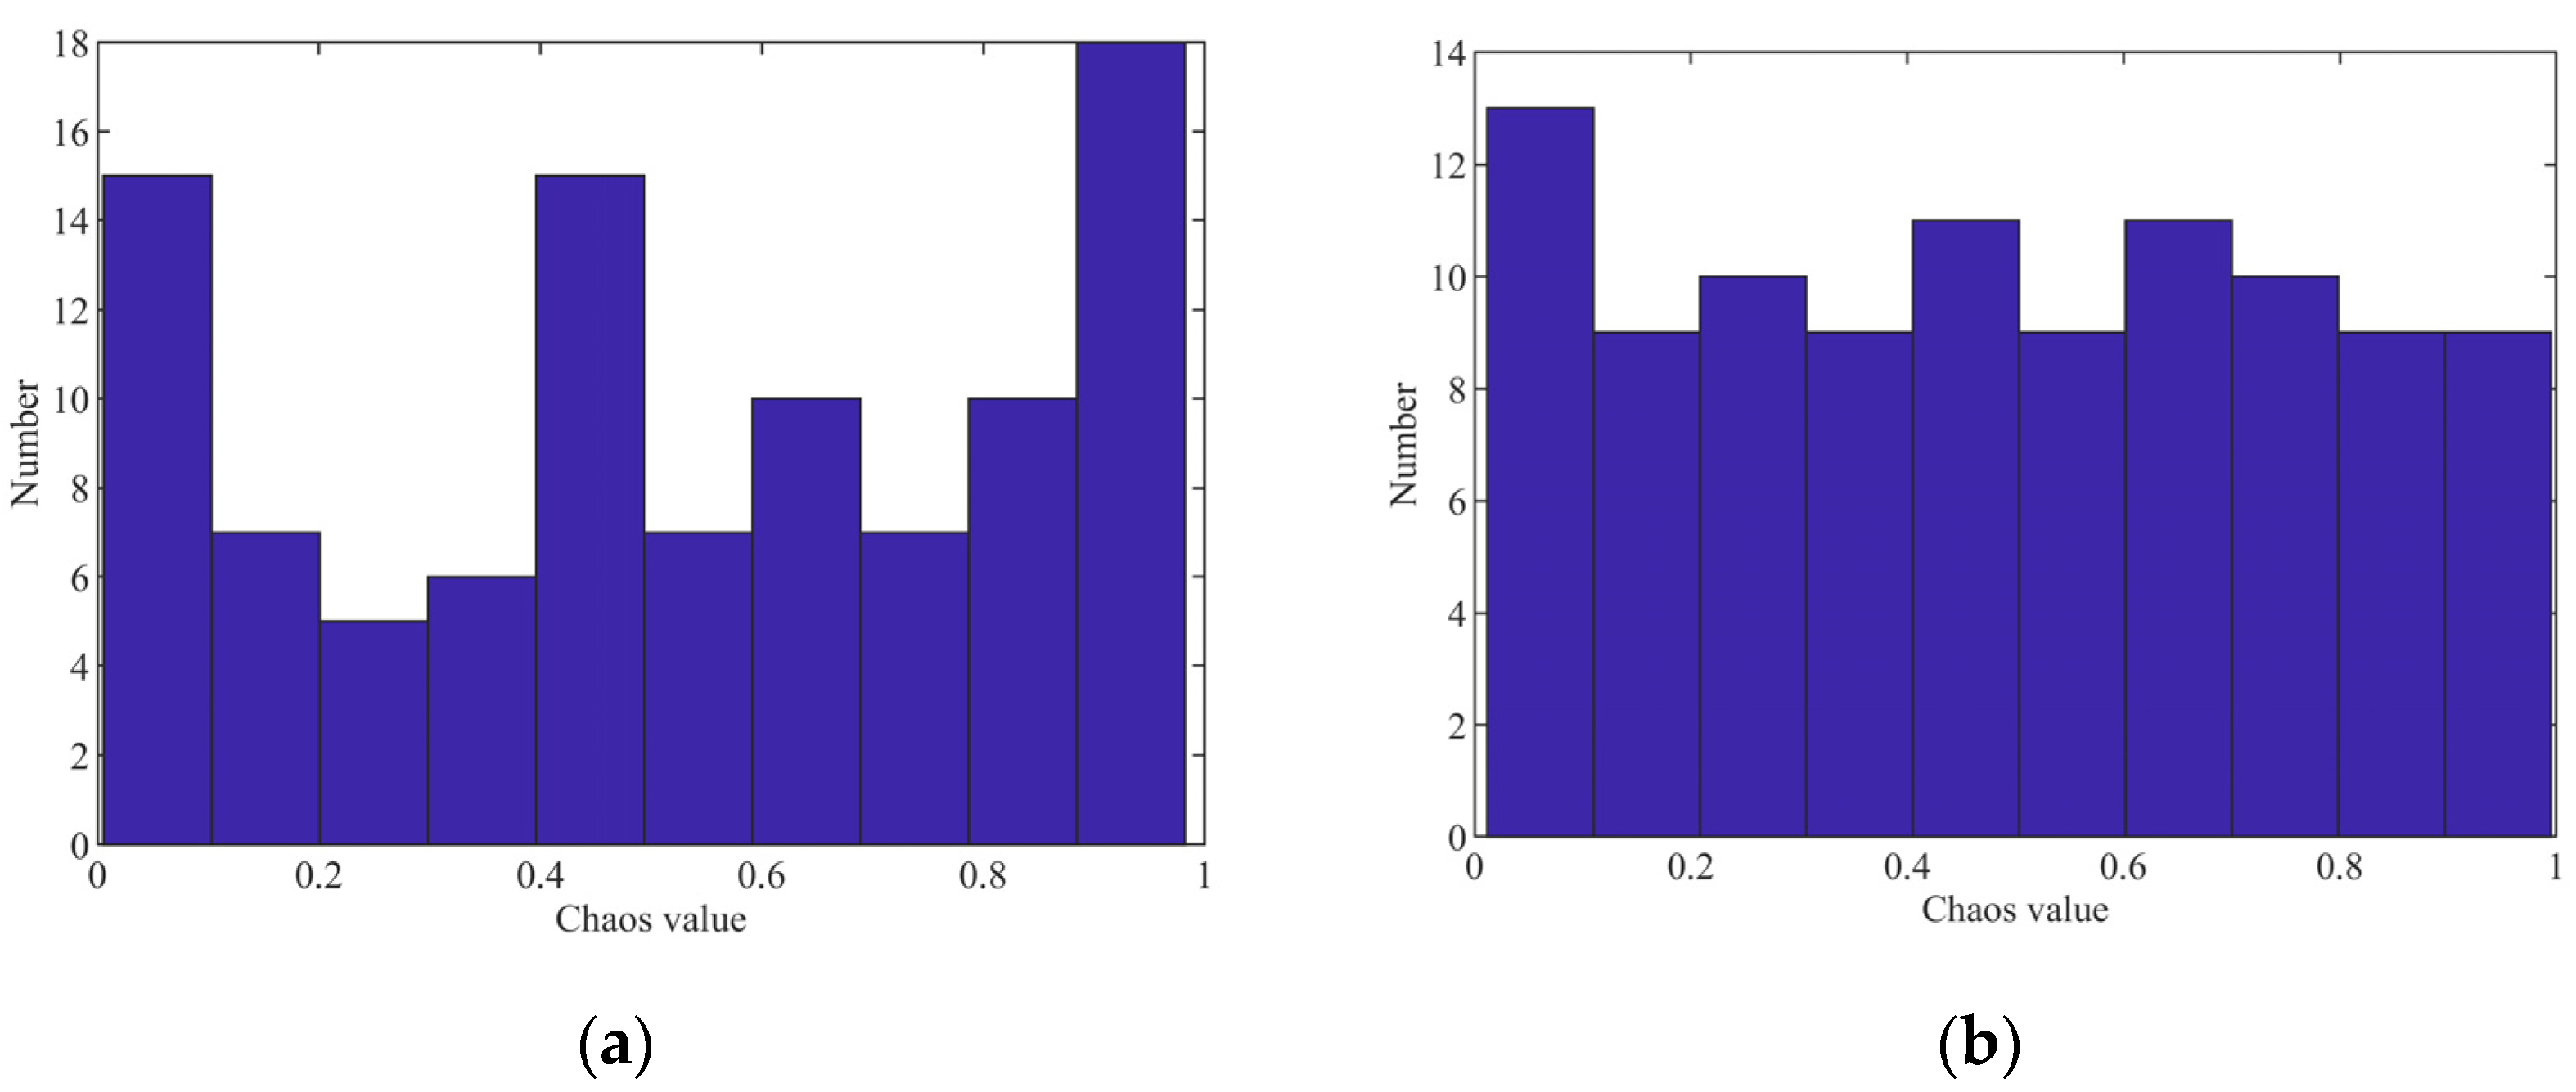
4.4.1. IDBO Population Initialization

The original IDBO algorithm initializes the population using random values, resulting in an uneven and unstable initial population. This paper uses an improved circle map with stable and high coverage of chaotic values. Compared with the circle map, the improved circle map overcomes the disadvantages of dense and uneven distribution of values between [0.2, 0.6]. Introducing an improved circle mapping can increase the variety of the initial population, accelerate the convergence rate, and seek better solutions. The distribution diagram of randomly initialized and improved circle mapping is shown in Figure 5. And the improved circle mapping equation is as follows:
Z i + 1 = mod ( 3.85 Z i + 0.4 0.7 3.85 π sin ( 3.85 π Z i ) , 1 )
where Z 1 = rand ( 1 , n ) , the initialization is as follows:
X i ( 1 ) = ( u b l b ) × Z i + l b
where u b and l b , respectively, are the lower and upper bounds of the search space.

4.4.2. Dimensional Decomposition

In the exploration domain, when reproductive beetles and small beetles seek optimal solutions within a high-dimensional space, the exploration results at each position can impose mutual constraints. Some positions may have already identified superior solutions, while others may provide poorer outcomes, potentially resulting in a decrease in overall fitness relative to previous iterations. Due to the greedy strategy employed, individual beetles tend to retain positions from the prior iteration. Therefore, this paper proposes decomposing the high-dimensional exploration into multiple low-dimensional exploration processes, wherein a subset of positions is randomly selected z from the individuals to participate in the computation during each exploration iteration. This is equivalent to optimizing the objective function of the problem P within a low-dimensional z space. This approach effectively mitigates the challenges typically associated with traditional high-dimensional optimization, allowing for the preservation of better-found solutions. Although this may reduce the number of exploration iterations at each position, it is worthwhile, as it addresses the limitations of DBO in high-dimensional optimization and enhances the roles of these two types of beetles in exploring optimal food source regions. Consequently, we have modified Equations (24) and (26) into Equations (32) and (33):
X i ( t + 1 ) = X * + Q × [ b 1 × ( X i ( t ) L b * ) + b 2 × ( X i ( t ) U b * ) ]
X i ( t + 1 ) = X i ( t ) + Q × [ C 1 × ( X i ( t ) L b b ) + C 2 × ( X i ( t ) U b b ) ]
where Q = q 1 , q 2 , , q n represents the random selection of z positions involved in the update process, where z positions are randomly chosen to take the value of 1 and the remaining positions take the value of 0. Then, q i satisfies:
q i = 1 , i S 0 , i N , i S
where S is the set of positions with a median value of 1 of Q , and the set S and z satisfies:
s i = rand ( 1 , n )
z = round ( 6 5 t T max )

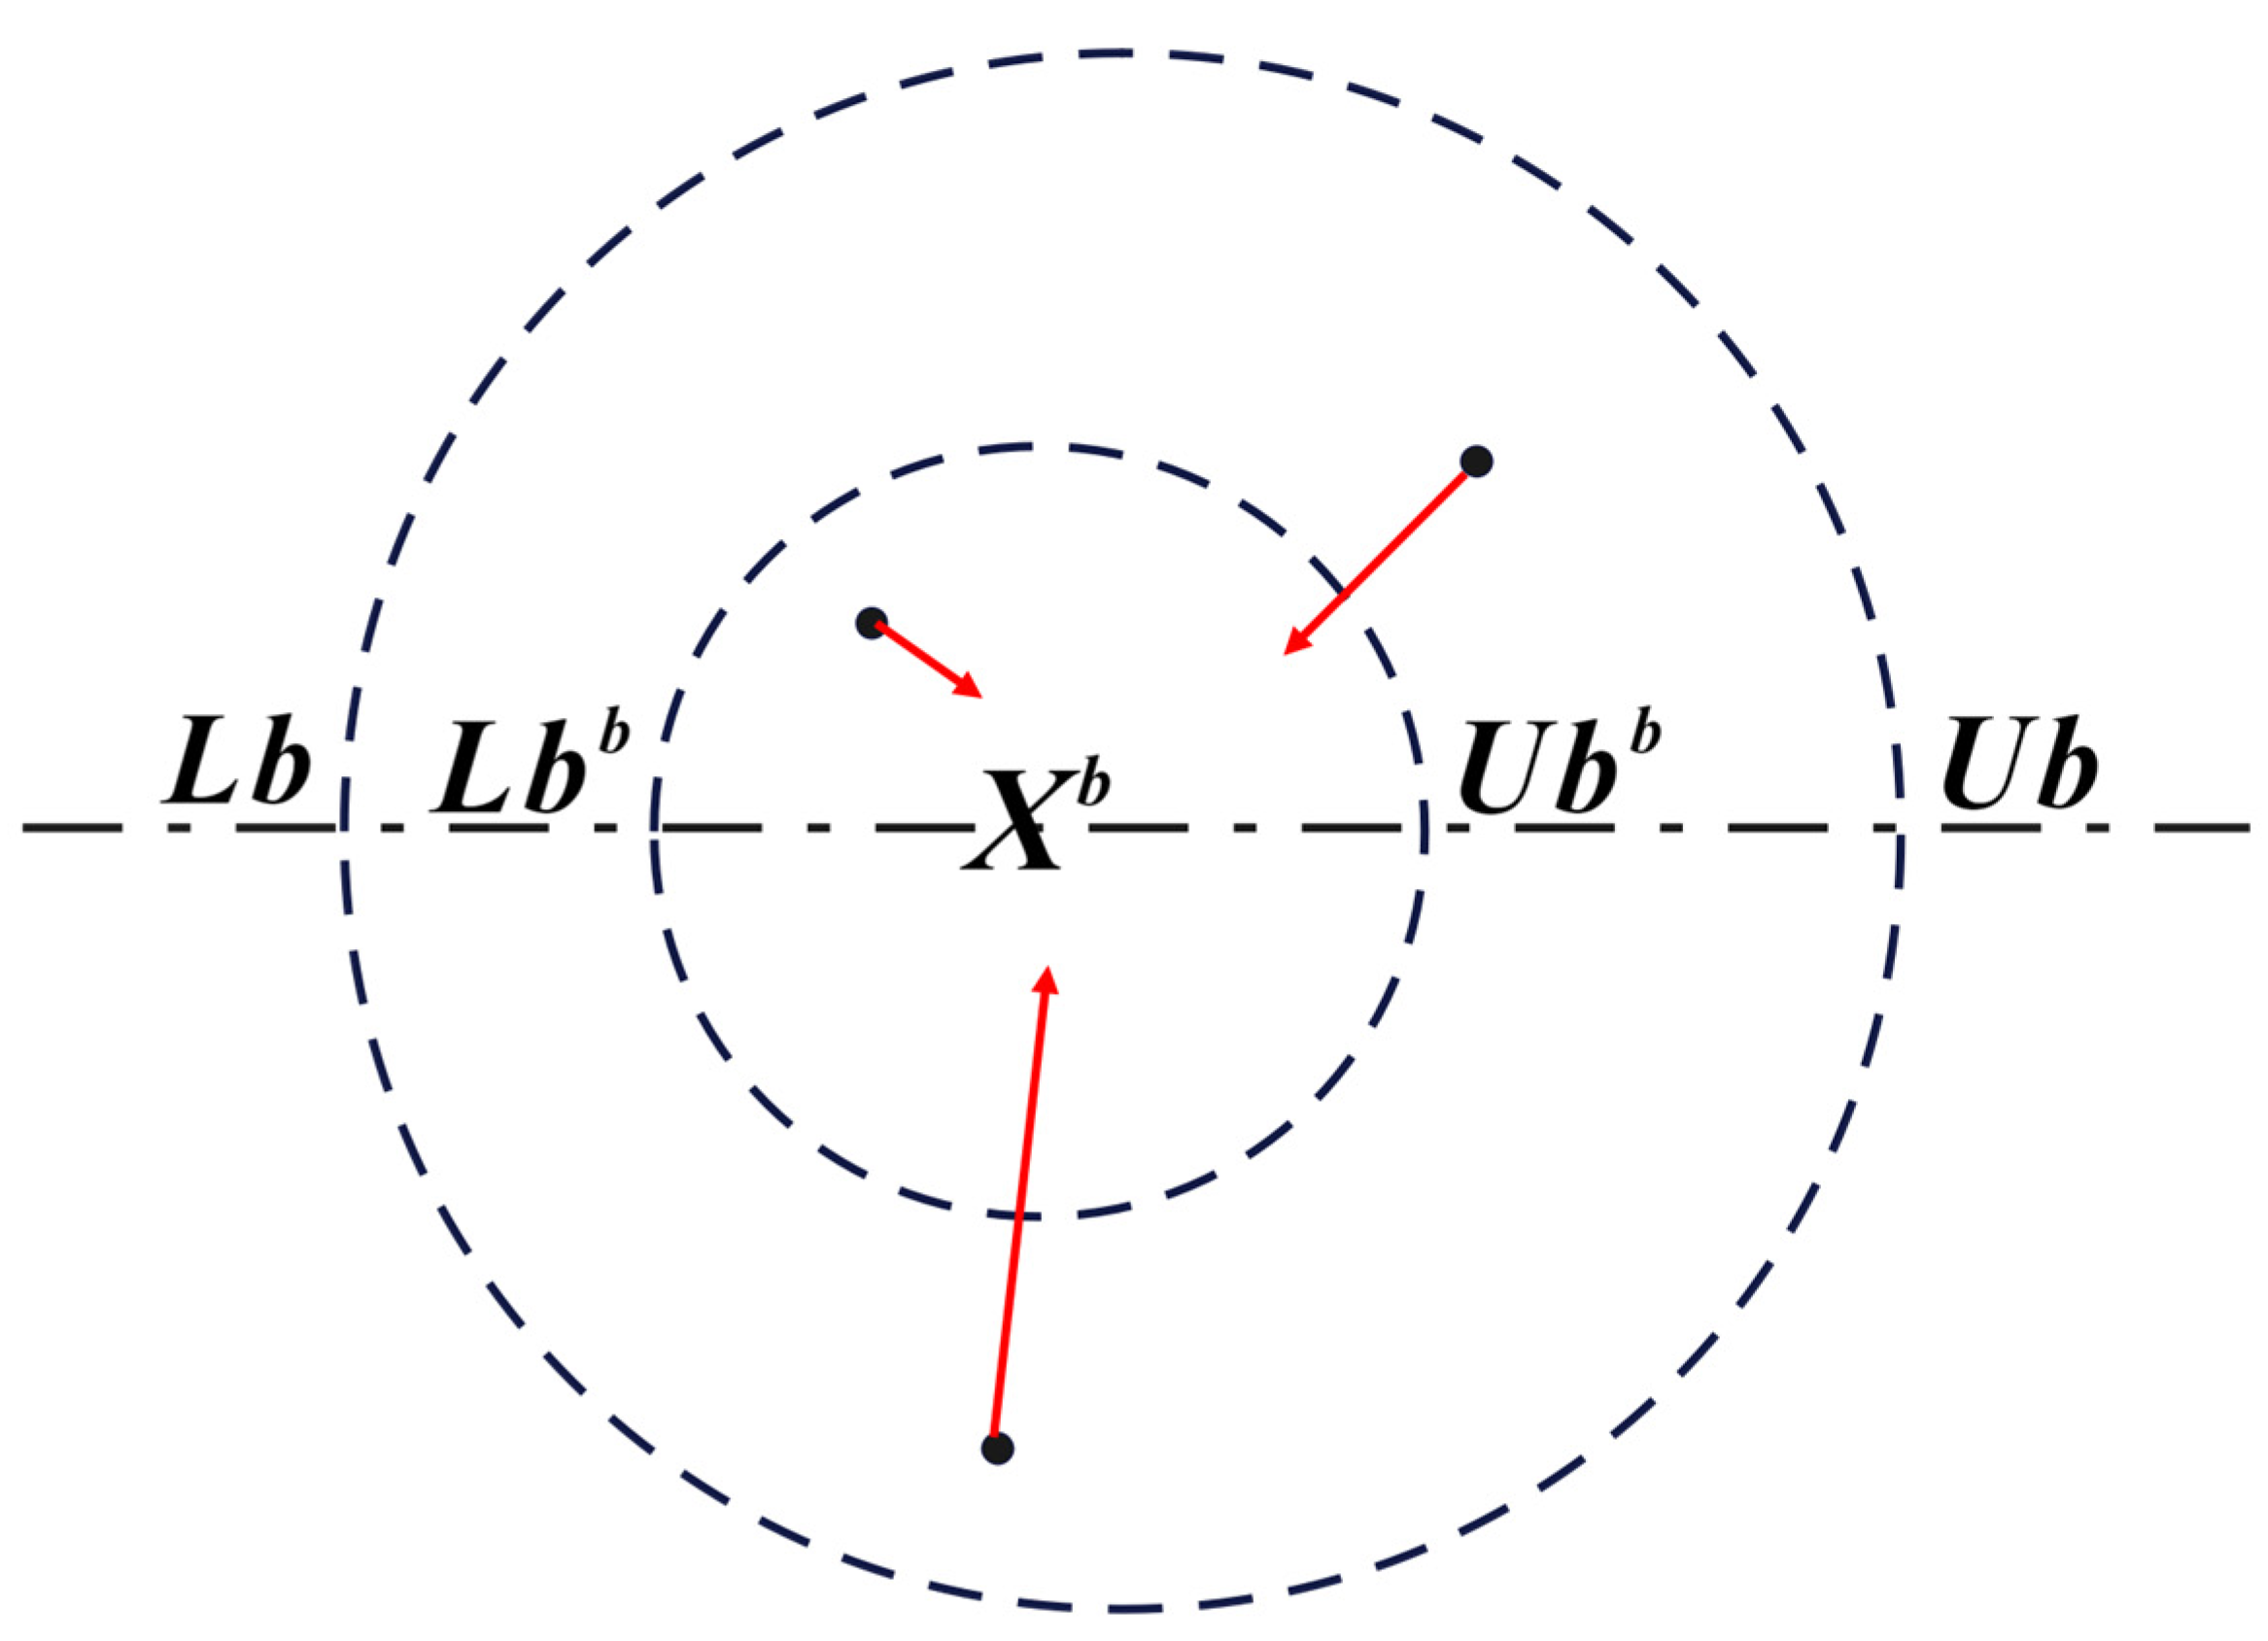
4.4.3. Cauchy Disturbance

Although DBO exhibits good convergence and optimization capabilities, it is also prone to the tendency to become trapped in local optima. To address this issue, this paper employs Cauchy perturbation to disturb local optimal solutions, allowing the algorithm to escape from local optima. The Cauchy distribution primarily generates small steps, while occasionally producing larger steps. By utilizing a method of partial perturbation, we can disturb the optimal solution in such a way that not only enables the solution to escape local optima but also facilitates exploration in the vicinity of the optimal solution. In this study, partial Cauchy perturbation is applied exclusively to the individuals of the “stealing mantis” algorithm, which is motivated by considerations of reducing execution time and aligning with the algorithm’s inherent characteristics. Therefore, we modify Equation (27) as follows:
X i ( t + 1 ) = X b + Q × S × g × X i ( t ) X * + X i ( t ) X b ,   t τ X b + Q × c a u c h y r n d ( y , x 0 , γ )   ,   otherwise
Here, Q remains consistent with the previous discussion. τ is the number of iterations starting the Cauchy perturbation, which can be modified based on the performance of DBO in solving the problem. In the issues discussed in this paper, experimental evidence indicates that the global optimal solution is likely trapped in local optima after 10 generations. Therefore, starting from the 10th generation, Cauchy perturbation is applied to the stealing mantis algorithm. Here γ = 2 and x 0 = 0 and the function cauchyrnd is as follows:
c a u c h y ( y , x 0 , γ ) = x 0 + γ × tan ( π × ( y 0.5 ) )
where y = rand ( 1 , d i m ) and d i m is the problem dimension.

4.4.4. Comparative Analysis and Execution Process

To demonstrate the efficacy of the enhanced method, test functions F1, F2, F3, and F4 are used here to test the effectiveness of the improvement. Here, each function is executed 30 times and the average result is taken. The test results are shown in Figure 6 and the solutions explored by DBO with improved measures are better than the original algorithm, which demonstrates the effectiveness of the improved strategy. The equations for these test functions are as follows:
F 1 : f ( x ) = i = 1 30 ( x i + 0.5 ) 2
F 2 :   f ( x ) = i = 1 30 ( x i sin ( x i ) )
F 3 : f ( x ) = i = 1 30 [ x i 2 10 cos ( 2 π x i ) + 10 ]
F 4 : f ( x ) = 20 exp ( 0.2 1 30 i = 1 30 x i 2 ) exp ( 1 30 i = 1 30 cos 2 π x i ) + 20 + e
Among them, the dimensions of the four test functions are 30, where the range of x values for test function F1 is x [ 100 , 100 ] , F2 is x [ 500 , 500 ] , F3 is x [ 5.12 , 5.12 ] , and F4 is x [ 32 , 32 ] .
The offloading strategy algorithm process of IDBO is shown in the Algorithm 1 below:
Algorithm 1. The framework of the IDBO algorithm
Input: The maximum iteration T max , the size of the population p , the number of tasks n , the number of tasks m .
Output: Optimal position X b and its fitness value F i t b .
1:
Initialize system model and IDBO algorithm related parameters.
2:
Initialize the population using improved Circle Chaos Mapping Equation (33) and calculate the initial fitness.
3:
while  t < T max  do
4:
  for  i to p  do
5:
    update Q ;
6:
    if  1 < i r o l l N u m  then
7:
       α = rand ( 1 ) ;
8:
      if α 0.9 then
9:
        Calculate X i ( t + 1 ) using the Equation (20);
10:
      else
11:
        Calculate X i ( t + 1 ) using the Equation (21);
12:
      end if
13:
    end if
14:
  update R by Equation (23);
15:
    if  r o l l N u m < i b o o r d N u m + r o l l N u m  then
16:
      update L b * and U b * by Equation (22);
17:
      Calculate X i ( t + 1 ) using the Equation (32);
18:
    end if
19:
    if  b o o r d N u m + r o l l N u m < i b o o r d N u m + r o l l N u m + s m a l l N u m  then
20:
      update L b * and U b * by Equation (25);
21:
      Calculate X i ( t + 1 ) using the Equation (33);
22:
    end if
23:
    if  b o o r d N u m + r o l l N u m + s m a l l N u m < i p  then
24:
      Calculate X i ( t + 1 ) using the Equation (37);
25:
    end if
26:
  Update F i t i ( t + 1 ) and X i ( t + 1 ) using a greedy strategy by Equations (28) and (29);
27:
  end for
28:
end while
29:
return the best dung beetle X b and F i t b ;

4.5. Time Complexity Analysis of IDBO

In the population initialization phase, the complexity of initializing using the improved circle chaotic mapping is O ( p × n ) . Time complexity for evaluating the fitness of each dung beetle individual is O ( n ) , which results in a time complexity for initializing the population fitness of O ( p × n ) . During the exploration of the optimal solution, the time required to complete the position update for the four types of dung beetles is O ( p ) . Since a fitness calculation is required after each position update, the total time needed updating the positions of the entire population is O ( p × n ) . Finally, the execution time for the greedy strategy to update the optimal positions and fitness of the dung beetle individuals is O ( p ) . Therefore, time complexity for one iteration of the IDBO is O ( p × n + p ) . Total time complexity for completing the algorithm for the maximum number of iterations is O ( t max × ( p × n + p ) ) . Thus, the final time complexity O of IDBO is as follows:
O = O ( p × n ) + O ( p × n ) + O ( t max × ( p × n + p ) ) O ( t max × p × n )

5. Simulation Results and Discussion

In this chapter, we first establish the various parameters of the algorithms and the model parameters used in the experiments. Subsequently, we analyze the convergence of the IDBO algorithm compared to other algorithms under the task offloading scenario in forest environments. Furthermore, we compare the execution time of the IDBO algorithm against that of other algorithms and evaluate the task offloading performance of each algorithm under varying task quantities and edge service availability.

5.1. Simulation Designs

In the experiment, the maximum number of iterations for each algorithm T max = 100 and the population size the number of particles or individuals p = 100 . For all algorithms except for IAHA and IDBO, the parameters were set according to their original publications [32,33,34]. The IAHA algorithm parameters were configured based on the publication [35]. In the IDBO algorithm, due to the fact that the problem is seeking discrete results and DBO is originally an algorithm for handling continuity functions, each value is set to be too large, which can eliminate the adverse results caused by small number changes in the optimization process of the solution, and the values of k = 1 and b = 0.5 in Equation (20) and S = 1 in Equation (37) were set. The population sizes for r o l l N u m , b r o o d N u m , s m a l l N u m , and t h r i v e N u m were 30, 20, 10, and 40, respectively. Compared to the original paper, we have increased the number of beetle thieves, which, in turn, increases the number of times Cauchy perturbations are executed. These parameters are obtained through continuous debugging and observation of their results. To reduce variance in the experimental results, all algorithms were executed 10 times and the average value was calculated. The specific parameter values for the system model are provided in Table 1.

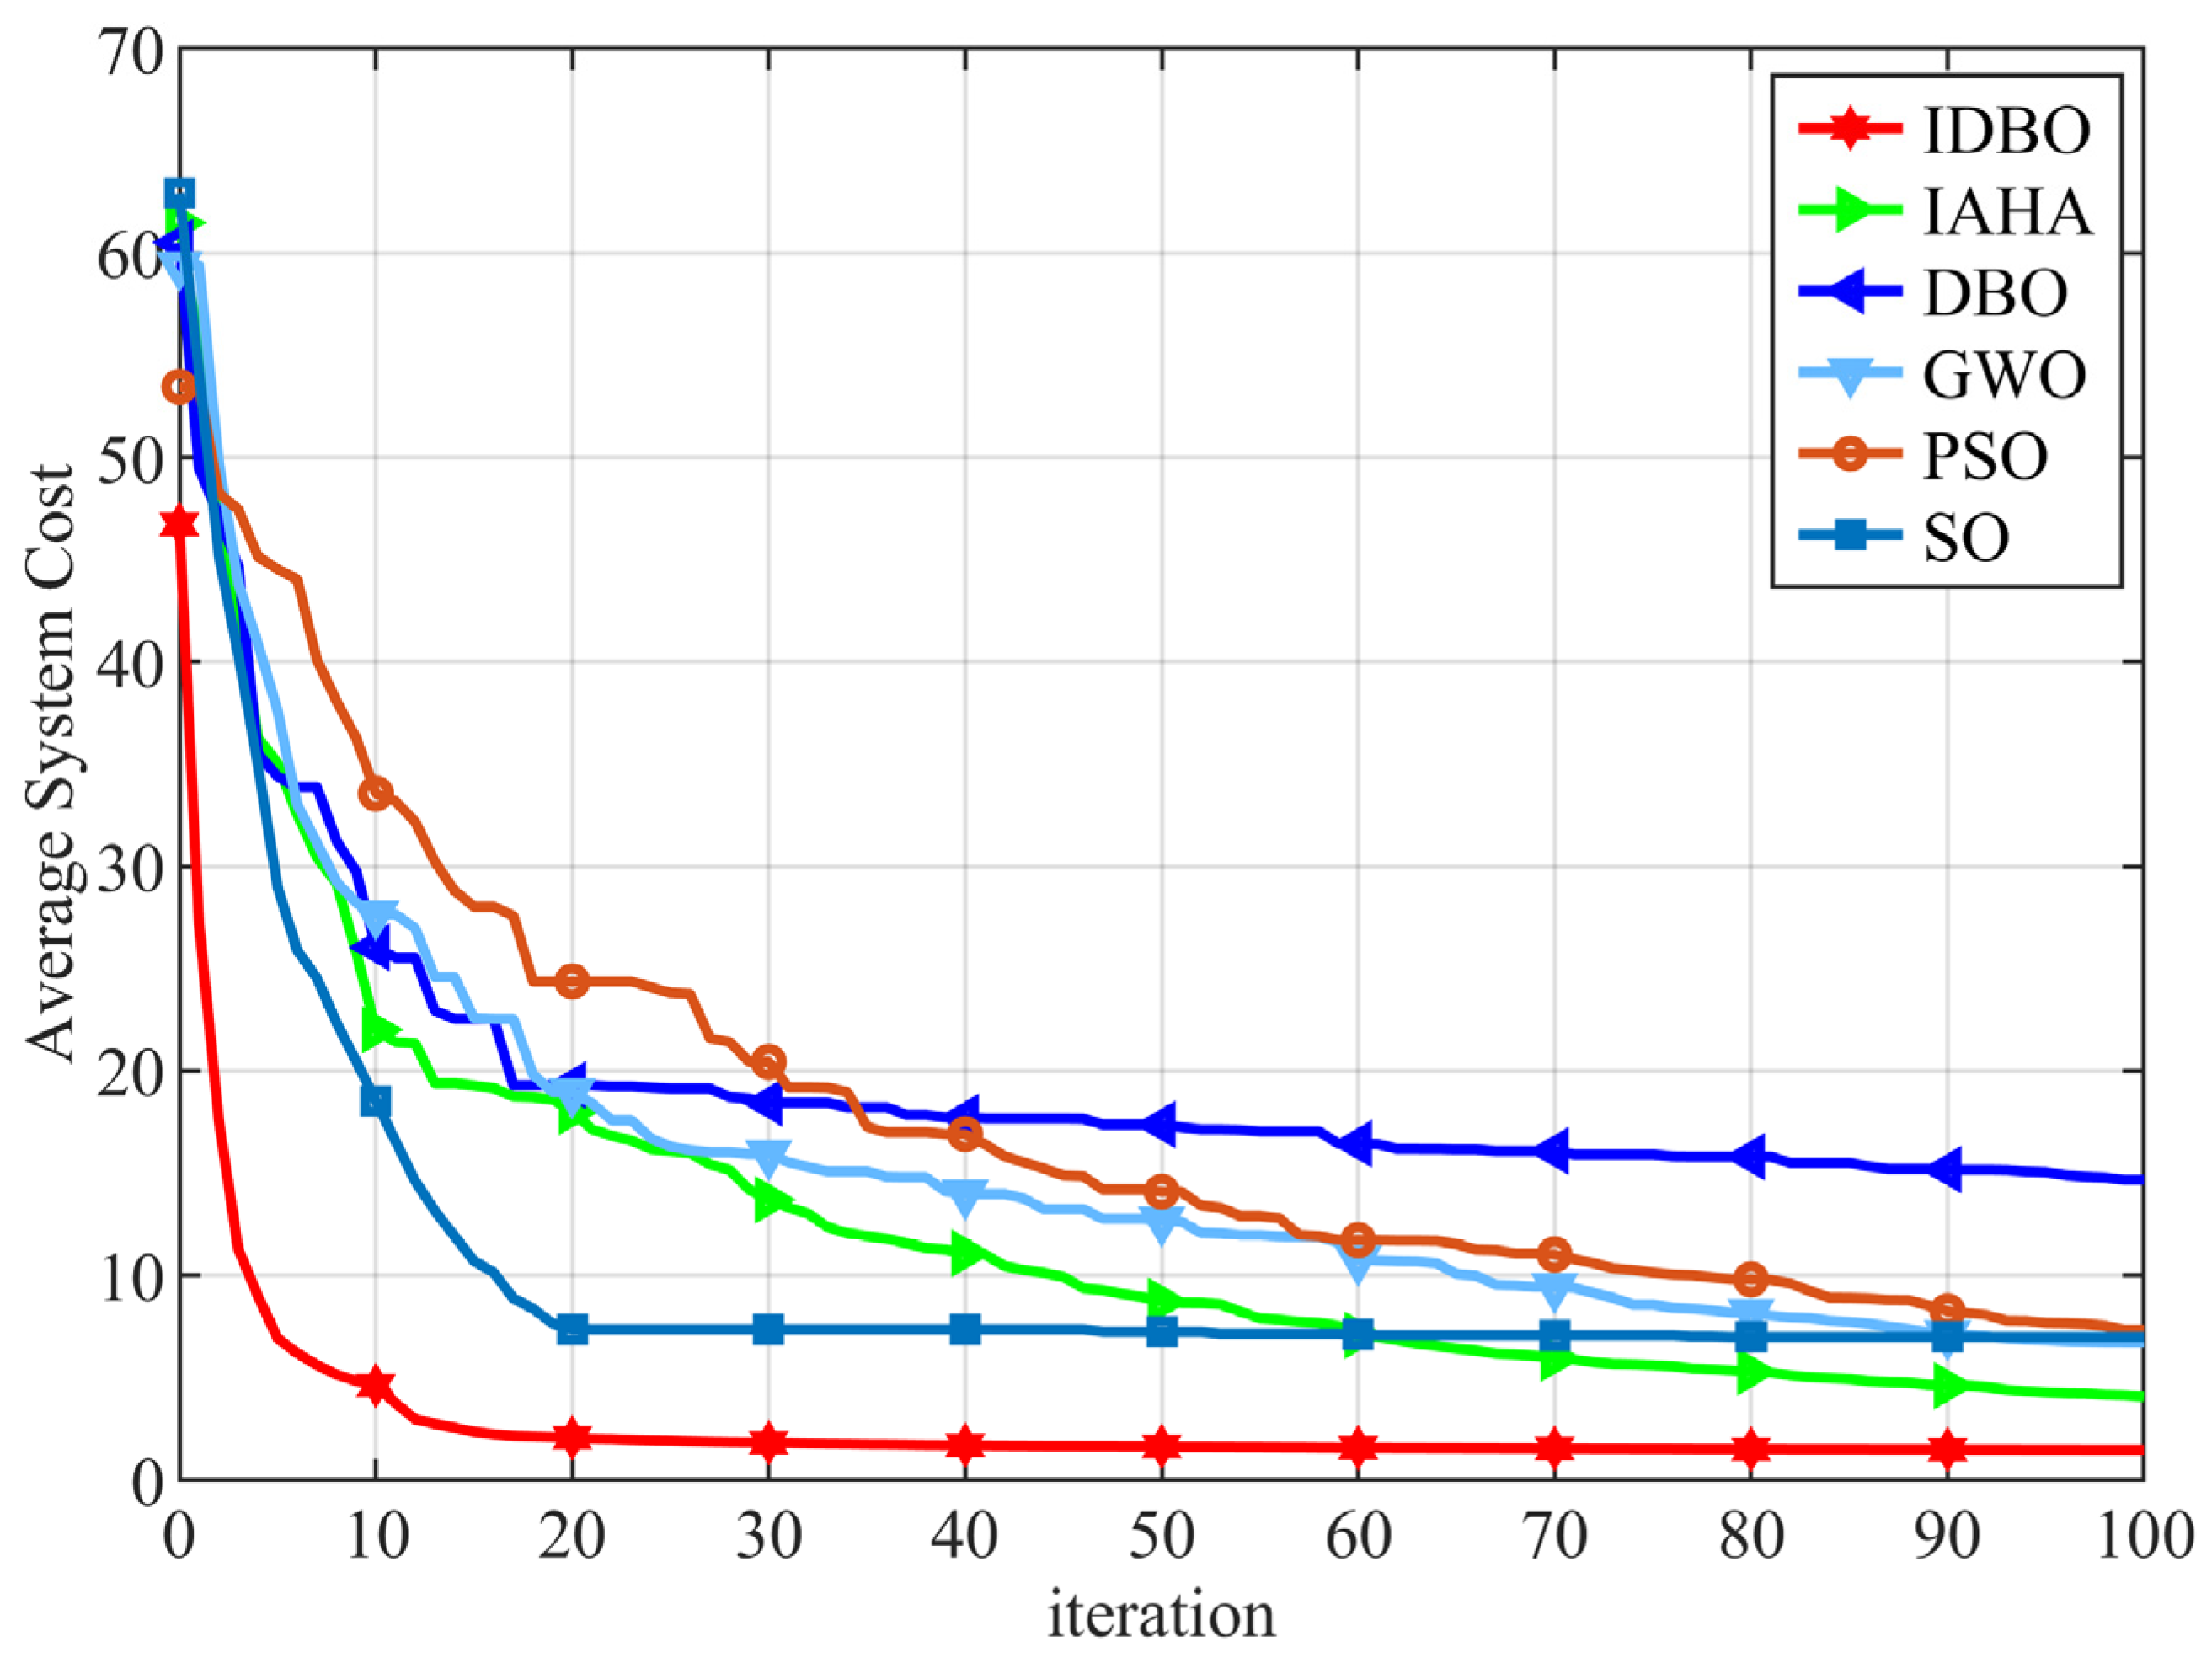
5.2. Convergence Analysis

The convergence process for tasks with 10 and 20 servers is illustrated in Figure 7. It is evident that the IDBO algorithm demonstrates the fastest convergence rate and the lowest initial minimum fitness value. Moreover, at 100 iterations, the average cost is minimized. This superior performance is attributed to the improved circle chaotic mapping method used for population initialization, which generates a uniformly distributed initial population. This not only enhances the initial fitness value but also accelerates the optimization process. The dimensional decomposition strategy further enables the improved algorithm to retain superior solutions more effectively, thereby increasing the convergence speed of IDBO. Although DBO also converges quickly, its final results are relatively poor, primarily due to its tendency to get stuck in local optima. In contrast, the Cauchy perturbation aids IDBO in escaping these local optima. The convergence rate of the SO algorithm is comparable to that of IDBO; however, SO demonstrates a significantly inferior optimization capability. Additionally, after 100 iterations, the GWO, PSO, and IAHA algorithms have not yet converged, and their final average system costs are all higher than that of IDBO. This evidence confirms that IDBO possesses superior optimization capabilities compared to other algorithms in addressing the computational offloading problem in forest monitoring networks, enabling it to more rapidly identify optimal offloading targets for tasks in complex environments.
Figure 8a,b illustrate the convergence characteristics of the algorithms under different conditions, specifically corresponding to the task numbers N = 150 and server numbers M = 10 , as well as the task numbers N = 100 and server number M = 15 . It is evident from the figures that the IDBO algorithm significantly surpasses other algorithms in both convergence and optimal solution attainment. This observation indicates that, regardless of the density of tasks to be offloaded or the sufficiency of computational and communication resources, the IDBO algorithm consistently demonstrates superior convergence capability and optimal search performance. These findings further validate the stability of the IDBO algorithm and its effectiveness in identifying optimal offloading decisions within the specified scenario.

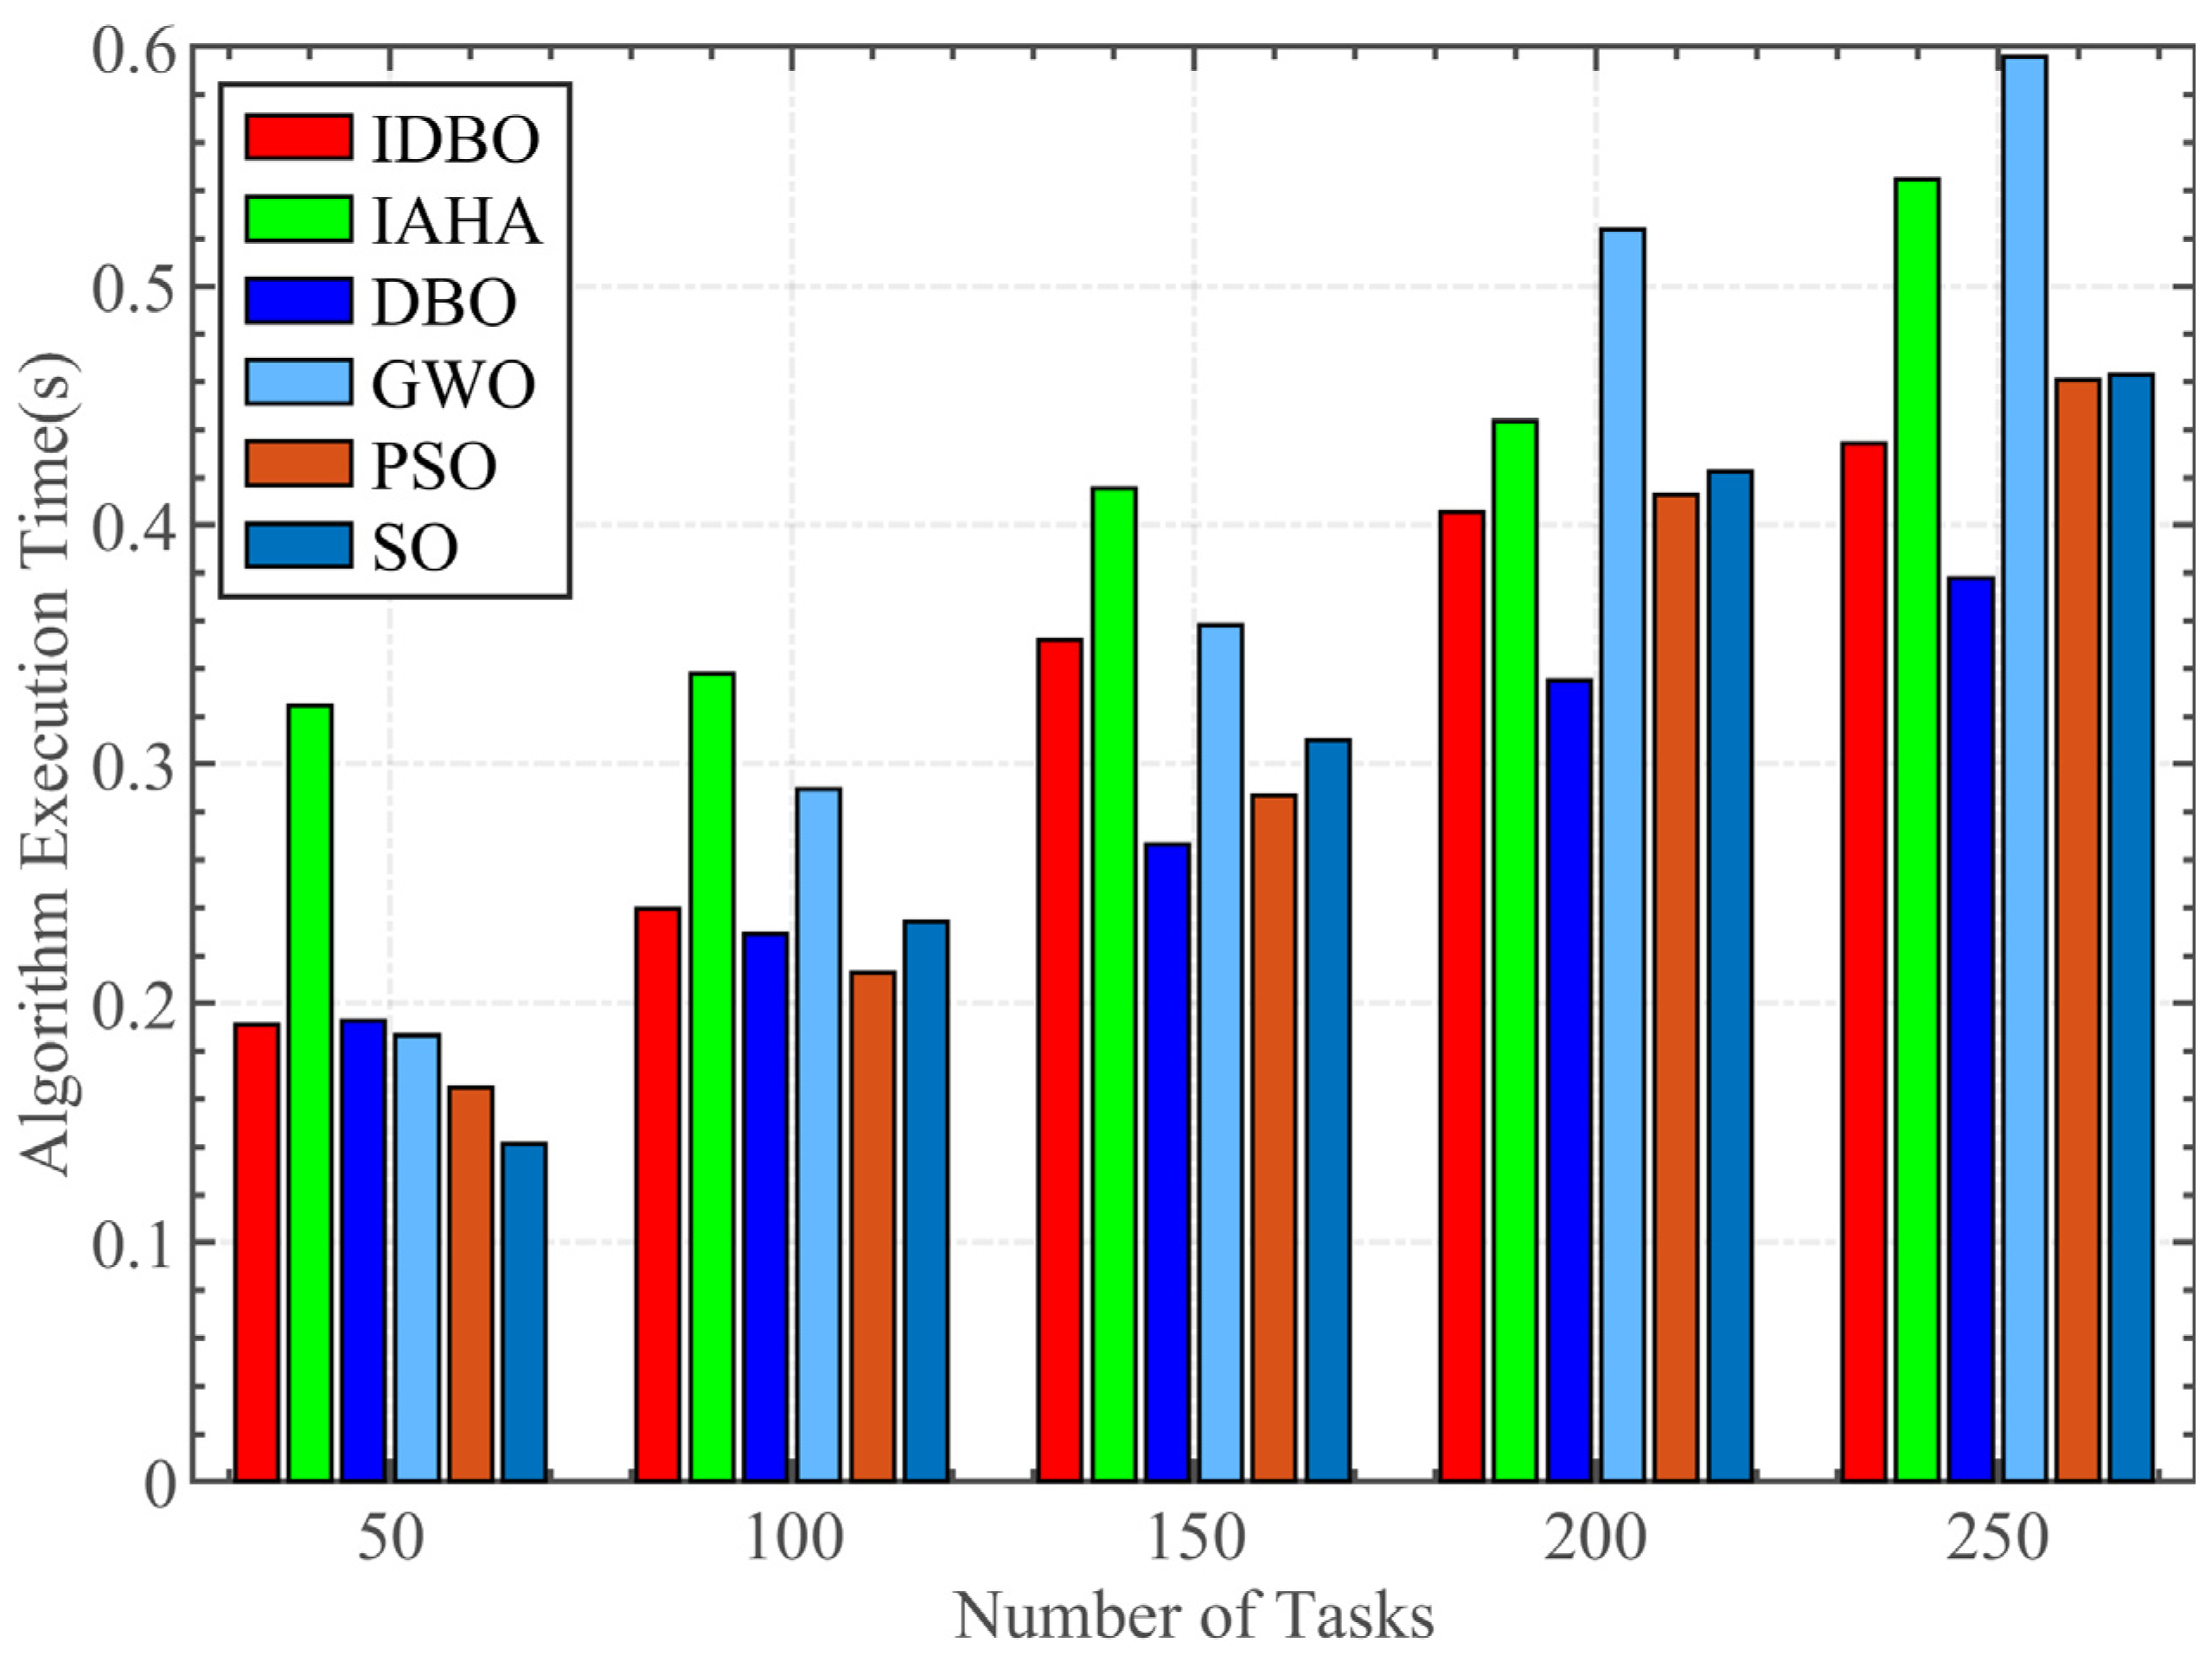
5.3. Execution Time Comparision Analysis

Figure 9 compares the execution times of various algorithms under the condition of 10 servers across different task quantities. It can be observed that, at a task quantity of 50, the execution times of all algorithms, except for the improved IAHA algorithm, show minimal differences. The execution times of all algorithms increase with the number of tasks; apart from common processing such as fitness evaluations, the differences in execution times primarily arise from the inherent complexity of each algorithm. Notably, despite incorporating Cauchy perturbation and an improved circle chaotic mapping, the dimensional decomposition strategy in the IDBO algorithm reduces certain computational demands, resulting in an execution time that is nearly indistinguishable from that of the unmodified DBO algorithm. In contrast, the GWO algorithm experiences an exponential increase in execution time as task numbers rise, significantly exceeding that of IDBO, which indicates a high level of computational complexity in its process. Furthermore, the IAHA algorithm, lacking a dimensional decomposition strategy, is unable to match IDBO’s performance despite some proposed measures in the original literature aimed at reducing execution time. This indicates that, under strong optimization capabilities, IDBO exhibits a comparable execution speed relative to other algorithms, thereby validating the effectiveness of its improvement strategies. Compared to the original algorithm, the average execution time of IDBO only increased by 0.0107–0.0561 s under various task quantities.

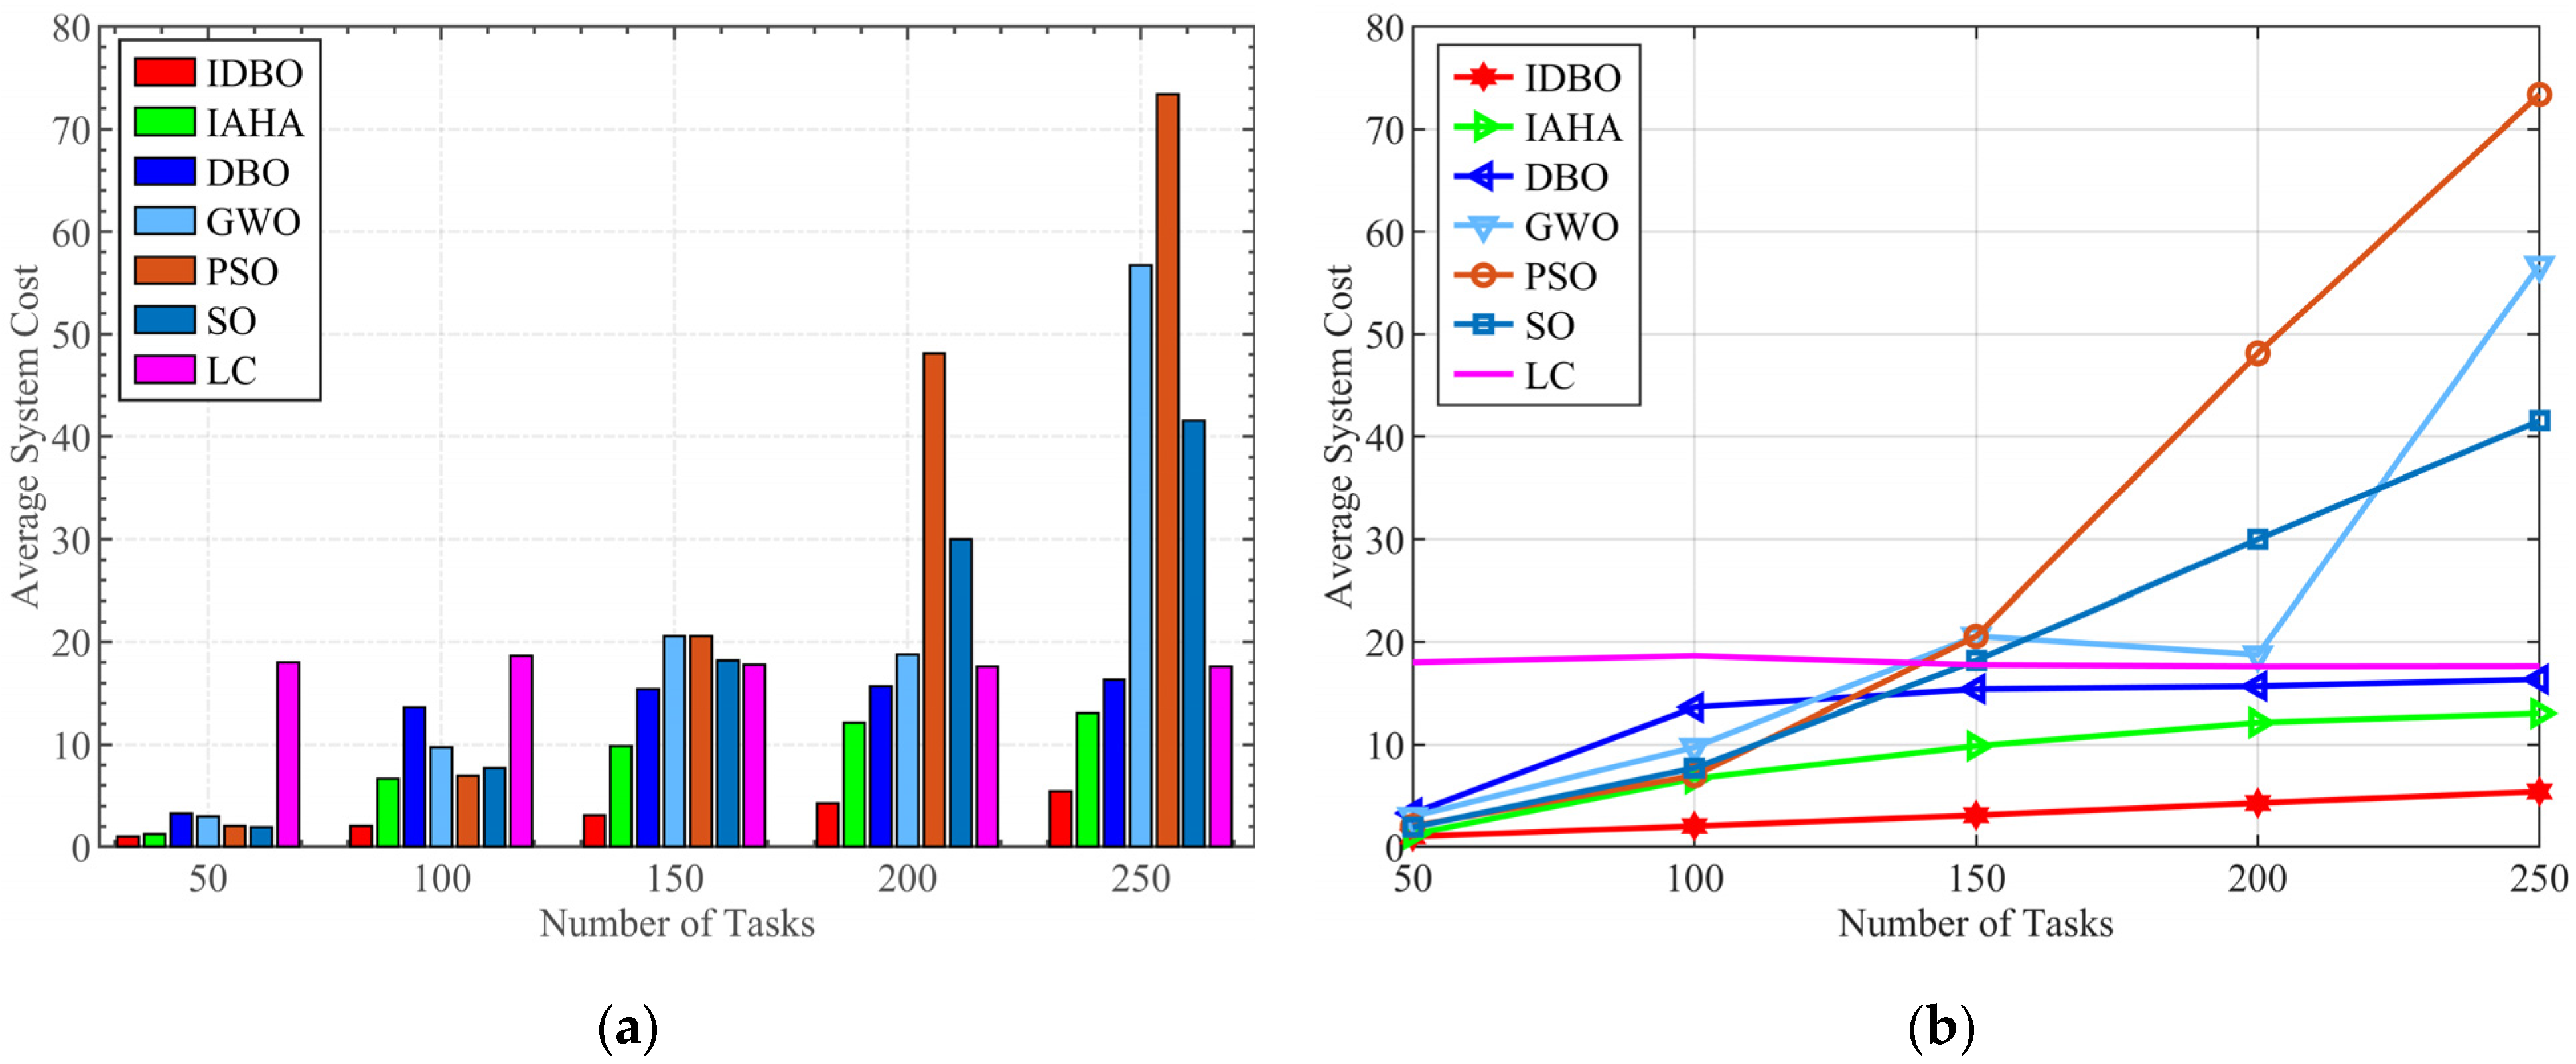
5.4. Comparative Analysis of Offloading Results on Different Task Numbers

Figure 10a illustrates the comparison of average costs under the condition of 10 servers with varying task quantities of 50, 100, 150, 200, and 250. This figure primarily discusses the impact of task scale on the decision making of different algorithms within a constrained resource environment. For task quantities of 50 and 100, the relatively low number of tasks allows for abundant computational and communication resources, leading to negligible differences in average costs among the algorithms. However, as the task count increases, not every task can be allocated sufficient bandwidth and CPU resources from the edge servers. The limited computational and communication resources compel each algorithm to allocate resources judiciously, revealing performance disparities among them. As the task quantity increases from 150 to 250, the average cost gap between IDBO and the other algorithms widens significantly. In scenarios with a larger number of tasks, IDBO is able to effectively allocate bandwidth and CPU resources within the monitoring system for each task, demonstrating its superiority in high-dimensional optimization problems. This is attributable to its dimensional decomposition strategy, which retains higher-quality solutions when addressing high-dimensional challenges. Conversely, algorithms such as GWO, PSO, and SO exhibit deficiencies in optimization capabilities in the context of computational offloading with 250 tasks, reflecting a common limitation among many metaheuristic algorithms, which tend to get stuck in local optima and demonstrate weak optimization capabilities when handling large-scale problems. IDBO effectively addresses this issue through Cauchy perturbation and dimensional decomposition, while IAHA and PSO, despite showing lower costs in large-scale task offloading, still fail to adequately allocate communication and computational resources for the monitoring system compared to local computation.
As illustrated in Figure 10b, although the IAHA algorithm has been improved, its performance shows only marginal enhancements compared to local offloading algorithms when the number of tasks requiring decisions increases under limited resources. Additionally, the offloading decisions introduced by IAHA add system overhead; meanwhile, the unmodified DBO algorithm performs nearly identically to the local computation baseline, primarily because the increase in task quantity causes the DBO algorithm to become trapped in local optima. IDBO successfully avoids this issue, substantiating the effectiveness of its improvement methods. The average costs of other algorithms are significantly higher than those of the baseline algorithm, resulting in negative performance impacts, whereas IDBO exhibits a substantial reduction in average system costs compared to local computation. This indicates that the offloading strategy based on IDBO effectively allocates resources within the monitoring network, enabling rational decision making for tasks in the context of large-scale offloading problems, thereby significantly reducing computation delays and energy consumption within the monitoring network.
Overall, when the task size is 50, all algorithms can make good decisions, and the gap between several algorithms is minimal. At this point, IDBO reduces costs by 16.99 compared to local computing and by 0.24, 2.28, 1.97, 1.03, and 0.91 compared to IAHA, DBO, GWO, PSO, and SO, respectively. When the number of tasks reaches 250, the gap reaches its maximum GWO. PSO and SO have lost their optimization ability in high-dimensional situations and have lost their value for discussion. At this point, IDBO reduces costs by 12.22, 7.63, and 10.94 compared to local computing, IAHA, and DBO, respectively.

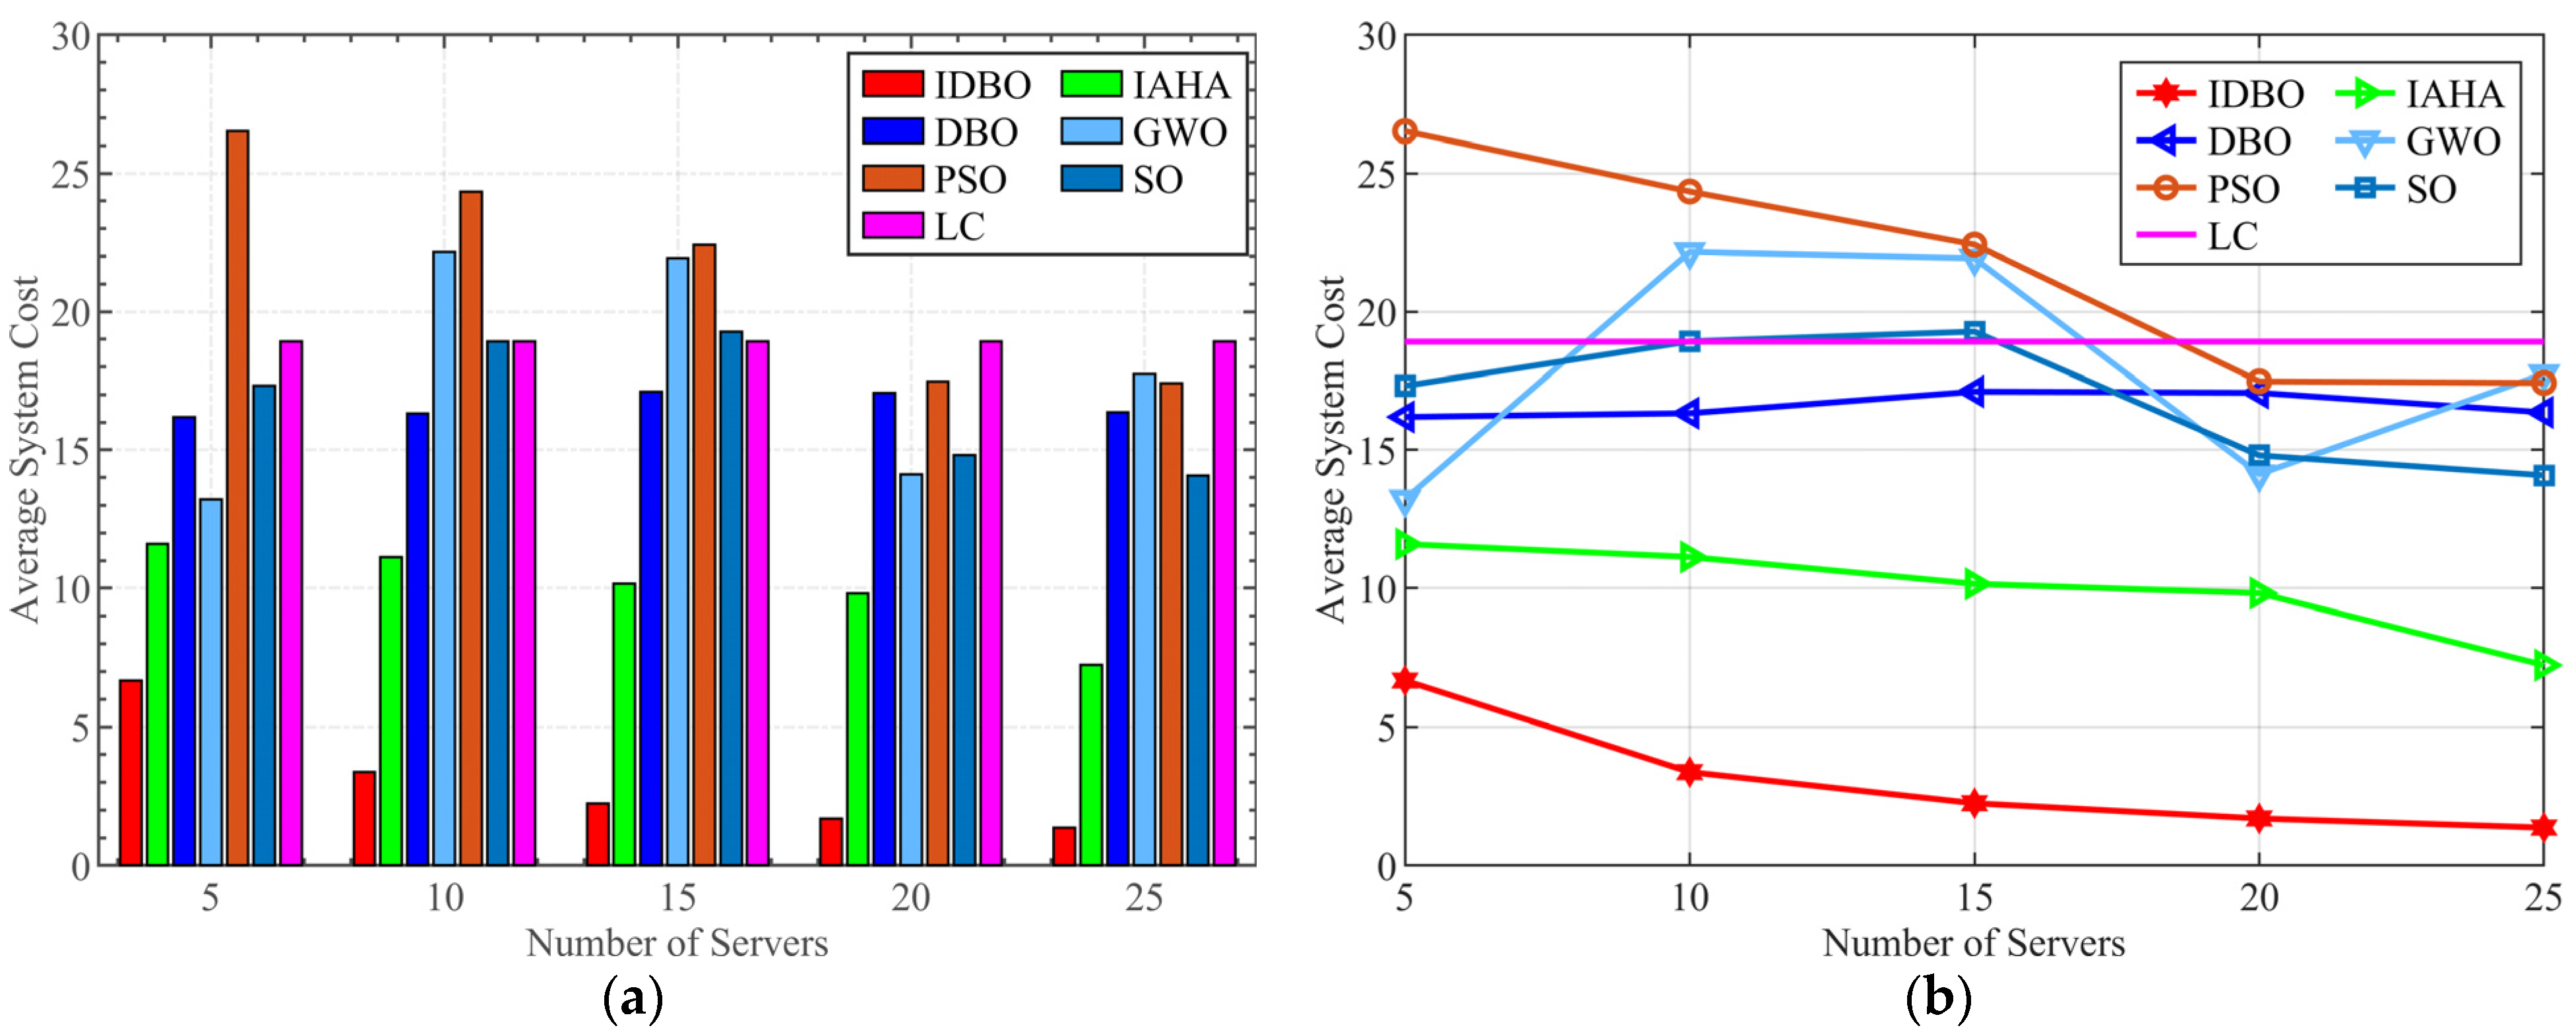
5.5. Comparative Analysis of Resource Allocation Capabilities Among Various Algorithms

Figure 11 presents a comparative analysis of the average offloading costs under varying numbers of servers while maintaining a constant task load. The task offloading selected represents a median value N = 150 , which aims to assess the optimization capabilities of various algorithms and the resource co-ordination efficiency of offloading strategies under conditions of both sufficient and insufficient communication and computational resources. As observed from Figure 11a, both IAHA and IDBO exhibit significant advantages over other algorithms; however, the average cost associated with IDBO is substantially lower than that of IAHA. This indicates that IDBO demonstrates the highest resource co-ordination capability among all the algorithms discussed, with its derived offloading strategy being the most optimal.
As depicted in Figure 11b, when the number of servers is set to 5, all algorithms except PSO outperform the baseline. Nevertheless, with the exception of IAHA and IDBO, both GWO and SO fall into local optima due to limited resources during the optimization process, resulting in the majority of tasks being computed locally, thereby failing to fully utilize the CPU resources and network bandwidth available on the servers. Moreover, as the number of servers increases to 10 and 15, the fitness values for GWO and SO unexpectedly increase, indicating the stochastic nature of these algorithms during the optimization process. Although the PSO algorithm shows a stable decrease in cost as resources increase, its optimization capability remains insufficient, only falling below the local offloading baseline when the server count reaches 20. The DBO algorithm, on the other hand, becomes trapped in a local optimum and remains close to the baseline throughout.
In contrast, while IAHA consistently performs below the cost baseline for local offloading, its average offloading cost does not significantly decrease as resources increase, reflecting its limitations in effectively co-ordinating resource allocation. IDBO, however, successfully allocates bandwidth and CPU resources for each task even under resource-constrained conditions, with an average cost significantly lower than the baseline. Furthermore, as computational and communication resources increase, IDBO’s average cost shows a marked decline, with optimization results considerably outperforming other algorithms. This validates the effectiveness of the proposed improvements, which enable effective co-ordination of resource allocation between tasks and servers. Figure 11a,b further demonstrate that the offloading strategy derived by IDBO optimally utilizes the computational and communication resources in the forest monitoring network, substantially reducing both the computational latency and energy consumption associated with task execution within the network. Compared to local computing, the total cost of IDBO has been reduced by 80.38% on average across different numbers of servers. Compared to IAHA, DBO, GWO, PSO, and SO methods, it has been reduced by 69.25%, 81.51%, 82.77%, 85.80%, and 81.80%, respectively.

6. Practical Significance and Limitations of IDBO in Forest Monitoring System

In the forest monitoring network, the edge cloud network consists of a scheduling center, servers, and base stations. During the operation of the monitoring network, the scheduler in the edge cloud collects relevant information and network conditions from sensors and MEC servers, such as server computing resource usage, sensor task size, etc. After obtaining the information, it will run the IDBO algorithm to make offloading decisions and return the decisions to the sensors. The sensors process the tasks based on the returned information. The good decisions made by IDBO will co-ordinate the reasonable uninstallation of the forest monitoring system, fully utilize the computing and communication resources in the monitoring network, reduce conflicts in resource usage between devices, greatly reduce the processing time and energy usage of sensor tasks, and ensure the normal operation of the monitoring network.
Although IDBO performed well in simulation experiments, there are also limitations. The IDBO method is a centralized offloading mode, which requires unified management of information and status of various devices. When facing large-scale monitoring networks, it is necessary to control and manage a large amount of information and devices simultaneously, which poses challenges to the management and calculation of controllers and also increases the requirements for the network. Finally, IDBO is a heuristic algorithm, and its unstable optimization results are widely recognized as a drawback. Although dimension decomposition is used as an improved strategy in this paper, the algorithm’s computation time and whether the computation results can achieve the expected results when faced with large-scale task offloading are also unknown variables.

7. Conclusions and Future Work

This article discusses the decision-making problem of sensor task offloading in forest environments. Firstly, we modeled the problem of computation and communication in forest scenarios, taking into account the impact of signal path loss and multipath fading on communication rate in complex forest scenarios. Secondly, we formulated the offloading problem in the forest monitoring network as an NP-hard problem that minimizes the cost of solving multiple constraints. To address this problem, we proposed a beetle optimization algorithm and improved it using methods with improved cyclic chaotic mapping initialization, dimension decomposition strategy, and Cauchy perturbation. Finally, a simulation comparison experiment was designed and the experimental results showed that, compared with local computing and other heuristic algorithms, IDBO has better convergence and optimization results. In forest monitoring networks of different scales and resource conditions, IDBO can better allocate communication and computing resources and seek the optimal offloading decision for forest monitoring networks.
Although IDBO has shown good performance in simulation experiments, the forest monitoring network is unstable in practical environments. The IDBO method is a static method, and the results obtained during the decision-making process may have errors compared to experimental results. In addition, the uninstallation mode of IDBO is centralized, and information from various tasks needs to be collected uniformly when making uninstallation decisions. Faced with large-scale forest monitoring networks, this poses challenges to the communication and computation of monitoring networks. If dynamic distributed methods such as game theory are used, nodes in the network need to constantly exchange state information. It is difficult to ensure real-time performance in complex forest environments. Therefore, in future work, we can integrate the methods of two modes and study a method suitable for forest monitoring networks, achieving a balance between these two modes to obtain the optimal method, which is a problem that can be studied in the future. In addition, IDBO has not been compared with methods other than heuristic algorithms. In future work, we can explore and discuss the performance of IDBO with other methods such as game theory and machine learning in forest monitoring networks, find the most suitable method for task offloading in forest monitoring networks, and verify the effectiveness of the discussed methods on actual forest monitoring networks. Finally, we can discuss the collaborative offloading scenario between edge servers and cloud centers in forest monitoring networks.

Author Contributions

Conceptualization, X.C., X.L. and Y.D.; methodology, X.C. and X.L.; software, X.C. and X.L.; validation, X.C., X.L., Q.L. and Y.K.; formal analysis, X.C., X.L., J.T., Y.S. and J.Z.; investigation, X.L. and Y.D.; resources, X.C. and Y.D.; data curation, X.L and J.T.; writing—original draft preparation, X.C. and X.L.; writing—review and editing, X.C., X.L., Y.D., Q.L., Y.K., J.T., Y.S. and J.Z.; supervision, X.C.; project administration, X.C.; funding acquisition, X.C. All authors have read and agreed to the published version of the manuscript.

Funding

This research work was supported by Key R & D projects of Guangxi Science and Technology Program (Guike.AB24010338), Independent research project (GXRDCF202307-01).

Data Availability Statement

Data are contained within the article.

Conflicts of Interest

The authors declare no conflicts of interest.

References

  1. Dima, A. Short History of Manufacturing: From Industry 1.0 to Industry 4.0. 2021. Available online: https://kfactory.eu/the-industrial-revolution-short-history-of-manufacturing/ (accessed on 20 December 2023).
  2. Mach, P.; Becvar, Z. Mobile edge computing: A survey on architecture and computation offloading. IEEE Commun. Surv. Tutor. 2017, 19, 1628–1656. [Google Scholar] [CrossRef]
  3. Lyu, Y.; Liu, Z.; Fan, R.; Zhan, C.; Hu, H.; An, J. Optimal computation offloading in collaborative LEO-IoT enabled MEC: A multiagent deep reinforcement learning approach. IEEE Trans. Green Commun. Netw. 2022, 7, 996–1011. [Google Scholar] [CrossRef]
  4. Chen, C.; Li, H.; Li, H.; Fu, R.; Liu, Y.; Wan, S. Efficiency and fairness oriented dynamic task offloading in internet of vehicles. IEEE Trans. Green Commun. Netw. 2022, 6, 1481–1493. [Google Scholar] [CrossRef]
  5. Postolache, O.; Hemanth, D.J.; Alexandre, R.; Gupta, D.; Geman, O.; Khanna, A. Remote monitoring of physical rehabilitation of stroke patients using IoT and virtual reality. IEEE Trans. Green Commun. Netw. 2020, 39, 562–573. [Google Scholar] [CrossRef]
  6. Zavalyshyn, I.; Duarte, N.O.; Santos, N. HomePad: A privacy-aware smart hub for home environments. In Proceedings of the 2018 IEEE/ACM Symposium on Edge Computing (SEC), Bellevue, WA, USA, 25–27 October 2018; pp. 58–73. [Google Scholar]
  7. Tang, H.; Wu, H.; Qu, G.; Li, R. Double deep Q-network based dynamic framing offloading in vehicular edge computing. IEEE Trans. Netw. Sci. Eng. 2022, 10, 1297–1310. [Google Scholar] [CrossRef]
  8. Hazra, A.; Rana, P.; Adhikari, M.; Amgoth, T. Fog computing for next-generation internet of things: Fundamental, state-of-the-art and research challenges. Comput. Sci. Rev. 2023, 48, 100549. [Google Scholar] [CrossRef]
  9. Xiao, Z.; Shu, J.; Jiang, H.; Min, G.; Chen, H.; Han, Z. Perception task offloading with collaborative computation for autonomous driving. IEEE J. Sel. Areas Commun. 2022, 41, 457–473. [Google Scholar] [CrossRef]
  10. Luo, Q.; Hu, S.; Li, C.; Li, G.; Shi, W. Resource scheduling in edge computing: A survey. IEEE Commun. Surv. Tutor. 2021, 23, 2131–2165. [Google Scholar] [CrossRef]
  11. Sun, L.; Wan, L.; Wang, X. Learning-based resource allocation strategy for industrial IoT in UAV-enabled MEC systems. IEEE Trans. Ind. Inform. 2020, 17, 5031–5040. [Google Scholar] [CrossRef]
  12. Michael, A.O. Further investigation into VHF radio wave propagation loss over long forest channel. Int. J. Adv. Res. Electr. Electron. Instrum. Eng. 2013, 2, 705–710. [Google Scholar]
  13. Akhlaqi, M.Y.; Hanapi, Z.B.M. Task offloading paradigm in mobile edge computing-current issues, adopted approaches, andfuture directions. J. Netw. Comput. Appl. 2023, 212, 103568. [Google Scholar] [CrossRef]
  14. Feng, C.; Han, P.; Zhang, X.; Yang, B.; Liu, Y.; Guo, L. Computation offloading in mobile edge computing networks: A survey. J. Netw. Comput. Appl. 2022, 202, 103366. [Google Scholar] [CrossRef]
  15. Tang, S.; Yu, Y.; Wang, H.; Wang, G.; Chen, W.; Xu, Z.; Guo, S.; Gao, W. A survey on scheduling techniques in computing and network convergence. J. Netw. Comput. Appl. 2023, 26, 160–195. [Google Scholar] [CrossRef]
  16. Yang, G.; Hou, L.; He, X.; He, D.; Chan, S.; Guizani, M. Offloading time optimization via Markov decision process in mobile-edge computing. IEEE Internet Things J. 2020, 8, 2483–2493. [Google Scholar] [CrossRef]
  17. Huang, L.; Zhang, L.; Yang, S.; Qian, L.P.; Wu, Y. Meta-learning based dynamic computation task offloading for mobile edge computing networks. IEEE Commun. Lett. 2020, 25, 1568–1572. [Google Scholar] [CrossRef]
  18. Dai, Y.; Zhang, K.; Maharjan, S.; Zhang, Y. Edge intelligence for energy-efficient computation offloading and resource allocation in 5G beyond. IEEE Trans. Veh. Technol. 2020, 69, 12175–12186. [Google Scholar] [CrossRef]
  19. Guo, H.; Liu, J. Collaborative computation offloading for multiaccess edge computing over fiber–wireless networks. IEEE Trans.Veh. Technol. 2018, 67, 4514–4526. [Google Scholar] [CrossRef]
  20. Dong, S.; Xia, Y.; Kamruzzaman, J. Quantum particle swarm optimization for task offloading in mobile edge computing. IEEE Trans. Ind. Inform. 2022, 19, 9113–9122. [Google Scholar] [CrossRef]
  21. Mahenge, M.P.J.; Li, C.; Sanga, C.A. Energy-efficient task offloading strategy in mobile edge computing for resource-intensivemobile applications. Digit. Commun. Netw. 2022, 8, 1048–1058. [Google Scholar] [CrossRef]
  22. Guo, F.; Zhang, H.; Ji, H.; Li, X.; Leung, V.C. An efficient computation offloading management scheme in the densely deployed small cell networks with mobile edge computing. IEEE-ACM Trans. Netw. 2018, 26, 2651–2664. [Google Scholar] [CrossRef]
  23. Deng, X.; Yin, J.; Guan, P.; Xiong, N.N.; Zhang, L.; Mumtaz, S. Intelligent delay-aware partial computing task offloading formultiuser industrial Internet of Things through edge computing. IEEE Internet Things J. 2021, 10, 2954–2966. [Google Scholar] [CrossRef]
  24. Chen, C.; Zeng, Y.; Li, H.; Liu, Y.; Wan, S. A multihop task offloading decision model in MEC-enabled internet of vehicles. IEEE Internet Things J. 2022, 10, 3215–3230. [Google Scholar] [CrossRef]
  25. Yu, Z.; Gong, Y.; Gong, S.; Guo, Y. Joint task offloading and resource allocation in UAV-enabled mobile edge computing. IEEE Internet Things J. 2020, 7, 3147–3159. [Google Scholar] [CrossRef]
  26. Zhao, J.; Liu, X.; Tian, M. An efficient task offloading method for drip irrigation and fertilization at edge nodes based on quantum chaotic genetic algorithm. AIP Adv. 2024, 14, 015011. [Google Scholar] [CrossRef]
  27. Goldsmith, A. Wireless Communications; Cambridge University Press: Cambridge, UK, 2005. [Google Scholar]
  28. Myagmardulam, B.; Tadachika, N.; Takahashi, K.; Miura, R.; Ono, F.; Kagawa, T.; Shan, L.; Kojima, F. Path loss prediction model development in a mountainous forest environment. IEEE Open J. Commun. Soc. 2021, 2, 2494–2501. [Google Scholar] [CrossRef]
  29. Fu, Y.; Yang, X.; Yang, P.; Wong, A.K.; Shi, Z.; Wang, H.; Quek, T.Q. Energy-efficient offloading and resource allocation for mobile edge computing enabled mission-critical internet-of-things systems. EURASIP J. Wirel. Commun. Netw. 2021, 2021, 26. [Google Scholar] [CrossRef]
  30. Zhan, W.; Luo, C.; Min, G.; Wang, C.; Zhu, Q.; Duan, H. Mobility-aware multi-user offloading optimization for mobile edgecomputing. IEEE Trans. Veh. Technol. 2020, 69, 3341–3356. [Google Scholar] [CrossRef]
  31. Xue, J.; Shen, B. Dung beetle optimizer: A new meta-heuristic algorithm for global optimization. J. Supercomput. 2023, 79, 7305–7336. [Google Scholar] [CrossRef]
  32. Kennedy, J.; Eberhart, R. Particle swarm optimization. In Proceedings of the ICNN’95-International Conference on Neural Networks, Perth, WA, Australia, 27 November–1 December 1995; Volume 4, pp. 1942–1948. [Google Scholar]
  33. Mirjalili, S.; Mirjalili, S.M.; Lewis, A. Grey wolf optimizer. Adv. Eng. Softw. 2014, 69, 46–61. [Google Scholar] [CrossRef]
  34. Hashim, F.A.; Hussien, A.G. Snake Optimizer: A novel meta-heuristic optimization algorithm. Knowl. Based Syst. 2022, 242, 108320. [Google Scholar] [CrossRef]
  35. Yang, J.; Tang, D.; Li, .J.; Xiao, Y. Task Offloading Strategy of MEC Based on Improved Artificial Humming Bird Algorithm. Comput. Eng. 2024, 50, 291–301. [Google Scholar]
Figure 1. Forest monitoring network offloading scenario diagram.
Symmetry 16 01569 g001
Figure 2. Diagram signal propagation path schematic.
Symmetry 16 01569 g002
Figure 3. Conceptual model of the boundary selection strategy.
Symmetry 16 01569 g003
Figure 4. Small dung beetles foraging diagram.
Symmetry 16 01569 g004
Figure 5. Initialization distribution comparison. (a) Randomly initialized distribution. (b) Improved circle mapping initialization distribution.
Symmetry 16 01569 g005
Figure 6. Test function optimization diagram. (a) Test function of F1. (b) Test function of F2. (c) Test function of F3. (d) Test function of F4.
Symmetry 16 01569 g006
Figure 7. Convergence of 100 tasks and 10 servers.
Symmetry 16 01569 g007
Figure 8. Convergence of different task numbers and server numbers. (a) Convergence for 150 tasks and 10 servers. (b) Convergence for 100 tasks and 15 servers.
Symmetry 16 01569 g008
Figure 9. Execution time comparison analysis.
Symmetry 16 01569 g009
Figure 10. Comparison of system costs of different task numbers. (a) Comparison of cost for different task numbers. (b) Cost growth curve for different task numbers.
Symmetry 16 01569 g010
Figure 11. Comparison of system costs of different server numbers. (a) Comparison of cost for different server numbers. (b) Cost growth curve for different server numbers.
Symmetry 16 01569 g011
Table 1. The simulation parameters.
Simulation ParametersValue
The channel bandwidth W 20 MHz
Signal frequency f 2.4 GHz
Background noise N 0 10 9
Sensor chip structural power coefficient ε 5 × 10 28
The transmission power of UEs P 0.1–1 W
The number of SBSs M 5–25
The number of Sensors N 50–250
Data size to offload d i 500–3000 KB
CPU cycles of per bit of offloading task c i 400–1200
Free Space Propagation Distance d i , j free 0–500 m
Forest Propagation Distance d i , j forest 0–500 m
Computation capacity of Sensors f l 0.5–1.5 GHz
Computation capacity of Edge Servers F j s 32–48 GHz
Energy Penalty Coefficient g e 2~12
Delay Penalty Coefficient g t 1~8
The expected maximum energy consumption E i max 5–15 J
The expected maximum delay T i max 1–10 s
Disclaimer/Publisher’s Note: The statements, opinions and data contained in all publications are solely those of the individual author(s) and contributor(s) and not of MDPI and/or the editor(s). MDPI and/or the editor(s) disclaim responsibility for any injury to people or property resulting from any ideas, methods, instructions or products referred to in the content.

