
Improving Safety in High-Altitude Work: Semantic Segmentation of Safety Harnesses with CEMFormer

Abstract
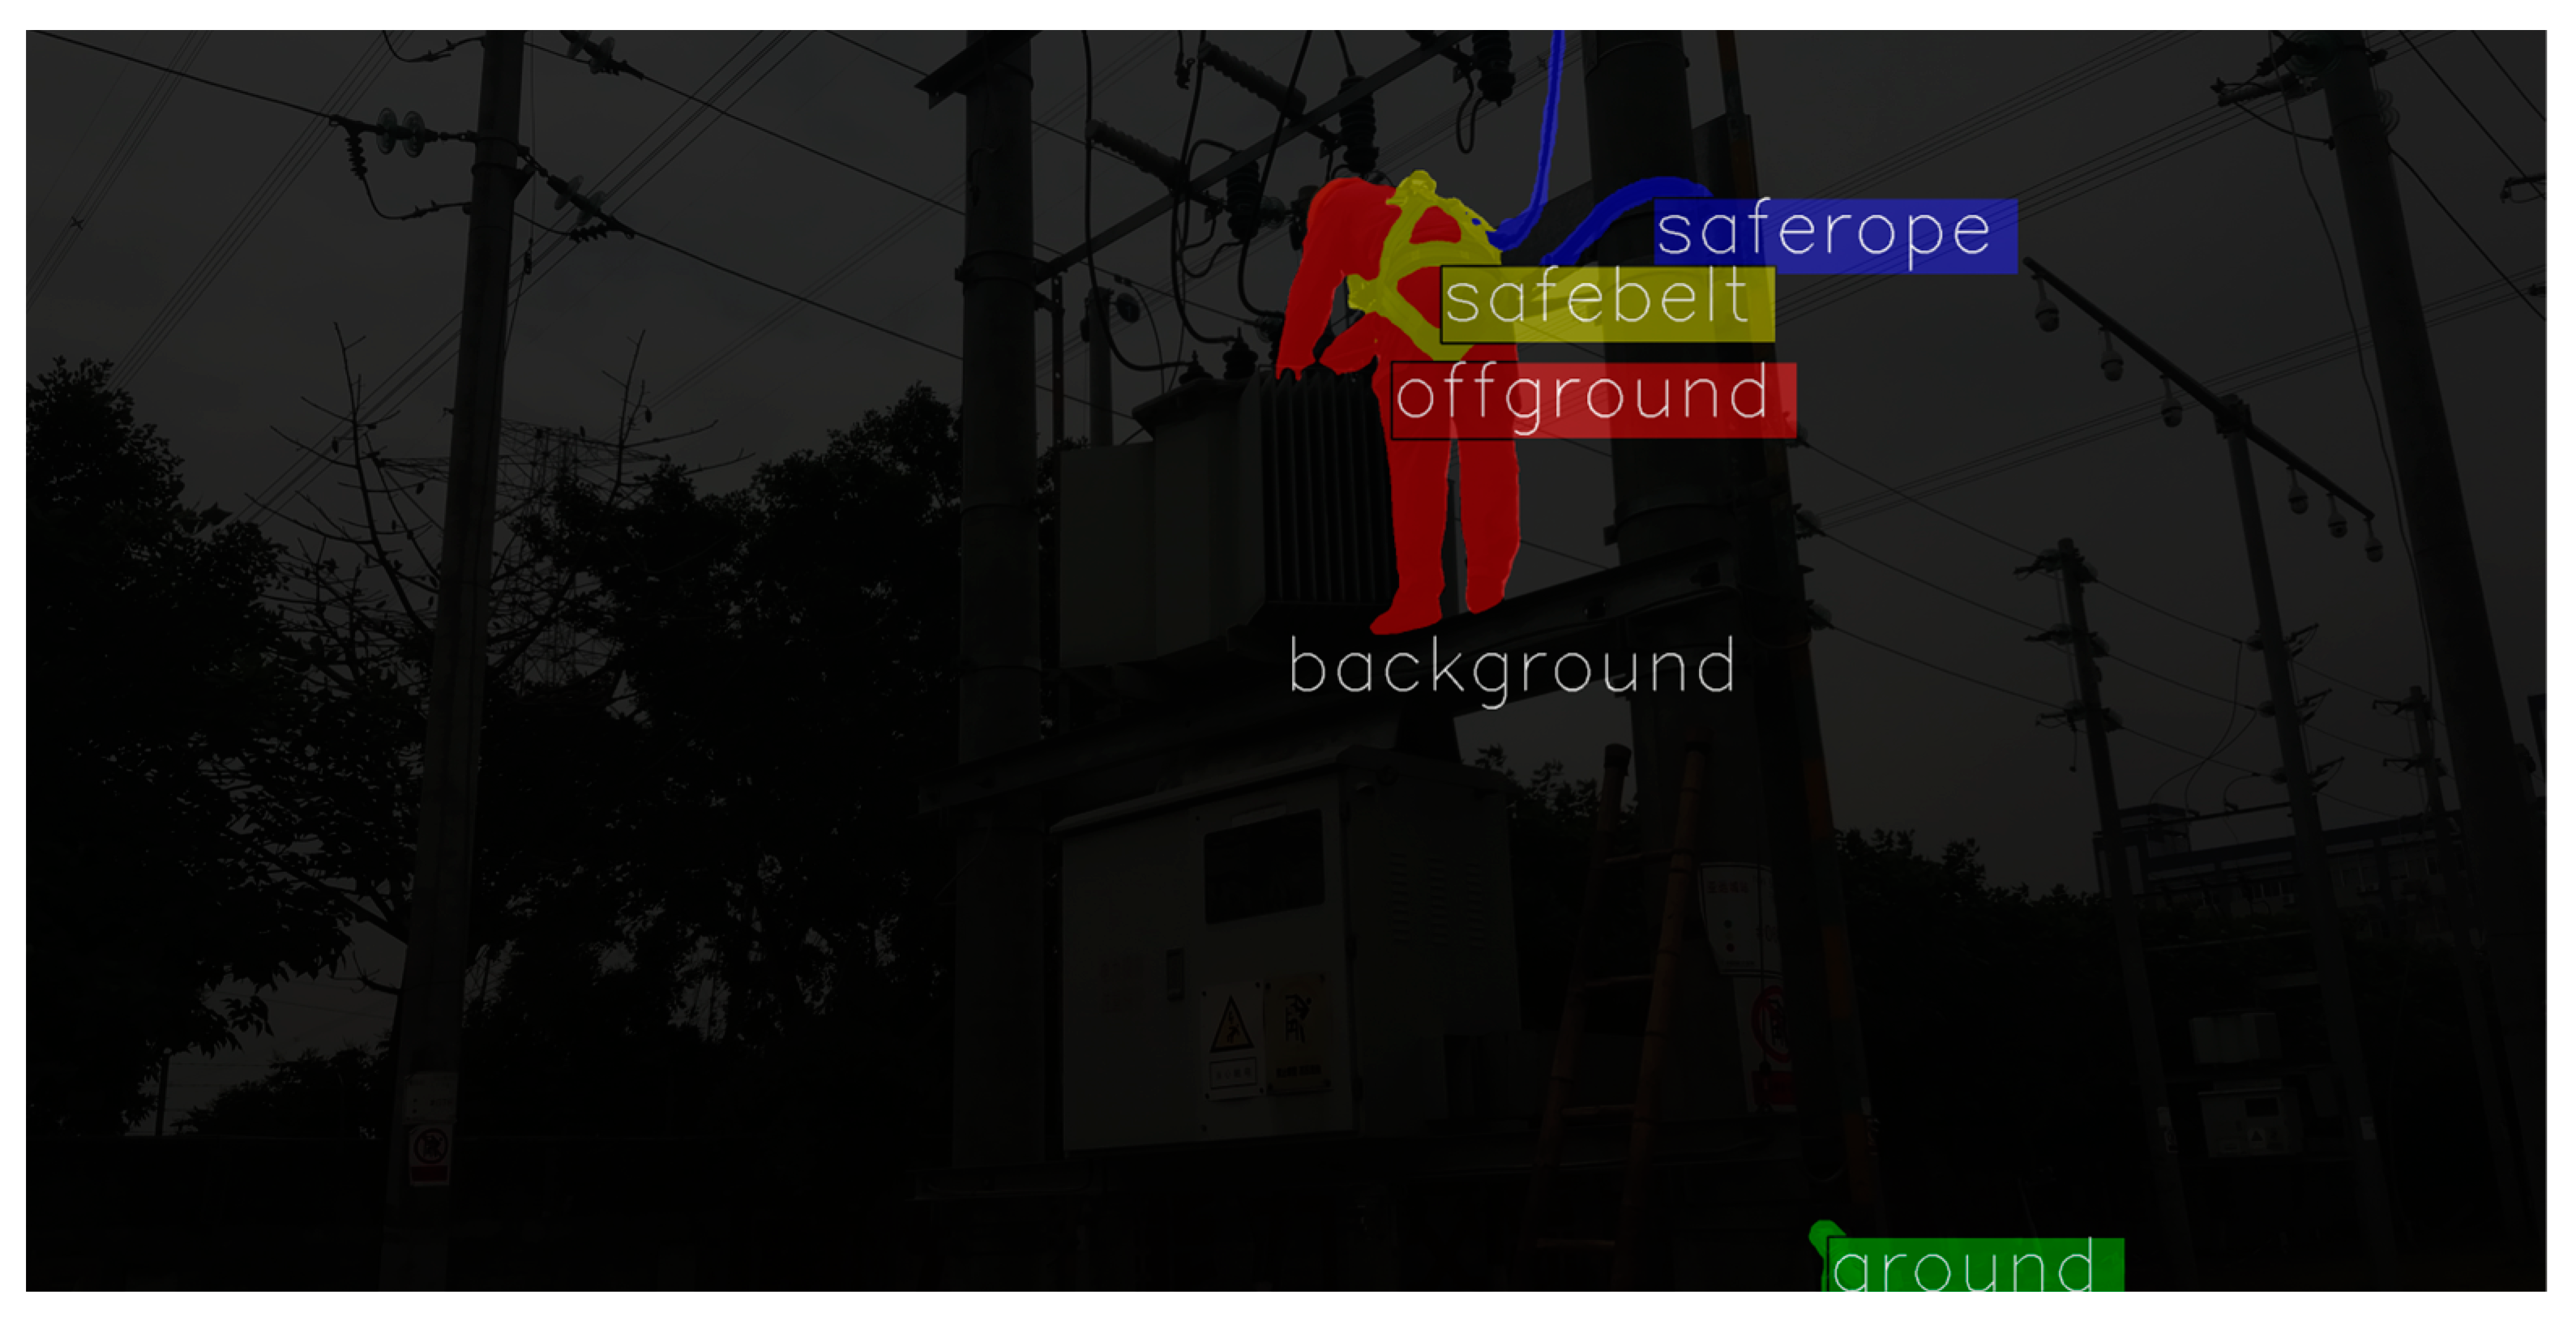
1. Introduction
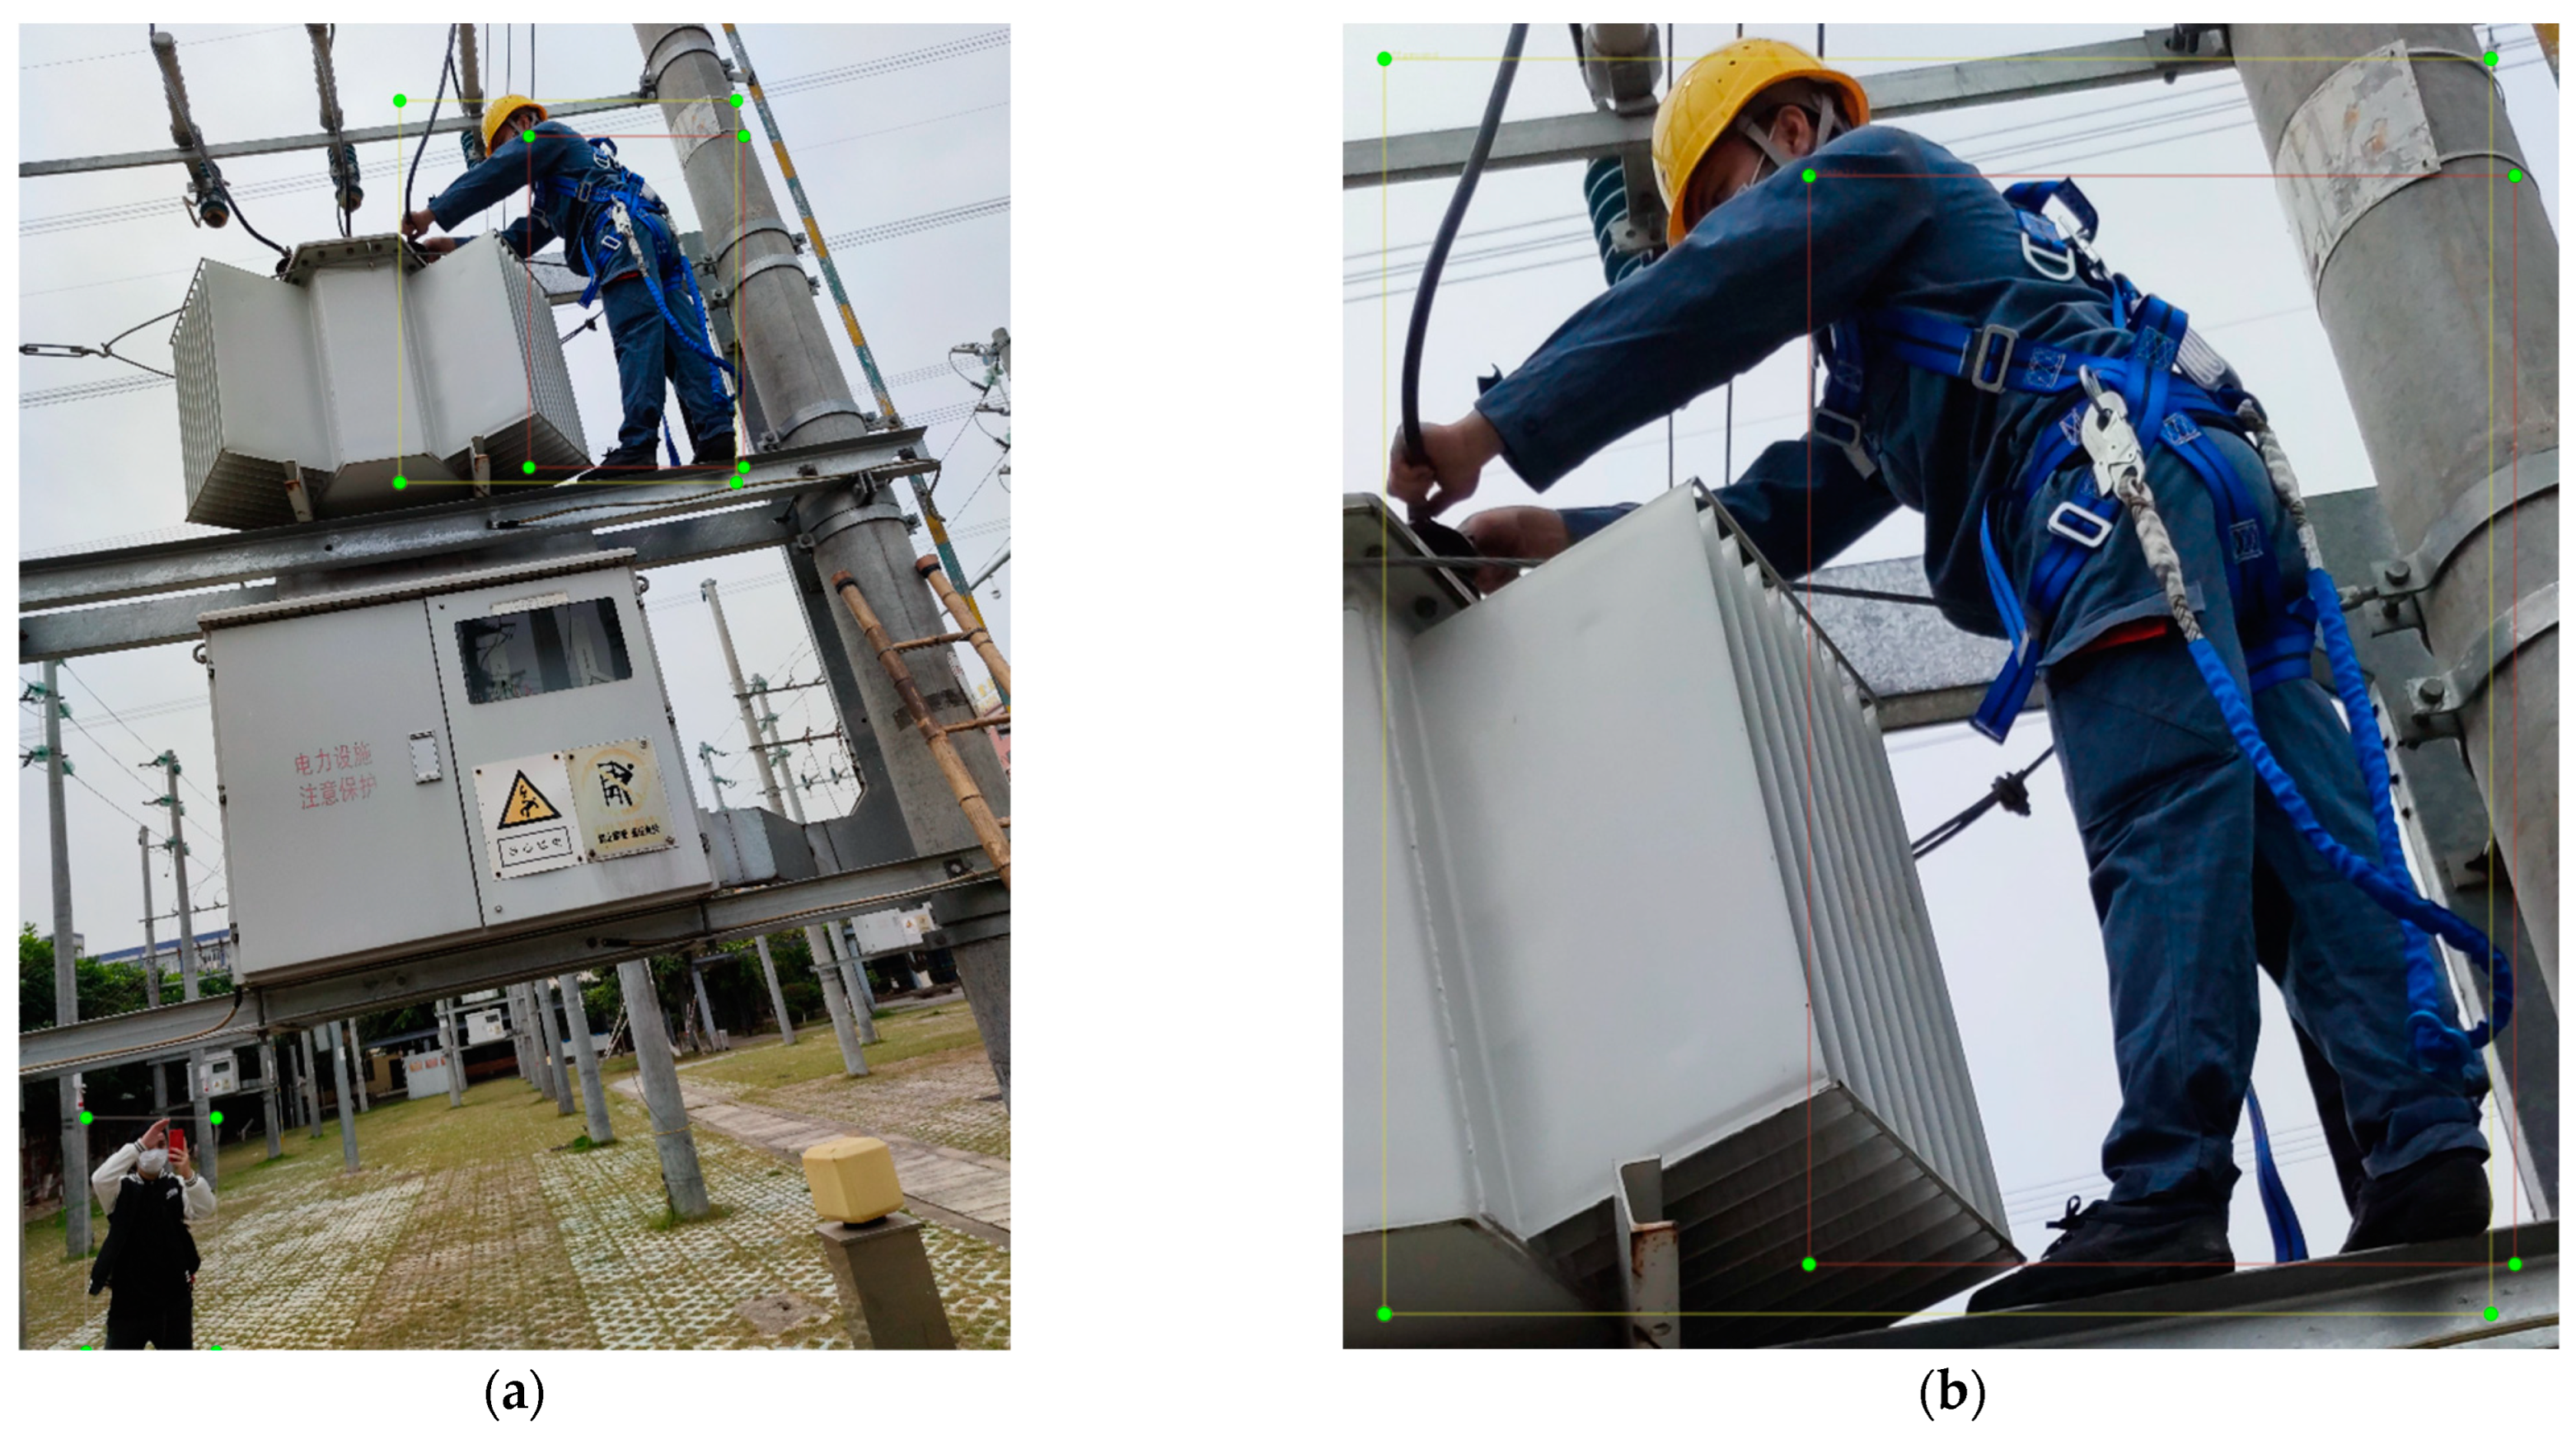
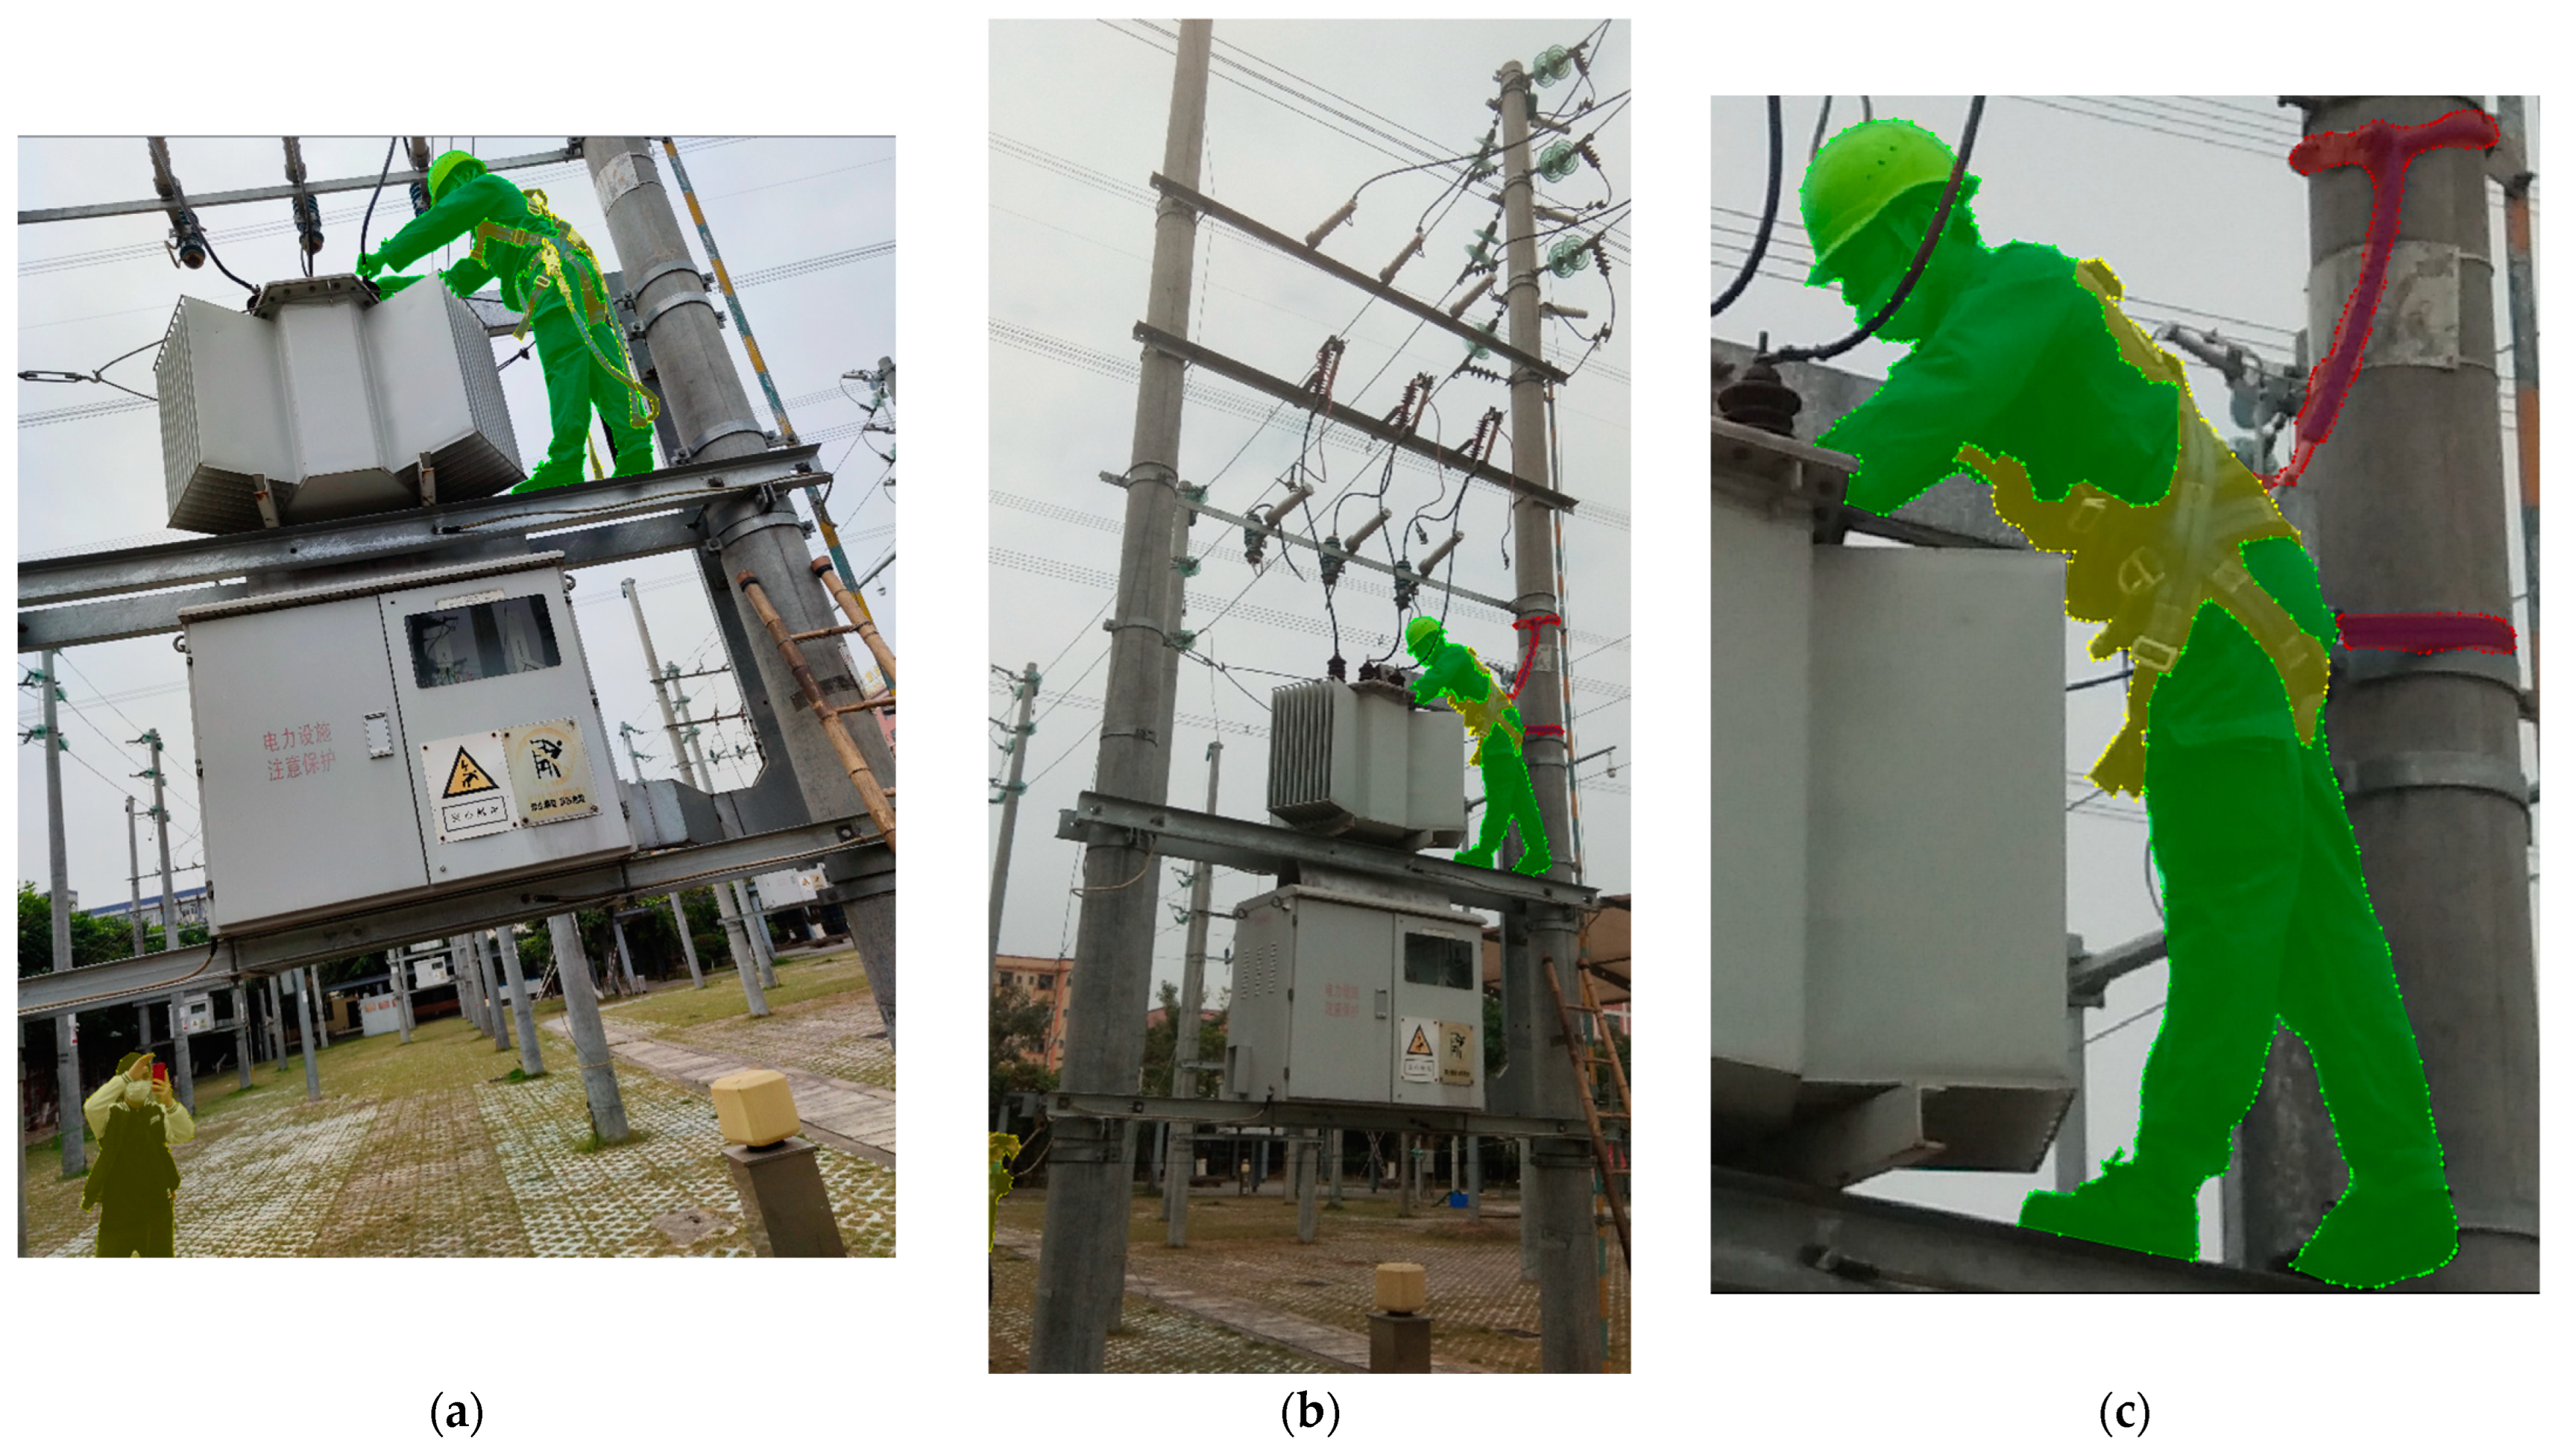
- Given that safety ropes are often overlooked by workers and researchers due to their small scale, we propose a new annotation principle by adding safety ropes as a new category in the dataset and utilizing masks for precise annotation.
- ConvNeXt is utilized as the backbone; as a next-generation convolutional neural network (CNN) with Transformer-like characteristics, it demonstrates improved accuracy over its predecessor, ResNet.
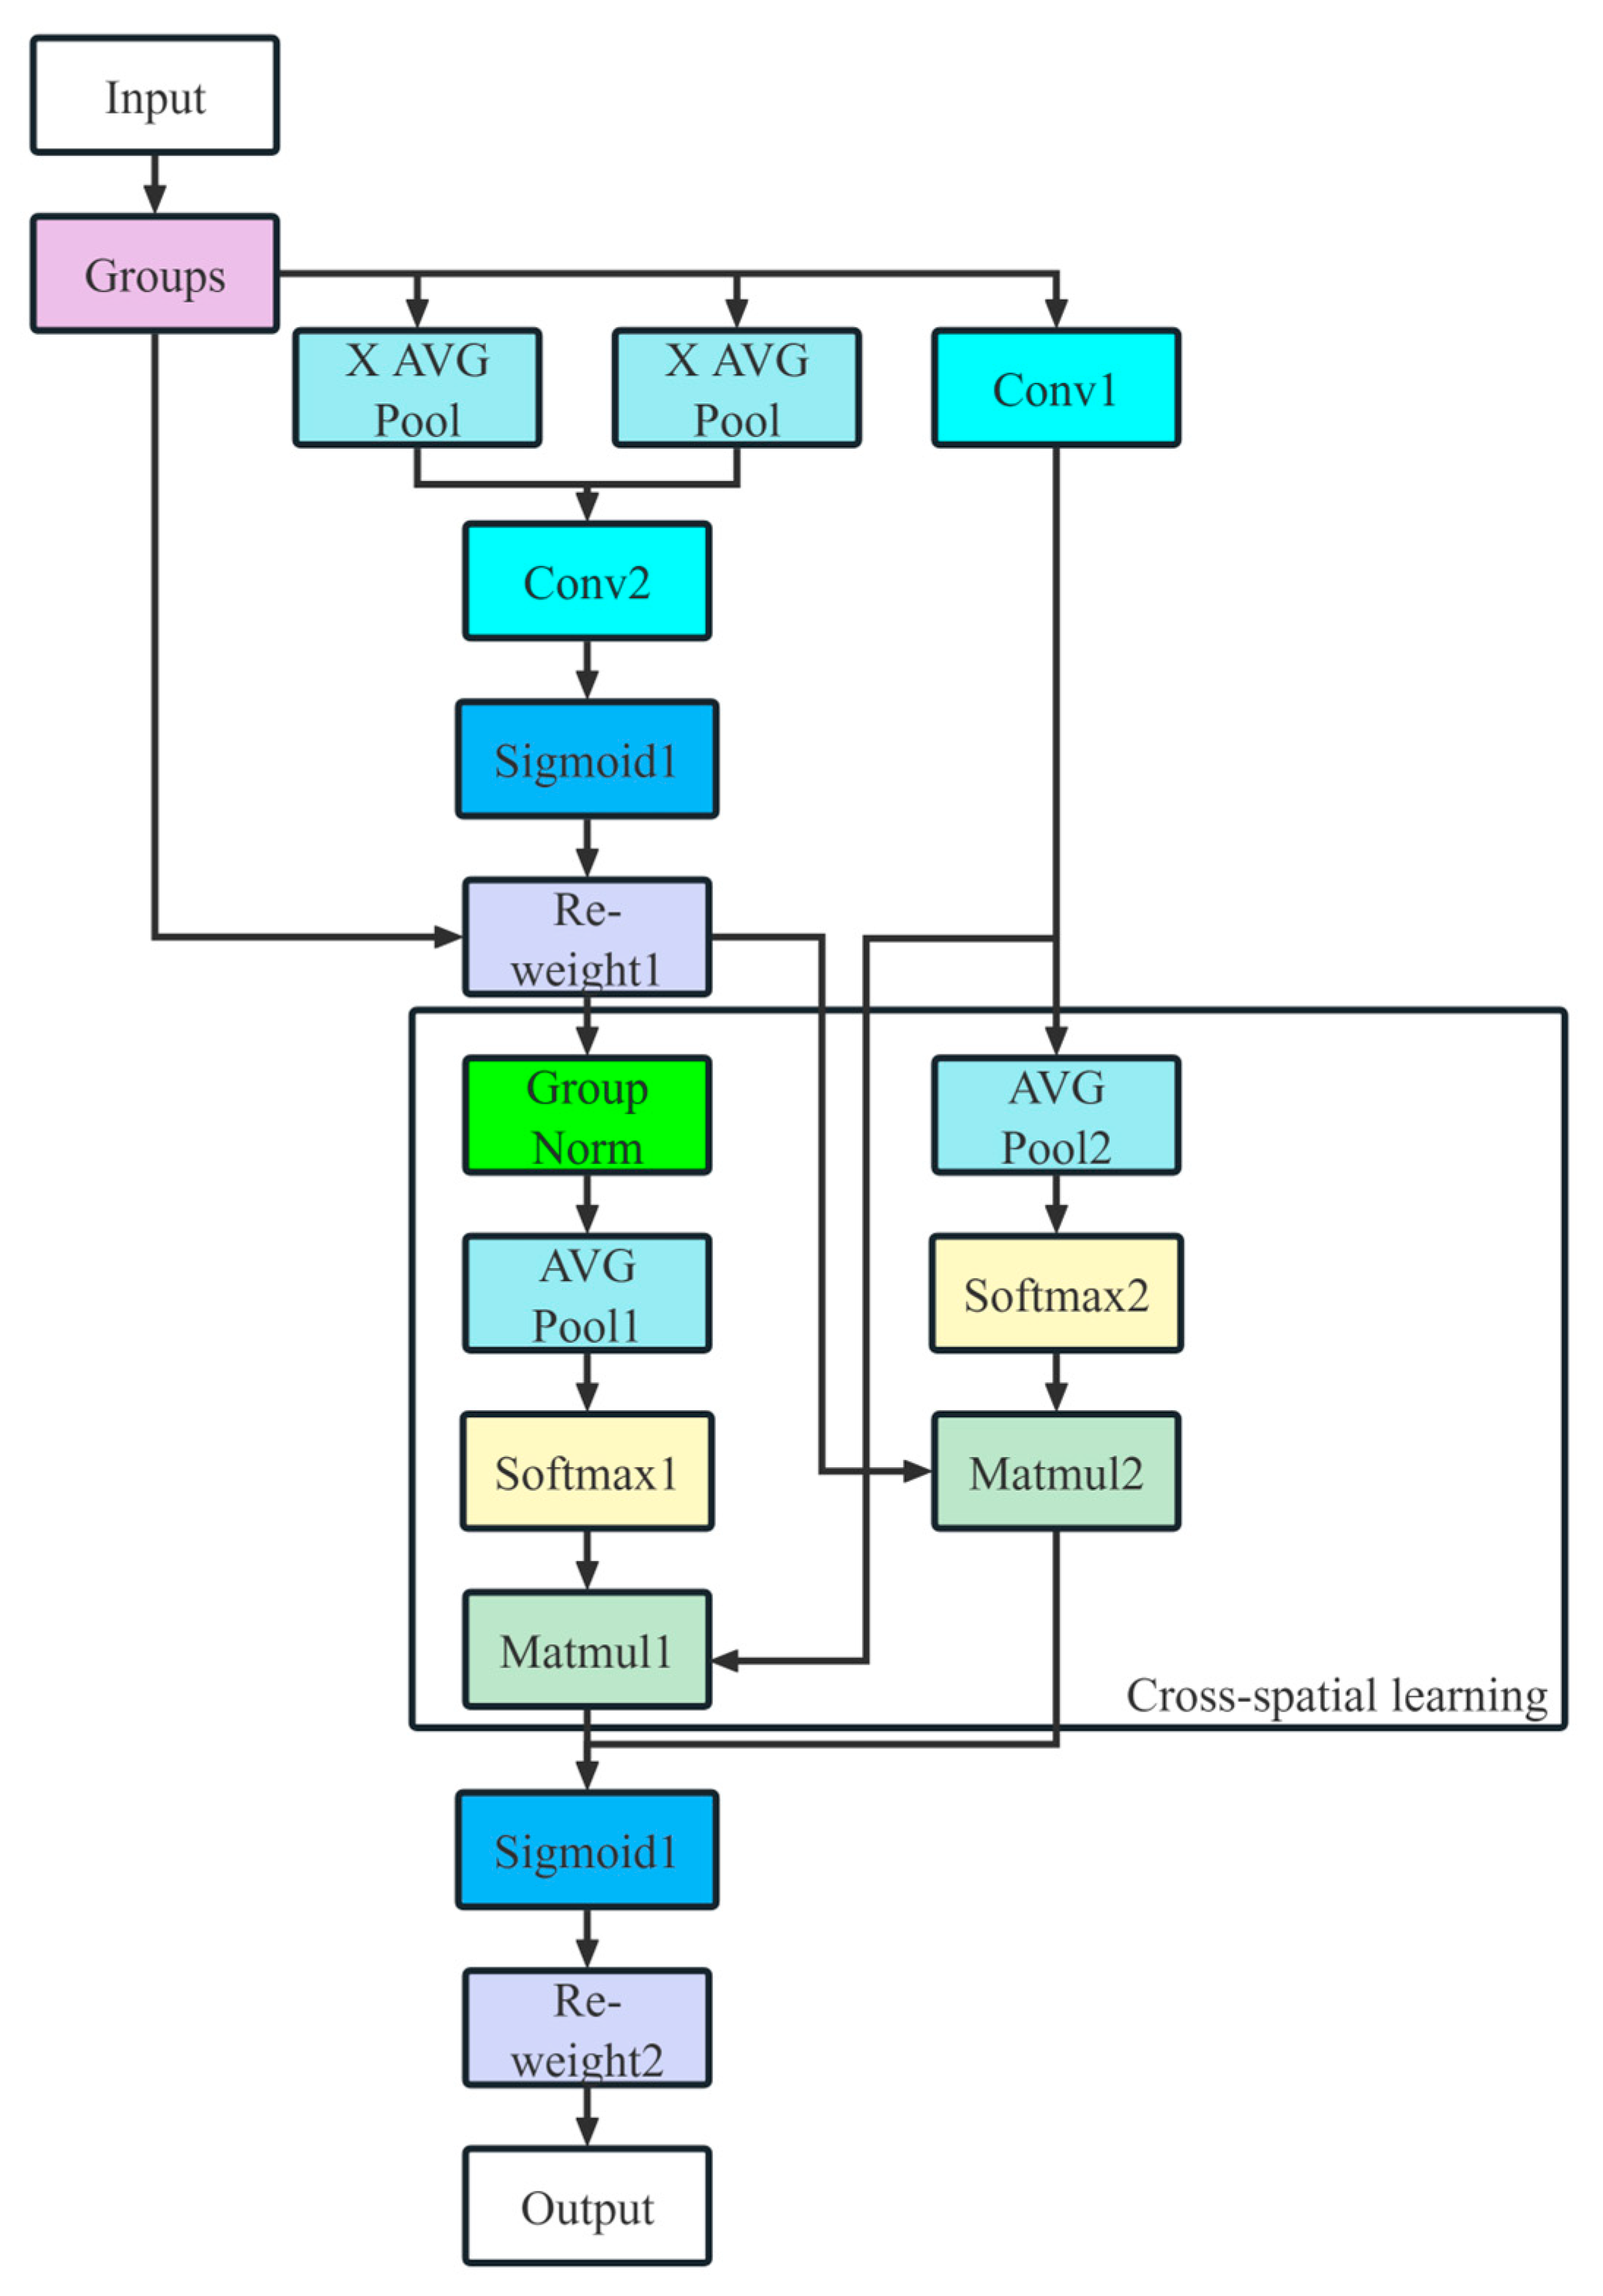
- Efficient Multi-Scale Attention (EMA) is integrated at the end of the backbone, combining channel and spatial information in the feature maps to provide the segmentation head with enriched feature representations.
- Mask2Former is utilized as the segmentation head; it is a versatile architecture designed for various image segmentation tasks, demonstrating excellent performance on our new dataset.
- Poly Loss is employed as the classification loss, with parameters adjusted according to the dataset to improve the model’s accuracy during training.
- Log-Cosh Dice Loss is utilized as part of the mask loss to address gradient issues associated with the original Dice Loss, leading to more effective training.
2. Related Works
2.1. Vision-Based Safety Monitoring
2.2. Safety Harness Monitoring Based on Deep Learning
2.3. Deep Learning-Based Semantic Segmentation
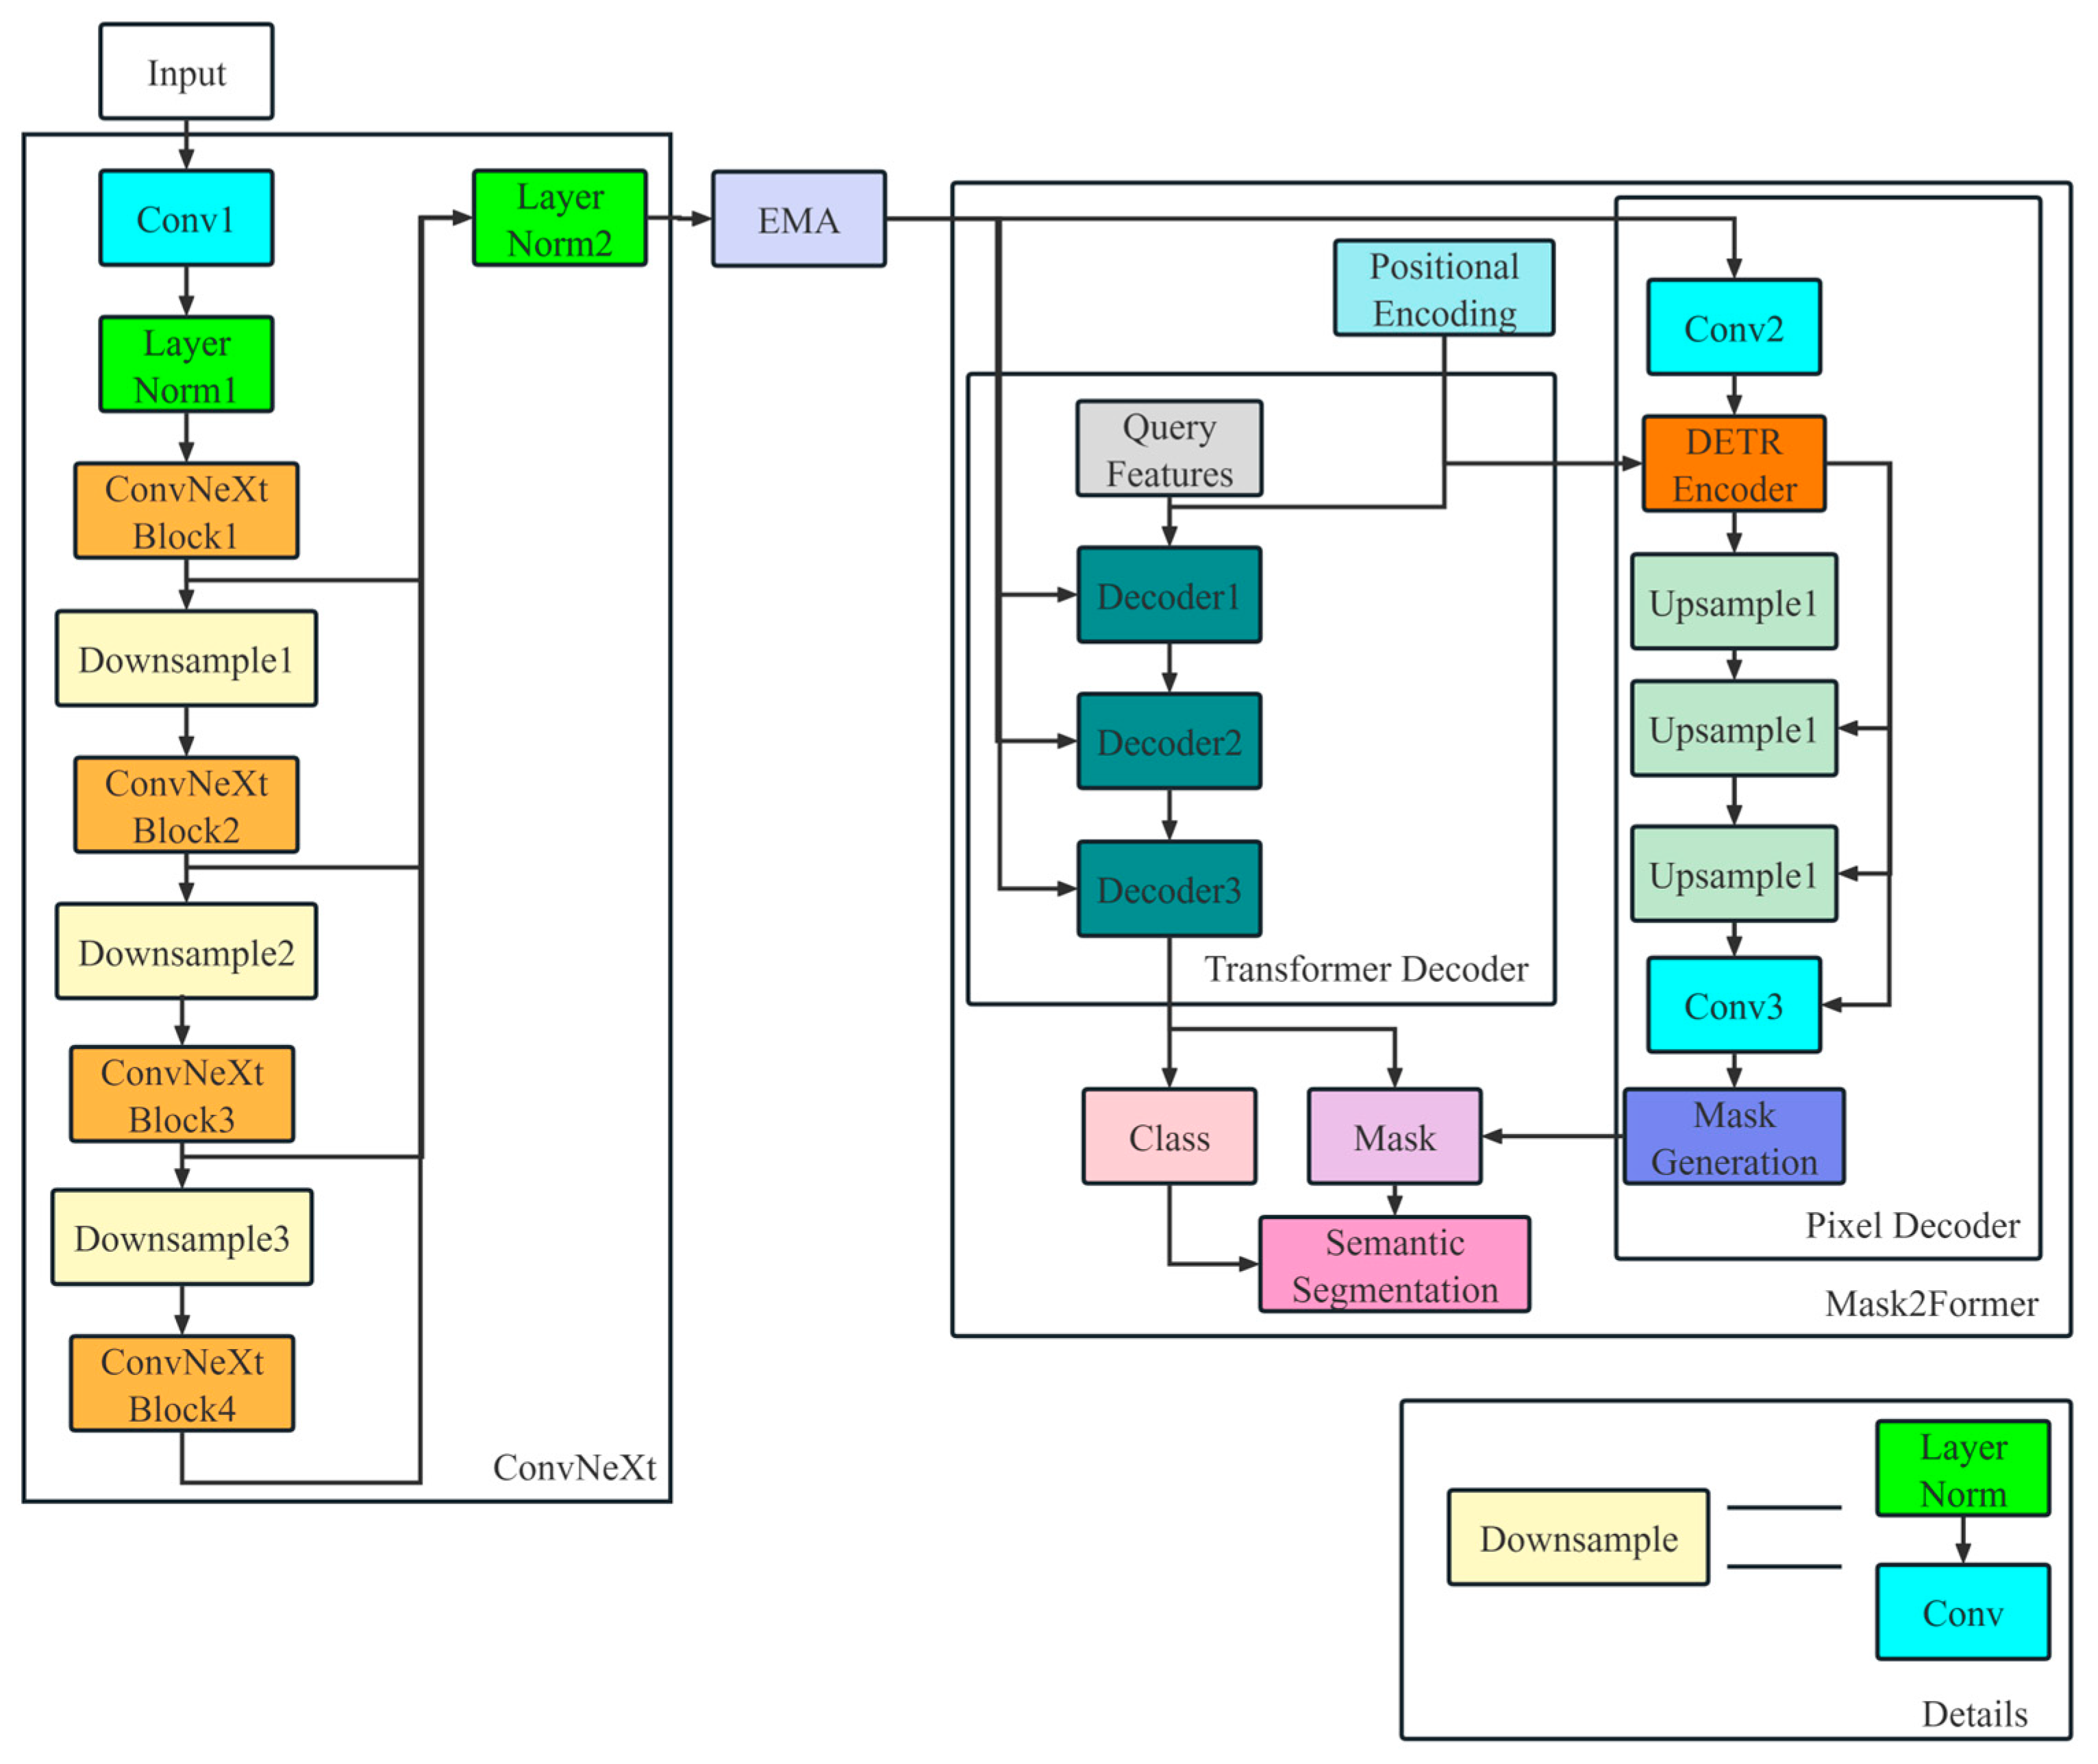
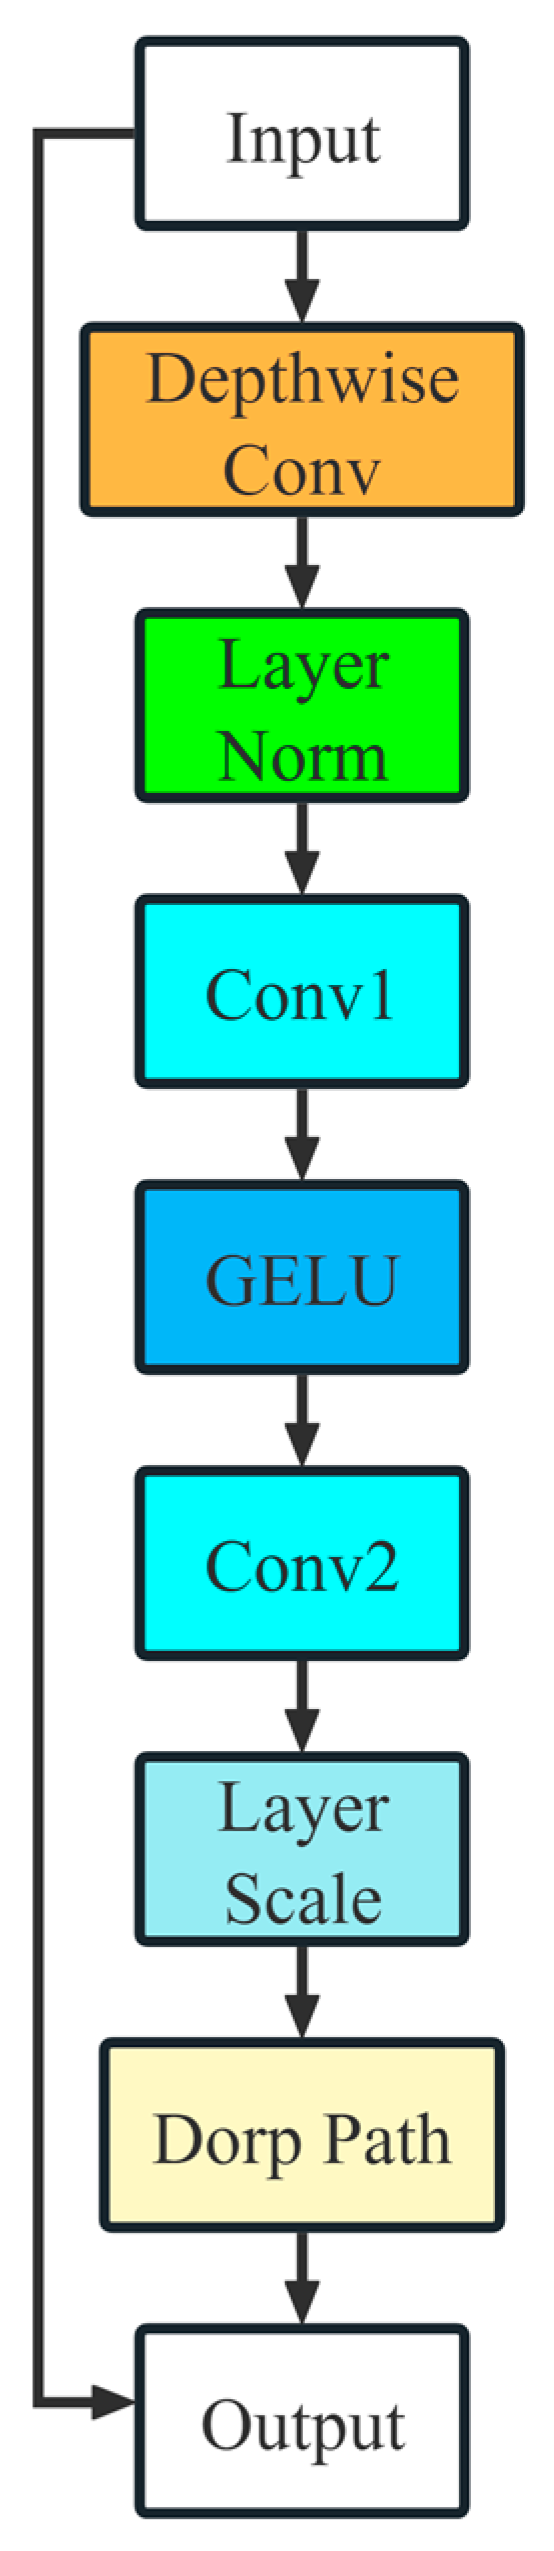
3. Method
3.1. New Dataset
3.2. ConvNeXt
3.3. Efficient Multi-Scale Attention (EMA)
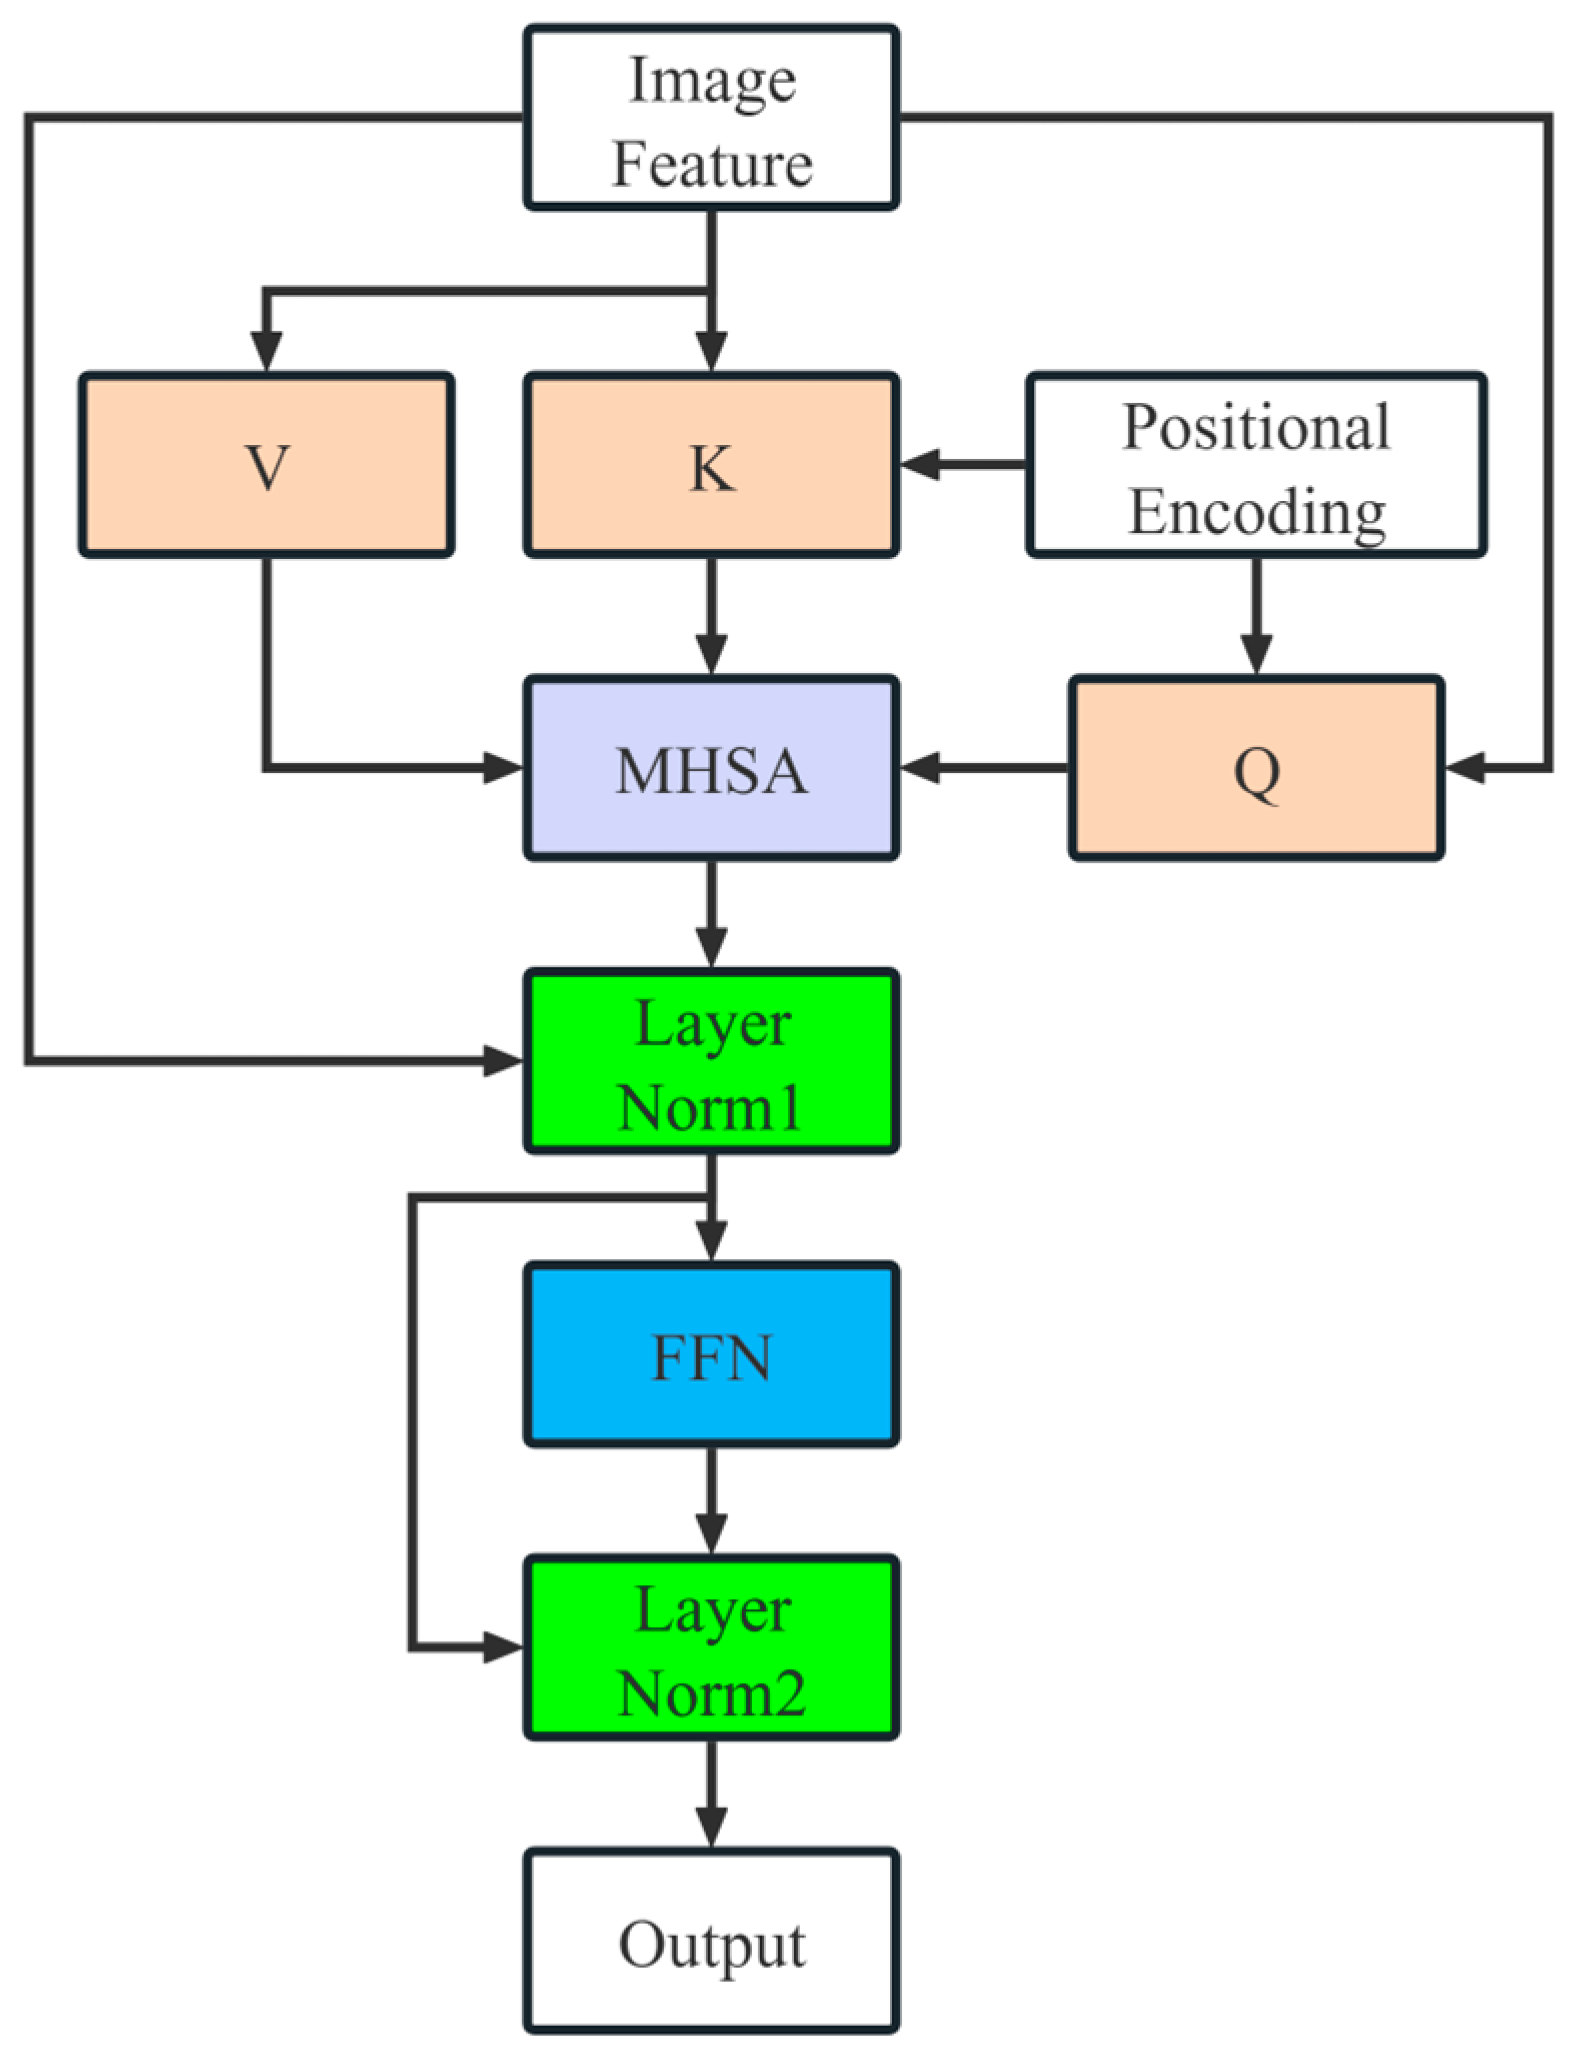
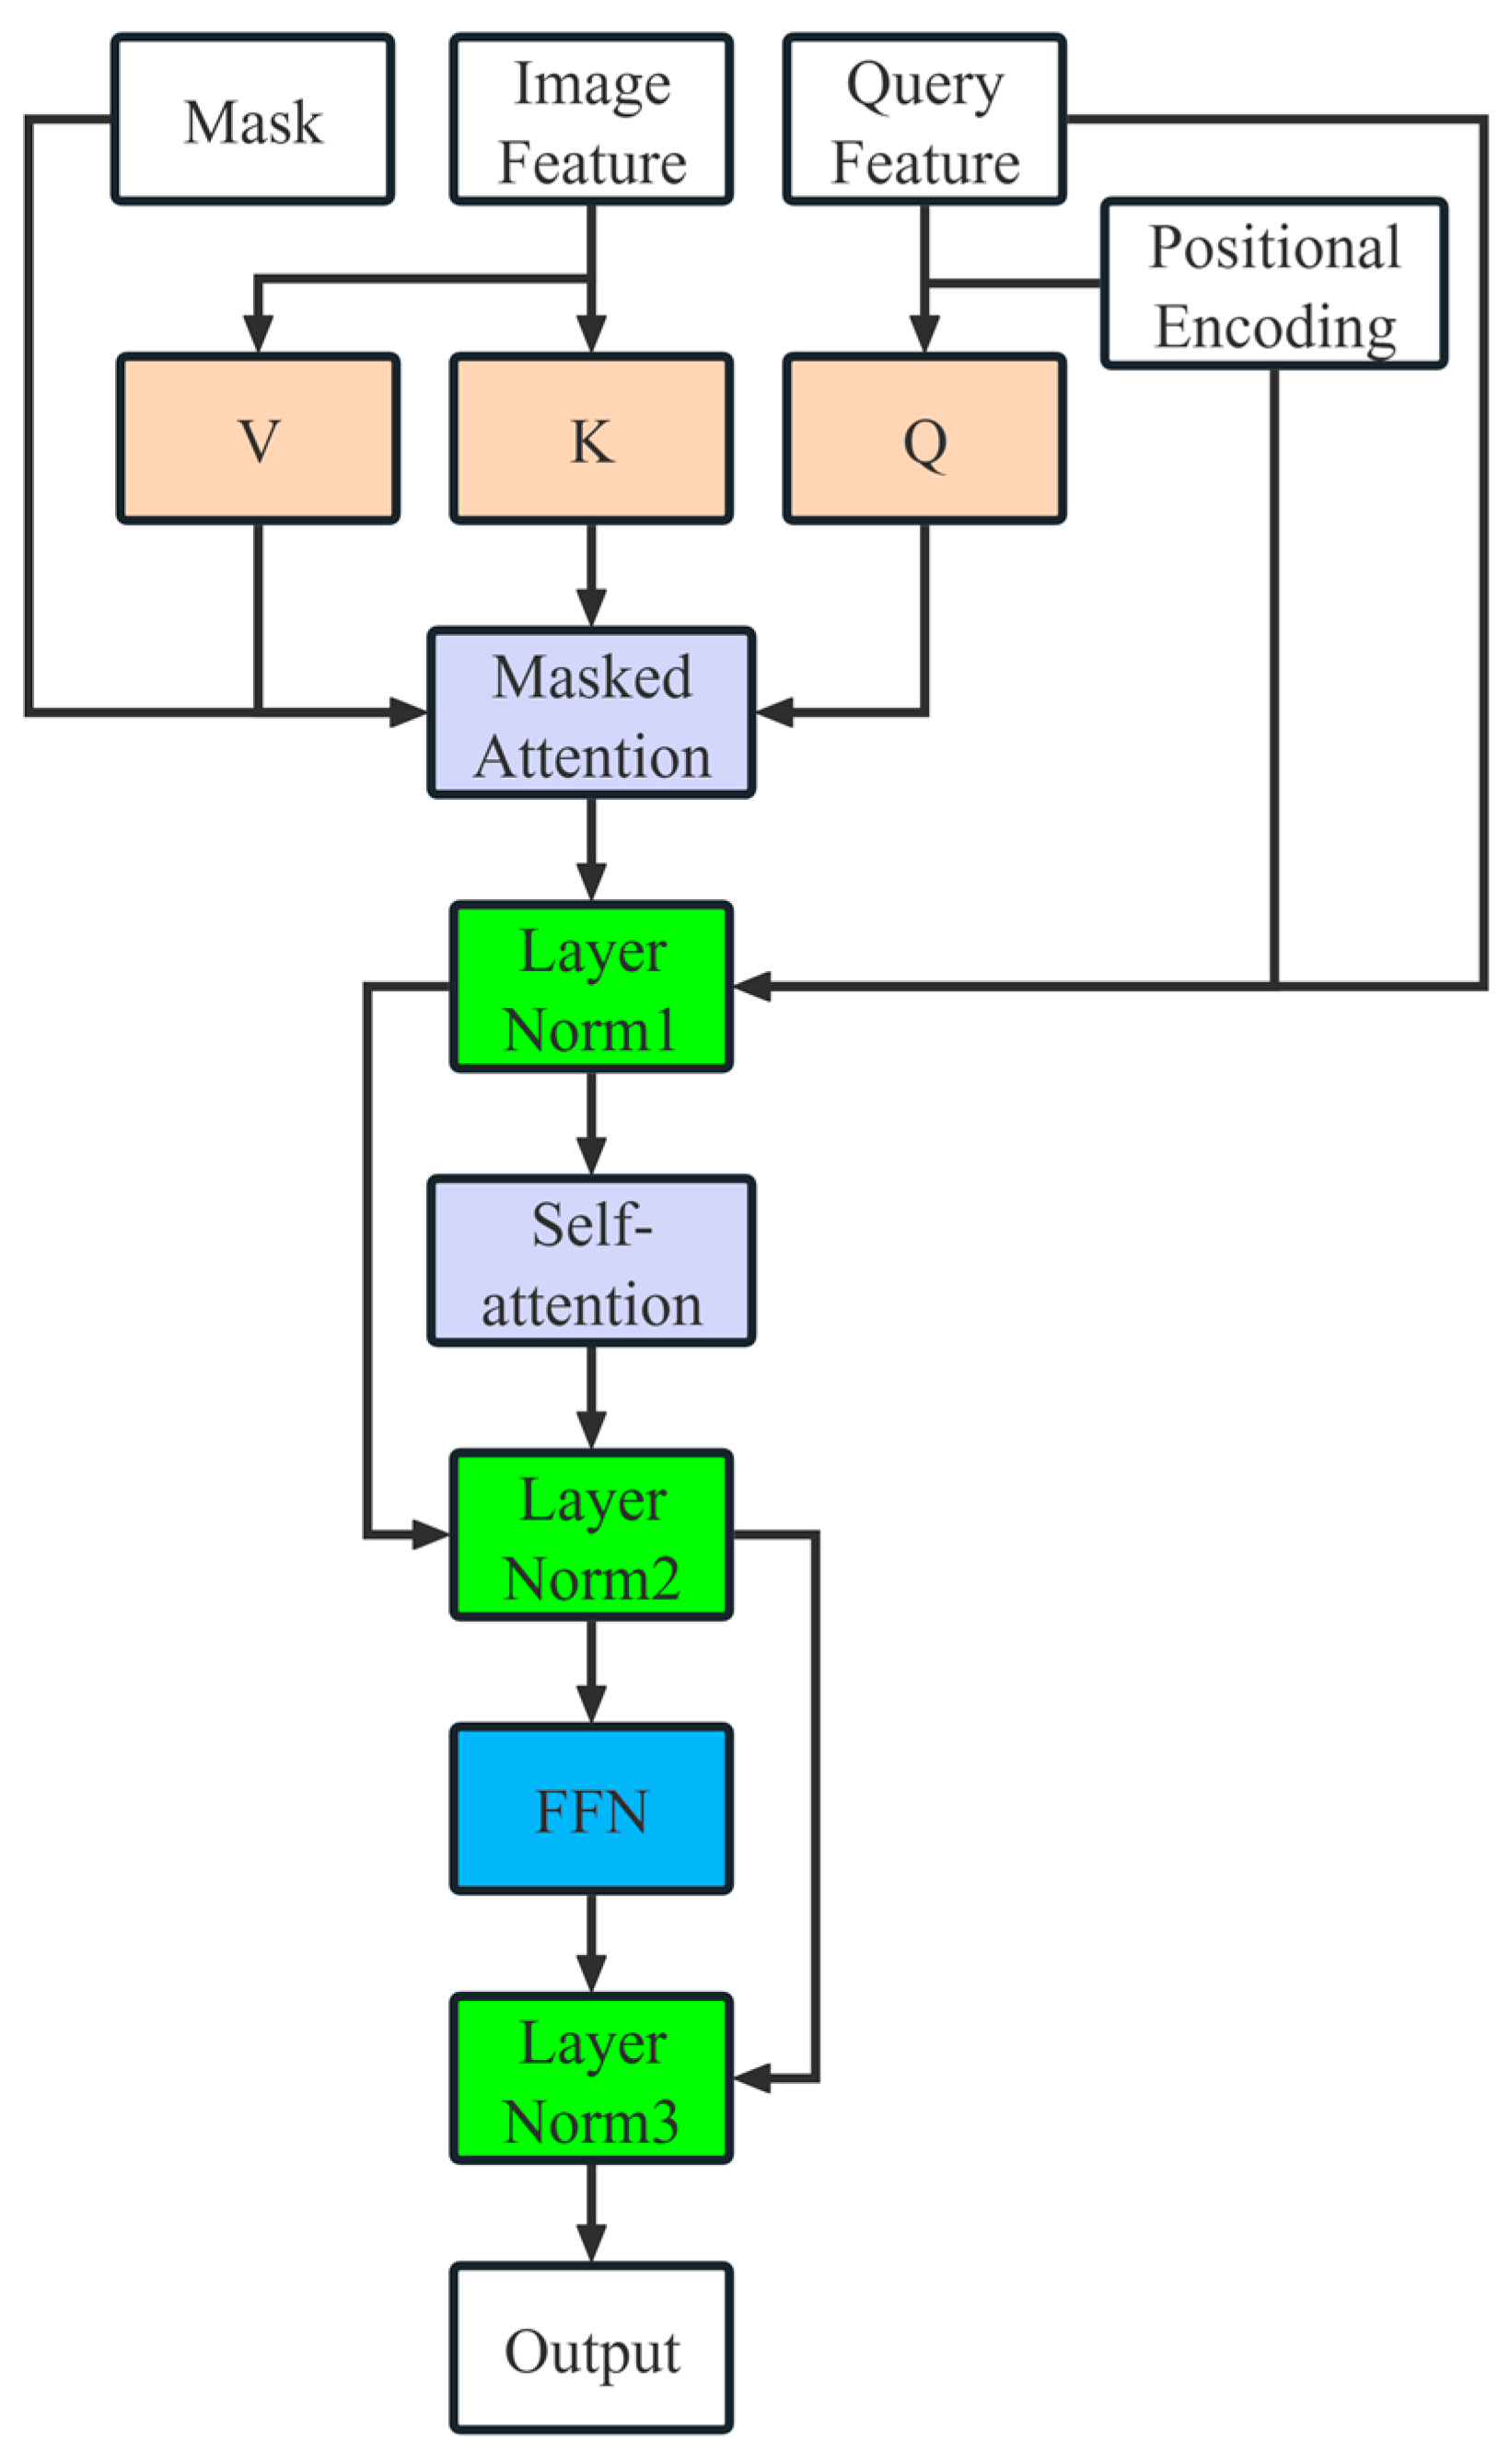
3.4. Mask2Former
3.5. Loss Function
4. Experiments
4.1. Dataset
4.2. Evaluation Metrics
4.3. Environment and Parameter Settings
4.4. Results
4.5. Ablation Study
5. Conclusions
Author Contributions
Funding
Data Availability Statement
Conflicts of Interest
References
- Anantharaman, V.; Zuhary, T.; Ying, H.; Krishnamurthy, N. Characteristics of injuries resulting from falls from height in the construction industry. Singap. Med. J. 2023, 64, 237. [Google Scholar] [CrossRef] [PubMed]
- Zhou, Q.; Liu, D.; An, K. ESE-YOLOv8: A Novel Object Detection Algorithm for Safety Belt Detection during Working at Heights. Entropy 2024, 26, 591. [Google Scholar] [CrossRef] [PubMed]
- Xiong, R.; Tang, P. Pose Guided Anchoring for Detecting Proper Use of Personal Protective Equipment. Autom. Constr. 2021, 130, 103828. [Google Scholar] [CrossRef]
- Khan, N.; Saleem, M.R.; Lee, D.; Park, M.-W.; Park, C. Utilizing Safety Rule Correlation for Mobile Scaffolds Monitoring Leveraging Deep Convolution Neural Networks. Comput. Ind. 2021, 129, 103448. [Google Scholar] [CrossRef]
- Gong, F.; Ji, X.; Gong, W.; Yuan, X.; Gong, C. Deep Learning Based Protective Equipment Detection on Offshore Drilling Platform. Symmetry 2021, 13, 954. [Google Scholar] [CrossRef]
- Riaz, M.; He, J.; Xie, K.; Alsagri, H.S.; Moqurrab, S.A.; Alhakbani, H.A.A.; Obidallah, W.J. Enhancing Workplace Safety: PPE_Swin—A Robust Swin Transformer Approach for Automated Personal Protective Equipment Detection. Electronics 2023, 12, 4675. [Google Scholar] [CrossRef]
- Shi, C.; Zhu, D.; Shen, J.; Zheng, Y.; Zhou, C. GBSG-YOLOv8n: A Model for Enhanced Personal Protective Equipment Detection in Industrial Environments. Electronics 2023, 12, 4628. [Google Scholar] [CrossRef]
- Ludwika, A.S.; Rifai, A.P. Deep Learning for Detection of Proper Utilization and Adequacy of Personal Protective Equipment in Manufacturing Teaching Laboratories. Safety 2024, 10, 26. [Google Scholar] [CrossRef]
- Zhang, H.; Mu, C.; Ma, X.; Guo, X.; Hu, C. MEAG-YOLO: A Novel Approach for the Accurate Detection of Personal Protective Equipment in Substations. Appl. Sci. 2024, 14, 4766. [Google Scholar] [CrossRef]
- Zaidi, S.F.A.; Yang, J.; Abbas, M.S.; Hussain, R.; Lee, D.; Park, C. Vision-Based Construction Safety Monitoring Utilizing Temporal Analysis to Reduce False Alarms. Buildings 2024, 14, 1878. [Google Scholar] [CrossRef]
- Sanjeewani, P.; Neuber, G.; Fitzgerald, J.; Chandrasena, N.; Potums, S.; Alavi, A.; Lane, C. Real-Time Personal Protective Equipment Non-Compliance Recognition on AI Edge Cameras. Electronics 2024, 13, 2990. [Google Scholar] [CrossRef]
- Chen, S.; Demachi, K. A Vision-Based Approach for Ensuring Proper Use of Personal Protective Equipment (PPE) in Decommissioning of Fukushima Daiichi Nuclear Power Station. Appl. Sci. 2020, 10, 5129. [Google Scholar] [CrossRef]
- Tang, S.; Roberts, D.; Golparvar-Fard, M. Human-Object Interaction Recognition for Automatic Construction Site Safety Inspection. Autom. Constr. 2020, 120, 103356. [Google Scholar] [CrossRef]
- 2020 Research on the Development Status of China’s Electric Power Industry and Analysis of Accident Casualties, with Hunan Having the Highest Casualty Numbers. Available online: https://www.huaon.com/channel/trend/699986.html (accessed on 17 September 2024).
- Ma, L.; Li, X.; Dai, X.; Guan, Z.; Lu, Y. A Combined Detection Algorithm for Personal Protective Equipment Based on Lightweight YOLOv4 Model. Wirel. Commun. Mob. Comput. 2022, 3574588. [Google Scholar] [CrossRef]
- Chen, S.; Demachi, K. Towards On-Site Hazards Identification of Improper Use of Personal Protective Equipment Using Deep Learning-Based Geometric Relationships and Hierarchical Scene Graph. Autom. Constr. 2021, 125, 103619. [Google Scholar] [CrossRef]
- Fang, W.; Ding, L.; Luo, H.; Love, P.E.D. Falls from Heights: A Computer Vision-Based Approach for Safety Harness Detection. Autom. Constr. 2018, 91, 53–61. [Google Scholar] [CrossRef]
- Chern, W.-C.; Hyeon, J.; Nguyen, T.V.; Asari, V.K.; Kim, H. Context-Aware Safety Assessment System for Far-Field Monitoring. Autom. Constr. 2023, 149, 104779. [Google Scholar] [CrossRef]
- Fang, Q.; Li, H.; Luo, H.; Ding, L.; Luo, X.; Li, C. Computer Vision Aided Inspection on Falling Prevention Measures for Steeplejacks in an Aerial Environment. Autom. Constr. 2018, 93, 148–164. [Google Scholar] [CrossRef]
- Li, J.; Zhao, X.; Zhou, G.; Zhang, M. Standardized Use Inspection of Workers’ Personal Protective Equipment Based on Deep Learning. Saf. Sci. 2022, 150, 105689. [Google Scholar] [CrossRef]
- Long, J.; Shelhamer, E.; Darrell, T. Fully Convolutional Networks for Semantic Segmentation. In Proceedings of the IEEE Conference on Computer Vision and Pattern Recognition, Boston, MA, USA, 7–12 June 2015; pp. 3431–3440. [Google Scholar]
- Ronneberger, O.; Fischer, P.; Becker, K. U-Net: Convolutional Networks for Biomedical Image Segmentation. In Medical Image Computing and Computer-Assisted Intervention, Proceedings of the MICCAI 2015: 18th International Conference, Munich, Germany, 5–9 October 2015; Springer: Cham, Switzerland, 2015; pp. 234–241. [Google Scholar]
- Chen, L.C.; Papandreou, G.; Kokkinos, I.; Murphy, K.; Yuille, A.L. Deeplab: Semantic Image Segmentation with Deep Convolutional Nets, Atrous Convolution, and Fully Connected CRFs. IEEE Trans. Pattern Anal. Mach. Intell. 2017, 40, 834–848. [Google Scholar] [CrossRef]
- He, K.; Gkioxari, G.; Dollár, P.; Girshick, R. Mask R-CNN. In Proceedings of the IEEE International Conference on Computer Vision, Venice, Italy, 22–29 October 2017; pp. 2980–2988. [Google Scholar]
- Dosovitskiy, A.; Beyer, L.; Kolesnikov, A.; Weissenborn, D.; Zhai, X. An Image is Worth 16x16 Words: Transformers for Image Recognition at Scale. arXiv 2021, arXiv:2010.11929. [Google Scholar]
- Cheng, B.; Misra, I.; Schwing, A.G.; Kirillov, A.; Girdhar, R. Masked-Attention Mask Transformer for Universal Image Segmentation. In Proceedings of the IEEE/CVF Conference on Computer Vision and Pattern Recognition, New Orleans, LA, USA, 18–24 June 2022; pp. 1290–1299. [Google Scholar]
- Zhang, J.; Song, Y.; Ren, K.; Liu, Y.; Yue, Z. Mutual feedback between Mask2former and crack information under dynamic rock fractures. Theor. Appl. Fract. Mech. 2024, 133, 104602. [Google Scholar] [CrossRef]
- García, G.; Aparcedo, A.; Nayak, G.K.; Ahmed, T.; Shah, M.; Li, M. Generalized deep learning model for photovoltaic module segmentation from satellite and aerial imagery. Solar Energy 2024, 274, 112539. [Google Scholar] [CrossRef]
- Li, Y.; Wang, J.; Liang, M.; Song, H.; Liao, J.; Lan, Y. A Novel Two-Stage Approach for Automatic Extraction and Multi-View Generation of Litchis. Agriculture 2024, 14, 1046. [Google Scholar] [CrossRef]
- Guo, S.; Yang, Q.; Xiang, S.; Wang, S.; Wang, X. Mask2Former with Improved Query for Semantic Segmentation in Remote-Sensing Images. Mathematics 2024, 12, 765. [Google Scholar] [CrossRef]
- Liu, Z.; Mao, H.; Wu, C.Y.; Feichtenhofer, C.; Darrell, T.; Xie, S. A ConvNet for the 2020s. In Proceedings of the IEEE/CVF Conference on Computer Vision and Pattern Recognition, New Orleans, LA, USA, 18–24 June 2022; pp. 11976–11986. [Google Scholar]
- He, K.; Zhang, X.; Ren, S.; Sun, J. Deep Residual Learning for Image Recognition. In Proceedings of the IEEE Conference on Computer Vision and Pattern Recognition, Las Vegas, NV, USA, 27–30 June 2016; pp. 770–778. [Google Scholar]
- Hao, S.; Zhang, L.; Jiang, Y.; Wang, J.; Ji, Z.; Zhao, L.; Ganchev, I. ConvNeXt-ST-AFF: A Novel Skin Disease Classification Model Based on Fusion of ConvNeXt and Swin Transformer. IEEE Access 2023, 11, 117460–117473. [Google Scholar] [CrossRef]
- Zhang, L.; Song, W.; Zhu, T.; Liu, Y.; Chen, W.; Cao, Y. ConvNeXt-MHC: Improving MHC–Peptide Affinity Prediction by Structure-Derived Degenerate Coding and the ConvNeXt Model. Brief. Bioinform. 2024, 25, bbae133. [Google Scholar] [CrossRef]
- Liu, C.; Yin, Y.; Qian, R.; Wang, S.; Xia, J.; Zhang, J.; Zhao, L. Enhanced Winter Wheat Seedling Classification and Identification Using the SETFL-ConvNeXt Model: Addressing Overfitting and Optimizing Training Strategies. Agronomy 2024, 14, 1914. [Google Scholar] [CrossRef]
- Zhao, Y.; Liang, Q.; Tian, Z. ConvNeXt-BiGRU Rolling Bearing Fault Detection Based on Attention Mechanism. In International Conference on Intelligent Computing; Springer Nature: Singapore, 2024; pp. 66–76. [Google Scholar]
- Ouyang, D.; He, S.; Zhang, G.; Luo, M.; Guo, H.; Zhan, J.; Huang, Z. Efficient Multi-Scale Attention Module with Cross-Spatial Learning. In Proceedings of the IEEE International Conference on Acoustics, Speech and Signal Processing (ICASSP), Rhodes, Greek, 4–9 June 2023. [Google Scholar]
- Li, H.; Li, J.; Wei, H.; Liu, Z.; Zhan, Z.; Ren, Q. Slim-Neck by Gsconv: A Lightweight-Design for Real-Time Detector Architectures. J. Real-Time Image Process. 2024, 21, 62. [Google Scholar] [CrossRef]
- Carion, N.; Massa, F.; Synnaeve, G.; Usunier, N.; Kirillov, A.; Zagoruyko, S. End-to-End Object Detection with Transformers. In European Conference on Computer Vision; Springer International Publishing: Cham, Switzerland, 2020; pp. 213–229. [Google Scholar]
- Leng, Z.; Tan, M.; Liu, C.; Cubuk, E.D.; Shi, X.; Cheng, S.; Anguelov, D. PolyLoss: A Polynomial Expansion Perspective of Classification Loss Functions. arXiv 2022, arXiv:2204.12511. [Google Scholar]
- Milletari, F.; Navab, N.; Ahmadi, S.A. V-Net: Fully Convolutional Neural Networks for Volumetric Medical Image Segmentation. In Proceedings of the 2016 Fourth International Conference on 3D Vision (3DV), Stanford, CA, USA, 25–28 October 2016; IEEE: Piscataway, NJ, USA, 2016; pp. 565–571. [Google Scholar]
- Jadon, S. A Survey of Loss Functions for Semantic Segmentation. In Proceedings of the 2020 IEEE Conference on Computational Intelligence in Bioinformatics and Computational Biology (CIBCB), Via del Mar, Chile, 27–29 October 2020; IEEE: Piscataway, NJ, USA, 2020; pp. 1–7. [Google Scholar]
- Xu, J.; Xiong, Z.; Bhattacharyya, S.P. PIDNet: A Real-Time Semantic Segmentation Network Inspired by PID Controllers. In Proceedings of the IEEE/CVF Conference on Computer Vision and Pattern Recognition (CVPR), Vancouver, BC, Canada, 17–24 June 2023; pp. 19529–19539. [Google Scholar]
- Guo, M.H.; Lu, C.Z.; Hou, Q.; Liu, Z.; Cheng, M.M.; Hu, S.M. SegNext: Rethinking Convolutional Attention Design for Semantic Segmentation. Adv. Neural Inf. Process. Syst. 2022, 35, 1140–1156. [Google Scholar]
- Yu, W.; Luo, M.; Zhou, P.; Si, C.; Zhou, Y.; Wang, X.; Feng, J.; Yan, S. Metaformer Is Actually What You Need for Vision. In Proceedings of the IEEE/CVF Conference on Computer Vision and Pattern Recognition, New Orleans, LA, USA, 18–24 June 2022; pp. 10819–10829. [Google Scholar]
- Xiao, T.; Liu, Y.; Zhou, B.; Jiang, Y.; Sun, J. Unified Perceptual Parsing for Scene Understanding. In Proceedings of the European Conference on Computer Vision (ECCV), Munich, Germany, 8–14 September 2018. [Google Scholar]
- Pan, H.; Hong, Y.; Sun, W.; Jia, Y. Deep Dual-Resolution Networks for Real-Time and Accurate Semantic Segmentation of Traffic Scenes. IEEE Trans. Intell. Transp. Syst. 2022, 24, 3448–3460. [Google Scholar] [CrossRef]

| Model | AccBackground | AccOffground | AccGround | AccSafebelt | AccSaferope | mAcc | Time |
|---|---|---|---|---|---|---|---|
| PIDNet-L | 99.76% | 92.54% | 88.34% | 86.65% | 74.46% | 88.35% | 95.2 ms |
| SegNext- MSCAN-L | 99.64% | 92.56% | 88.09% | 83.85% | 70.64% | 86.96% | 119.1 ms |
| PoolFormer-m36 | 99.76% | 92.51% | 88.54% | 83.14% | 72.57% | 87.31% | 151.4 ms |
| ConvNeXt-T | 99.77% | 93.54% | 89.04% | 84.97% | 75.63% | 88.59% | 124.2 ms |
| DDRNet-23 | 99.80% | 67.52% | 55.18% | 55.84% | 38.77% | 63.42% | 154.3 ms |
| Mask2Former | 99.72% | 92.58% | 89.82% | 85.55% | 78.14% | 89.16% | 122.7 ms |
| CEMFormer (Ours) | 99.51% | 90.91% | 89.33% | 90.14% | 91.68% | 92.31% | 119.1 ms |
| Experiment | 1 | 2 | 3 | 4 | 5 |
|---|---|---|---|---|---|
| ConvNeXt | √ | √ | √ | √ | × |
| EMA | √ | √ | √ | × | × |
| Poly Loss | √ | √ | × | × | × |
| Log-Cosh Dice Loss | √ | × | × | × | × |
| AccBackground | 99.51% | 99.55% | 99.76% | 99.69% | 99.72% |
| AccOffground | 90.91% | 84.55% | 92.51% | 92.33% | 92.58% |
| AccGround | 89.33% | 91.85% | 90.72% | 91.53% | 89.82% |
| AccSafebelt | 90.14% | 85.27% | 85.43% | 86.61% | 85.55% |
| AccSaferope | 91.68% | 88.87% | 80.18% | 77.05% | 78.14% |
| mAcc | 92.31% | 90.02% | 89.72% | 89.44% | 89.16% |
Disclaimer/Publisher’s Note: The statements, opinions and data contained in all publications are solely those of the individual author(s) and contributor(s) and not of MDPI and/or the editor(s). MDPI and/or the editor(s) disclaim responsibility for any injury to people or property resulting from any ideas, methods, instructions or products referred to in the content. |
© 2024 by the authors. Licensee MDPI, Basel, Switzerland. This article is an open access article distributed under the terms and conditions of the Creative Commons Attribution (CC BY) license (https://creativecommons.org/licenses/by/4.0/).
Share and Cite
Zhou, Q.; Liu, D. Improving Safety in High-Altitude Work: Semantic Segmentation of Safety Harnesses with CEMFormer. Symmetry 2024, 16, 1449. https://doi.org/10.3390/sym16111449
Zhou Q, Liu D. Improving Safety in High-Altitude Work: Semantic Segmentation of Safety Harnesses with CEMFormer. Symmetry. 2024; 16(11):1449. https://doi.org/10.3390/sym16111449
Chicago/Turabian StyleZhou, Qirui, and Dandan Liu. 2024. "Improving Safety in High-Altitude Work: Semantic Segmentation of Safety Harnesses with CEMFormer" Symmetry 16, no. 11: 1449. https://doi.org/10.3390/sym16111449
APA StyleZhou, Q., & Liu, D. (2024). Improving Safety in High-Altitude Work: Semantic Segmentation of Safety Harnesses with CEMFormer. Symmetry, 16(11), 1449. https://doi.org/10.3390/sym16111449