1. Introduction
With the unprecedented rapid development of digital products, traditional software testing methods are facing increasing challenges to ensure product quality, even when automated or using device simulators [
1]. More and more researchers are turning their attention to crowdsourced testing. Crowdsourced testing uses a special software platform to convene a large workforce for testing tasks [
2]. It provides an efficient and streamlined way to test the use of workforces who only show up when they are needed (without the ongoing cost of an internal team). The benefit of crowdsourced testing is the ability to gain a greater variety of test scenarios and test quality because it avoids cognitive tunneling (focusing too much on one thing and missing other relevant data) and operational blindness (where one is too familiar with something and miss obvious problems and opportunities) [
2].
The problem with crowdsourced testing is dealing with the large number of test reports [
3]. Although a large number of test reports are obtained, the number of valuable reports was relatively small, as duplicate reports amount to almost 82% [
4]. High repetition rates are inevitable because of the inherent properties of crowdsourced testing, where a large number of testers test the same product at the same time. Therefore, it is necessary to identify duplicate test reports, and it is more valuable to prioritize the test reports to review as few reports as possible to find as many errors as possible.
In the past, many crowdsourced test report prioritization methods have been proposed, which can be classified as text-based [
5,
6,
7] and text- and image-based [
8,
9,
10]. The concept of prioritization of crowdsourced test reports was first proposed by Feng et al. [
5]. They used natural language processing (NLP) to extract keywords from the test reports and designed two prioritization strategies: risk strategy and diversity strategy. They later used a hybrid analysis method of text and images to prioritize the test reports and found that image-understanding techniques can improve the prioritization performance of test reports [
8]. While these text- and image-based methods greatly improve the efficiency of processing test reports, they are designed for mobile applications and are often difficult to apply directly to web applications. For crowdsourced test reports of mobile applications, textual information often lacks sufficient detail and accuracy, but screenshots are usually well defined and depict the active view. However, crowdsourced test reports of web applications have longer and clearer textual descriptions of errors; their screenshot information includes more screens and windows of different sizes—even multiple windows—and more noise information. Testers usually take full-screen screenshots to save time, which result in screenshots with noisy information such as user-related browser favorites, window titles, and so on. Therefore, it is necessary to design new processing methods for crowdsourced test reports of web applications.
In this paper, we present a method called WDDiv for prioritizing crowdsourced test reports of web applications. We integrate textual and image information from test reports to enhance the analysis process. For textual information, we use NLP to extract textual features to measure textual distances. For image information, to refine the feature extraction, we first preprocess the images, then convert the images to text data using optical character recognition (OCR), and finally filter to facilitate image distance measurement. Next, we combine these distance results through a weighting formula. Based on the fusion results, we ultimately prioritize the test reports based on diversity in order to detect more unique errors as early as possible.
To evaluate our method, we use simulated crowdsourced tests of five modules for a web application provided by a foreign trade company. In total, we collected and analyzed 717 crowdsourced test reports. We used the APFD (average percentage of fault detected) [
11] metric to evaluate the validity of our method. Experimental results show the following: (1) Converting image information to text information significantly improves the effectiveness of prioritization methods; (2) Our method can outperform the state-of-the-art prioritization method in the APFD metric; (3) Our method has a shorter run time to collate our dataset.
The primary contributions of this paper are as follows:
To the best of our knowledge, this is the first application of image-to-text technology for calculating report similarity to help prioritize crowdsourced test reports of web applications;
We worked with a company to collect over 717 test reports and 956 screenshots. We outsourced this dataset to expand research on this topic (
https://doi.org/10.57760/sciencedb.09699, accessed on 12 September 2023);
We have conducted experiments based on this dataset. The experimental results show that our method outperforms existing methods and can detect all errors earlier;
We provide a comprehensive analysis of the weighting parameter settings. Based on the empirical results, we suggest giving higher weight to textual information.
2. Related Work
2.1. Crowd Worker Recommendation
Crowdsourced testing inevitably faces the challenge of dealing with a large number of reports. Some studies mitigate this problem at the source by recommending the appropriate number of crowd workers for the task.
Most researchers view crowdsourced worker recommendations as a multi-objective optimization problem. Cui et al. [
12] introduced a method, ExReDiv, to select an appropriate set of workers for a test task to ensure a high error detection rate. It consists of three key strategies: an experience strategy, a relevance strategy, and a diversity strategy. The experience strategy is for selecting experienced workers; the relevance strategy is for selecting workers with expertise related to a given testing task; and the diversity strategy is for selecting different workers to avoid detecting duplicate errors. They [
13] also proposed a multi-objective crowd worker selection method (MOOSE) that uses the NSGA-II evolutionary algorithm to obtain the pareto optimal solution set. It contains three objectives: maximizing the coverage of testing requirements, minimizing the cost, and maximizing the error detection experience of the selected workers. Wang et al. [
14] proposed the multi-objective crowd worker recommendation method (MOCOM), where the objective consists of maximizing the probability of error detection of workers, relevance to the test task, and diversity of workers while minimizing test cost, in order to recommend the minimum number of crowd workers that can detect the most errors for a crowdsourced testing task. They [
15] also proposed a method called iRec to dynamically (in-process) recommend the right workers to speed up the crowdsourced testing process. They [
16] subsequently upgraded iRec to iRec 2.0 to address the inequity in recommendation results, where experienced workers were recommended for almost all tasks, while less-experienced workers were rarely recommended. Kamangar et al. [
17] have improved the validity of crowdsourced testing by applying personality types, specifically using the Myers–Briggs Type Indicator for measuring personality type. Xie et al. [
18] presented the challenge of achieving high test quality and expected test environment coverage in crowdsourced testing, called crowdsourced testing quality maximization under context coverage constraint (COCOON). They proved that the COCOON problem is NP-Complete and introduced two greedy methods.
These studies are effective, but they are still difficult to control, as the recommended crowdsourced workers do not guarantee high test quality. Therefore, we believe that it is more important to handle test reports directly in crowdsourced testing.
2.2. Duplicate Crowdsourced Test Report Identification
Duplicate crowdsourced test report identification is an area of research that is highly relevant to crowdsourced test report prioritization. Duplicate crowdsourced test report identification tries to find duplicate test reports; however, crowdsourced test report prioritization not only finds duplicate reports, but also arranges test reports in a way that facilitates quick inspection by testers.
Researchers have identified duplicate crowdsourced reports from text, image, and video perspectives. Jiang et al. [
19] proposed a framework called test report fuzzy clustering framework (TERFUR) to reduce the number of test reports inspected by aggregating duplicate and multi-error test reports into clusters. Chen et al. [
20] proposed a sentence embedding-based report clustering model to analyze crowdsourced test reports. Yang et al. [
21] used the screenshot information in the crowdsourced test reports to supplement the textual information to group the crowdsourced test reports and reduce the pressure on the testers to review the reports. They used the spatial pyramid matching (SPM) algorithm to extract the feature histograms of the screenshots. Wang et al. [
4] proposed SETU, which combines text and image information to detect duplicate crowdsourced reports. They extract image structure features and image color features to describe the screenshots. Cao et al. [
22] performed cluster analysis and selection of crowdsourced test reports by identifying the links between text and image information. Cooper et al. [
23] proposed a video-based duplicate detection method named TANGO that combines computer vision, optical character recognition, and text retrieval methods. Huang et al. [
24] conducted an empirical evaluation of 10 commonly used state-of-the-art duplicate detection methods. They found that machine learning-based methods, i.e., ML-REP, and deep learning-based methods, i.e., DL-BiMPM, are the best two methods; the latter is sensitive to the size of the training data.
2.3. Crowdsourced Test Report Prioritization
Crowdsourced test report prioritization methods can be classified as text-based and text- and image-based.
Text-based: DivRisk, which was proposed by Feng et al. [
5] in 2015, combines a diversity strategy and a risk strategy to prioritize crowdsourced test reports. The diversity strategy aims to prioritize the test reports that are most different from those already checked to reveal different errors. The risk strategy prioritizes the test reports that are most likely to reveal errors. Yang and Chen [
6] considered the impact of duplicate reports and proposed a method DivClass to determine the order of inspection of crowdsourced test reports based on diversity strategy and classification strategy. Zhu et al. [
7] migrated test case prioritization methods to crowdsourced test report prioritization and evaluated the effectiveness of these methods. They found that all these methods performed well, with an average APFD of over 0.8.
Text- and image-based: Feng et al. [
8] used not only text information but also rich screenshot information to assist in prioritizing test reports. They used the spatial pyramid matching (SPM) method to measure the similarity of screenshots. Based on their work, Liu et al. [
10] proposed a method that first clusters and then prioritizes crowdsourced test reports to aid the inspection process. Yu et al. [
25] proposed a crowdsourced test report prioritization method, DEEPRIOR, through an in-depth screenshot understanding. They obtained error features and context features in text and images. All three methods mentioned above are based on a diversity strategy for crowdsourced test report prioritization, but CTRP, proposed by Tong and Zhang [
9], also considers the severity of errors.
However, most of the methods are only designed for mobile applications, which are not applicable to web applications, so we propose a prioritization method for crowdsourced test reports of web applications.
3. Background and Motivation
Crowdsourced testing is all about leveraging a group of testers who are sourced via the internet to complete test tasks. Testers from different backgrounds have a variety of devices, operating systems, and browsers and vary in terms of real-world conditions and environments [
2]. This leads to more test scenarios and a greater test quality that a (small) in-house team cannot match. In-house teams are very expensive and time-consuming to set up, and also require the purchase of a lot of equipment for testing.
Crowdsourced testing tasks cover a wide range of areas, including test case creation, usability testing, and error testing (to name just a few). On a technical level, crowdsourced testing tasks are performed on a specific software platform, called a crowdsourced testing platform. A crowdsourced testing process on a crowdsourced testing platform usually consists of three phases: (1) planning and preparation, (2) execution, and (3) evaluation and completion. In the first phase, the company mainly determines what to test and the scope of the testing, lists what to achieve, and sets the timeframe. In the second phase, crowdtesters conduct tests and give feedback on the test results in the form of test reports. In the last stage, all feedback is collected and collated by the crowdsourced testing platform to generate the final test report.
For an enormous number of test results, it is impractical for the platform to collate these reports manually. One of the main bottlenecks limiting the sustainability of the crowdsourced testing platform is the rapid delivery of high-quality final test reports back to the company. Therefore, it is natural for platforms to seek automated methods to collate test reports. In the past, researchers have proposed many methods that focus on the issues of test report prioritization [
5,
6,
7,
8,
9,
10,
25], duplicate test report identification [
4,
19,
20,
21,
22,
23], test report classification [
26,
27,
28,
29,
30,
31,
32], and test report reconstruction [
33,
34,
35,
36,
37].
Crowdsourced test reports have many duplicate reports, which means that the same errors are expressed with similar descriptions. Test report prioritization is designed to find all errors sooner. Researchers first used the text information from the test report and later added the image information for prioritization. Most researchers use the NLP technique to extract text features and the spatial pyramid matching (SPM) technique to extract image features [
8,
9,
10]. While these methods have made efforts to prioritize crowdsourced test reports, they are only for mobile applications. However, crowdsourced test reports for mobile applications are significantly different from crowdsourced test reports for web applications.
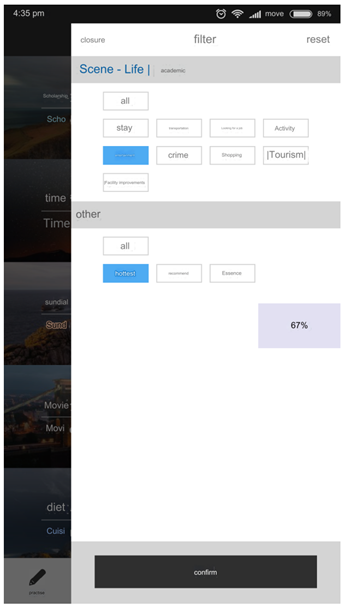
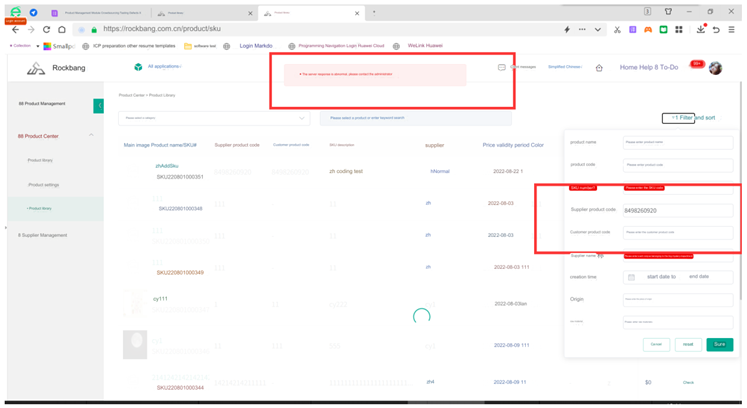
To illustrate, we present two crowdsourced test reports of different applications in
Table 1. We can see that the error description and the error screenshot in the crowdsourced test report are symmetrical in content and that they express the same error. The text descriptions of test reports for web applications are longer than for Android applications. The possible reason for this phenomenon is that it is easier for the crowdtesters to type on the computer than on the phone. In addition to this, we can see from
Table 1 that the screenshots of the web applications contain more redundant information. The page below the bookmark bar in the screenshot is where the error is located. These facts led us to propose a prioritization method for web applications that combines text and image information to help the platform speed up the collation of test reports.
4. Proposed Method (WDDiv)
This section describes the design of our method.
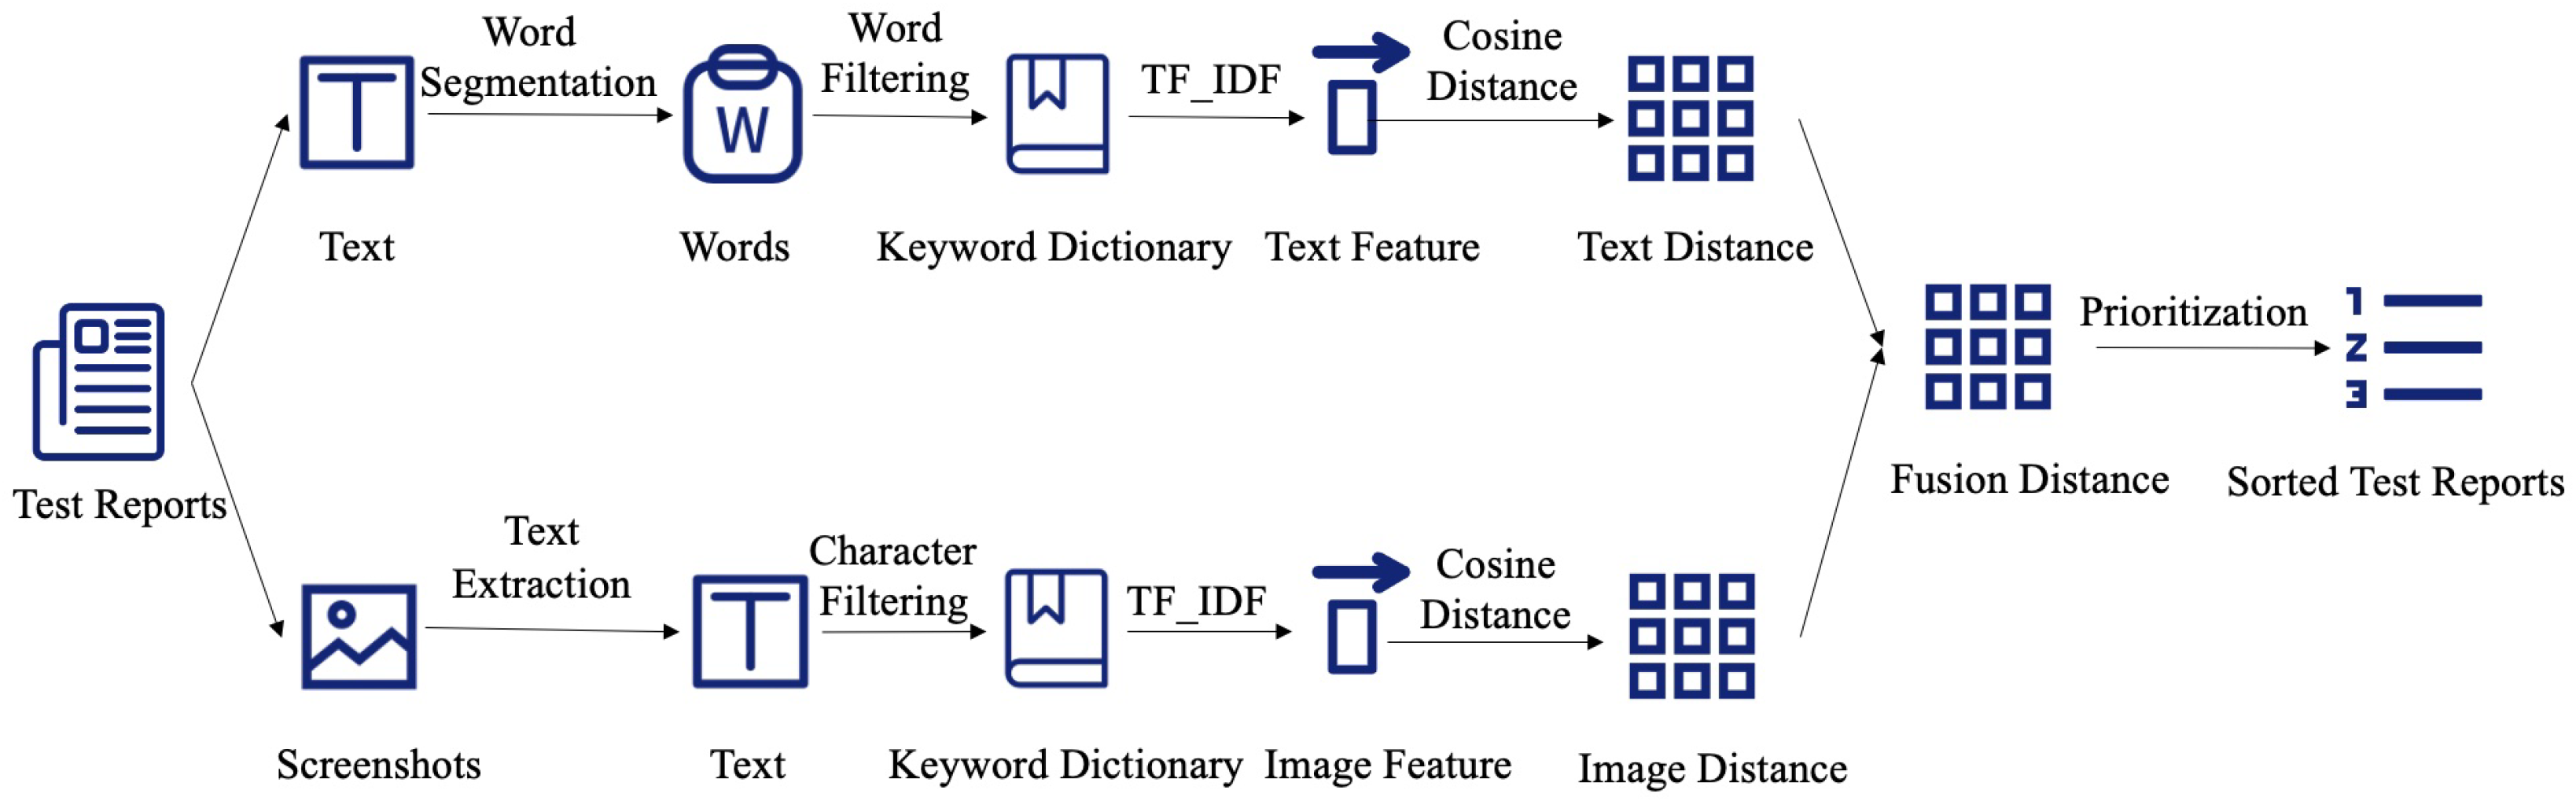
Figure 1 depicts the framework of our method. The framework has four major stages: (1) text information processing, (2) image information processing, (3) fusion distance computation, and (4) prioritization.
4.1. Preliminary
Crowdsourced test reports may contain multiple types of information, such as text, images, and videos. However, among these types of information, text and images are most widely used to analyze the reports. Therefore, we mainly deal with these two types of information. The test report set can be denoted as . In a test report (), represents a textual description of the error discovery process and represents screenshots of the active view at the time the error occurred. For specific test reports that include several screenshots, we use to denote the screenshot set, where represents the mth screenshot in test report . We process text and image information separately.
4.2. Text Information Processing
As shown in the upper branch of
Figure 1, text information processing consists of word segmentation, word filtering, text feature representation, and text distance computation.
Word Segmentation. Text description of errors in test reports we handle are written in Chinese, which differs significantly from English and other Latin languages in that there are no spaces to break the words, so they are first subjected to word segmentation. For Chinese, there are a number of effective word segmentation tools. We adopted a widely used tool, Jieba (
https://github.com/fxsjy/jieba, accessed on 12 September 2023), for word segmentation [
7,
9,
10].
Word Filtering. After word segmentation, the original word stream may contain some meaningless words (also known as stop words (
https://github.com/goto456/stopwords/blob/master/cn_stopwords.txt, accessed on 12 September 2023)), such as punctuation, numbers, and conjunctions. These words have a negative impact on the text distance calculation and add extra computation time, so we need to filter them. After filtering these words in the word stream of error descriptions for each test report, the keywords are obtained to build a keyword dictionary. Suppose we have
j keywords in total; the keyword dictionary can be denoted as
.
Text Feature Representation. Based on the keyword dictionary, we construct feature vectors for each test report’s error description to perform text distance measurement. In this paper, we use the TF-IDF model [
38] to represent text feature vectors. For a test report
,
denotes its text features vector, where
denotes the weight of the
jth keyword of
. The weight can be computed as
, where
represents the frequency of the
jth keyword of
,
N represents the total number of test reports, and
represents the number of test reports containing this keyword.
Text Distance Computation. After obtaining text feature vectors, we calculate the distance between error descriptions to identify duplicate test reports. We use the cosine distance (
https://reference.wolfram.com/language/ref/CosineDistance.html, accessed on 12 September 2023) to calculate the distance between the error descriptions of each pair of test reports, since previous studies have demonstrated its efficiency in high-dimensional data [
39,
40], as in our case. The formula for calculating the textual distance between each pair of test reports
is as follows:
In Equation (
1),
denotes the textual feature vector of test report
and
denotes the textual feature vector of test report
. The range of
is 0 to 1. A larger
means that the test report
is less similar to the test report
.
4.3. Image Information Processing
As shown in the lower branch of
Figure 1, image information processing contains four steps: text extraction, character filtering, image feature representation, and image distance computation.
Text Extraction. Images have been relatively little-studied and applied in crowdsourced test reports. Most researchers utilize the spatial pyramid matching (SPM) algorithm to process images [
8,
9,
10,
21,
31,
33]. However, SPM directly obtains the features in the whole image, which is not very suitable for web applications. Typically, web application screenshots contain more noisy information such as user-related browser favorites and window titles. In order to improve the accuracy and operational efficiency of the image distance calculation, we preprocessed the images, i.e., we cropped the images to a uniform size (1900 × 865 pixels). Due to the diversity in screenshot resolutions, it is necessary to scale screenshots to a uniform size before cropping them. We calculated statistics on the size of the screenshots in the test report, and the statistics showed that 1920 × 1020 pixels accounted for the most. Since screenshot scaling can make screenshots blurry or distorted, in order to minimize the impact of screenshot scaling on subsequent processing, we scale all screenshots to 1920 × 1020 pixels. Then, we use optical character recognition (OCR) technology to extract the text in the cropped image to determine the important features in the image. We directly call the OCR interface service provided by Baidu (
https://cloud.baidu.com/doc/OCR/s/Ek3h7xypm, accessed on 12 September 2023). Baidu OCR uses deep learning techniques such as convolutional neural networks (CNN) and recurrent neural networks (RNN) for text recognition. It has a general text recognition accuracy of more than 98% and is able to complete a large number of text recognition tasks in a short period of time (
https://ai.baidu.com/tech/ocr, accessed on 12 September 2023). For test reports containing multiple screenshots, we merge the text content of each screenshot extracted by OCR.
Character Filtering. The text information obtained by the above operation may still contain noise content. We remove punctuation, numbers, and letters, which are not useful for distance calculation, and keep only Chinese characters. Specifically, we use regular expressions for character filtering. After character filtering for each image, the keywords are obtained to build a keyword dictionary.
Image Feature Representation. Based on the keyword dictionary, we construct image feature vector for each test report to perform image distance measurement. As with the text feature representation, we also use the TF-IDF model to represent the image of the test report.
Image Distance Computation. As with the text distance computation, we also use the cosine similarity to calculate the distance between the screenshots of each pair of test reports.
4.4. Fusion Distance Computation
After obtaining the text distance and the image distance from test reports, we simply weight these two distances to fuse the text and image information. The distance fusion equation is as follows:
In Equation (
2),
denotes the overall distance between test reports
and
,
denotes the text distance between test reports
and
, and
denotes the image distance between test reports
and
. The values of
range from 0.0 to 1.0, and
means that only the text information is used to calculate the distance between test reports.
4.5. Prioritization
Based on the fusion distance for each pair of test reports, we can prioritize the test reports to speed up the review of test reports. In this paper, we use the prioritization algorithm proposed by Feng et al. [
8]. They used a diversity-based prioritization strategy, with the goal of finding as many errors as possible as early as possible. In the beginning, we randomly choose one report from the test report set TRS and append it to the result queue Q. Then, we calculate the distance between each test report of TRS and Q, which is defined by the minimal distance between
and each test report in Q, and the largest one is appended to Q. When
, the whole program is finished. The complexity of prioritization after obtaining the fusion distance is
.
5. Empirical Study Design
5.1. Research Questions
In our experiment, we raised the following three research questions:
[RQ1:] How effective is the prioritization method of crowdsourced test reports for mobile applications in prioritizing crowdsourced test reports for web applications?
Researchers have proposed many prioritization methods for crowdsourced test reports, but most of them are designed for the characteristics of mobile applications. We would like to investigate their effectiveness in prioritizing crowdsourced web applications test reports;
[RQ2:] How effective is our method in prioritizing crowdsourced test reports for web applications?
Although we investigated the effectiveness of other methods for prioritizing crowdsourced web application test reports in RQ1, it is critical to validate the effectiveness of our method;
[RQ3:] How does the experimental parameter influence the performance of our method?
Since the performance of our method is influenced by the weighting parameter in the fusion distance, we analyze the performance of our method under different parameter settings to give users a better understanding of our method.
5.2. Data Collection
In August 2022, we partnered with a foreign trade company to collect crowdsourced test reports for real industry. We crowdtested a web application called Foreign Trade Management Platform. The application contains five modules (Product, Team, Approval, Logistics, and Sales), and the interaction between different modules is complex. We crowdsource tested one module of the platform for up to 8 h a day and collected 730 test reports. After we fed back the test reports, the company’s developers manually reviewed and labeled the errors revealed by the test reports. They determined duplicate reports based on the function point where the error was located (e.g., Add, Delete, Modify, and Search). They found that 13 reports did not reveal real errors and were labeled as invalid. Finally, there were 717 qualified test reports, and their statistical information is shown in
Table 2, where
represents the number of test reports,
represents the number of errors revealed by test reports,
represents the number of duplicated test reports,
denotes the number of screenshots contained in the test reports,
represents the size of the keyword dictionary constructed from text information, and
denotes the size of the keyword dictionary constructed from screenshot information.
Table 3 shows the top-three most common errors in each module.
Table 4 and
Table 5 show the top-ten text and image keywords in terms of word frequency, respectively.
5.3. Baseline Setting
We adopted BDDiv [
8] and TSE [
10] as baselines. Both methods use text and image information from the test reports, fusing the two types of information by balancing the text and image distance. However, in contrast to BDDiv, TSE uses clustering techniques to cluster similar reports together and uses a random sampling strategy. In addition, we simulated a random test report inspection scenario and an ideal test report inspection process to investigate the usefulness and potential of the above two methods. Thus, we have the following four methods:
Random: Random sorting to simulate the case without any prioritization method;
Ideal: For a test report set with M errors, the theoretical best result is to review only M test reports to find all errors;
BDDiv [
8]: A prioritization method that extracts text features using a bag of words (BOW) model and image features using an SPM method, calculates text distance using Jaccard distance and image distance using Chi-square distance, and fuses text and image distances by using a balanced formula;
TSE [
10]: A prioritization method that extracts text features using Tthe F-IDF model and image features using an SPM method, calculates text distance using Euclidean distance and image distance using Chi-square distance, and fuses text and image distances by using a balanced formula.
5.4. Evaluation Metrics
Given a test report inspection task, we measure the performance of a test report prioritization method based on the speed of revealing all errors. Based on previous studies [
5,
8], we adopted the widely used APFD for evaluation. APFD [
11] is calculated as follows:
In Equation (
3),
is the index of the first test report that reveals error
i,
N denotes the number of test reports, and
M denotes the number of errors revealed by all test reports. APFD values range from 0.0 to 1.0. The higher the APFD score, the faster the rate of finding all errors.
To compare the APFD values of the different test report prioritization methods, we use two metrics. Firstly, we use
, which is the percent difference between the mean APFD of the two methods. The
is defined as follows:
In Equation (
4),
and
are the mean APFD values of the two methods. A larger value of
means a larger difference between the two methods. Second, we use hypothesis testing to assess whether there is a significant difference between the APFD values. For each module, the APFD values for each method did not all follow a normal distribution, so we chose the Friedman statistical test [
41] and the Mann–Whitney U statistical test [
42]. The Friedman statistical test was used to verify whether the APFD values of multiple methods were significantly different, while the Mann–Whitney U statistical test was used to verify whether the APFD values of two methods were significantly different. If the
p-value is less than 0.05, the difference is considered significant.
5.5. Parameters Setting
Considering that the weight can influence the performance of our experiment, we experimentally adjusted this parameter and determined the final value of 0.6. Since all baseline methods had random selection operations in the prioritization process, each experiment was repeated 30 times to reduce the bias caused by randomness.
6. Results and Analysis
6.1. Answering Research Question 1
[RQ1:] How effective is the prioritization method of crowdsourced test reports for mobile applications in prioritizing crowdsourced test reports for web applications?
We present the performance of four methods (Random, TSE, BDDiv, Ideal), as measured by APFD.
Figure 2 shows the boxplots of the APFD results for the five modules.
Table 6 shows the mean APFD for each method in each module. We can easily observe that, to varying degrees, TSE outperforms Random on all modules except “Logistics”. However, BDDiv performs better, and it outperforms Random on all modules.
To further show the effectiveness of these two baselines, we also present the extent of their improvement over Random in the first and second rows of
Table 7. We can see that BDDiv improves Random in the range of 6.43–11.85%, while TSE improves Random in the range of 2.95–9% (except for the “Logistics” module). In addition to revealing their improvement over Random, we also show the gap between them and the theoretical ideal (the third and fourth row of
Table 7). We find that the gap between TSE and Ideal varies from 14.35% to 26.83%, while the gap between BDDiv and Ideal varies from 10.11% to 15.63%. We also directly compared these two methods. From the last row of
Table 7, we can see that BDDiv has 2.61% to 9.68% improvement compared with TSE.
In addition, we first performed the Friedman test on the APFD values of the four methods (Random, TSE, BDDiv, and Ideal). We can see from
Table 8 that all
p-values are less than 0.05, which means that there is a significant difference between the APFD values of these four methods in each module. We then conducted the Mann–Whitney U test for APFD between TSE and Random, BDDiv and Random, Ideal and TSE, Ideal and BDDiv, and BDDiv and TSE. The results in
Table 9 show that the
p-values are all below 0.05 for all modules. This signifies that the APFD values for each pair of methods described above are significantly different.
Summary: Crowdsourced mobile application test report prioritization methods can improve the effectiveness of crowdsourced web application test report inspection, but they still have a large gap with the theoretically ideal results. For crowdsourced test reports of mobile applications, TSE outperforms BDDiv [
10]; however, the opposite conclusion is reached in crowdsourced test reports of web applications. Therefore, we believe that the crowdsourced web application test report prioritization method needs to be specifically designed.
6.2. Answering Research Question 2
[RQ2:] How effective is our method in prioritizing crowdsourced test reports for web applications?
Note that, in RQ2, we used BDDiv as the baseline instead of TSE because, as confirmed in RQ1, it performs better than TSE.
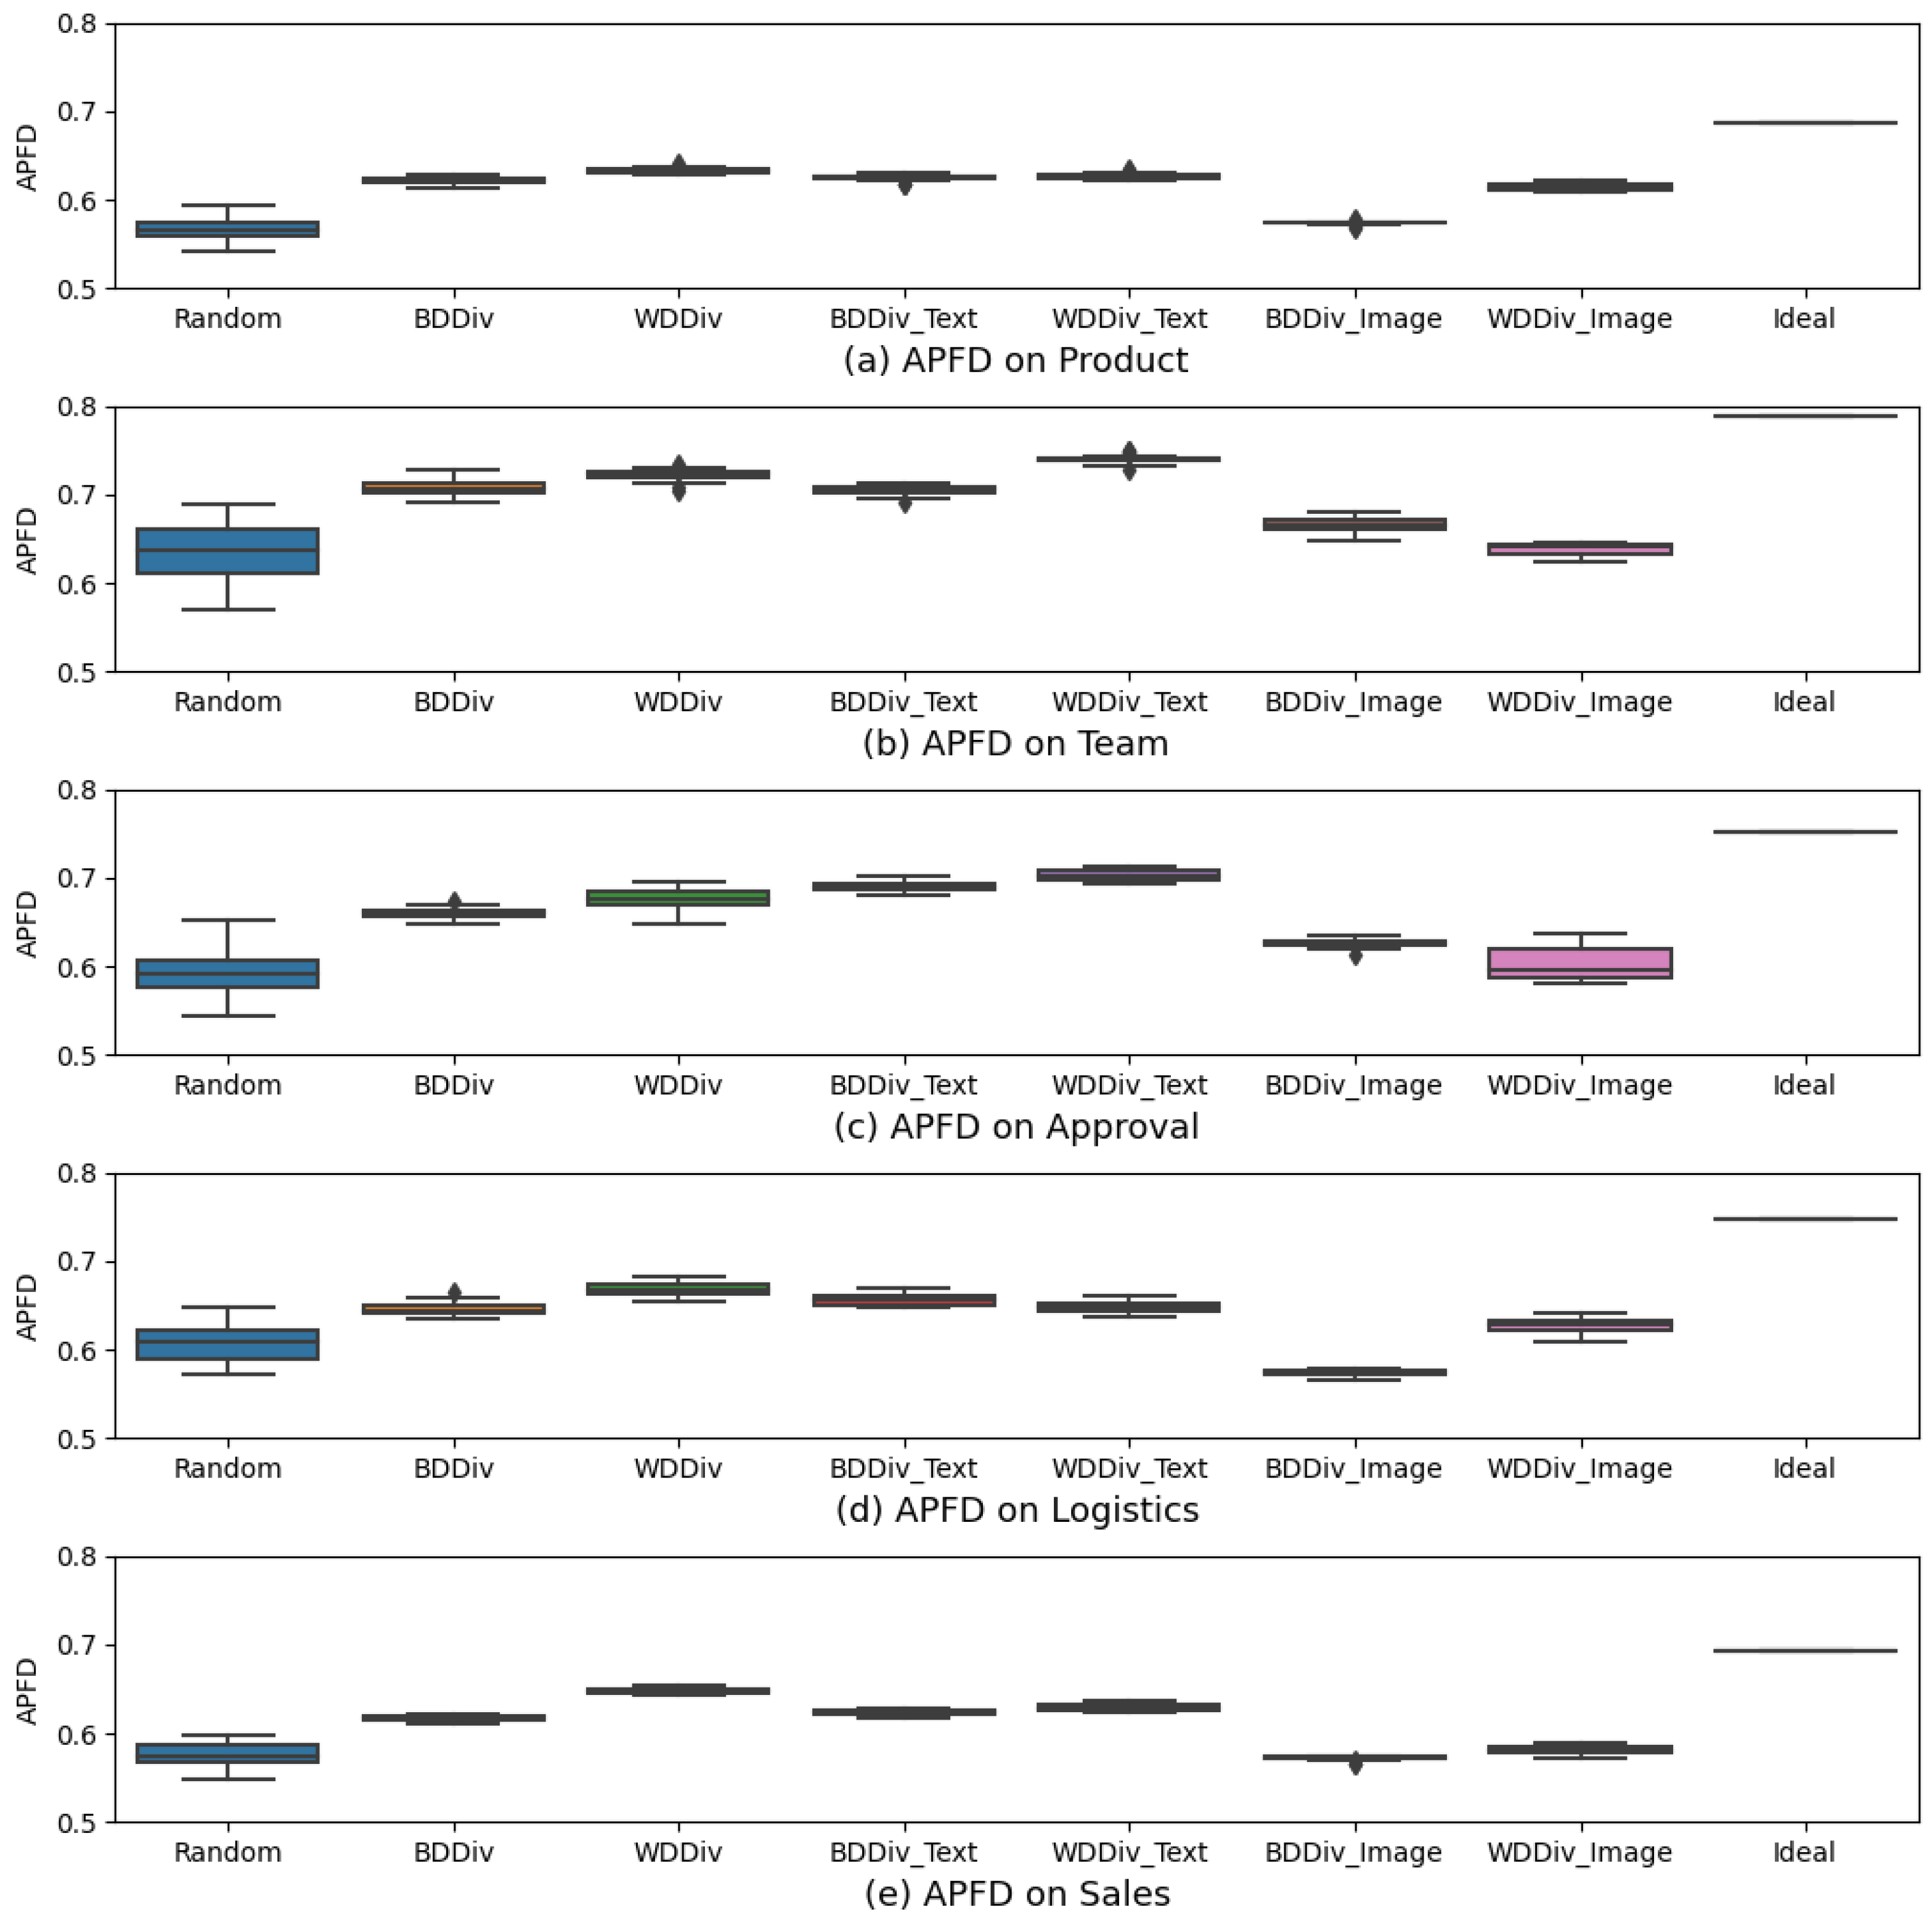
Figure 3 shows the boxplot of APFD and
Table 10 shows the mean APFD values. We also performed the Friedman test on the APFD values for each method in
Table 10, and the results can be seen in
Table 11. Based on
Figure 3 and
Table 10 and
Table 11, we observe that, to different extents, our method significantly outperforms BDDiv on all modules. Specifically, from the first row of
Table 12, the improvement of our method ranges from 1.77 to 5.02% in comparison with BDDiv. This means that our method is able to detect all errors in these modules much earlier.
To investigate the deeper reasons why our method performs better than BDDiv, we also compared the performance of using only text information and only image information. According to
Figure 3 and the second and third rows of
Table 12, we found that WDDiv_Text outperforms BDDiv_Text on four modules, while WDDiv_Image outperforms BDDiv_Image on three modules. This means that the text distances and image distances we calculate are more representative of the test report distances.
We also conduct the Mann–Whitney U test for APFD for each pair of methods mentioned above. The results are presented in
Table 13, where we can see that all
p-values, except between WDDiv_Text and BDDiv_Text in the “Product” module, are below 0.05. This means that the performance of our method is significantly better than that of BDDiv, both with and without fusing text and images.
We not only compared the APFD values of these two methods (WDDiv, BDDiv), but also compared their time overheads. The running times of the three sub-processes involved in the method (i.e., text processing, image processing, and fusion distance calculation) are shown in
Table 14. Note that we ran all processes on a personal computer with the following configuration: 2.3 GHz Dual-Core Intel Core i5 processor and 8 GB of RAM. We can see that, for all three sub-processes, WDDiv takes less time than BDDiv on all modules. In particular, for image processing, our method saves at least 718 s compared to BDDiv. This indicates that our method has higher operational efficiency.
Summary: The prioritization method specifically designed for crowdsourced test reports for web applications performs better than mobile application-based methods.
6.3. Answering Research Question 3
[RQ3:] How does the experimental parameter influence the performance of our method?
In this subsection, we further discuss the effect of the weight parameter on the performance. The weight parameter directly affects the value of the fusion distance and indirectly affects the final ranking result. A value greater than 0.5 means that text distance takes more weight than image distance, while equal to 0.0 means that only image distance is used and equal to 1.0 means that only text distance is used. We therefore analyzed the variation in the APFD score with , where varied from 0.0 to 1.0 in increments of 0.1.
Table 15 shows the sensitivity of mean APFD to the weight parameter
. From
Table 15, we can see that the mean APFD for all modules, except “Approval”, reaches maximum value when
and
. This indicates that using text and image information is more effective than using only one type of information alone. We investigated the “Approval” module more deeply to find out why adding image information was not better than using text information alone. There are very few pages involved in all the functions of “Approval” module, thus resulting in very similar screenshots, reflected in different errors.
Further, we find that the mean APFD of all modules can reach a maximum when . More specifically, the mean APFD of the four modules reaches a maximum when . This means that, when text information is given more weight, the results are better.
Also, we show the average and standard deviation of the mean APFD for each module in
Table 15. We observe that the standard deviation values remained within a small range, i.e., from 0.0064 to 0.0384, indicating that the APFD was relatively stable for the variation of
.
Summary: Generally, crowdsourced web application test report prioritization using text and image information is better than using a single piece of information. Since weighting textual information more than image information leads to better performance of our method, we propose to adjust from 0.6. Although affects the performance of our method to varying degrees, the performance of our method is generally stable with varying .
7. Discussion
In the different modules, WDDiv shows different results. In the Sale module, the results of WDDiv are very encouraging and are closest to the theoretical optimum. We examined the test reports in the Sale module. Workers submitted more test reports and found more errors in the Sale module than in the other modules. More critically, their reports also had more text keywords and image keywords. Our approach relies on the keywords in the test reports, so it is not surprising that the prioritization results of the Sale module are more effective for the other modules, as shown in
Table 12.
In RQ2, we evaluated the time cost of the proposed method, and the execution time of the important processes can be seen in
Table 14. We can see that the time cost is mainly image information processing. Processing 956 screenshots from 717 test reports took about 26 min. It takes an average of 1.58 s per image. In our method, the cost of using text information processing is negligible because it uses a natural language processing tool, Jieba, for word segmentation. In the future, we can consider optimizing the efficiency of image processing.
In RQ3, we discussed the sensitivity of the parameter
in the fusion distance matrix. The parameter
represents the trade-off between text and image information. The larger the value of
, the greater the proportion of textual information. We conducted several experiments to find the optimal
. The results show that our technique performs better when
. This means that textual information analysis is better than image information analysis. As can be seen from the last two columns of
Table 2, for each module, the number of image keywords is much larger than text keywords. We can infer that the image keywords contain a lot of noise information about the error. Our method only removes some noise information by cropping and filtering characters. In the future, the correspondence between the error description text and the text within the error screenshot can be considered to further remove the noise information and obtain better image features.
8. Threats to Validity
In our empirical study, there are some general threats to validity.
External threats to validity. We simulated crowdsourced testing of a web application to collect data, for which we hired students as crowd workers. The students are first-year graduate students majoring in computer science with no relevant software testing experience. This is not as diverse as the population involved in true crowdsourced testing. Thus, when our technique is promoted for real crowdsourced testing scenarios, it could be worse. However, according to Salman et al. [
43], if a task is new to both students and professionals, similar performance can be expected. Based on this study, we believe that this threat may not be critical.
Internal threats to validity. The internal threats are in the preprocessing of the images, namely, image scaling and cropping. Students were tested using devices with different resolutions, so the error screenshots had a variety of resolutions. Our method requires scaling the screenshots to a uniform size (1920 × 1020 pixels) before cropping. This scaling size is obtained from statistical information on the size of all screenshots in this dataset, and application of this size to other datasets may yield worse results.
After scaling the screenshots, we crop the screenshots uniformly to 1900 × 865 pixels, which is carried out in consideration of the fact that the screenshots may contain noise information, such as user-related browser information. However, this will lead to the loss of important information in some screenshots, which will affect the calculation of the distance of the test report. This cropping size is a compromise for this dataset and may give worse results on other datasets. Therefore, different scaling and cropping sizes need to be determined for different datasets.
Construct threats to validity. Since we hired Chinese students to conduct simulated crowdsourced testing of a Chinese software, the collected test reports have error descriptions written in Chinese, and the text content in their screenshots is also in Chinese. Our proposed method is specific to Chinese, so it may perform better or worse in other languages.
We only dealt with the error description and error screenshot information in the test report and ignored the information about the type of error, the severity of the error, and so on. These are also crucial for developers to fix the errors. In the future, we can consider adding that information for test report prioritization.
Conclusion threats to validity. There are three conclusion threats to validity. First, due to cost constraints, the crowdsourced testing tasks were for five modules of a single application. All tasks were completed in five days, at a rate of one module per day. This could have threatened the generalizability of our conclusions. However, our modules are diverse and involve information about products, teams, logistics, and more. This may have reduced this threat to some extent.
Second, in our experimental results, there are a small number of outliers in the APFD values. However, we found that these outliers did not affect the analysis of the results. Therefore, we do not believe that these APFD outliers posed a threat to the conclusion.
Third, in our method, the weights of text distance and image distance need to be determined. Experiments prove that, with the change in weights, our method will have different results, so this may affect the application of our method on other datasets. However, we have verified the effect of weights through sufficient experiments and found the most suitable value, so this threat should be greatly reduced.
9. Conclusions
In this paper, we propose a crowdsourced test report prioritization method for web applications that fuses text and image information to alleviate the challenge of collating large volumes of reports. To the best of our knowledge, this is the first work applying optical character recognition (OCR) to improve the accuracy of test report similarity calculations. We conducted experiments on 717 test reports that contained 956 screenshots across 5 modules and evaluated the ranking results using APFD metrics. We found that our method was advantageous compared to mobile-based test report methods. Specifically, for APFD values, our method improves them by 1.77% to 5.02% compared to BDDiv. We also found that, for most of the modules we studied, methods that fused text and image information were more promising than those that used a single type of information, even though one module may have been less applicable. Therefore, in future work, we will improve our methods to help prioritize such modules.
Author Contributions
Conceptualization, L.X. and Y.W.; data curation, Y.W.; formal analysis, Y.W.; funding acquisition, L.X.; investigation, Y.W.; methodology, Y.W.; project administration, L.X.; resources, L.X.; software, Y.W. and R.C.; supervision, L.X.; validation, L.X. and Y.W.; visualization, L.X., Y.W., R.C. and H.S.; writing—original draft preparation, Y.W.; writing—review and editing, L.X., R.C. and H.S. All authors have read and agreed to the published version of the manuscript.
Funding
This research was funded by the Natural Science Foundation of Fujian Province under Grant 2022J011238 and Xiamen Science and Technology Project 3502Z20231042.
Data Availability Statement
Conflicts of Interest
The authors declare no conflicts of interest.
References
- Mao, K.; Capra, L.; Harman, M.; Jia, Y. A survey of the use of crowdsourcing in software engineering. J. Syst. Softw. 2017, 126, 57–84. [Google Scholar] [CrossRef]
- Alyahya, S. Crowdsourced software testing: A systematic literature review. Inf. Softw. Technol. 2020, 127, 106363. [Google Scholar] [CrossRef]
- Huang, S.; Chen, H.; Hui, Z.; Liu, Y. A survey of the use of test report in crowdsourced testing. In Proceedings of the 2020 IEEE 20th International Conference on Software Quality, Reliability and Security (QRS), Macau, China, 11–14 December 2020; pp. 430–441. [Google Scholar]
- Wang, J.; Li, M.; Wang, S.; Menzies, T.; Wang, Q. Images don’t lie: Duplicate crowdtesting reports detection with screenshot information. Inf. Softw. Technol. 2019, 110, 139–155. [Google Scholar] [CrossRef]
- Feng, Y.; Chen, Z.; Jones, J.A.; Fang, C.; Xu, B. Test report prioritization to assist crowdsourced testing. In Proceedings of the 2015 10th Joint Meeting on Foundations of Software Engineering, Bergamo, Italy, 30 August–4 September 2015; pp. 225–236. [Google Scholar]
- Yang, Y.; Chen, X. Crowdsourced Test Report Prioritization Based on Text Classification. IEEE Access 2021, 10, 92692–92705. [Google Scholar] [CrossRef]
- Zhu, P.; Li, Y.; Li, T.; Ren, H.; Sun, X. Advanced Crowdsourced Test Report Prioritization Based on Adaptive Strategy. IEEE Access 2022, 10, 53522–53532. [Google Scholar] [CrossRef]
- Feng, Y.; Jones, J.A.; Chen, Z.; Fang, C. Multi-objective test report prioritization using image understanding. In Proceedings of the 31st IEEE/ACM International Conference on Automated Software Engineering, Singapore, 3–7 September 2016; pp. 202–213. [Google Scholar]
- Tong, Y.; Zhang, X. Crowdsourced test report prioritization considering bug severity. Inf. Softw. Technol. 2021, 139, 106668. [Google Scholar] [CrossRef]
- Liu, D.; Feng, Y.; Zhang, X.; Jones, J.A.; Chen, Z. Clustering crowdsourced test reports of mobile applications using image understanding. IEEE Trans. Softw. Eng. 2022, 48, 1290–1308. [Google Scholar] [CrossRef]
- Rothermel, G.; Untch, R.H.; Chu, C.; Harrold, M.J. Prioritizing test cases for regression testing. IEEE Trans. Softw. Eng. 2001, 27, 929–948. [Google Scholar] [CrossRef]
- Cui, Q.; Wang, J.; Yang, G.; Xie, M.; Wang, Q.; Li, M. Who should be selected to perform a task in crowdsourced testing? In Proceedings of the 2017 IEEE 41st Annual Computer Software and Applications Conference (COMPSAC), Turin, Italy, 4–8 July 2017; Volume 1, pp. 75–84. [Google Scholar]
- Cui, Q.; Wang, S.; Wang, J.; Hu, Y.; Wang, Q.; Li, M. Multi-Objective Crowd Worker Selection in Crowdsourced Testing. In Proceedings of the SEKE, Pittsburgh, PA, USA, 5–7 July 2017; Volume 17, pp. 218–223. [Google Scholar]
- Wang, J.; Wang, S.; Chen, J.; Menzies, T.; Cui, Q.; Xie, M.; Wang, Q. Characterizing crowds to better optimize worker recommendation in crowdsourced testing. IEEE Trans. Softw. Eng. 2019, 47, 1259–1276. [Google Scholar] [CrossRef]
- Wang, J.; Yang, Y.; Wang, S.; Hu, Y.; Wang, D.; Wang, Q. Context-aware in-process crowdworker recommendation. In Proceedings of the ACM/IEEE 42nd International Conference on Software Engineering, Seoul, Republic of Korea, 27 June–19 July 2020; pp. 1535–1546. [Google Scholar]
- Wang, J.; Yang, Y.; Wang, S.; Hu, J.; Wang, Q. Context-and Fairness-Aware In-Process Crowdworker Recommendation. ACM Trans. Softw. Eng. Methodol. (TOSEM) 2022, 31, 1–31. [Google Scholar] [CrossRef]
- Kamangar, Z.U.; Kamangar, U.A.; Ali, Q.; Farah, I.; Nizamani, S.; Ali, T.H. To enhance effectiveness of crowdsource software testing by applying personality types. In Proceedings of the 2019 8th International Conference on Software and Information Engineering, Cairo, Egypt, 9–12 April 2019; pp. 15–19. [Google Scholar]
- Xie, M.; Wang, Q.; Yang, G.; Li, M. Cocoon: Crowdsourced testing quality maximization under context coverage constraint. In Proceedings of the 2017 IEEE 28th International Symposium on Software Reliability Engineering (ISSRE), Toulouse, France, 23–26 October 2017; pp. 316–327. [Google Scholar]
- Jiang, H.; Chen, X.; He, T.; Chen, Z.; Li, X. Fuzzy clustering of crowdsourced test reports for apps. ACM Trans. Internet Technol. (TOIT) 2018, 18, 1–28. [Google Scholar] [CrossRef]
- Chen, H.; Huang, S.; Liu, Y.; Luo, R.; Xie, Y. An Effective Crowdsourced Test Report Clustering Model Based on Sentence Embedding. In Proceedings of the 2021 IEEE 21st International Conference on Software Quality, Reliability and Security (QRS), Haikou, China, 6–10 December 2021; pp. 888–899. [Google Scholar]
- Yang, Y.; Yao, X.; Gong, D. Clustering study of crowdsourced test report with multi-source heterogeneous information. In Proceedings of the Data Mining and Big Data: 4th International Conference, DMBD 2019, Chiang Mai, Thailand, 26–30 July 2019; pp. 135–145. [Google Scholar]
- Cao, Z.; Wang, X.; Yu, S.; Yun, Y.; Fang, C. STIFA: Crowdsourced mobile testing report selection based on text and image fusion analysis. In Proceedings of the 35th IEEE/ACM International Conference on Automated Software Engineering, Virtual Event, 21–25 December 2020; pp. 1331–1335. [Google Scholar]
- Cooper, N.; Bernal-Cárdenas, C.; Chaparro, O.; Moran, K.; Poshyvanyk, D. It takes two to tango: Combining visual and textual information for detecting duplicate video-based bug reports. In Proceedings of the 2021 IEEE/ACM 43rd International Conference on Software Engineering (ICSE), Madrid, Spain, 22–30 May 2021; pp. 957–969. [Google Scholar]
- Huang, Y.; Wang, J.; Wang, S.; Liu, Z.; Hu, Y.; Wang, Q. Quest for the Golden Approach: An Experimental Evaluation of Duplicate Crowdtesting Reports Detection. In Proceedings of the 14th ACM/IEEE International Symposium on Empirical Software Engineering and Measurement (ESEM), Bari, Italy, 5–9 October 2020; pp. 1–12. [Google Scholar]
- Yu, S.; Fang, C.; Cao, Z.; Wang, X.; Li, T.; Chen, Z. Prioritize crowdsourced test reports via deep screenshot understanding. In Proceedings of the 2021 IEEE/ACM 43rd International Conference on Software Engineering (ICSE), Madrid, Spain, 22–30 May 2021; pp. 946–956. [Google Scholar]
- Wang, J.; Wang, S.; Cui, Q.; Wang, Q. Local-based active classification of test report to assist crowdsourced testing. In Proceedings of the 31st IEEE/ACM International Conference on Automated Software Engineering, Singapore, 3–7 September 2016; pp. 190–201. [Google Scholar]
- Guo, S.; Chen, R.; Li, H. Using knowledge transfer and rough set to predict the severity of android test reports via text mining. Symmetry 2017, 9, 161. [Google Scholar] [CrossRef]
- Wang, J.; Cui, Q.; Wang, S.; Wang, Q. Domain adaptation for test report classification in crowdsourced testing. In Proceedings of the 2017 IEEE/ACM 39th International Conference on Software Engineering: Software Engineering in Practice Track (ICSE-SEIP), Buenos Aires, Argentina, 20–28 May 2017; pp. 83–92. [Google Scholar]
- Chen, X.; Jiang, H.; Li, X.; He, T.; Chen, Z. Automated quality assessment for crowdsourced test reports of mobile applications. In Proceedings of the 2018 IEEE 25th International Conference on Software Analysis, Evolution and Reengineering (SANER), Campobasso, Italy, 20–23 March 2018; pp. 368–379. [Google Scholar]
- Zhao, Y.; He, T.; Chen, Z. A unified framework for bug report assignment. Int. J. Softw. Eng. Knowl. Eng. 2019, 29, 607–628. [Google Scholar] [CrossRef]
- Li, Y.; Feng, Y.; Hao, R.; Liu, D.; Fang, C.; Chen, Z.; Xu, B. Classifying crowdsourced mobile test reports with image features: An empirical study. J. Syst. Softw. 2022, 184, 111121. [Google Scholar] [CrossRef]
- Yu, S.; Fang, C.; Zhang, Q.; Cao, Z.; Yun, Y.; Cao, Z.; Mei, K.; Chen, Z. Mobile App Crowdsourced Test Report Consistency Detection via Deep Image-and-Text Fusion Understanding. IEEE Trans. Software Eng. 2023, 1–20. [Google Scholar] [CrossRef]
- Liu, D.; Zhang, X.; Feng, Y.; Jones, J.A. Generating descriptions for screenshots to assist crowdsourced testing. In Proceedings of the 2018 IEEE 25th International Conference on Software Analysis, Evolution and Reengineering (SANER), Campobasso, Italy, 20–23 March 2018; pp. 492–496. [Google Scholar]
- Chen, X.; Jiang, H.; Chen, Z.; He, T.; Nie, L. Automatic test report augmentation to assist crowdsourced testing. Front. Comput. Sci. 2019, 13, 943–959. [Google Scholar] [CrossRef]
- Yu, S. Crowdsourced report generation via bug screenshot understanding. In Proceedings of the 2019 34th IEEE/ACM International Conference on Automated Software Engineering (ASE), San Diego, CA, USA, 11–15 November 2019; pp. 1277–1279. [Google Scholar]
- Hao, R.; Feng, Y.; Jones, J.A.; Li, Y.; Chen, Z. CTRAS: Crowdsourced test report aggregation and summarization. In Proceedings of the 2019 IEEE/ACM 41st International Conference on Software Engineering (ICSE), Montreal, QC, Canada, 25–31 May 2019; pp. 900–911. [Google Scholar]
- Yu, S.; Huang, W.; Zhang, J.; Zheng, H. Automatic Bug Inference via Deep Image Understanding. In Proceedings of the 2022 9th International Conference on Dependable Systems and Their Applications (DSA), Wulumuqi, China, 4–5 August 2022; pp. 330–334. [Google Scholar]
- Rajaraman, A.; Ullman, J.D. Mining of Massive Datasets, 1st ed.; Cambridge University Press: Cambridge, UK, 2011. [Google Scholar]
- Wang, S.; Zhang, W.; Wang, Q. FixerCache: Unsupervised caching active developers for diverse bug triage. In Proceedings of the 8th ACM/IEEE International Symposium on Empirical Software Engineering and Measurement, Torino Italy, 18–19 September 2014; pp. 1–10. [Google Scholar]
- Rocha, H.; Valente, M.T.; Marques-Neto, H.; Murphy, G.C. An empirical study on recommendations of similar bugs. In Proceedings of the 2016 IEEE 23rd International Conference on Software Analysis, Evolution, and Reengineering (SANER), Osaka, Japan, 14–18 March 2016; Volume 1, pp. 46–56. [Google Scholar]
- Friedman, M. The Use of Ranks to Avoid the Assumption of Normality Implicit in the Analysis of Variance. J. Am. Stat. Assoc. 1937, 32, 675–701. [Google Scholar] [CrossRef]
- Mann, H.B.; Whitney, D.R. On a Test of Whether one of Two Random Variables is Stochastically Larger than the Other. Ann. Math. Statist. 1947, 18, 50–60. [Google Scholar] [CrossRef]
- Salman, I.; Misirli, A.T.; Juristo, N. Are students representatives of professionals in software engineering experiments? In Proceedings of the 2015 IEEE/ACM 37th IEEE International Conference on Software Engineering, Florence, Italy, 16–24 May 2015; Volume 1, pp. 666–676. [Google Scholar]
- Yunhuan. Fusing Text and Images to Better Prioritize Crowdsourced Test Report for Web Application. V1. Available online: https://doi.org/10.57760/sciencedb.09699 (accessed on 12 September 2023).
| Disclaimer/Publisher’s Note: The statements, opinions and data contained in all publications are solely those of the individual author(s) and contributor(s) and not of MDPI and/or the editor(s). MDPI and/or the editor(s) disclaim responsibility for any injury to people or property resulting from any ideas, methods, instructions or products referred to in the content. |
© 2024 by the authors. Licensee MDPI, Basel, Switzerland. This article is an open access article distributed under the terms and conditions of the Creative Commons Attribution (CC BY) license (https://creativecommons.org/licenses/by/4.0/).


