Abstract
While ontogeny of multicellular organisms requires an interplay among tissues, morphogenesis of unicellular structures is typically organised with respect to differential growth of their cell covering. For example, shapes of various microalgae have often been emphasised as examples of symmetric fractal-like cellular morphology. Such a self-similar pattern is typical for the variability of a spatial fractal, with the shape variation remaining the same at different scales. This study investigated how these cells are integrated. A geometric morphometric analysis of spatial integration in the genus Micrasterias was used to assess the variation across scales by comparing the slopes of the linear fit of the log bending energy against the log variance of partial warps. Interestingly, the integration patterns were distinctly different from the notion of self-similarity. The variability consistently increased with decreasing scale, regardless of the cultivation temperature or the species examined. In addition, it was consistent after the adjustment of the slopes for the digitisation error. The developmental control over the final shape progressively declines with decreasing spatial scale, to the point that the terminal lobules are shaped almost independently of each other. These findings point to possible considerable differences in the generation of morphological complexity between free-living cells and multicellular organisms.
1. Introduction
Morphological integration is an intrinsic property of biological structures, consisting of the coordinated variation of their constituent parts [1,2,3]. In the last approximately 20 years, morphological integration has often been studied using geometric morphometrics (GMM), i.e., shape analysis of Cartesian point configurations. Several frequently used techniques are based on the analysis of the covariance between subsets of landmarks within structures [3,4]. In multicellular organisms, i.e., in the literal sense of the word, those living beings that have different organs, integration typically involves covariance among such parts or tissues [5]. In other words, the ontogeny of organisms requires interplay among their organs. However, the situation is quite different for unicellular free-living structures. These are primarily organised with respect to the differential growth of the cell wall or pellicle, which is typically driven by a varying density of membrane ports, leading to a different intensity of deposition of wall precursors during cellular morphogenesis to achieve a shape with a preferred surface-to-volume ratio or defensive structures against predators [6,7]. External factors, such as ambient temperature or environmental pollution, critically affect cellular morphogenesis by determining the rate of diffusion processes and the deposition of wall precursors [8,9].
For example, the cells of desmids, a species-rich group of streptophytan green algae belonging to Zygnematophyceae and mostly inhabiting acidic peatlands, are composed of two unequally old opposite semicells that are typical for the bilateral or radial symmetry of cellular lobes, processes, and incisions [10]. These structures develop during the relatively rapid morphogenetic process of cellular growth, involving the differential deposition of cell wall precursors that determines the final shape features of mature semicells [7,11]. Thus, integration in such cellular structures may be based on the spatiotemporal coordination of cell wall synthesis during morphogenesis, leading to a coordinated variation among different lobes [12].
In particular, the repeated production of successive lobes and lobules is typical for species of the desmidiacean Micrasterias lineage. Due to this typical morphology of repeated patterning of symmetric lobes and incisions, these algae have often been emphasised as examples of fractal-like cellular morphology [12,13,14]. In general, a fractal development of Micrasterias semicells would imply that the morphogenesis of individual successive lobes is governed by the same principles, just on a decreasing scale, consistent with the classical definition of fractality [15].
Consequently, this should then be manifested by self-similar patterns of variation, that is, relative to scale, the shape variation would be approximately identical at every spatial scale. Bookstein recently introduced a framework for the analysis of geometric morphometric datasets with regard to their spatial self-similarity [16,17]. This approach is adopted in this study for the analysis of several datasets of Micrasterias semicells. Bookstein’s concept assumes a null model of spatial self-similarity, in which the amount of (non-uniform) shape variation of identical groups of landmarks (e.g., squares) within a set of configurations is the same regardless of their position, orientation, or scale. This self-similar model essentially corresponds to the variability of a spatial fractal, where the variation remains the same when focusing on different parts of the observed structure. Thus, this null model presumes an absolute symmetry in terms of the amounts of shape variation across scales within landmark configurations depicted on a set of biological structures. Deviations from self-similarity include, on the one hand, global integration and, on the other hand, a state of so-called disintegration [16]. Both of these deviations represent a breaking of the null-model symmetry in terms of the amounts of shape variation across different scales. A globally integrated structure is typical for greater variability at larger scales of shape features. For example, this pattern is often typical for allometric growth gradients [18,19]. Conversely, if the smaller-scale structures have more shape variability than the large-scale shape features, then this is a situation that Bookstein referred to as disintegrated [16]. The extreme position of a disintegrated pattern is total independence and thus the random variation of individual landmarks in a configuration that corresponds to an isotropic Mardia–Dryden distribution.
In terms of a practical GMM analysis of biological datasets, self-similarity and deviations from this null model can be detected by examining the relationship between the variance of partial warps (PW) and their bending energy (BE). In short, PWs describe the total non-affine shape variability in the dataset with successively decreasing spatial scales of individual shape patterns. Consequently, the BE of the largest PWs is comparatively smaller than those depicting the more localised shape changes [20]. The self-similarity of variation across spatial scales is indicated by a slope of approximately −1 of the least-squares linear regression of the log PW variance to log BE. Slopes smaller than −1 indicate global integration, and those greater than −1 indicate a prevalence of small-scale variation. A slope approaching 0 would be typical for a totally disintegrated dataset based on the isotropic Mardia–Dryden distribution of landmark coordinates [17,20].
Unlike multicellular structures, which have been studied relatively extensively within this framework in recent years, data from analyses of unicellular organisms are completely lacking. Desmid cells, with their relatively complex forms fixed by a rigid cell wall, may be suitable model systems for the exploration of integration patterns. How are these cells integrated? Our earlier study, which analysed the covariance between landmark subsets of Micrasterias compereana semicells, showed increased integration levels among adjacent lobules, reflecting their affiliation to the same higher-order lobes within a successively divided structure [12]. Interestingly, the covariation among individual parts showed the gradual separation of developing lobes and lobules that were becoming less integrated with increasing lobe branching. In addition, it was shown that the relative distances of individual lobes and lobules of different orders in several Micrasterias species generally followed scale-invariant patterns [21]. Thus, these findings would not necessarily invalidate the null hypothesis of the fractal-like morphogenesis of these structures. However, the potential self-similarity of the shape variation at different scales within the configurations of landmarks sampled on Micrasterias semicells has not yet been studied.
To explore these integration patterns, we investigated several datasets consisting of four morphologically different Micrasterias species from different clades of the lineage. First, three clonal populations of Micrasterias thomasiana cultured at different temperatures were analysed based on three parallel landmark configurations sampled at different densities on the semicells. In addition, semicells from the natural populations of three additional taxa were also analysed. Will the spatial patterns of landmark variation across configurations reflect the self-similar patterns, thus suggesting a true fractal-like morphogenesis? Alternatively, deviations from self-similarity towards global integration or disintegration would suggest that underlying morphogenetic processes acted differently in relation to scale within these complex unicellular structures. In addition to the actual integration analyses, the effects of the measurement error (ME) on the observed values were assessed using a novel analysis involving the modelling of the ME effects with different levels of isotropic error.
2. Materials and Methods
2.1. Cultivation and Data Acquisition
A clonal strain of Micrasterias thomasiana was isolated by single-cell pipetting from a spring fen located in Krušné hory (Ore Mts.), Czech Republic (50.509854 N, 13.196065 E). The natural populations of M. truncata and M. papillifera were collected in an anthropogenic pond located approximately at 50.521360 N and 13.208300 E. In addition, M. americana was sampled from the phytobenthos of a mountain pond in the same region at 50.506310 N and 13.246246 E. All these taxa are well known representatives of Desmidiales that frequently occur in European peatlands, and they were repeatedly delimited as phylogenetically homogeneous members of the monophyletic Micrasterias lineage, e.g., [22,23,24].
The cultures of M. thomasiana were cultivated in 250 mL Erlenmeyer flasks with 150 mL of MES-buffered DY-V liquid medium [25] at pH = 5.5 and illuminated at 40 μmol·m−2·s−1 at a light:dark regime of 12:12 h. Cultures were maintained at temperatures of 17, 21, and 25 °C for 21 days. Then, microphotographs were taken at 100× magnification on a Leica DM2500 light microscope (Leica Microsystems, Wetzlar, Germany) with a Bresser MikroCam SP 5.0 digital camera (Bresser, Rhede, Germany). For each temperature and each natural population, 50 different semicells were photographed and used in subsequent analyses.
A total of 71 two-dimensional landmarks were depicted on the semicells of M. thomasiana, spanning the margins and central incisions of all successive lobes and lobules up to the fourth order of branching (Figure 1a). Then, two reduced subsets of landmarks were created, consisting of 39 and 21 landmarks, involving the lateral lobules up to their third and second degrees, respectively (Figure 1b,c). In addition, 21 landmarks were also placed at the corresponding positions on the semicells of M. americana, M. papillifera, and M. truncata (Figure 1d–f). To evaluate the digitisation error, the landmarks were registered twice. In the first digitisation, they were depicted clockwise, starting from the left margin of the semicells. The second digitisation was carried out counterclockwise from the same starting point at the opposite side of the semicells. Then, these landmarks were re-labelled to match the order of the first digitisation. The landmarks were registered using TpsDig, ver. 2.22 [26].
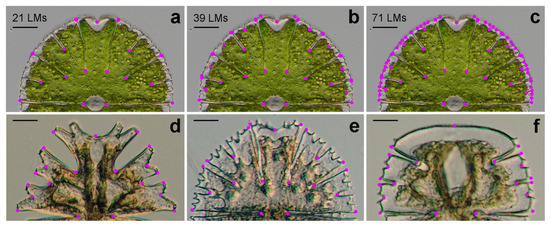
Figure 1.
Positions of landmarks (LMs) on the semicells of Micrasterias taxa M. thomasiana was registered by 21 LMs (a), 39 LMs (b), and 71 LMs (c). M. americana (d), M. papillifera (e), and M. truncata (f) were registered by 21 LMs. Note that the size of individual LMs was enlarged to make them more visible in the figures. Scale bars = 20 μm (a–c), 40 μm (d,f), and 30 μm (e).
2.2. Geometric Morphometrics
The frontal views of Micrasterias semicells are bilaterally symmetrical. In addition, the cells lack any anterior–posterior differentiation. This means that the bilateral symmetry of the semicells is unsigned, i.e., the left and right halves of individual semicells cannot be designated among different specimens. Therefore, the semicells were symmetrised with respect to the axis of bilateral symmetry [27]. First, the original landmark configurations were reflected across the axis of symmetry by multiplying the x-coordinates of landmarks by −1. Then, the paired landmarks in this reflected copy were re-labelled to match the order of the landmarks in the original configuration. A single landmark, delimiting the middle point of the polar lobes, was positioned on the axis of bilatral symmetry. Finally, the original and reflected/re-labelled configurations of each specimen were averaged in the generalised Procrustes analysis (GPA). Thus, in the resulting configurations, each of the perfectly symmetric halves spanned exactly the same shape variation, produced as an average of the two original sides.
The shape data of landmark configurations aligned by GPA were used to calculate the values of PWs and the uniform component in each of the studied datasets. Then, the natural logarithms of the variance values and the corresponding BE of individual PWs were the basis for calculating the least-squares linear regressions (BE–PWv plots) [17]. As the uniform component of the shape variation has zero bending energy with undefined log values, it cannot be included in the calculation of the slopes indicating the integration patterns. However, the natural logarithms of their variance are shown in the regression plots to illustrate their general relationships with the PWs. The uncertainties in the estimation of slopes in the BE–PWv plots were assessed using 95% confidence intervals of their observed values. The relationship between log BE and log PWv is assumed to be linear, but possible non-linearities in the plots may indicate changes in patterns of integration on a specific spatial scale [28]. In these cases, a partitioning of the regression line was conducted using the broken-stick algorithm [29].
The geometric morphometric analysis, including GPA and the symmetrisation of the configurations, was implemented using utility scripts written in R language for statistical computing [30] involving the functions implemented in the packages geomorph, ver. 4.0.0 [31], and shapes, ver. 1.2.6 [32]. The natural logarithms of PW variances and their BEs were acquired using the function global.integration in geomorph, ver. 4.0.0, and, in parallel, in TpsRelw, ver. 1.65 [26]. The broken-stick regression was carried out using the R package segmented, ver. 1.6.2 [33]. The BE–PWv plots were produced in PAST, ver. 4.10 [34]. ME was quantified using Procrustes ANOVA of the shape data using repeated digitisations of individual specimens [35]. The actual procedure of estimating the effects on ME on the slopes of BE–PWv plots is described in the subsequent chapter using one of the analysed Micrasterias datasets.
3. Results
3.1. Patterns of PWs—An Example of M. thomasiana Reared at 25 °C
To illustrate what the sequence of PWs looks like in datasets of Micrasterias semicells, we selected the population of M. thomasiana reared at 25 °C and registered by 21 landmarks (Figure 2). Due to the symmetrisation of the two halves, the paired landmarks always move synchronously in the deformation grids. The uniform component depicted the shortening and lengthening of entire semicells without any local deformations. Furthermore, the first few PWs essentially described the deepening or shortening of individual incisions or the relative dimensions of the principal cell lobes. This basically applies to the first ten PWs. Then, PW No. 11 addresses the relative height of the polar lobe. From PW No. 12 onwards, we see more or less strongly localised shape changes involving only some specific, narrowly defined parts of the structure, such as the relative position of individual incisions or the relative distance or overlap of terminal lobules. Especially in the case of the last four PWs (Nos. 15–18), the deformations were influenced by the relative displacement of just one or two paired landmarks.
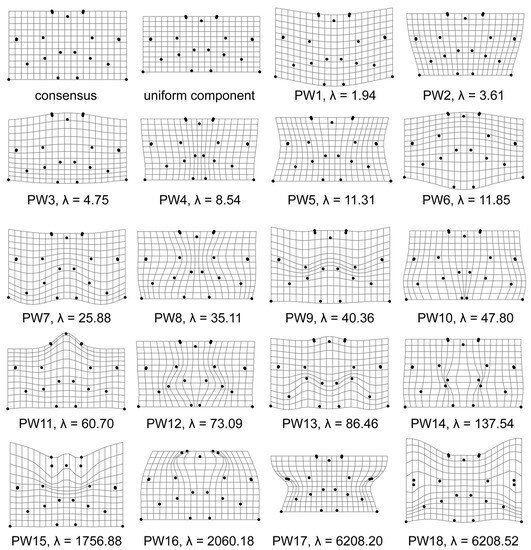
Figure 2.
Thin-plate splines showing the consensus configuration, the uniform component and partial warps of the M. thomasiana semicells cultured at 25 °C and registered by 21 landmarks. The bending energies (λ) of individual partial warps are also included.
3.2. BE–PWv Plots
The analyses of BE–PWv plots of all 12 populations showed that the values of slopes were distinctly higher than −1 in all the datasets, differing from the assumption of self-similarity (Table 1). The relationships between the log variance of PWs and log BEs were relatively tight, but the plots showed that the last few PWs, which describe the most localised shape changes, were often located in an outlying position with significantly higher BEs (Figure 3). These were mostly the last four PWs in datasets with 21 landmarks, the eight most localised PWs in structures with 39 landmarks, and sixteen such PWs in datasets with 71 landmarks. In most cases, these small-scale PWs did not show any noticeable decrease in log variance with increasing log BEs. The broken-stick regression analysis typically showed that just before these last data points, the slope of the regression changed most significantly. Thus, is it not possible that without them, the remaining PWs would exhibit self-similar relationships? To answer this question, BE–PWv linear regressions were carried out on the reduced datasets without the smallest-scale PWs. While the resulting slopes generally decreased more steeply, they still remained distinctly different from the self-similar level (Figure 3, Table 1).

Table 1.
Log–log least-squares relationships of bending energy and partial warp variances (BE–PWv plots) of 12 studied datasets. The slopes, a1, refer to BE–PWv plots based on all PWs, the slopes, a2, are based on the relationships, omitting the most localised PWs. CI, confidence interval; MiAm, M. americana; MiPa, M. papillifera; MiTh, M. thomasiana; MiTr, M. truncata; ME, measurement error; SE, standard error of regression slope.
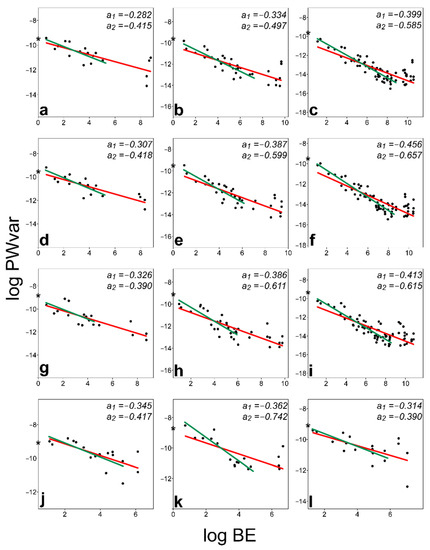
Figure 3.
Log–log least-squares relationships of bending energy and partial warp variances (BE–PWv plots) of 12 studied datasets. M. thomasiana, 17 °C, 21 LMs (a), M. thomasiana, 17 °C, 39 LMs (b), M. thomasiana, 17 °C, 71 LMs (c), M. thomasiana, 21 °C, 21 LMs (d), M. thomasiana, 21 °C, 39 LMs (e), M. thomasiana, 21 °C, 71 LMs (f), M. thomasiana, 25 °C, 21 LMs (g), M. thomasiana, 25 °C, 39 LMs (h), M. thomasiana, 25 °C, 71 LMs (i), M. americana, 21 LMs (j), M. papillifera, 21 LMs (k), M. truncata, 21 LMs (l). The relationships based on all PWs (slopes a1) are depicted by red lines, and the relationships omitting the most localised PWs (slopes a2) are depicted by green lines. Log variances of the uniform component in individual datasets are depicted by asterisks.
The BE–PWv slopes of the same population analysed by different numbers of landmarks largely overlapped. However, it was striking that the highest slopes were always identified in datasets with 21 landmarks, and then the observed values decreased slightly with an increasing number of landmarks. In addition, the ambient temperature, and therefore the growth rates of semicells, did not affect the observed slopes and thus the integration levels. Finally, the slopes found in the cultured populations of M. thomasiana were generally comparable with those identified in the three other species of the lineage.
3.3. ME Assessment
Now we have to return to the question of digitisation error. In fact, any ME must necessarily affect the observed values of the slopes. The isotropic ME increases the value of the slopes and brings it closer to the zero value of no relationship. A totally random variation of all landmarks, corresponding to an isotropic Mardia–Dryden distribution, would have a BE–PWv slope = 0. The greater the role of random isotropic error in the data, the more the integration levels will approach this value. Returning now to the model dataset of M. thomasiana reared at 25 °C and registered by 21 landmarks, we can now look at how such a hypothetically varying amount of isotropic ME affects the shape data. Let us examine the original Procrustes-aligned scatter of landmarks and the scatter of configurations with two levels of artificially induced isotropic error (Figure 4a–c). Such gradually increasing ME is introduced into each of the two independent digitisations of the same dataset. Obviously, as the rate of random ME increases, the shape distance between these two digitisations of the same specimens will also increase.
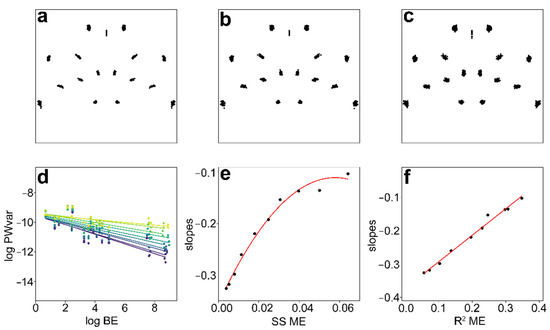
Figure 4.
Original Procrustes-aligned scatter of landmarks (a) and two configurations with two levels of artificially induced isotropic error (b,c) in M. thomasiana semicells cultured at 25 °C and registered by 21 landmarks. BE–PWv plots of this original dataset and nine levels of artificially introduced isotropic digitisation error (d) and corresponding relationships between the Procrustes sums of squares (SS) for digitisation error (ME) and the slopes of these BE–PWv plots (e) and R2 for ME and slopes of the BE–PWv plots (f).
Using ten different levels of ME, the lowest being the original dataset followed by nine successively increasing values of the isotropic ME in all landmarks, this effect can be quantified in a Procrustes ANOVA model, both in absolute terms of Procrustes sums of squares (SS) and in relation to the variability among specimens in the dataset (Table 2). In the original data, the ME is approximately 20 times lower than the shape variability among individuals. In modelled datasets with progressively decreased digitisation precision, the ME gradually increases to a value where it makes up 34.8% of the total variation, and it is only approximately twice as low as the overall variability among individuals (Table 2).
Table 2.
Results of Procrustes ANOVAs quantifying variation among individuals in the dataset of M. thomasiana cultured at 25 °C and registered by 21 landmarks and in nine subsequent configurations with gradually increasing artificially induced isotropic error in landmark coordinates. ME, measurement error; R2, coefficient of determination; SS, Procrustes sums of squares.
The BE–PWv plots reflect the gradually increasing levels of ME, and the slopes gradually increase towards zero, even though the individual PWs obviously retain essentially identical BE values (Figure 4d). The Procrustes SS for ME in these ten datasets and the corresponding slopes of the BE–PWv plots produce a non-linear relationship (Figure 4e). Clearly, the increase in isotropic ME also increases the shape distances among specimens, and therefore the corresponding SS quantify the variation among specimens (Table 2). Thus, the relative contribution of the ME to the total shape variation (R2) shows a tight linear relationship to the values of the BE–PWv slopes (Figure 4f). The lowest points on the left in Figure 4e,f correspond to the original data and thus the steepest decreasing BE–PWv line in Figure 4d. However, what would be the slope value in a theoretical scenario with zero ME? In such situations, both digitisations of the same dataset would produce identical configurations for each object, and the R2 (and Procrustes SS) for the ME in the Procrustes ANOVA model would be zero. This corresponds to the intercept (b = −0.369) of the linear relationship shown in Figure 4f. The value of this intercept can therefore be used as an estimate of the value of slopes adjusted for the increase caused by the inevitable digitisation error. The adjusted values obtained by a similar procedure for all 12 datasets show that the values of ME-corrected BE–PWv slopes clearly decreased. However, they still consistently remained above the level of self-similarity (Table 1).
4. Discussion
The shape variation in Micrasterias semicells was consistently different from the notion of self-similar spatial patterning, which would imply symmetric amounts of shape variation across the scales, i.e., within cellular lobes and lobules of different orders. This was also the case when the analysis of BE–PWv slopes omitted the smallest-scale PWs. This was true regardless of the temperature at which the semicells were cultured and thus regardless of the rate of population growth, i.e., the cell wall deposition and the chemical processes that lead to its final stiffening. This was also the case regardless of the species examined within the Micrasterias phylogenetic lineage. Finally, this was the case regardless of the number of landmarks in the configurations. Those that consisted of just 21 landmarks covered essentially only the shape variation of the first- and second-order lobes. In contrast, M. thomasiana configurations consisting of 71 landmarks involved shape patterns of lobules up to the fourth-order terminal lobules. In all these cases, however, the BE–PWv slopes consistently showed that shape variability actually increased with decreasing scale. Thus, in Bookstein’s terminology [16], these are disintegrated structures.
It should be noted that the observed values are closer to zero, corresponding to the theoretical total disintegration of individual landmarks, than those previously found for any multicellular organisms or tissues [28,36,37,38]. Thus, it appears that morphogenesis at the single-cell level can indeed lead to structures whose integration is markedly different from that of multicellular organisms. It is an extreme case of what Mitteroecker et al. termed compensatory variation [19]. While the overall shape patterns are relatively homogeneous, the small-scale parts of these structures seem to behave more or less independently of each other. While the relative distances between lobes can approximate scale-invariant arrangements [21], the variability of their shapes increase with decreasing scale. In other words, while shape variation at the level of the main cellular parts is relatively strongly canalised, it clearly increases at the subsequent levels of lobe branching. Thus, it appears that in the higher-order lobes and terminal lobules, these living entities lack a selective pressure to keep their shapes comparatively stable, in contrast to the main lobes and the overall outlines of semicells.
Interestingly, these observations are consistent with earlier studies that showed a different nature of the morphogenetic processes of the main cellular parts and the small-scale features of Micrasterias semicells [39,40]. The initial pattern of the three main lobes in the newly developing semicells is inherited from their older counterparts, producing relatively tightly controlled mirror copies with the corresponding number and arrangement of these large-scale cellular parts. Conversely, laser treatment of the plasma membrane in growing semicells leading to blockage of development at particular microsites showed that this damage was localised to individual lobules [41,42]. This indicated that the growth and branching of each of the terminal lobules proceeds relatively independently of the other cellular parts [12,43].
Likewise, the theoretical models of Micrasterias morphogenesis assumed that the differential growth of the plasma membrane leading to tip growth of terminal lobules and their successive branching is based on a two-morphogen reaction–diffusion system [44,45]. In these models, growing semicells are progressively compartmentalised into relatively independent lobes and lobules, and their final forms are achieved by multiple actively developing centres that lack any meaningful coordination with each other [46]. Thus, these models correspond quite well with the observed patterns of increased small-scale shape variation in the studied Micrasterias datasets.
Is it possible that these patterns are fundamentally related to the fact that Micrasterias is a unicellular structure? Interestingly, a recent study of morphological integration in colonial microalgae belonging to the chlorophycean genus Pseudopediastrum showed that integration was stronger in cells located within the colonies and thus adjacent to the surrounding cells, as is the case in multicellular tissues, than in marginal cells [47]. This might indicate that in such structures, composed of a few living cells, the levels of integration decrease in those cells that are protruding freely into the surrounding space.
A geometric morphometric analysis of morphological integration based on the detection of departures from self-similar variation patterns is still a relatively new and evolving method. Clearly, the assessment of digitisation imprecision on the observed values of BE–PWv slopes is an important aspect of these analyses. In general, the more ME there is, the higher the BE–PWv slope. Thus, this obviously needs to be taken into account when comparing different datasets with different ME levels. It should be noted that ME quantification through repeated digitisations allows us to assess the influence of isotropic and homogeneous ME, i.e., one that is generally the same across different landmarks. In the case of Micrasterias cells, where virtually all landmarks are of the same type, i.e., specifically the points defining lobe tips and incisions, this assumption may be realistic. However, in analyses combining different types of landmarks or semilandmarks, the situation may be more complex and deserves further research.
In summary, the presented analyses illustrated that the spatial patterns of shape variation in unicellular structures can indeed be fundamentally different from those of multicellular organisms, which are composed of multiple cell types constituting different tissues and, thus, generally require a higher level of coordinated variation. Unicellular living structures may not even be organisms in this narrow sense of the word. Nevertheless, their morphogenesis may be considered a controlled acquisition of space. As we have shown, in cells of the microalgal genus Micrasterias, this control progressively declines with decreasing spatial scale to the point that their terminal lobules are shaped almost independently of each other, rejecting the null hypothesis of self-similar shape variation.
Author Contributions
J.N. and K.W. conceived and designed the study design and did the field sampling and strain isolation, K.W. cultured the strains, J.N. analysed the data and wrote the original draft, which was discussed, edited, and revised by both authors. All authors have read and agreed to the published version of the manuscript.
Funding
The study was funded by the Czech Science Foundation (project No. 22-20989S).
Data Availability Statement
All the primary data and scripts used in this study are available at https://doi.org/10.5281/zenodo.7872565 (accessed on 14 August 2023).
Acknowledgments
The authors thank the Regional Authority of Ustecky Region for field research permission (No. KUUK/073894/21). The authors thank Springer Nature Author Services for English language editing and style corrections.
Conflicts of Interest
The authors declare no conflict of interest.
References
- Olson, E.C.; Miller, R.L. Morphological Integration; University of Chicago Press: Chicago, IL, USA, 1958; p. 376. [Google Scholar]
- Parés-Casanova, P.M.; Rissech, C.; Davis, S.; Lloveras, L. Morphological integration on the calcaneum of domestic sheep (Ovis aries Linnaeus, 1758)–a geometric morphometric study. Appl. Sci. 2023, 13, 4177. [Google Scholar] [CrossRef]
- Klingenberg, C.P. Studying morphological integration and modularity at multiple levels: Concepts and analysis. Phil. Trans. R. Soc. B 2014, 369, 20130249. [Google Scholar] [CrossRef] [PubMed]
- Conaway, M.A.; Adams, D.C. An effect size for comparing the strength of morphological integration across studies. Evolution 2022, 76, 2244–2259. [Google Scholar] [CrossRef] [PubMed]
- Benítez, H.A.; Püschel, T.A.; Suazo, M.J. Drosophila wing integration and modularity: A multi-level approach to understand the history of morphological structures. Biology 2022, 11, 567. [Google Scholar] [CrossRef]
- Harold, F.M. To shape a cell: An inquiry into the causes of morphogenesis of microorganisms. Microb. Rev. 1990, 54, 381–431. [Google Scholar] [CrossRef]
- Lütz-Meindl, U. Micrasterias as a model system in plant cell biology. Front. Plant Sci. 2016, 7, 999. [Google Scholar] [CrossRef]
- Weiss, D.; Lütz, C.; Lütz-Meindl, U. Photosynthesis and heat response of the green alga Micrasterias denticulata (Desmidiaceae). Zeitsch. Naturf. 1999, 54, 508–516. [Google Scholar] [CrossRef]
- Song, X.; Kong, F.; Liu, B.F.; Song, Q.; Ren, N.Q.; Ren, H.Y. Thallium-mediated NO signalling induced lipid accumulation in microalgae and its role in heavy metal bioremediation. Water Res. 2023, 239, 120027. [Google Scholar] [CrossRef]
- Brook, A.J. The Biology of Desmids; Blackwell Science: Oxford, UK, 1981; p. 276. [Google Scholar]
- Felhofer, M.; Mayr, K.; Lütz-Meindl, U.; Gierlinger, N. Raman imaging of Micrasterias: New insights into shape formation. Protoplasma 2021, 258, 1323–1334. [Google Scholar] [CrossRef]
- Neustupa, J. Asymmetry and integration of cellular morphology in Micrasterias compereana. BMC Evol. Biol. 2017, 17, 1. [Google Scholar] [CrossRef]
- Harrison, L.G. The Shaping of Life: The Generation of Biological Pattern; Cambridge University Press: Cambridge, UK, 2011; p. 247. [Google Scholar]
- Neustupa, J. Static allometry of unicellular green algae: Scaling of cellular surface area and volume in the genus Micrasterias (Desmidiales). J. Evol. Biol. 2016, 29, 292–305. [Google Scholar] [CrossRef]
- Mandelbrot, B.B. The Fractal Geometry of Nature; W.H. Freeman and Company: New York, NY, USA, 1982; p. 497. [Google Scholar]
- Bookstein, F.L. Integration, disintegration, and self-similarity: Characterizing the scales of shape variation in landmark data. Evol. Biol. 2015, 42, 395–426. [Google Scholar] [CrossRef]
- Bookstein, F.L. A Course in Morphometrics for Biologists; Cambridge University Press: Cambridge, UK, 2018; p. 527. [Google Scholar]
- Windhager, S.; Bookstein, F.L.; Millesi, E.; Wallner, B.; Schaefer, K. Patterns of correlation of facial shape with physiological measurements are more integrated than patterns of correlation with ratings. Sci. Rep. 2017, 7, 45340. [Google Scholar] [CrossRef]
- Mitteroecker, P.; Bartsch, S.; Erkinger, C.; Grunstra, N.D.S.; Le Maître, A.; Bookstein, F.L. Morphometric variation at different spatial scales: Coordination and compensation in the emergence of organismal form. Syst. Biol. 2020, 69, 913–926. [Google Scholar] [CrossRef]
- Cardini, A. Integration and modularity in Procrustes shape data: Is there a risk of spurious results? Evol. Biol. 2019, 46, 90–105. [Google Scholar] [CrossRef]
- McNally, J.G. Scale-invariant pattern in the alga Micrasterias. J Biol. Phys. 1990, 17, 235–243. [Google Scholar] [CrossRef]
- Škaloud, P.; Nemjová, K.; Veselá, J.; Černá, K.; Neustupa, J. A multilocus phylogeny of the desmid genus Micrasterias (Streptophyta): Evidence for the accelerated rate of morphological evolution in protists. Mol. Phyl. Evol. 2011, 61, 933–943. [Google Scholar] [CrossRef]
- Poulíčková, A.; Mazalová, P.; Vašut, R.J.; Šarhanová, P.; Neustupa, J. DNA content variation and its significance in the evolution of the genus Micrasterias (Desmidiales, Streptophyta). PLoS ONE 2014, 9, e86247. [Google Scholar] [CrossRef]
- Araujo, C.B.D.; Bicudo, C.E.D.M.; Silva, T.G.D.; Trumhová, K.; Škaloud, P. Hidden generic diversity in desmids: Description of Pseudomicrasterias gen. nov. (Desmidiaceae, Zygnematophyceae). Phycologia 2022, 61, 227–240. [Google Scholar] [CrossRef]
- Andersen, R.A. Algal Culturing Techniques; Academic Press: Amsterdam, The Netherlands, 2005; p. 578. [Google Scholar]
- Rohlf, F.J. The Tps series of software. Hystrix 2015, 26, 9–12. [Google Scholar]
- Klingenberg, C.P. Analyzing fluctuating asymmetry with geometric morphometrics: Concepts, methods, and applications. Symmetry 2015, 7, 843–934. [Google Scholar] [CrossRef]
- Bookstein, F.L. Reflections on a biometrics of organismal form. Biol. Theory 2019, 14, 177–211. [Google Scholar] [CrossRef]
- Muggeo, V.M. Estimating regression models with unknown break-points. Stat. Med. 2003, 22, 3055–3071. [Google Scholar] [CrossRef] [PubMed]
- R Core Team. A Language and Environment for Statistical Computing. Available online: https://www.r-project.org (accessed on 12 August 2023).
- Adams, D.C.; Otárola-Castillo, E. Geomorph: An R package for the collection and analysis of geometric morphometric shape data. Meth. Ecol. Evol. 2013, 4, 393–399. [Google Scholar] [CrossRef]
- Dryden, I.L. Shapes Packzage. Available online: https://cran.r-project.org/web/packages/shapes/index.html (accessed on 12 August 2023).
- Muggeo, V.M. Segmented: An R Package to Fit Regression Models with Broken-Line Relationships. Available online: https://cran.r-project.org/doc/Rnews/ (accessed on 12 August 2023).
- Hammer, Ø.; Harper, D.A.T.; Ryan, P.D. PAST: Paleontological statistics software package for education and data analysis. Palaeont. Electr. 2001, 4, 1–9. [Google Scholar]
- Zelditch, M.L.; Swiderski, D.L.; Sheets, H.D. Geometric Morphometrics for Biologists. A Primer; Elsevier: Amsterdam, The Netherlands, 2012; p. 443. [Google Scholar]
- Piras, P.; Torromeo, C.; Evangelista, A.; Gabriele, S.; Esposito, G.; Nardinocchi, P.; Teresi, L.; Madeo, A.; Schiariti, M.; Varano, V.; et al. Homeostatic left heart integration and disintegration links atrio-ventricular covariation’s dyshomeostasis in hypertrophic cardiomyopathy. Sci. Rep. 2017, 7, 6257. [Google Scholar] [CrossRef]
- Grunstra, N.D.S.; Bartsch, S.J.; Le Maître, A.; Mitteroecker, P. Detecting phylogenetic signal and adaptation in papionin cranial shape by decomposing variation at different spatial scales. Syst. Biol. 2021, 70, 694–706. [Google Scholar] [CrossRef]
- Sansalone, G.; Paolo, C.; Riccardo, C.; Stephen, W.; Silvia, C.; Pasquale, R. Trapped in the morphospace: The relationship between morphological integration and functional performance. Evolution 2022, 76, 2020–2031. [Google Scholar] [CrossRef]
- Waris, H.; Kallio, P. Morphogenesis in Micrasterias. Adv. Morphog. 1964, 4, 45–80. [Google Scholar]
- Kallio, P.; Lehtonen, J. Nuclear control of morphogenesis in Micrasterias. In Cytomorphogenesis in Plants; Kiermayer, O., Ed.; Springer: Vienna, Austria, 1981; pp. 191–213. [Google Scholar]
- Lacalli, T.C. Morphogenesis in Micrasterias. II. Patterns of morphogenesis. J. Embryol. Exp. Morph. 1975, 33, 117–126. [Google Scholar] [CrossRef]
- Lacalli, T.C. Morphogenesis in Micrasterias. III. The morphogenetic template. Protoplasma 1976, 88, 133–146. [Google Scholar] [CrossRef]
- Lacalli, T.C.; Harrison, L.G. Turing’s model and branching tip growth: Relation of time and spatial scales in morphogenesis, with application to Micrasterias. Can. J. Bot. 1987, 65, 1308–1319. [Google Scholar] [CrossRef]
- Holloway, D.M.; Harrison, L.G. Algal morphogenesis: Modelling interspecific variation in Micrasterias with reaction–diffusion patterned catalysis of cell surface growth. Phil. Trans. R. Soc. B 1999, 354, 417–433. [Google Scholar] [CrossRef]
- Holloway, D.M.; Harrison, L.G. Pattern selection in plants: Coupling chemical dynamics to surface growth in three dimensions. Ann. Bot 2008, 101, 361–374. [Google Scholar] [CrossRef]
- Holloway, D.M. The chemical kinetics of shape determination in plants. In Chemical Kinetics; Patel, V., Ed.; InTech Press: Rijeka, Croatia, 2012; pp. 203–226. [Google Scholar]
- Lenarczyk, J. Evolution of morphological variability and modularity in single cells of algal colonies: A case study Pseudopediastrum (Hydrodictyaceae, Sphaeropleales, Chlorophyceae). Phycologia 2019, 58, 180–191. [Google Scholar] [CrossRef]
Disclaimer/Publisher’s Note: The statements, opinions and data contained in all publications are solely those of the individual author(s) and contributor(s) and not of MDPI and/or the editor(s). MDPI and/or the editor(s) disclaim responsibility for any injury to people or property resulting from any ideas, methods, instructions or products referred to in the content. |
© 2023 by the authors. Licensee MDPI, Basel, Switzerland. This article is an open access article distributed under the terms and conditions of the Creative Commons Attribution (CC BY) license (https://creativecommons.org/licenses/by/4.0/).