You are currently viewing a new version of our website. To view the old version click .
Symmetry
  • Article
  • Open Access

12 August 2023

Applications of Convolutional Neural Networks to Extracting Oracle Bone Inscriptions from Three-Dimensional Models

,
,
,
,
and
1
Key Laboratory of Oracle Bone Inscriptions Information Processing, Ministry of Education of China, Anyang 455000, China
2
School of Computer & Information Engineering, Anyang Normal University, Anyang 455000, China
3
Shenyang Institute of Computing Technology, University of Chinese Academy of Sciences, Shenyang 110168, China
4
University of Chinese Academy of Sciences, Beijing 100049, China
This article belongs to the Section Computer

Abstract

In recent years, high-fidelity three-dimensional (3D) oracle bone models (3D-OBMs) have received extensive attention from oracle bone experts due to their unparalleled reducibility to real oracle bone. In the research process of 3D-OBMs, the first procedure is to extract oracle bone inscriptions (OBIs) from the model to form individual oracle bone characters (OBCs). However, the manual extraction of OBIs is a time-consuming and labor-intensive task that relies heavily on oracle bone knowledge. To address these problems, we propose a texture-mapping-based OBI extractor (tm-OBIE), which leverages the symmetrical characteristics of the texture mapping process and is able to extract 3D-OBIs from 3D-OBMs saved as a wavefront file. The OBIs in the texture file were first located using a trained 2D object detector. After that, the 3D mesh area, where the OBIs are located, was obtained using an inverse texture mapping method. Thirdly, a specific 2D plane was fitted using the centroid of triangular faces in the flat regions of the mesh via a singular value decomposition (SVD) method. Finally, by measuring the distances between the triangle meshes and the fitted plane, the meshes of the 3D-OBIs were obtained. This paper verifies the feasibility of this method via experiments and analyzes the possibility of using the algorithm framework for extracting other ancient characters from their corresponding 3D models.

1. Introduction

OBIs are defined as ancient Chinese characters engraved on the shells and bones in the Shang Dynasty more than 3000 years ago. As the earliest systematic Chinese language materials discovered so far, OBIs are hugely valuable to research. In recent years, OBI interpretation and oracle bone rejoining have served as two important research directions in oracle bone science [].
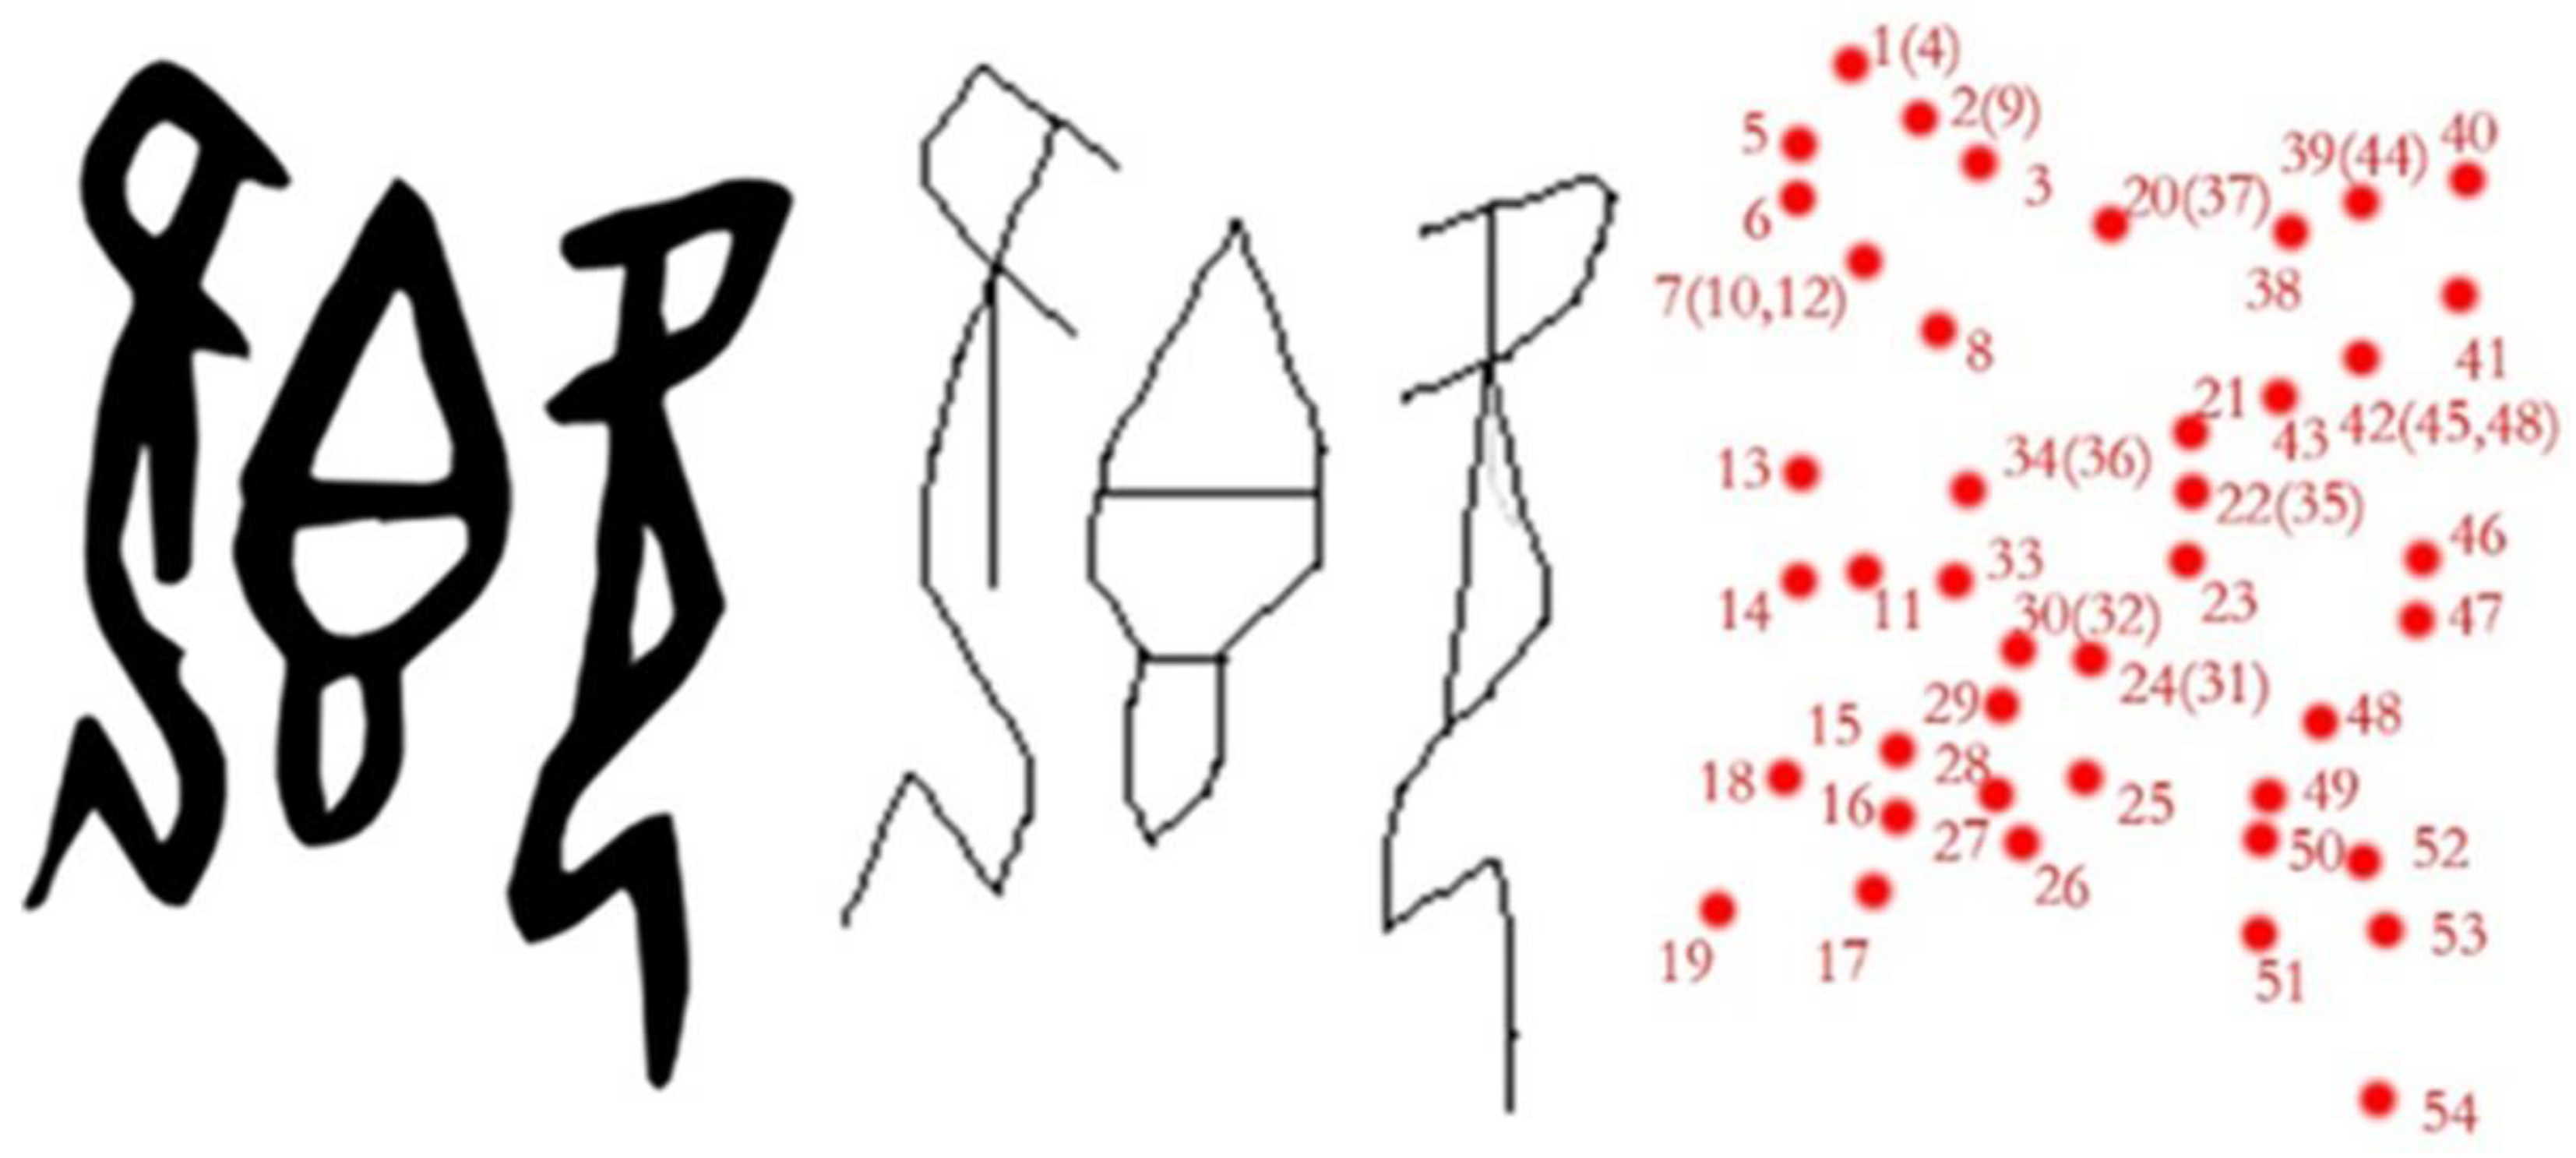
The purpose of OBI interpretation is to interpret the meaning of OBCs that have not yet been recognized. One of the current mainstream ideas for OBI interpretation is finding the corresponding OBCs from modern Chinese characters through “the line of evolution of Chinese character”, as shown in Figure 1.
Figure 1. The evolution of a Chinese character, this figure presents an evolutionary path of a specific Chinese character(which means “its” in English).
Figure 1 shows how a Chinese character has evolved from the oracle bone age to modern times; the leftmost character is part of an OBI, while the rightmost character is a modern Chinese character. During the process, point features were retrieved, which can be seen in Figure 2. Although these characters exist in different historical periods, they follow similar evolutionary laws in strokes and structures. If the OBC in a certain evolution line is vacant and characters in other periods are relatively complete, the writing form of this character might be deduced through the law of evolution, which would lead to the interpretation of the specific OBC. Recently, progress has been made in the evolution of ancient Chinese characters based on generative adversarial network (GAN) [].
Figure 2. The process of extracting oracle bone characters using a computer.
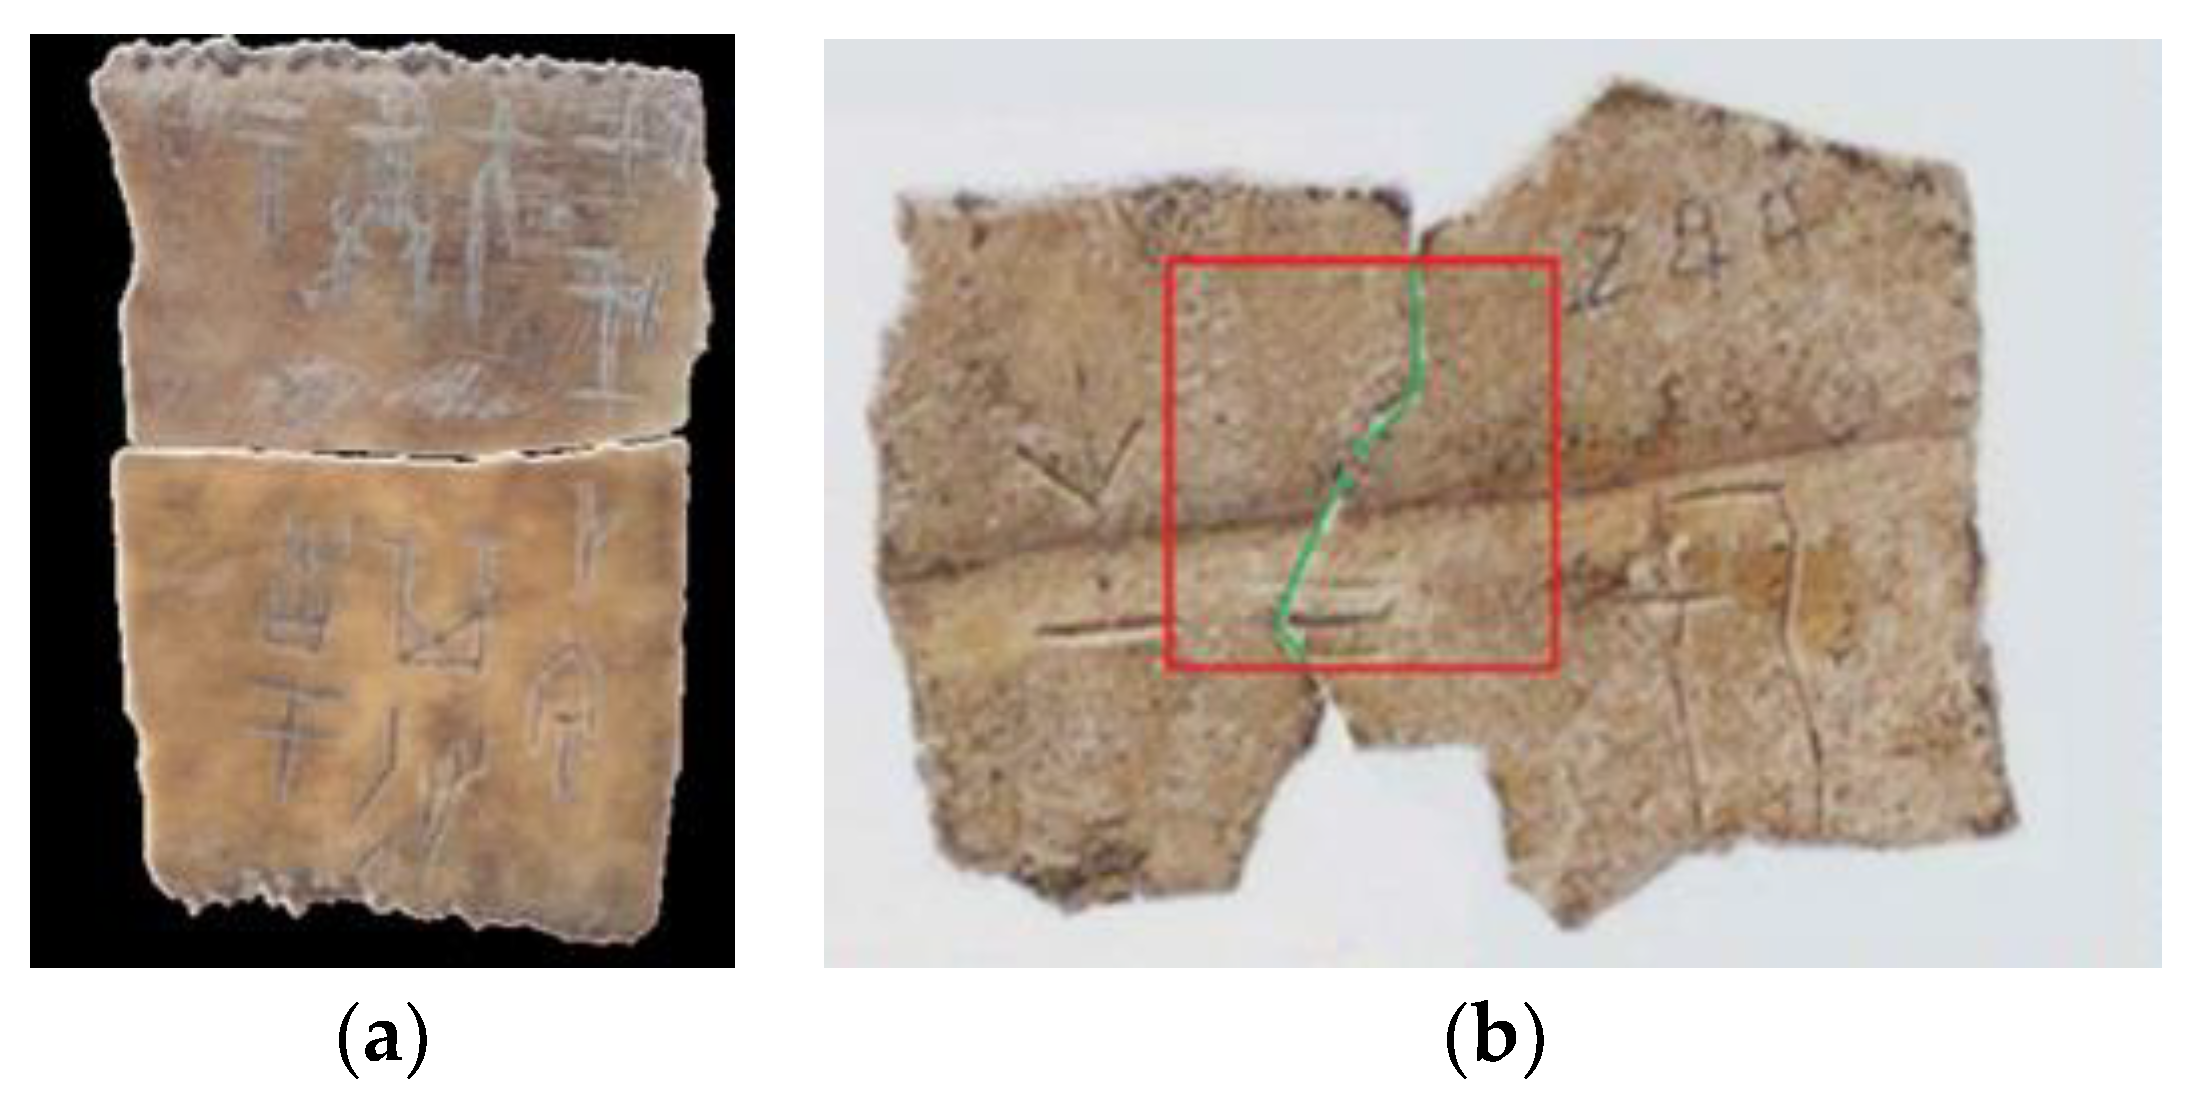
The process of oracle bone rejoining is finding oracle fragments that belong to one entity. Figure 3a shows two successfully rejoined oracle bones. Since the rejoining process requires frequent comparisons of edge features and OBC features, it is laborious and time-consuming work. Computer-aided oracle bone rejoining involves using a program to automatically extract and analyze the features of oracle bones. It can be used to present a small number of potentially matchable pairs to users via the comparison of OBC and edge eigenvalues to reduce the burden on users []. Figure 3b presents a computer-aided successfully rejoined pattern of two oracle bones. Since the same ancient inscriber tends to have unique eigenvalues for OBCs, experts usually judge whether the OBCs in two oracle bones are carved by the same inscriber, so as to indirectly judge whether or not the two oracle bones can be rejoined.
Figure 3. Example of successfully rejoined oracle bones. (a) A set of rejoined bones. (b) A set of computer-aided rejoined bones.
Thus far, computer-aided OBI interpretation or oracle bone rejoining has relied on digital replicas of real oracle bones; an example of the two-dimensional images can be seen in Figure 4a. In the process of collecting two-dimensional images of oracle bones, it is difficult for amateur collectors to strictly follow collection standards in order to obtain images with consistent specifications. However, inconsistent image specifications can lead to inconsistent object scales, making it difficult to directly utilize these images even if a unified scale reference is added during the collection process. Moreover, in two-dimensional images, the front and sides of the oracle bones tend to overlap with each other, and the OBCs are distorted due to the shooting angle. In the upper left corner of Figure 4a, the front and sides of the oracle bone overlap, which results in a blurred fracture surface. In contrast, in Figure 4b, the 3D model of the identical oracle bone, the corresponding fracture surface can be clearly depicted. Additionally, the 2D images are unable to reflect the depth features of the OBCs that are closely related to their inscribing style. Experts are able to infer the inscriber and the historical period of the characters from the inscribing style, which is essential for OBI interpretation and oracle bone rejoining.
Figure 4. The 2D images of oracle bone vs. 3D models. (a) An image of oracle bone. (b) 3D-OBM. (c) 3D-OBC Scratch with background. (d) 3D-OBC Scratch.
In recent years, the technology of high-precision 3D scanners has greatly developed. These scanners are able to acquire the real size of the object with an accuracy range of 0.08 mm. The 3D-OBMs reconstructed by the scanner provide brilliant materials for the study of oracle bone science. Aside from providing the real size of the OBIs, 3D-OBMs are also able to display the depths of the OBCs. Figure 4c shows an OBC in the 3D mesh model that is obtained from the 3D model shown in Figure 4b. The OBC in 3D mesh model provides much more detail than its corresponding 2D image, which encourages OBI interpretation and oracle bone rejoining. By analyzing the features of the stroke intersection areas acquired from the 3D model, experts are endowed with the ability to deduce the inscribing sequence of the oracle bone strokes, which helps identifying the inscriber and historical period that the OBC belongs to, thus accelerating the process of OBI interpretation. The writing styles of the OBCs in the oracle bone fragments that can be rejoined together are essentially the same, especially the width and the depth of their strokes. If the individual character mesh model can be obtained from the 3D-OBMs (as shown in Figure 4d), then the width and depth features of its strokes can be further extracted to support the oracle bone rejoining research area.
Obtaining 3D-OBCs from the 3D-OBMs is regarded as the first step towards the efficient utilization of 3D-OBMs. However, the manual extraction of 3D-OBCs requires proficiency in 3D editing software (e.g., 3Dmax) and is time-consuming and labor-intensive work. It seems that the automatic extraction of 3D-OBCs may relieve the burden on the user to some extent. Nevertheless, to the best of the authors’ knowledge, no research has focused on the process of automatically extracting 3D-OBCs, which, although simple at first glance, is actually notoriously difficult to undertake. To make it even more difficult, since the concept of 3D-OBM has just been proposed, there is not an adequate number of 3D-OBMs available for machine learning. Focusing on the automatic extraction process of 3D-OBCs, we propose the tm-OBIE, which includes 3D-OBC plane extraction based on the inverse mapping method of texture and the scratch extraction method based on the feature of the distance between the scratch and its fitting plane. The contributions of the paper are as follows.
① This is the first attempt to design an automatic 3D-OBC extractor. We analyzed the characteristics of the 3D-OBMs in detail and proposed an effective framework.
② To overcome the lack of 3D texture datasets, a transfer learning method, which utilizes the 2D images of the oracle bones to train object detector, was proposed. The detector was further used to mark the OBCs in the 3D texture images. Given the specific rectangle mark within the texture image, the inverse mapping method was used to segment the individual 3D-OBC with its corresponding adjacent surface. We conducted a thorough performance analysis of three mainstream object detectors.
③ Considering the characteristics of the curved surface where the 3D-OBC is situated, we proposed a method to extract the scratch of the 3D-OBCs. First of all, the focuses of the featured triangles near the 3D-OBC were selected using the three-neighbor method. After that, an SVD algorithm was used to fit the focusing points to form a fitting plane. Finally, the distances between the fitting plane and each triangle were calculated to obtain the scratch of the 3D-OBCs.
The rest of the paper is arranged as follows: in the second chapter, studies related to oracle bone information processing and 3D-OBC extraction are discussed. In the third chapter, the construction of dataset used in this paper is discussed, and the framework and algorithms of tm-OBIE are elaborately depicted. In the fourth chapter, comprehensive experiments to verify the availability and performance of the tm-OBIE are described. In the fifth chapter, the advantages and disadvantages, applicability, and potential application value of the algorithm are described. Finally, in the sixth chapter, a conclusion is presented, summarizing the paper and presenting future research directions.

3. Material and Methods

3.1. The Construction of Datasets

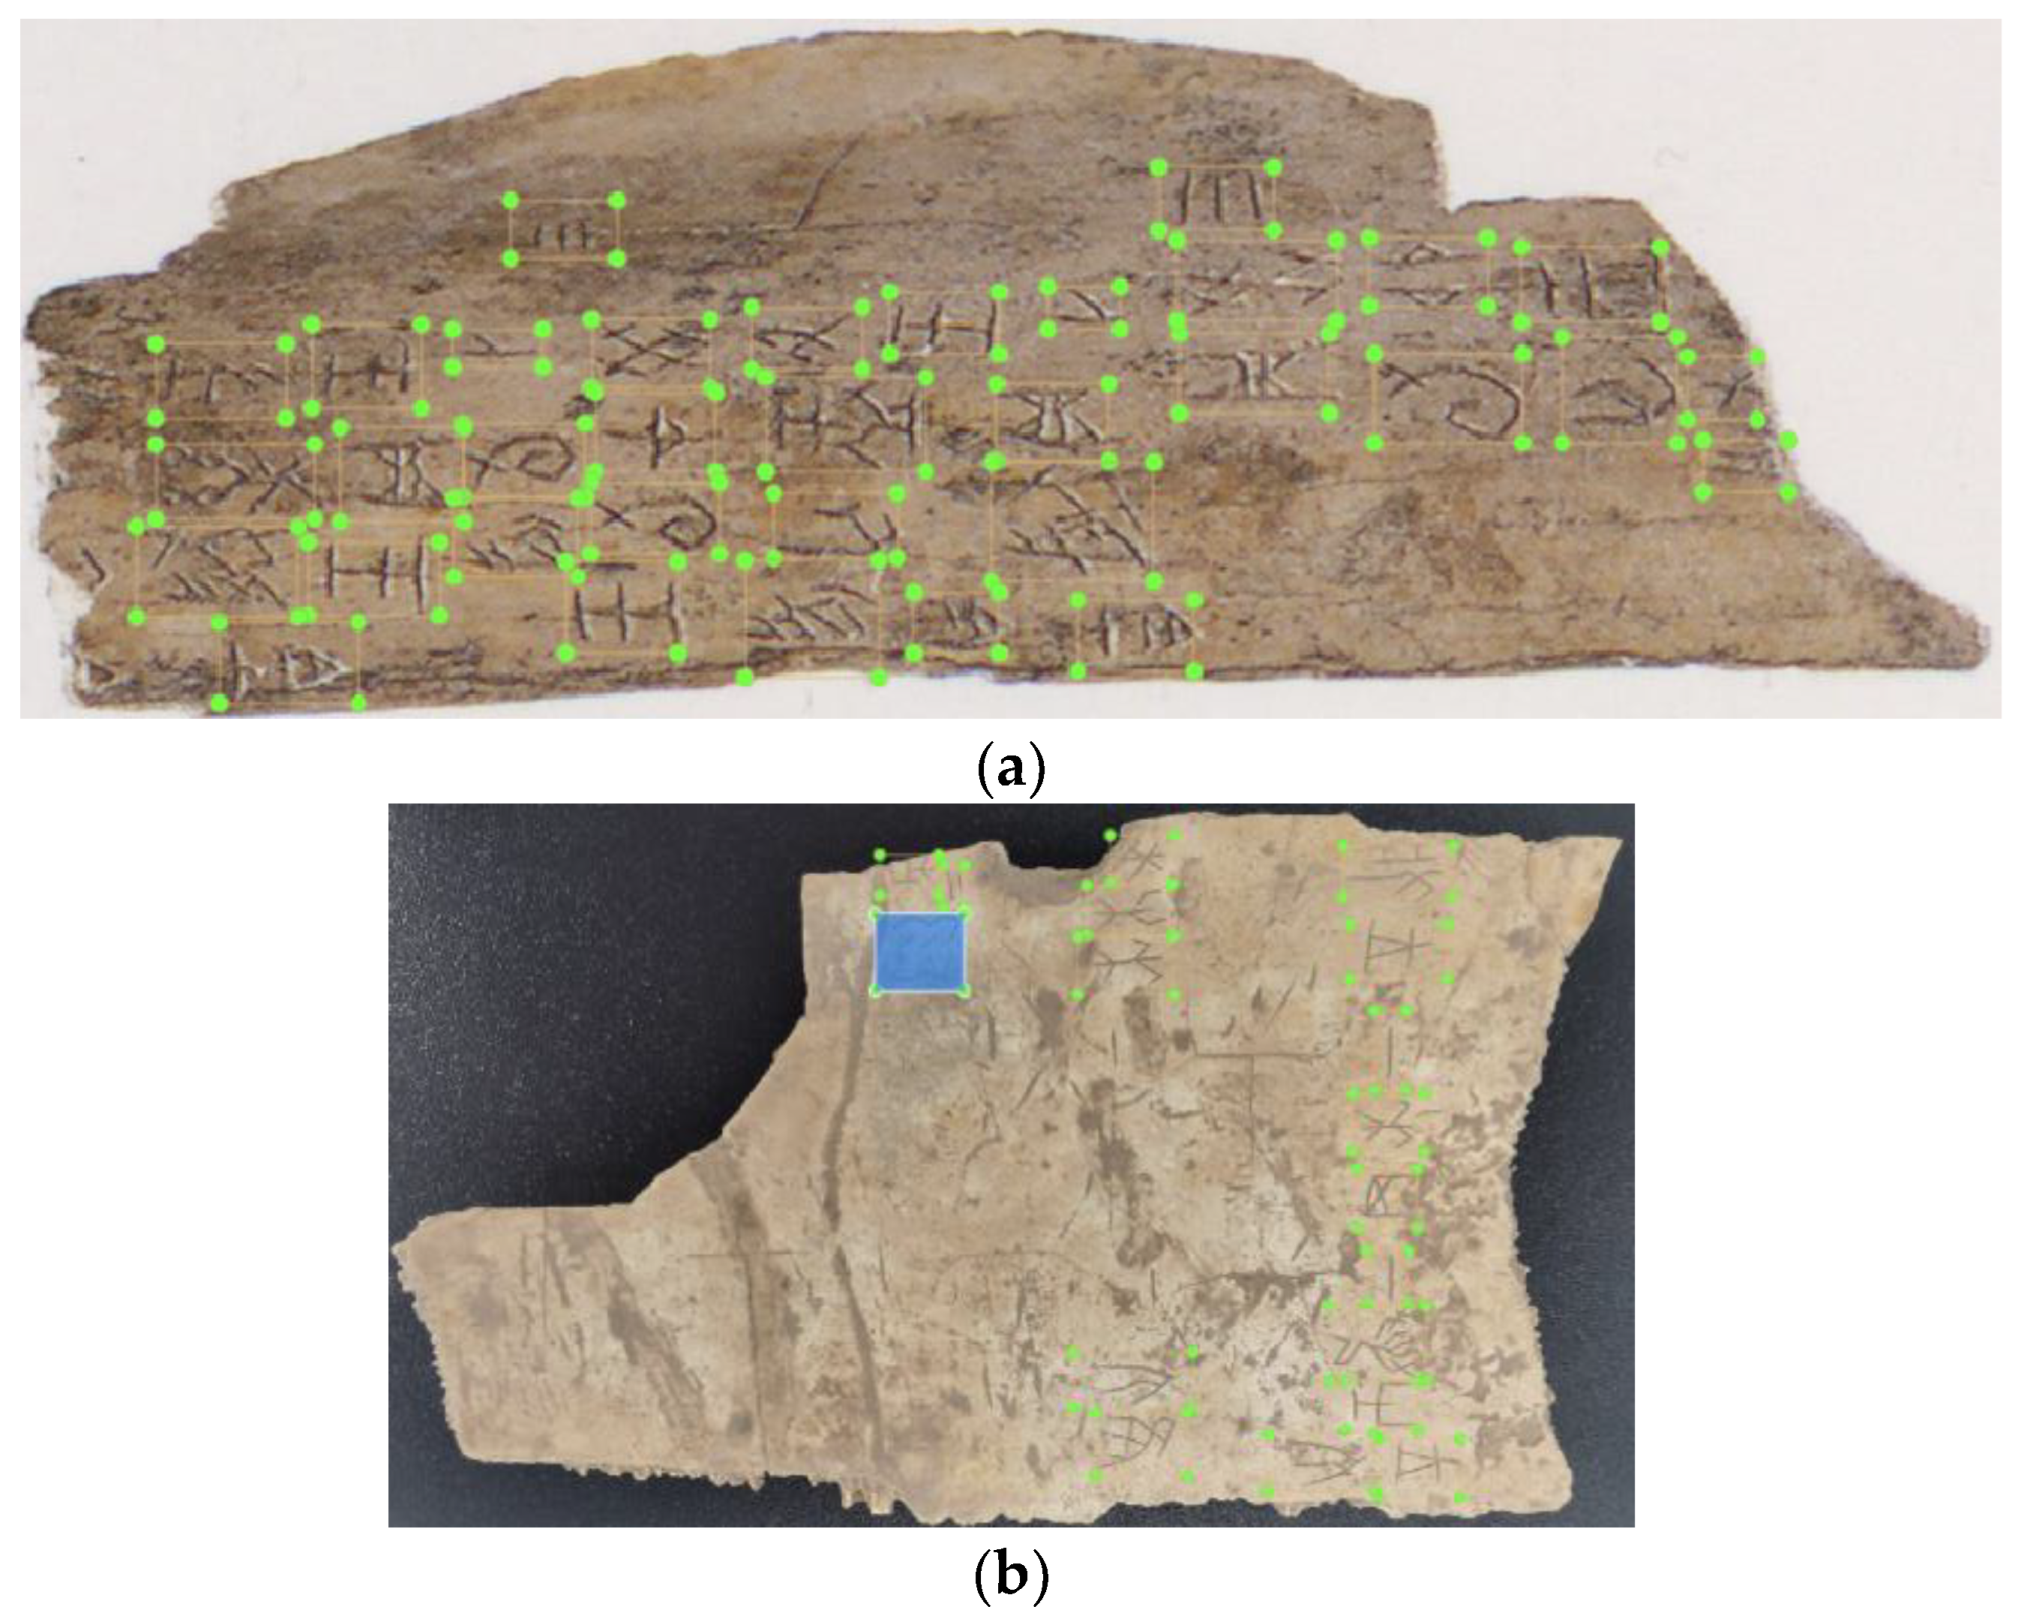
The paper involves two datasets, a two-dimensional oracle bone image dataset (2D Dataset) and a 3D-OBM dataset (3D Dataset). The images in the 2D dataset come from oracle collection books written by oracle experts (e.g., “Collection of oracle bone inscriptions”) and from private oracle bone collectors. We scanned the books in full page view, manually segmented the individual images, and processed them. The 2D dataset consists of 1723 images with the resolution between 1024 × 1024 and 2405 × 4277. All the OBCs within the images were manually labeled by the oracle bone experts. Figure 5 presents two labeled images within the dataset. The green rectangles indicate the existence of the OBC within this region.
Figure 5. An example of the image manually labeled by an expert. (a) Annotation of an oracle bone image from collection book. (b) Annotation of an oracle bone image from private collector.
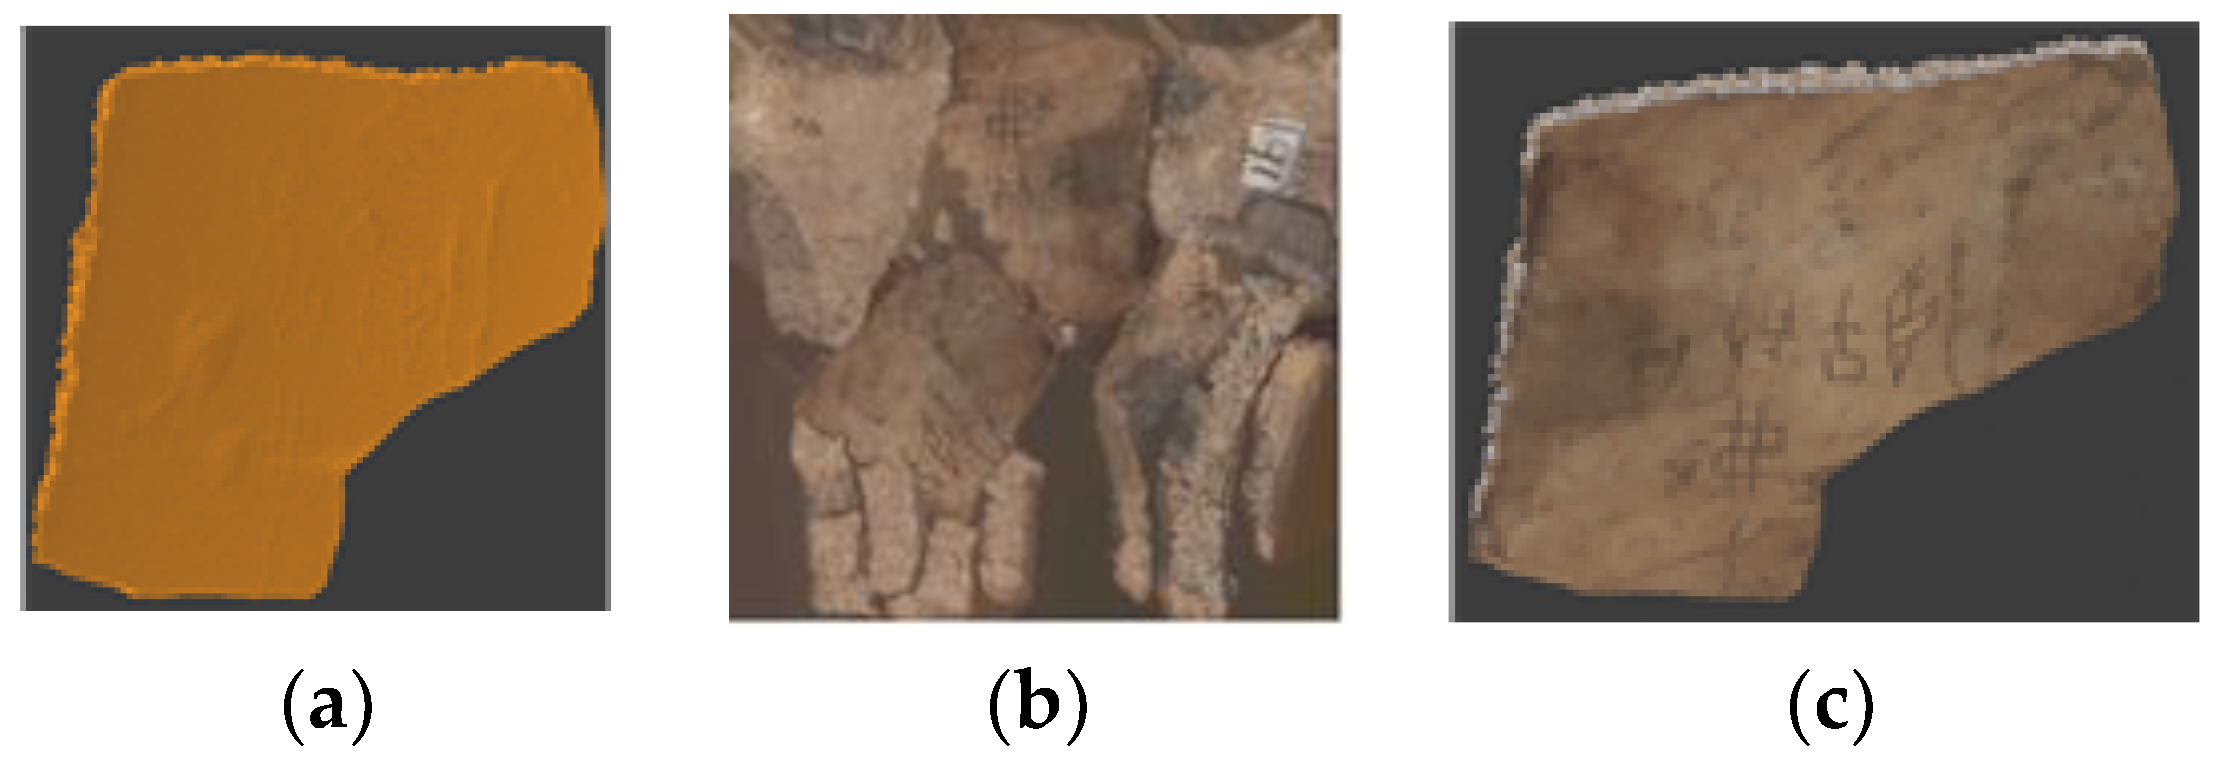
At present, many supporting software of high-precision 3D scanners provide a 3D model output in alias wavefront format. The alias wavefront format consists of three separate files, the 3D mesh file (ends with .obj), the material and environment control file (ends with. mtl), and the 2D texture file (ends with .jpg). The first file records the backbone of the 3D model in the form of polygon mesh (typically a triangular mesh). Specifically, the file includes the set of vertices for each polygon mesh, the 3D space coordinates of each vertex, the normal vector for each polygon and the mapping information from material file to mesh. An example of the visualization of the single 3D-OBM mesh file is shown in Figure 6a. Intuitively, although the model displays the spatial features of 3D-OBM, it lacks the texture and lighting features of the object surface, which are recorded in the other two files.
Figure 6. An example of wavefront 3D-OBM. (a) 3D-OBM mesh file, (b) 3D-OBM texture file, (c) complete 3D-OBM.
The second file shows the lighting, surface material, etc. The third texture file can be viewed as a 2D image formed by mapping the surface texture of the 3D model to the 2D plane using a UV unwrapping method; an example of the texture image from 3D-OBM is shown in Figure 6b. It is worth mentioning that for the 3D-OBM, we can always find a way to map the texture of the front and back surfaces to the 2D image completely and continuously. The combination of the three files results in a complete 3D-OBM, as shown in Figure 6c.
Regarding the 3D dataset, we collected data from 50 oracle bones that are part of a private collection using an Artec3DTM Micro scanner, and then processed the data using Artec Studio to obtain the 3D-OBMs. Some of the models can be seen in Figure 7.
Figure 7. Example of 3D-OBM within 3D dataset.

3.2. The Framework of tm-OBIE

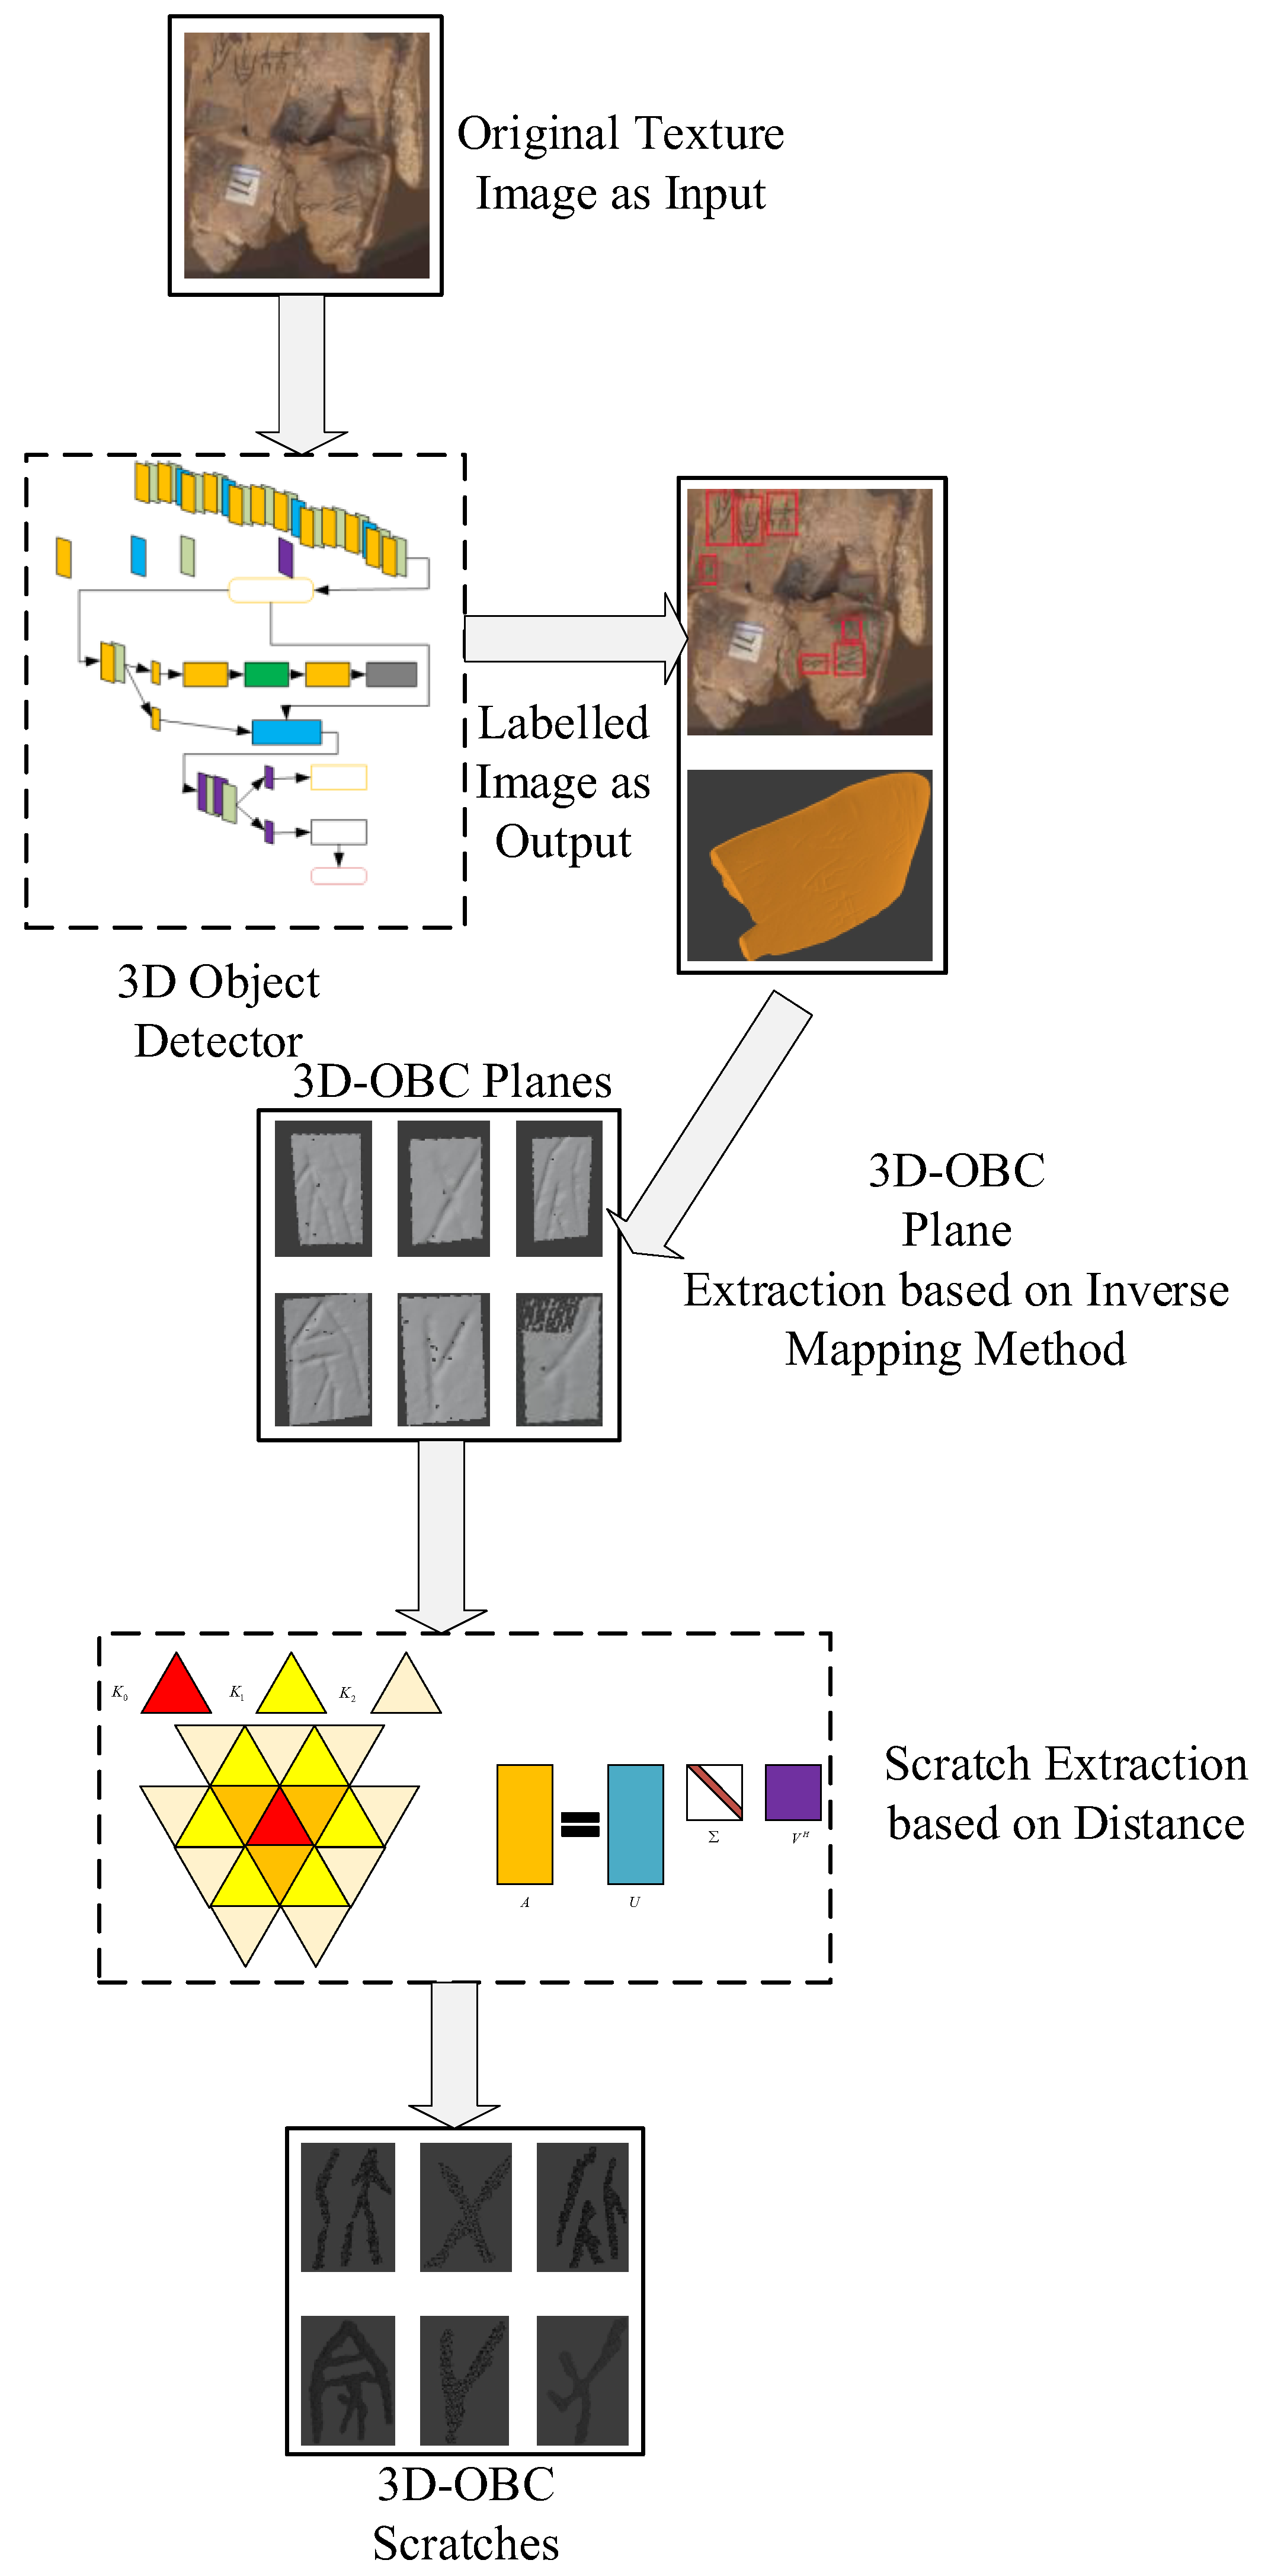
The overall process framework of the method is shown in Figure 8. Firstly, the texture images in the wavefront 3D model file group were input into the trained 2D image detector, and the label coordinates of each OBC in the image were obtained. After that, the inverse mapping method was utilized to segment the 3D-OBM into 3D-OBC planes (the rectangle plane which contain the scratches of the OBC itself). Finally, in order to retrieve the 3D-OBIs from the planes, the weighted N-nearest neighbor normal vector variance method was used to obtain the triangular faces of the seeds. Then, a method called singular value decomposition (SVD) was used to generate a plane to fit these triangular faces. Then, the triangular faces of the 3D-OBC scratches were selected based on the distance between the plane.
Figure 8. The framework of tm-OBIE.

3.3. 3D-OBC Plane Extraction Based on Inverse Mapping Method

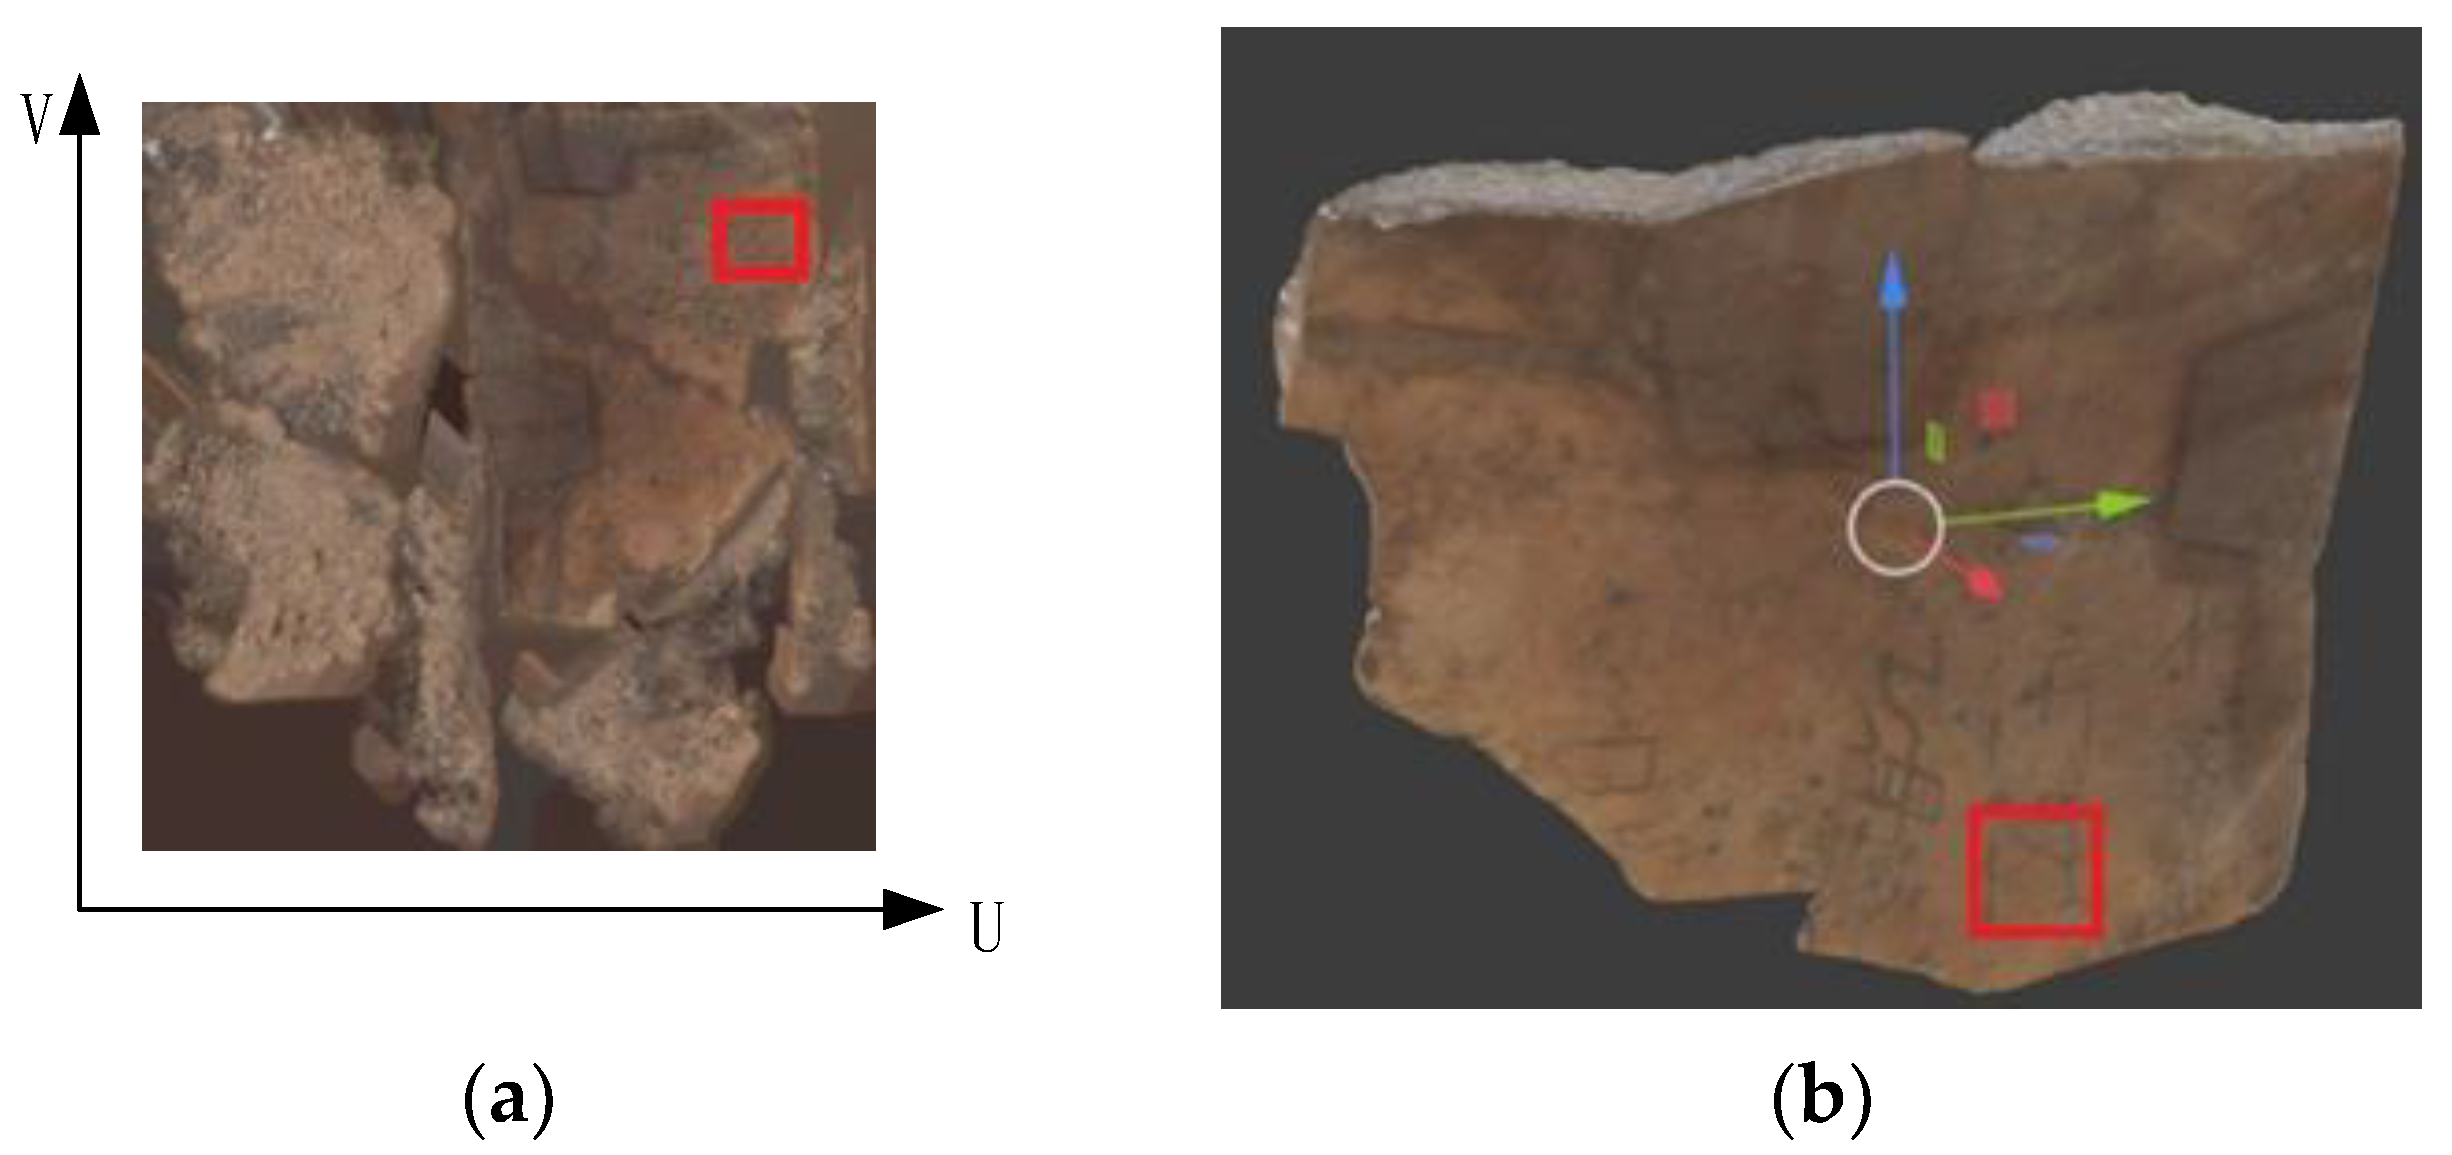
The texture image is an image formed by mapping the color information of the triangular surface in the 3D model to the 2D space (this process is called UV unwrapping). The supporting software of existing 3D scanners tend to coherently map the adjacent triangular faces in the 3D model to the 2D texture image. Therefore, from the 2D texture image, the location of the bounding box surrounding each OBC can be obtained via the trained two-dimensional object detector, and then the triangular surfaces of the separate OBC with backgrounds can be segmented using the texture inverse mapping method. An example of texture inverse is shown in Figure 9. In this example, the location of a 3D-OBC within its corresponding 3D-OBM can be obtained via its texture image.
Figure 9. An example of texture inverse. (a) The texture image of an 3D-OBM, (b) The corresponding 3D-OBM.
The corresponding algorithm can be seen in Algorithm 1.
Algorithm 1: The Inverse Mapping Algorithm
Input: The triangular mesh set  S and the two coordinates of the diagonal vertexes of the bounding box which annotates the OBC in the Texture Image denoted as V 0 ( x 0 , y 0 )  and  V 1 ( x 1 , y 1 ) ;
Output: The set  F containing the triangular meshes of the 3D-OBC scratches with backgrounds;
1:
F ;
2:
for each triangular mesh s i  in set  S  do
3:
v i ( x i , y i ) the focus of s i ;
4:
  i f   x i | x 1 x 0 |   and   y i | y 1 y 0 |
5:
     add   s i  to  F ;
6:
end
7:
end

3.4. Scratch Extraction Based on Distance

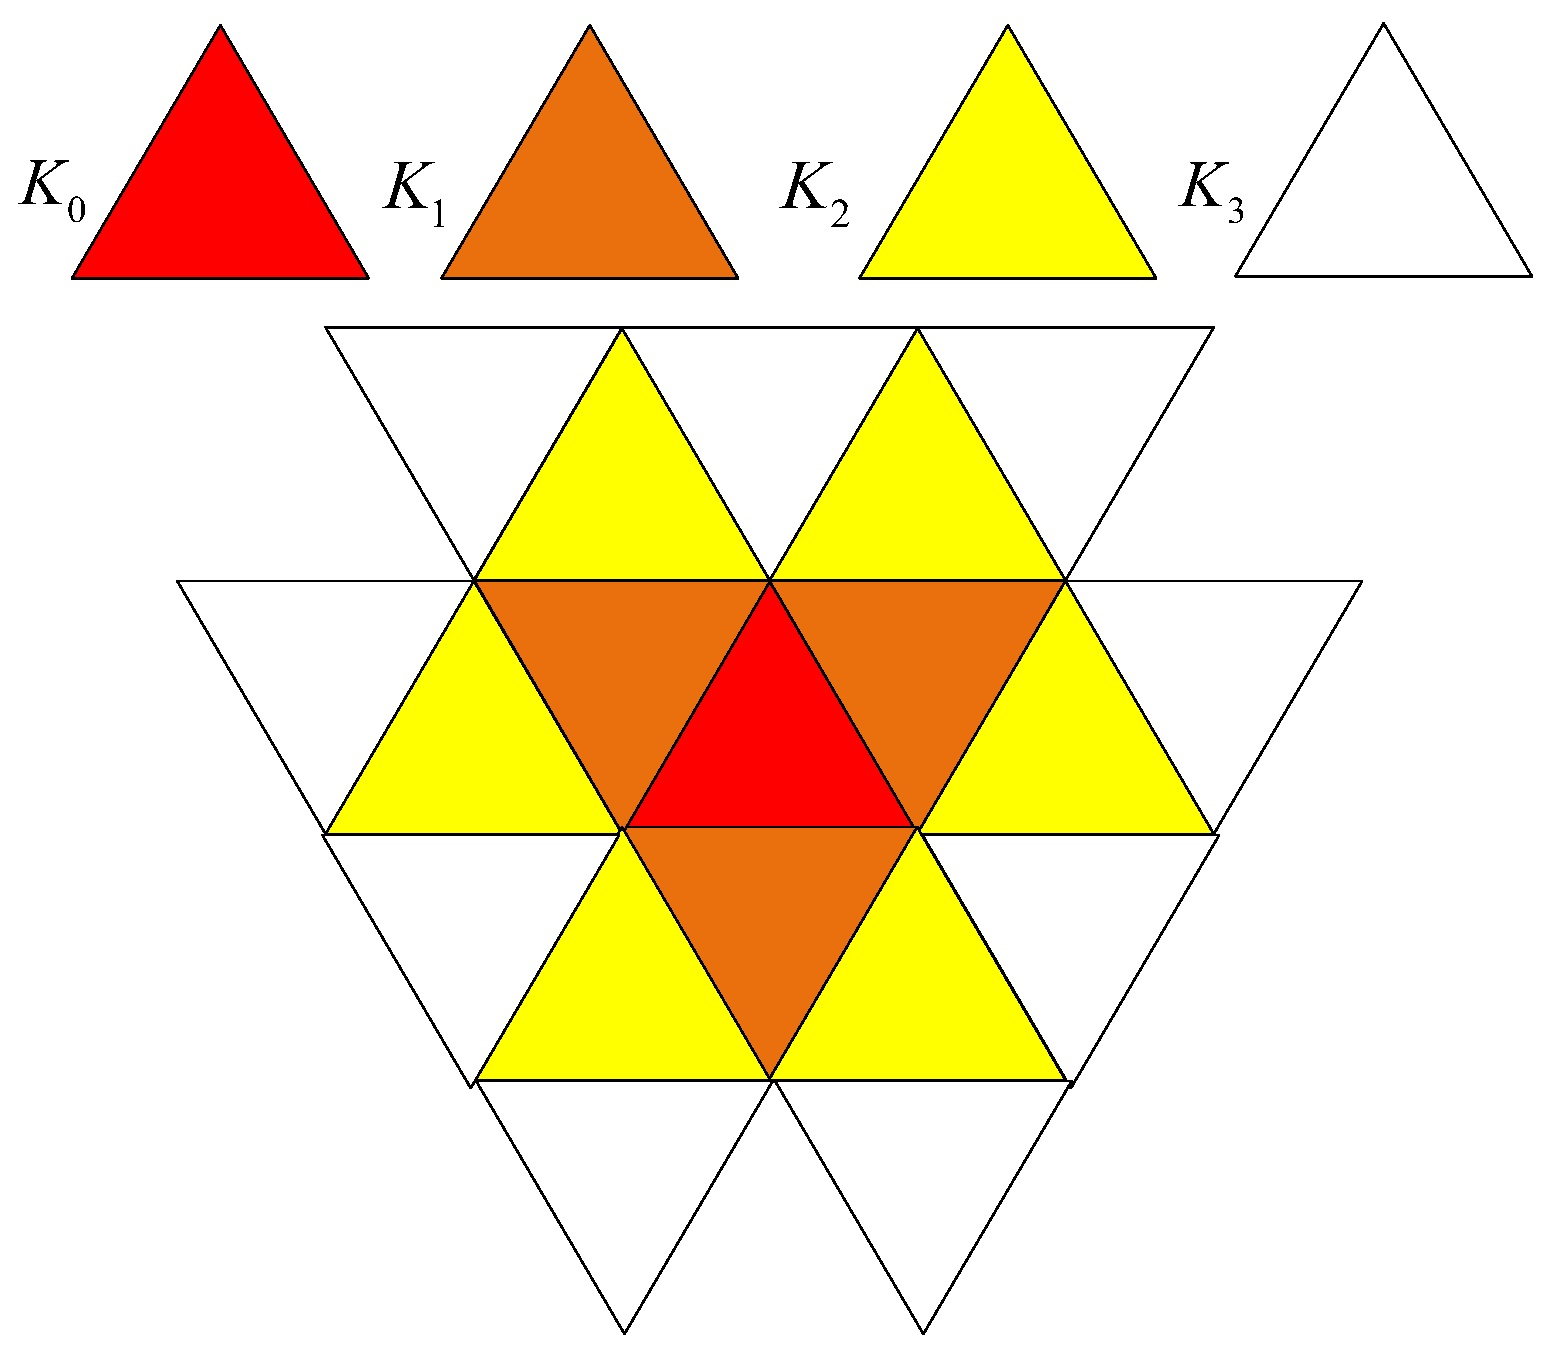
The 3D-OBMs in this paper are all presented in the form of triangular meshes, and there is an adjacency relationship between the triangular meshes, as shown in Figure 10. In Figure 10, K 0 represents any single triangular mesh of the 3D-OBM. Any triangular mesh that shares an edge with K 0 is defined as its 1-neighboring meshes, which are represented by K 1 . In this figure, the K 1 neighboring meshes are colored orange. The 2-neighboring meshes are defined as all the 1-neighboring meshes of K 1 except K 1 and itself, which is represented by K 2 and colored yellow. Likewise, the 3-neighboring meshes are defined as all the 1-neighboring meshes of their K 2 neighboring meshes except K 2 , K 1 and itself, which is defined as K 3 and colored as white triangle. Define k n i ( n = 1 , 2 , 3 ; i = 1 N n ) as a certain triangular mesh within the n -neighboring mesh set of K 0 , where N n represents the number of elements that K n contains. Define K n i ( n = 1 , 2 , 3 ; i = 1 N n ) as the 1-neighboring meshes of k n i and K 2 and K 3 can be calculated using Equations (1) and (2).
K 2 = i = 1 N 1 K 1 i K 1 K 0
K 3 = i = 1 N 2 K 2 i K 2 K 1 K 0
Figure 10. The adjacency relationship between the triangular meshes.
Define n n i as the normal vector of triangular mesh k n i and n 0 as the normal vector of triangular mesh K 0 . The pose difference between the triangular face K 0 and its adjacent faces can be represented by V a r n 0 , which can be calculated via Equation (3). It is worth noting that α ,   β and χ are hyperparameters that indicate the degree of dependence of the results on adjacent triangles regarding distance.
V a r n 0 = α 1 N 1 i = 1 N 1 n 1 i n 0 2 + β 1 N 2 p = 1 N 2 n 2 p n 0 2 + χ 1 N 3 q = 1 N 3 n 3 q n 0 2 ( 0 < χ < β < α < 1   a n d   α + β + χ = 1 )
Triangular Mesh Fitting Method based on SVD
In the next step, we need to find a plane parallel to the plane where the OBC is located. Suppose a function describing the plane can be represented as a x + b y + c z + d = 0 . Given a triangular mesh set S k , define s i k   ( k = 1 , 2 , N k ) as any single triangular mesh of S k , N k as the number of elements in S k . Define G i k ( x i k , y i k , z i k ) as the geometrical center of s i k , and the coordinate mean of G i k can be calculated by Equation (4).
G 0 k ( x ¯ 0 k , y ¯ 0 k , z ¯ 0 k ) = 1 N k ( i = 1 N k x i k , i = 1 N k y i k , i = 1 N k z i k )
Construct matrix A using Equation (5).
A = [ x 1 k x ¯ 0 k y 1 k y ¯ 0 k z 1 k z ¯ 0 k x 2 k x ¯ 0 k y 2 k y ¯ 0 k z 2 k z ¯ 0 k x 3 k x ¯ 0 k y 3 k y ¯ 0 k z 3 k z ¯ 0 k x N k k x ¯ 0 k y N k k y ¯ 0 k z N k k z ¯ 0 k ]
Then, perform SVD on matrix A via Equation (6), and the parameters of the fitting plane can be calculated by Equations (7) and (8).
A = S V D
( a , b , c ) = ( v n , 1 , v n , 2 , v n , 3 )
d = ( a x ¯ 0 k + b y ¯ 0 k + c z ¯ 0 k )
The algorithm can be seen in Algorithm 2.
Algorithm 2: The Scratch Extraction Algorithm based on Distance
Input: The hyperparameters  α , β , χ , v a r   L   i m and d ; The discriminate set of triangular meshes corresponding to each 3D-OBC S k ( k = 1 , 2 , , N s ) , where N s denote the total number of 3D-OBCs;
Output: The set  R k containing the triangular meshes of the 3D-OBC scratches;
1:
for  k 1  to  N s  do
2:
R k ;
3:
for each triangular mesh  s i  in set  S k  do
4:
   R ;
5:
  calculate  K 1 K 2  and  K 3 ;
6:
  calculate  V a r n n ;
7:
  if  V a r n n v a r   L   i m  then
8:
   add  s i  to  R ;
9:
   end
10:
  given  R , calculate plane  P  using  S V D method;
11:
  for each triangular mesh  s i  in set  S k  do
12:
   calculate the distance  d k  between  s i  and  P ;
13:
   if  d k d  then
14:
    add  s i  to  R k
15:
   end
16:
  end
17:
end
18:
end

4. Experiments and Analysis

As can be seen above, the overall procedure consists of three major steps. Firstly, a trained object detector marks the region where the OBCs are located. Secondly, the rectangle regions enclosing the single OBC are extracted from a whole 3D-OBM. Thirdly, the 3D-OBCs are extracted from the rectangle regions. Using these steps, as described in this section, three experiments were conducted in order to prove the feasibility of the method.

4.1. OBC Detection Experiment

In this experiment, we compared three different object detectors (YOLO v7, Faster R-CNN, SSD) to select the most suitable detector for the OBCs. In this experiment, 1723 images of the oracle bones that contain OBCs were used. All the images are from the 2D dataset mentioned above. We randomly selected 1300 images as the training set, and the remaining images (423 images) as the validation set. In this section, we describe the performance of each object detector, which is measured in average precision (AP) and mean average precision (mAP).
The software and hardware configurations of the experiment are shown in Table 1 and Table 2. Before these three models were trained, we loaded the pre-trained weights. During the training process, we went through the update process of the complete weights and no layer in the network was frozen. The Adamw optimizer, which employs a dynamic learning rate strategy, was used during the training process. Moreover, we did not use data augmentation strategy in this experiment. The main parameters can be seen in Table 3.
Table 1. Software configuration.
Table 2. Hardware configuration.
Table 3. Main training parameters.
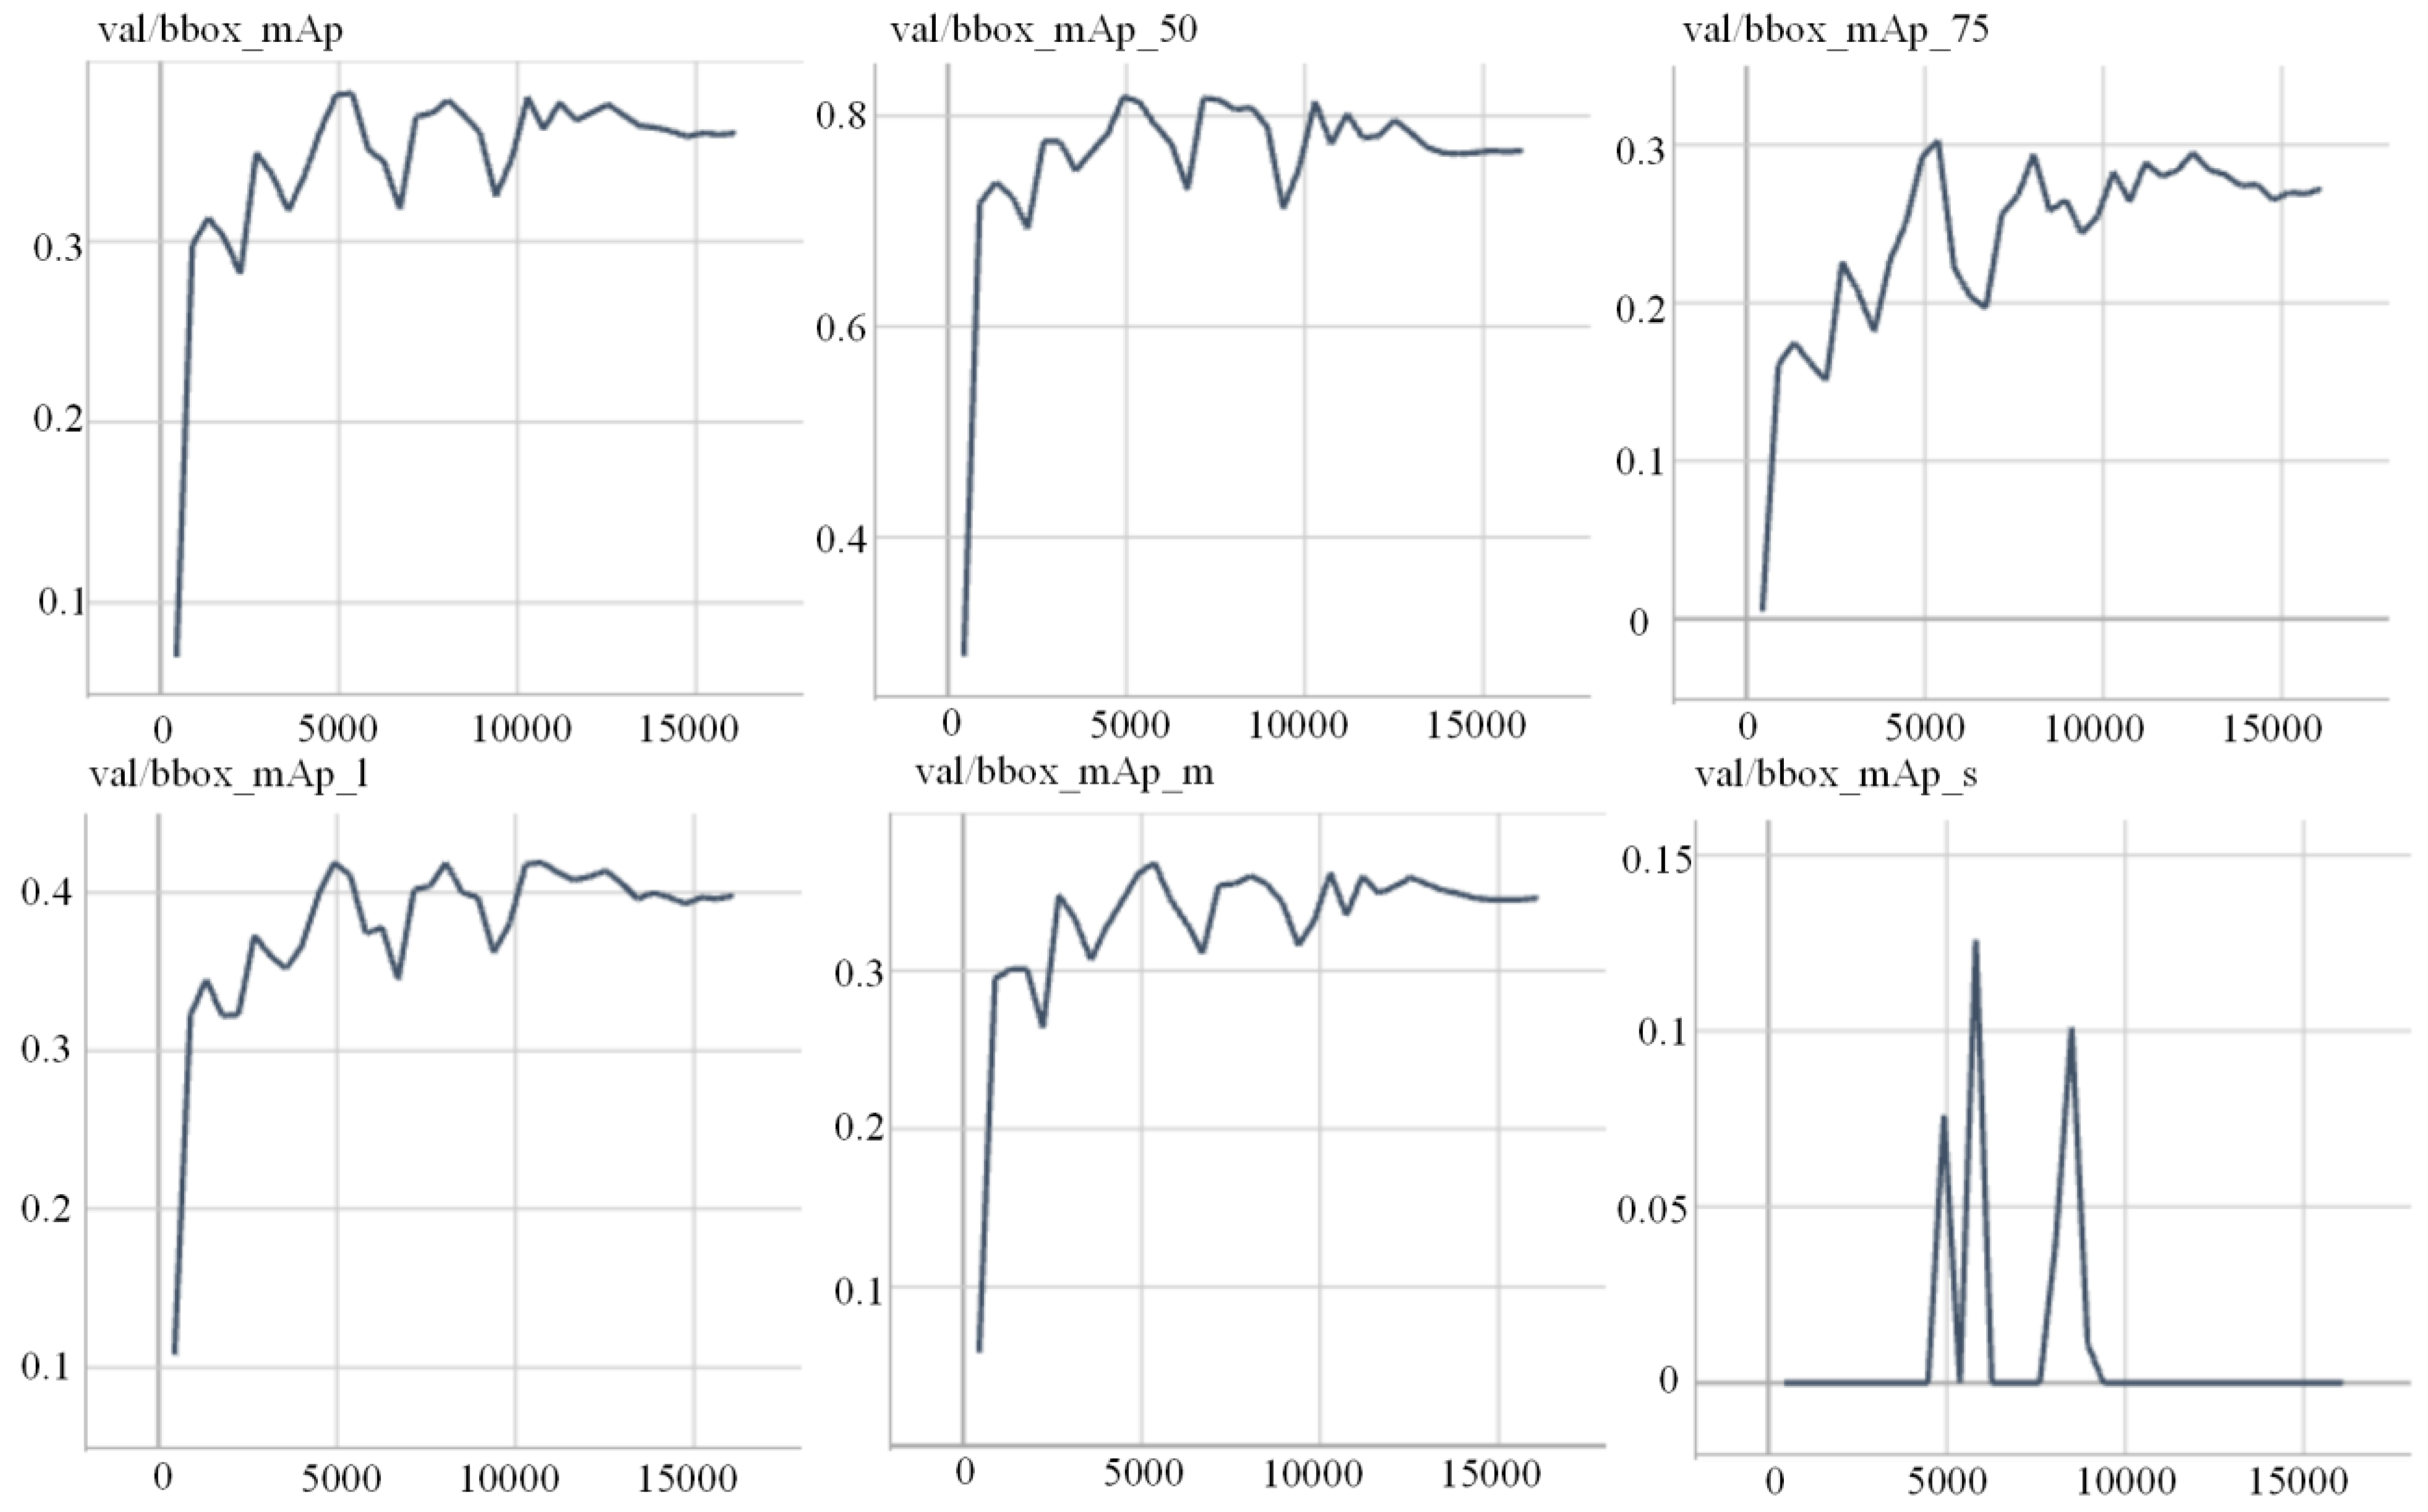
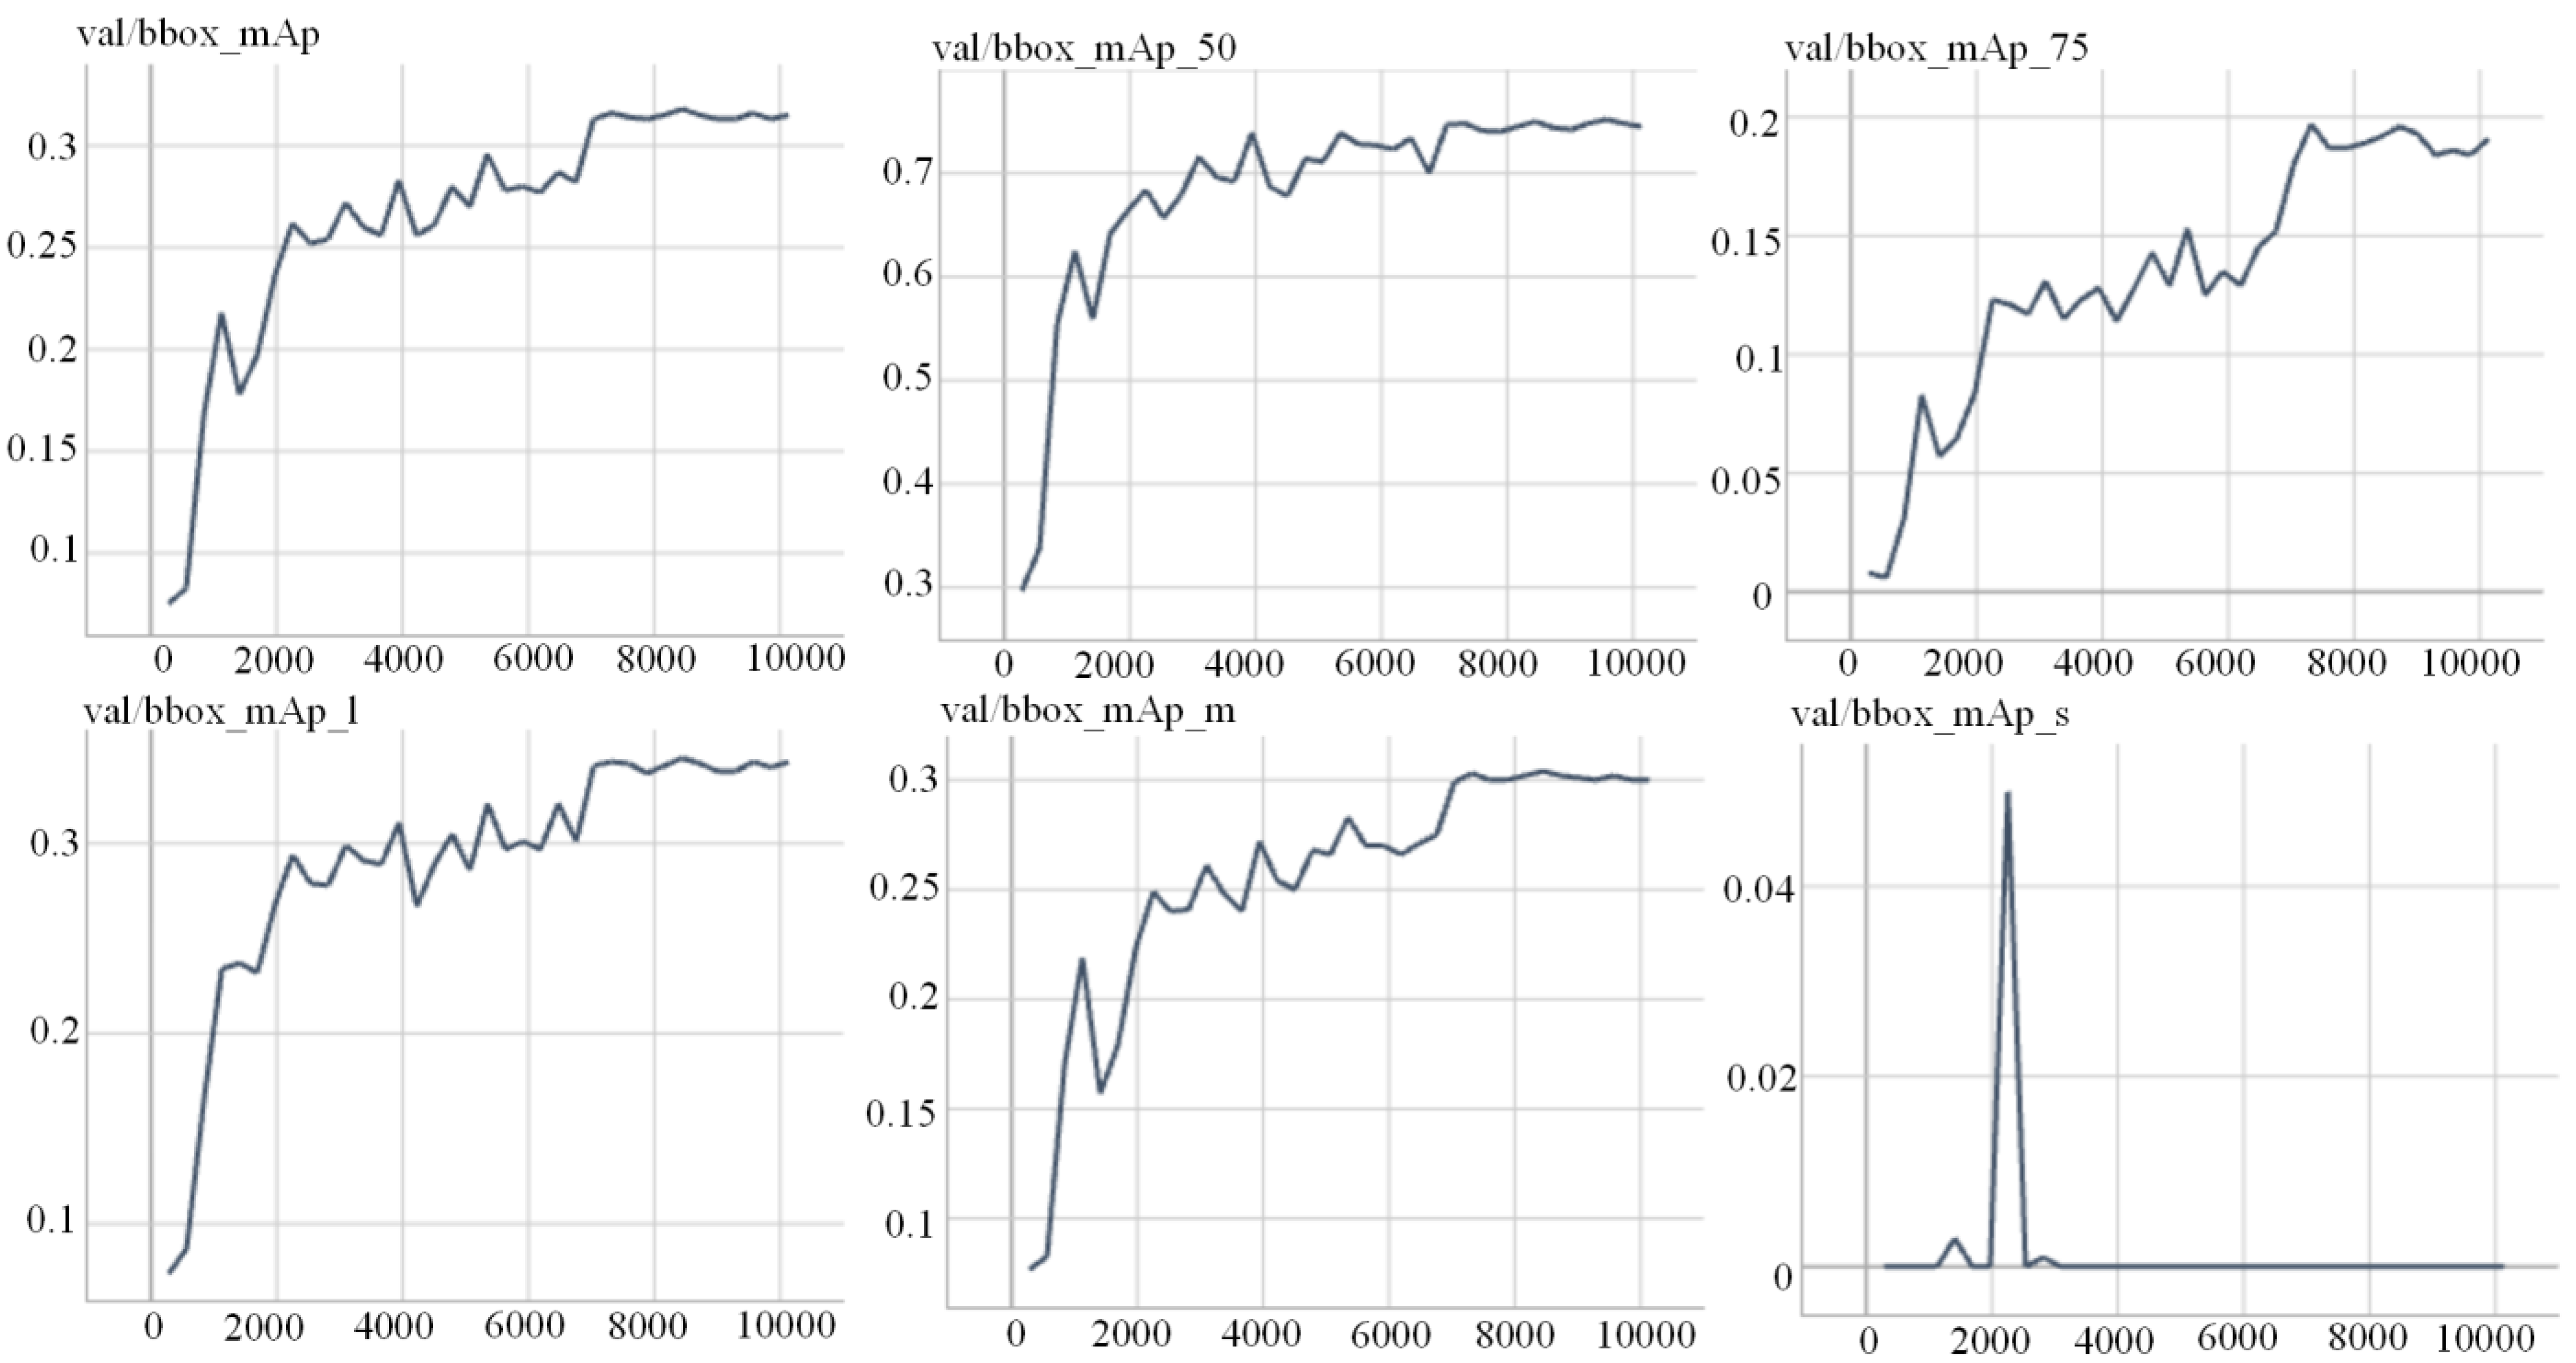
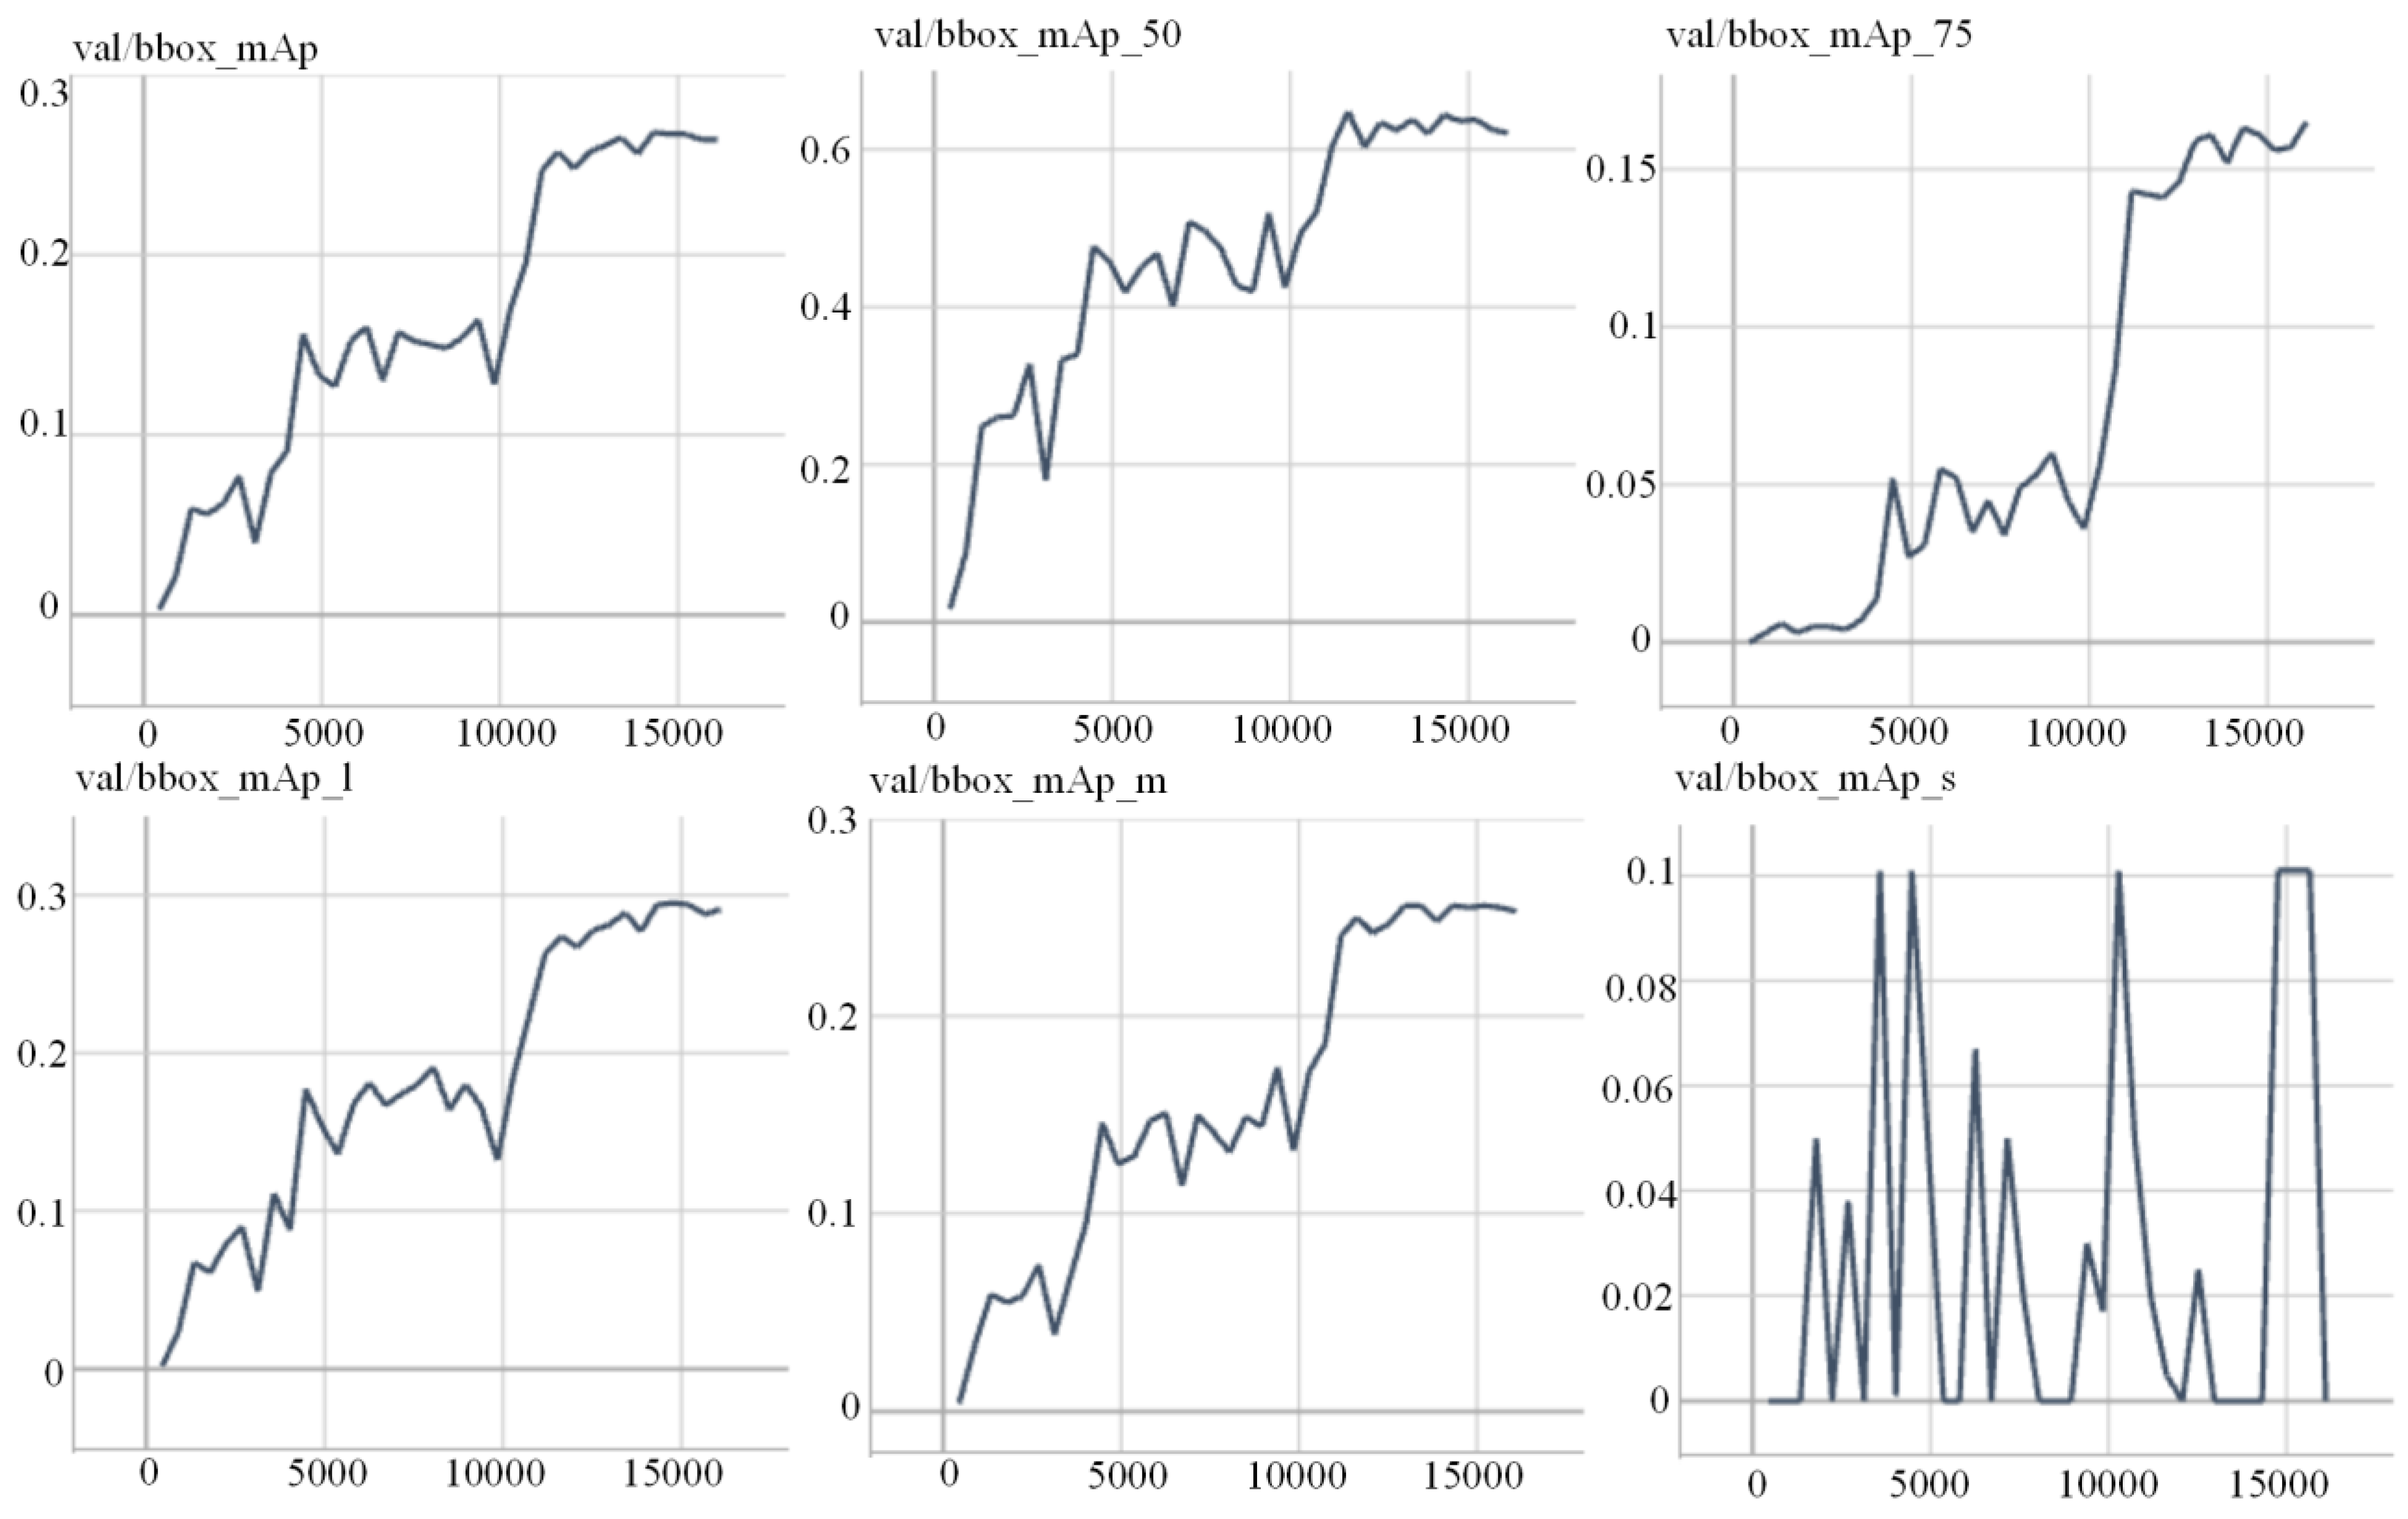
In Figure 11, Figure 12 and Figure 13, the horizontal axis represents the number of steps. Each batch processing during the training process is equivalent to executing one step. When the performance indicator (mAp) stabilized, the training process ceased. Note that the number of steps in the three experiments was not completely consistent, and SSD training has the least number of steps. According to the indexes, all of the three object detectors are eligible for coordinating the OBCs in the texture image. Additionally, Faster R-CNN performs better than the other detectors.
Figure 11. The main performance of Faster R-CNN.
Figure 12. The main performance of SSD.
Figure 13. The main performance of YOLO v7.

4.2. Inverse Mapping Experiment

This experiment aimed to verify Algorithm 1, inverse mapping algorithm. In this experiment, we used the best performing Faster R-CNN detector to obtain each coordination of OBC within the texture image and slice the 3D-OBMs into triangular meshes. Simultaneously, we manually extracted the rectangular area where the OBCs were located in the 3D-OBM, forming a ground-truth sample. The number of ground-truth samples is 298. All of the 50 3D-OBMs involved in this experiment are from the previously mentioned 3D dataset. Then, we compared these samples using the IoU (Intersection over Union) index, namely the number of the triangular tablets from the intersection of the samples (the ground truth and that obtained using Algorithm 1) divided by the number of the triangular tablets from the union of the samples.
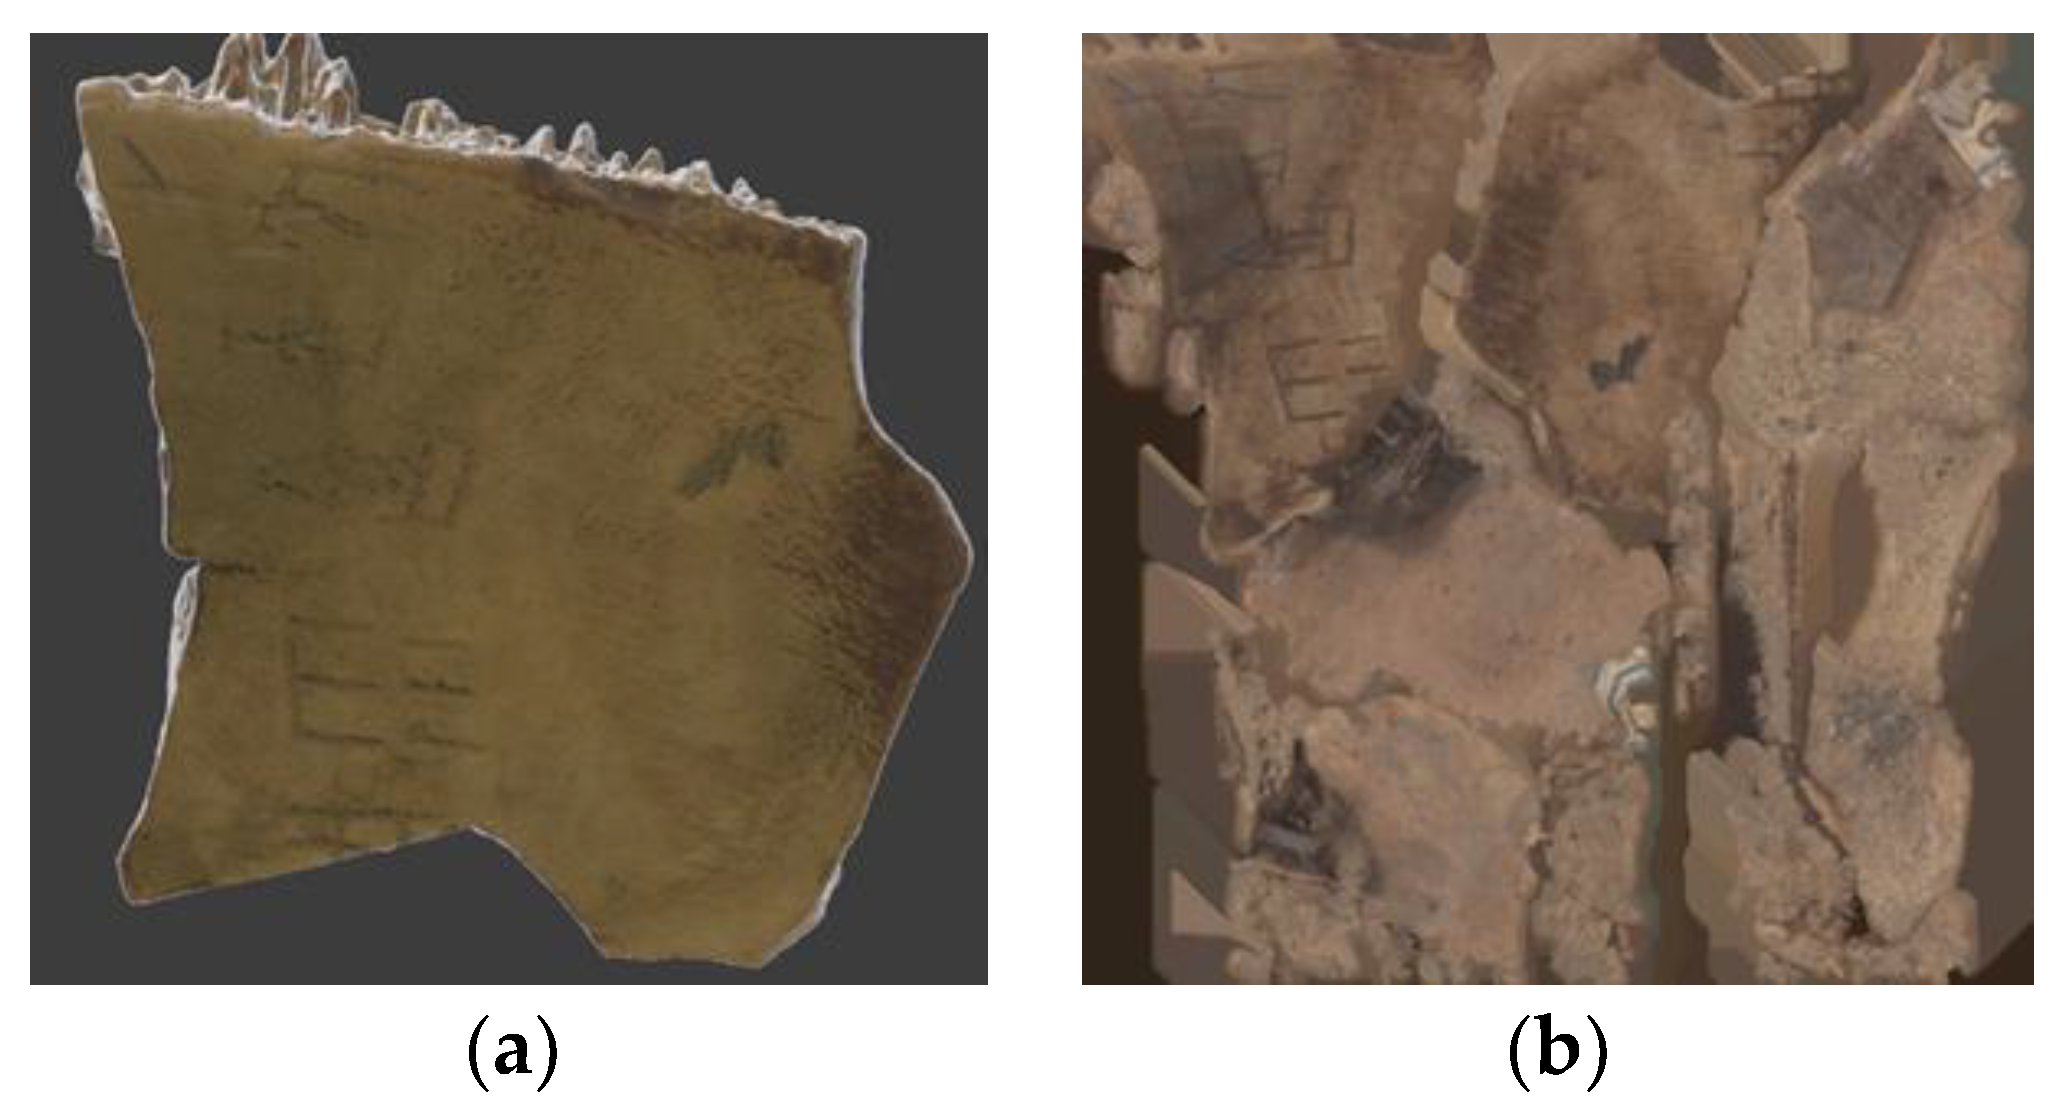
The angle of the 3D-OBM can be seen in Figure 14a, and the whole texture can be seen in Figure 14b. In this experiment, the object detector is directly used in the texture file to find the coordinate information of a single OBC in the form of a bounding box; an example can be seen in Figure 15. In Figure 15, each of the red rectangle boxes corresponds to an OBC.
Figure 14. An example of the 3D-OBM and its texture file. (a) Complete model; (b) texture file.
Figure 15. An example of the OBC detecting effect.
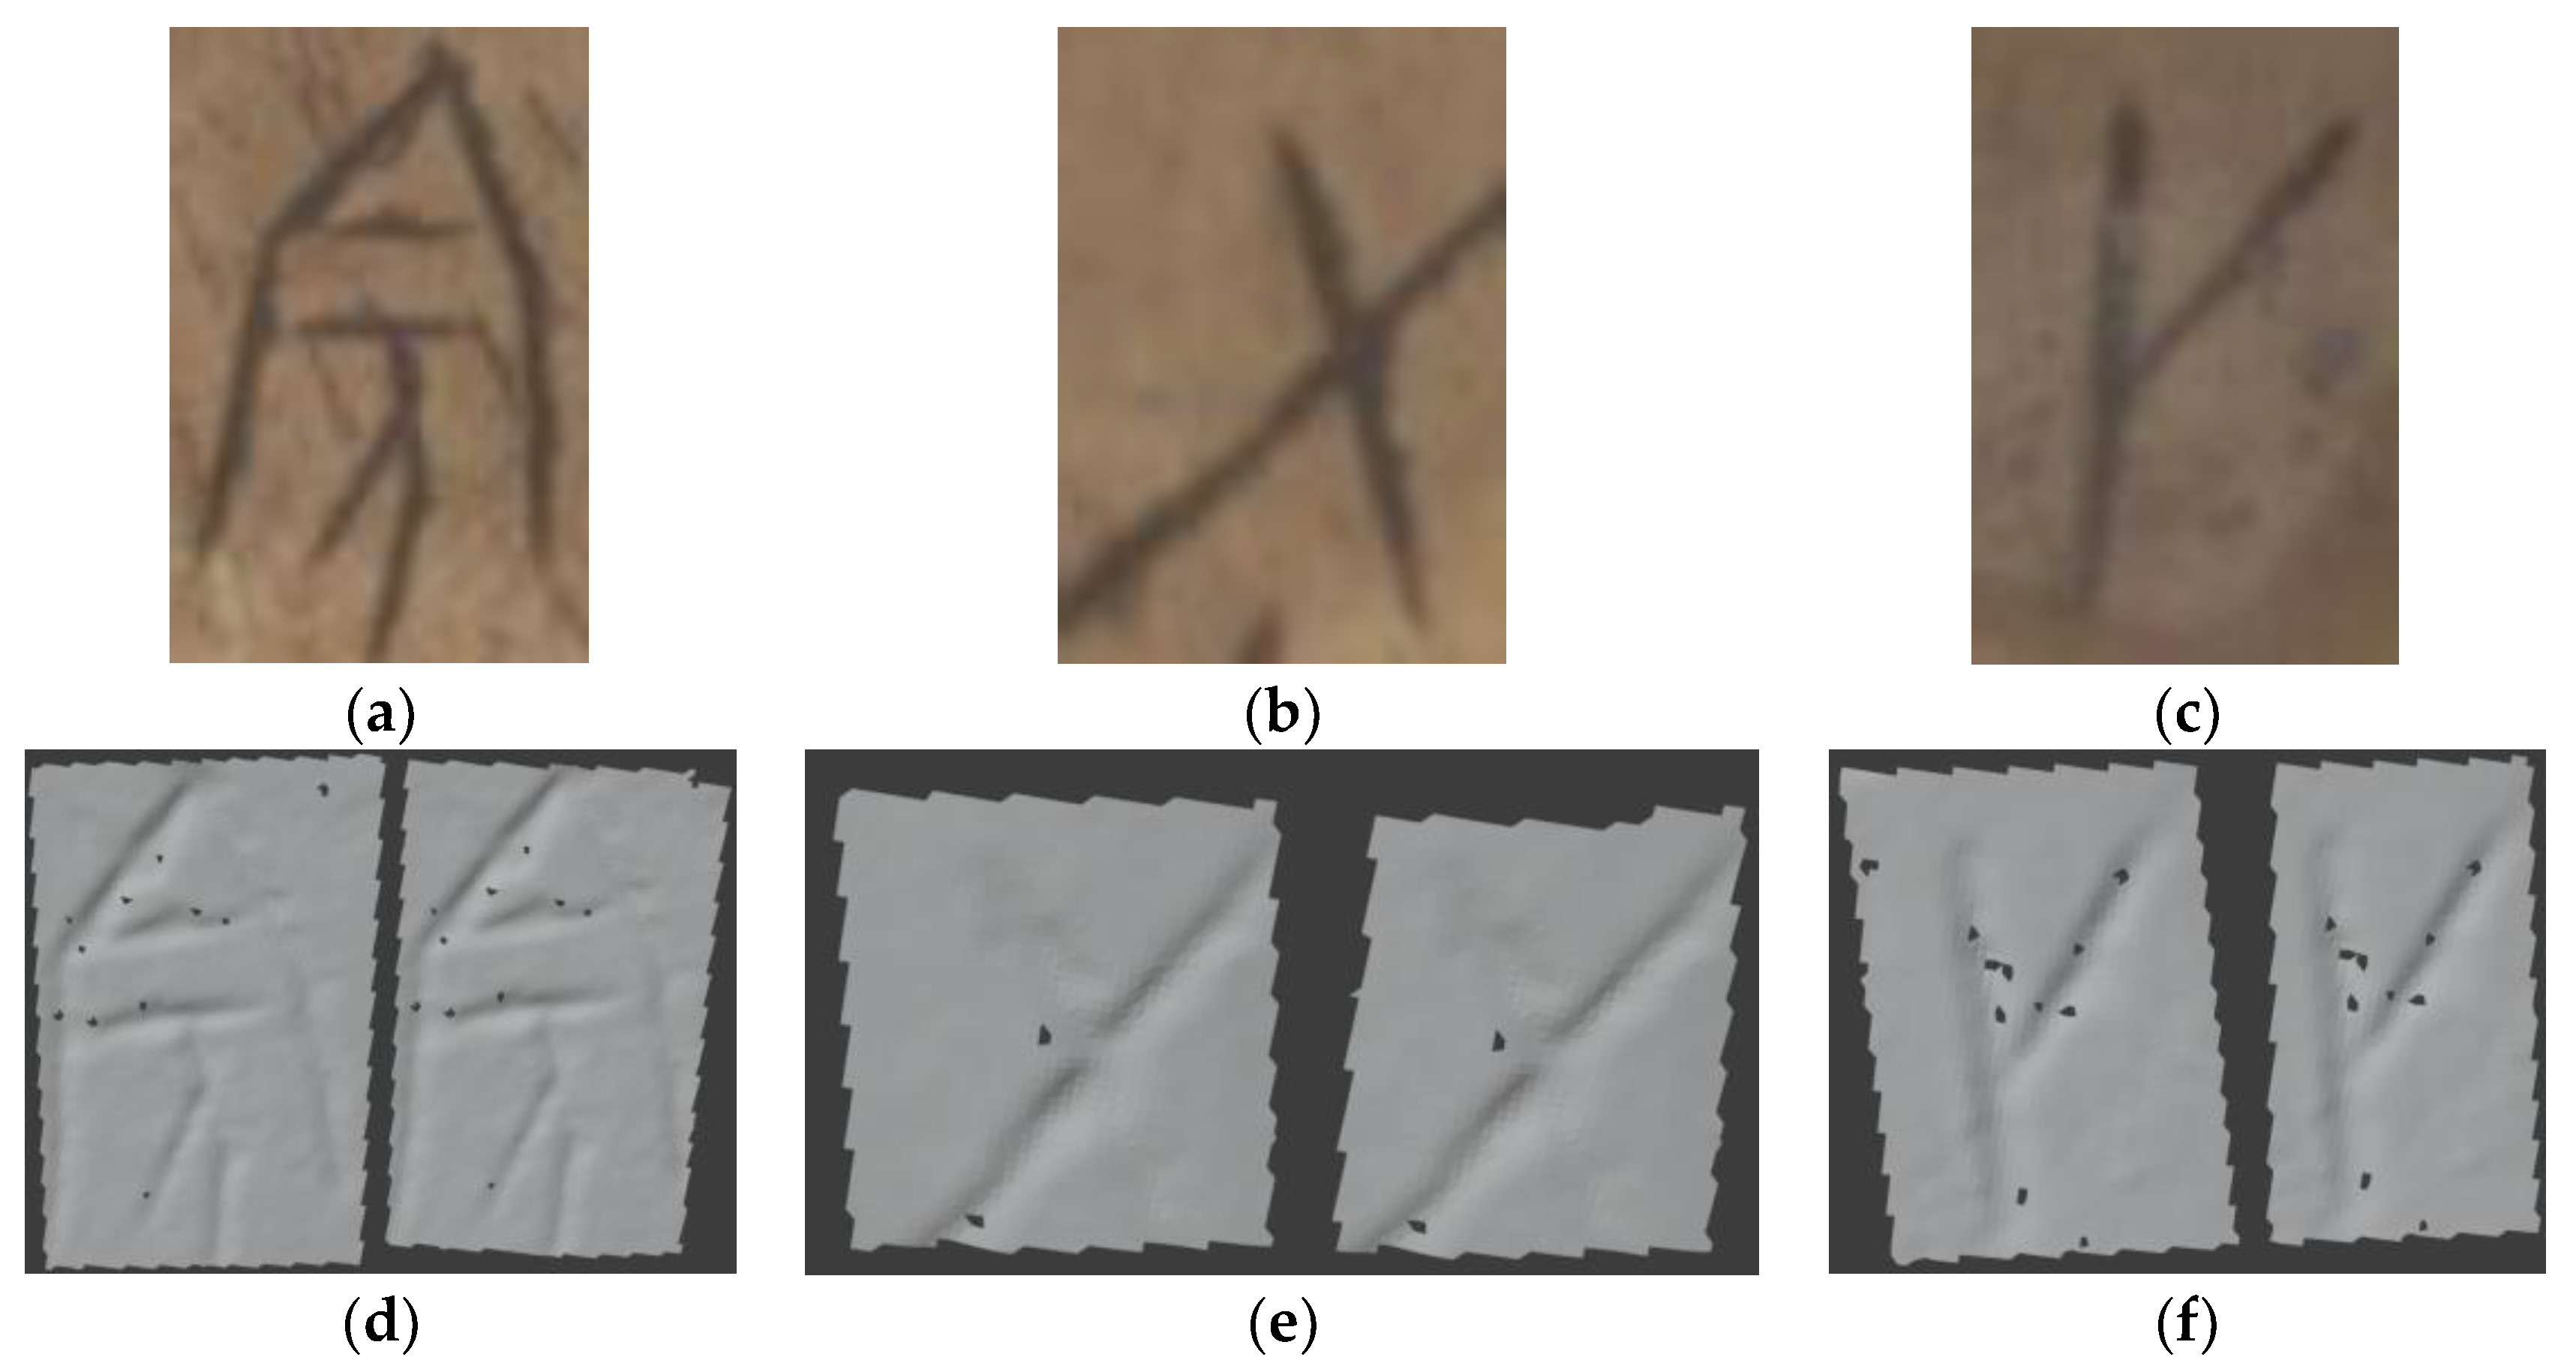
Figure 16 shows an example of processed 3D-OBCs. Figure 16a–c show an example of the OBC from the texture file, Figure 16d–f are their corresponding ground truths and OBCs obtained using Algorithm 1. The left side of Figure 16d–f are ground truths, and the right side are OBCs obtained using Algorithm 1.
Figure 16. An example of processed 3D-OBCs, (ac) present three OBCs which are extracted from texture images, (df) present corresponding ground truths and OBCs obtained using our methods.
Regarding the performance index IoU, the values range from 0.75 to 0.99, with the mean value being 0.89. From the actual effect, this algorithm can also meet usage needs.

4.3. Scratch Extraction Experiment

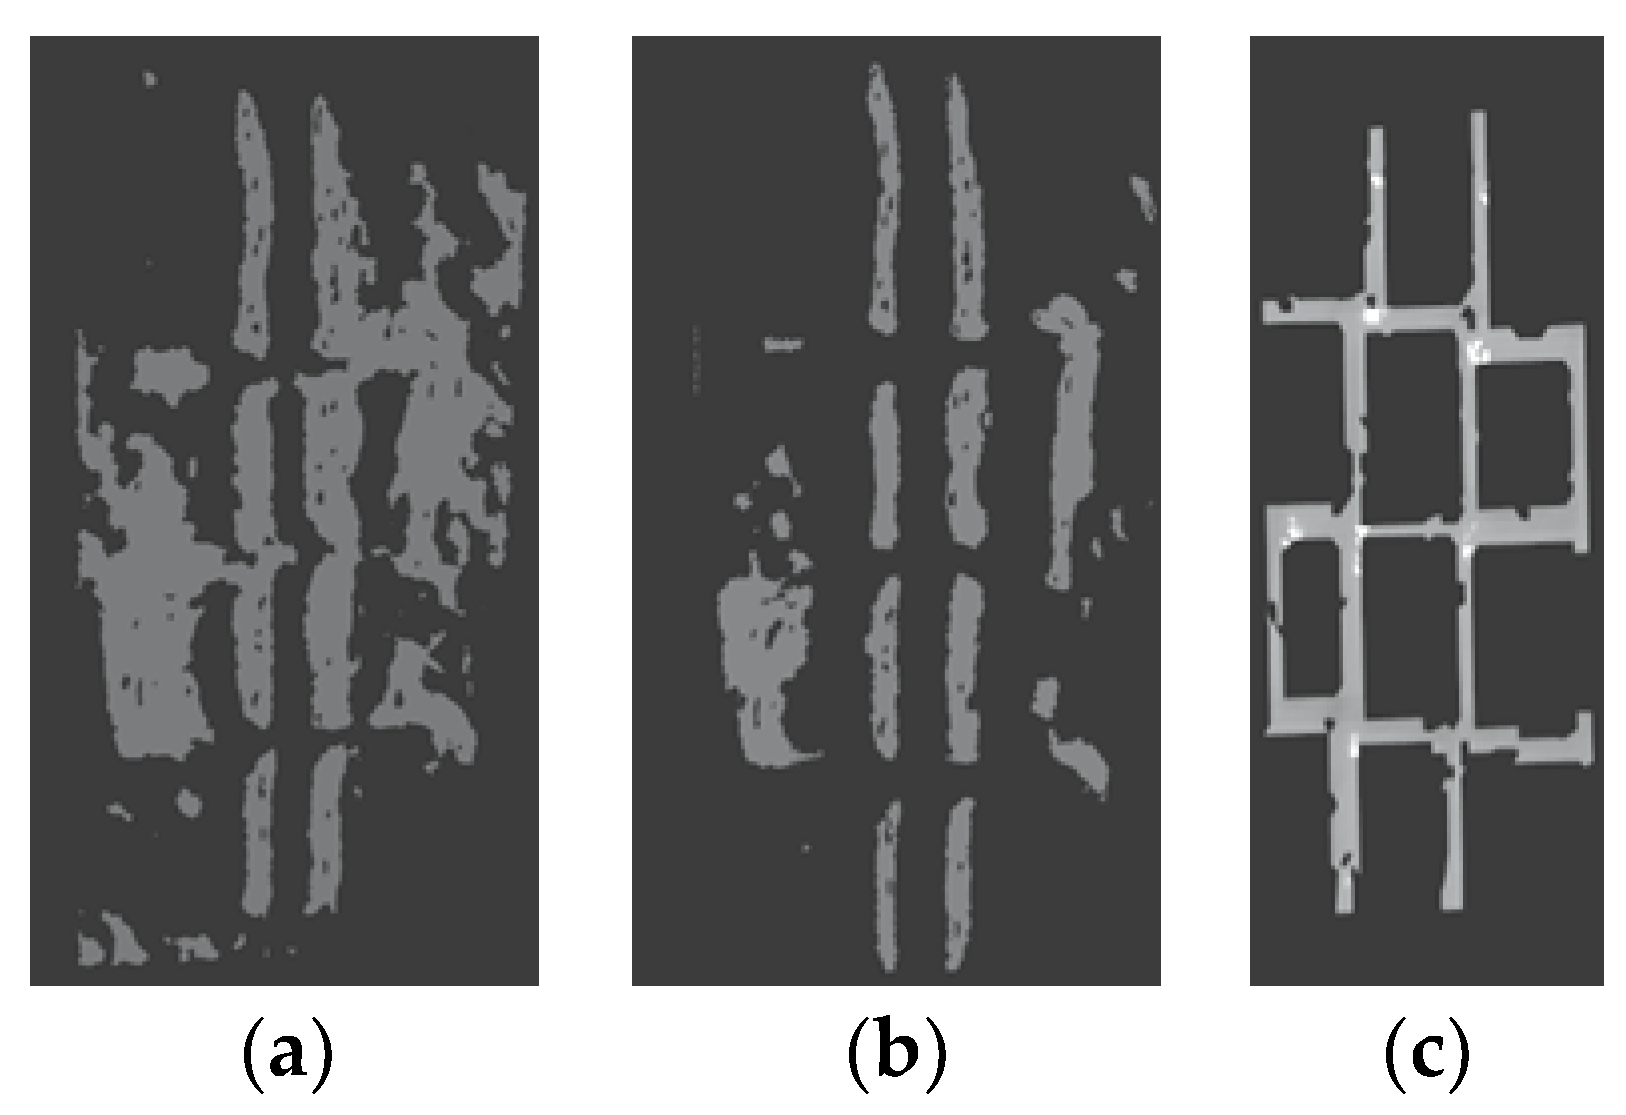
In the previous experiment, we were able to obtain a single 3D-OBC with a rectangle plane. However, this model may not be sufficient for our research. We need to extract the OBC scratch from the plane using Algorithm 2. In this experiment, by using the ground-truth samples in the inverse mapping experiment, we manually extracted the scratches from the 3D-OBC planes to form a ground-truth sample and compared this sample with those obtained using Algorithm 2. The number of ground-truth samples is 298. In this experiment, distance played a vital role. Figure 16 shows the impact of different values on the extraction results.
In Figure 17a, the value of d is too large, resulting in the preservation of the triangular surfaces beyond the OBC scratch. On the contrary, in Figure 17b, the value of d is too small, resulting in the absence of triangular surfaces within the OBC scratch. Moreover, the value of d is suitable in Figure 17c. Generally speaking, the value of d is a hyperparameter that should be adjusted during the experiment; the values may vary from 3.0 to 3.1. The process of solving the optimal value of d requires repeated iteration and refinement. For the same batch of unearthed oracle bones, once we find the optimal value for a certain OBC, this value is also applicable to the extraction process of all other OBCs. As shown in Figure 18a–c, ground-truth scratches were situated on the left side and the corresponding obtained scratches were situated on the right side, according to Algorithm 2. In this experiment, we still used the IoU index to measure the performance just as in experiment 4.2. The value of IoU in this experiment ranges from 0.51 to 0.95, with the mean value being 0.78.
Figure 17. The obtained scratches with different values: (a) d = 3.01, (b) d = 3.03, (c) d = 3.02.
Figure 18. Examples of obtained scratches, in (ac), ground-truth scratches are in the left and obtained scratches are in the right.

5. Discussion

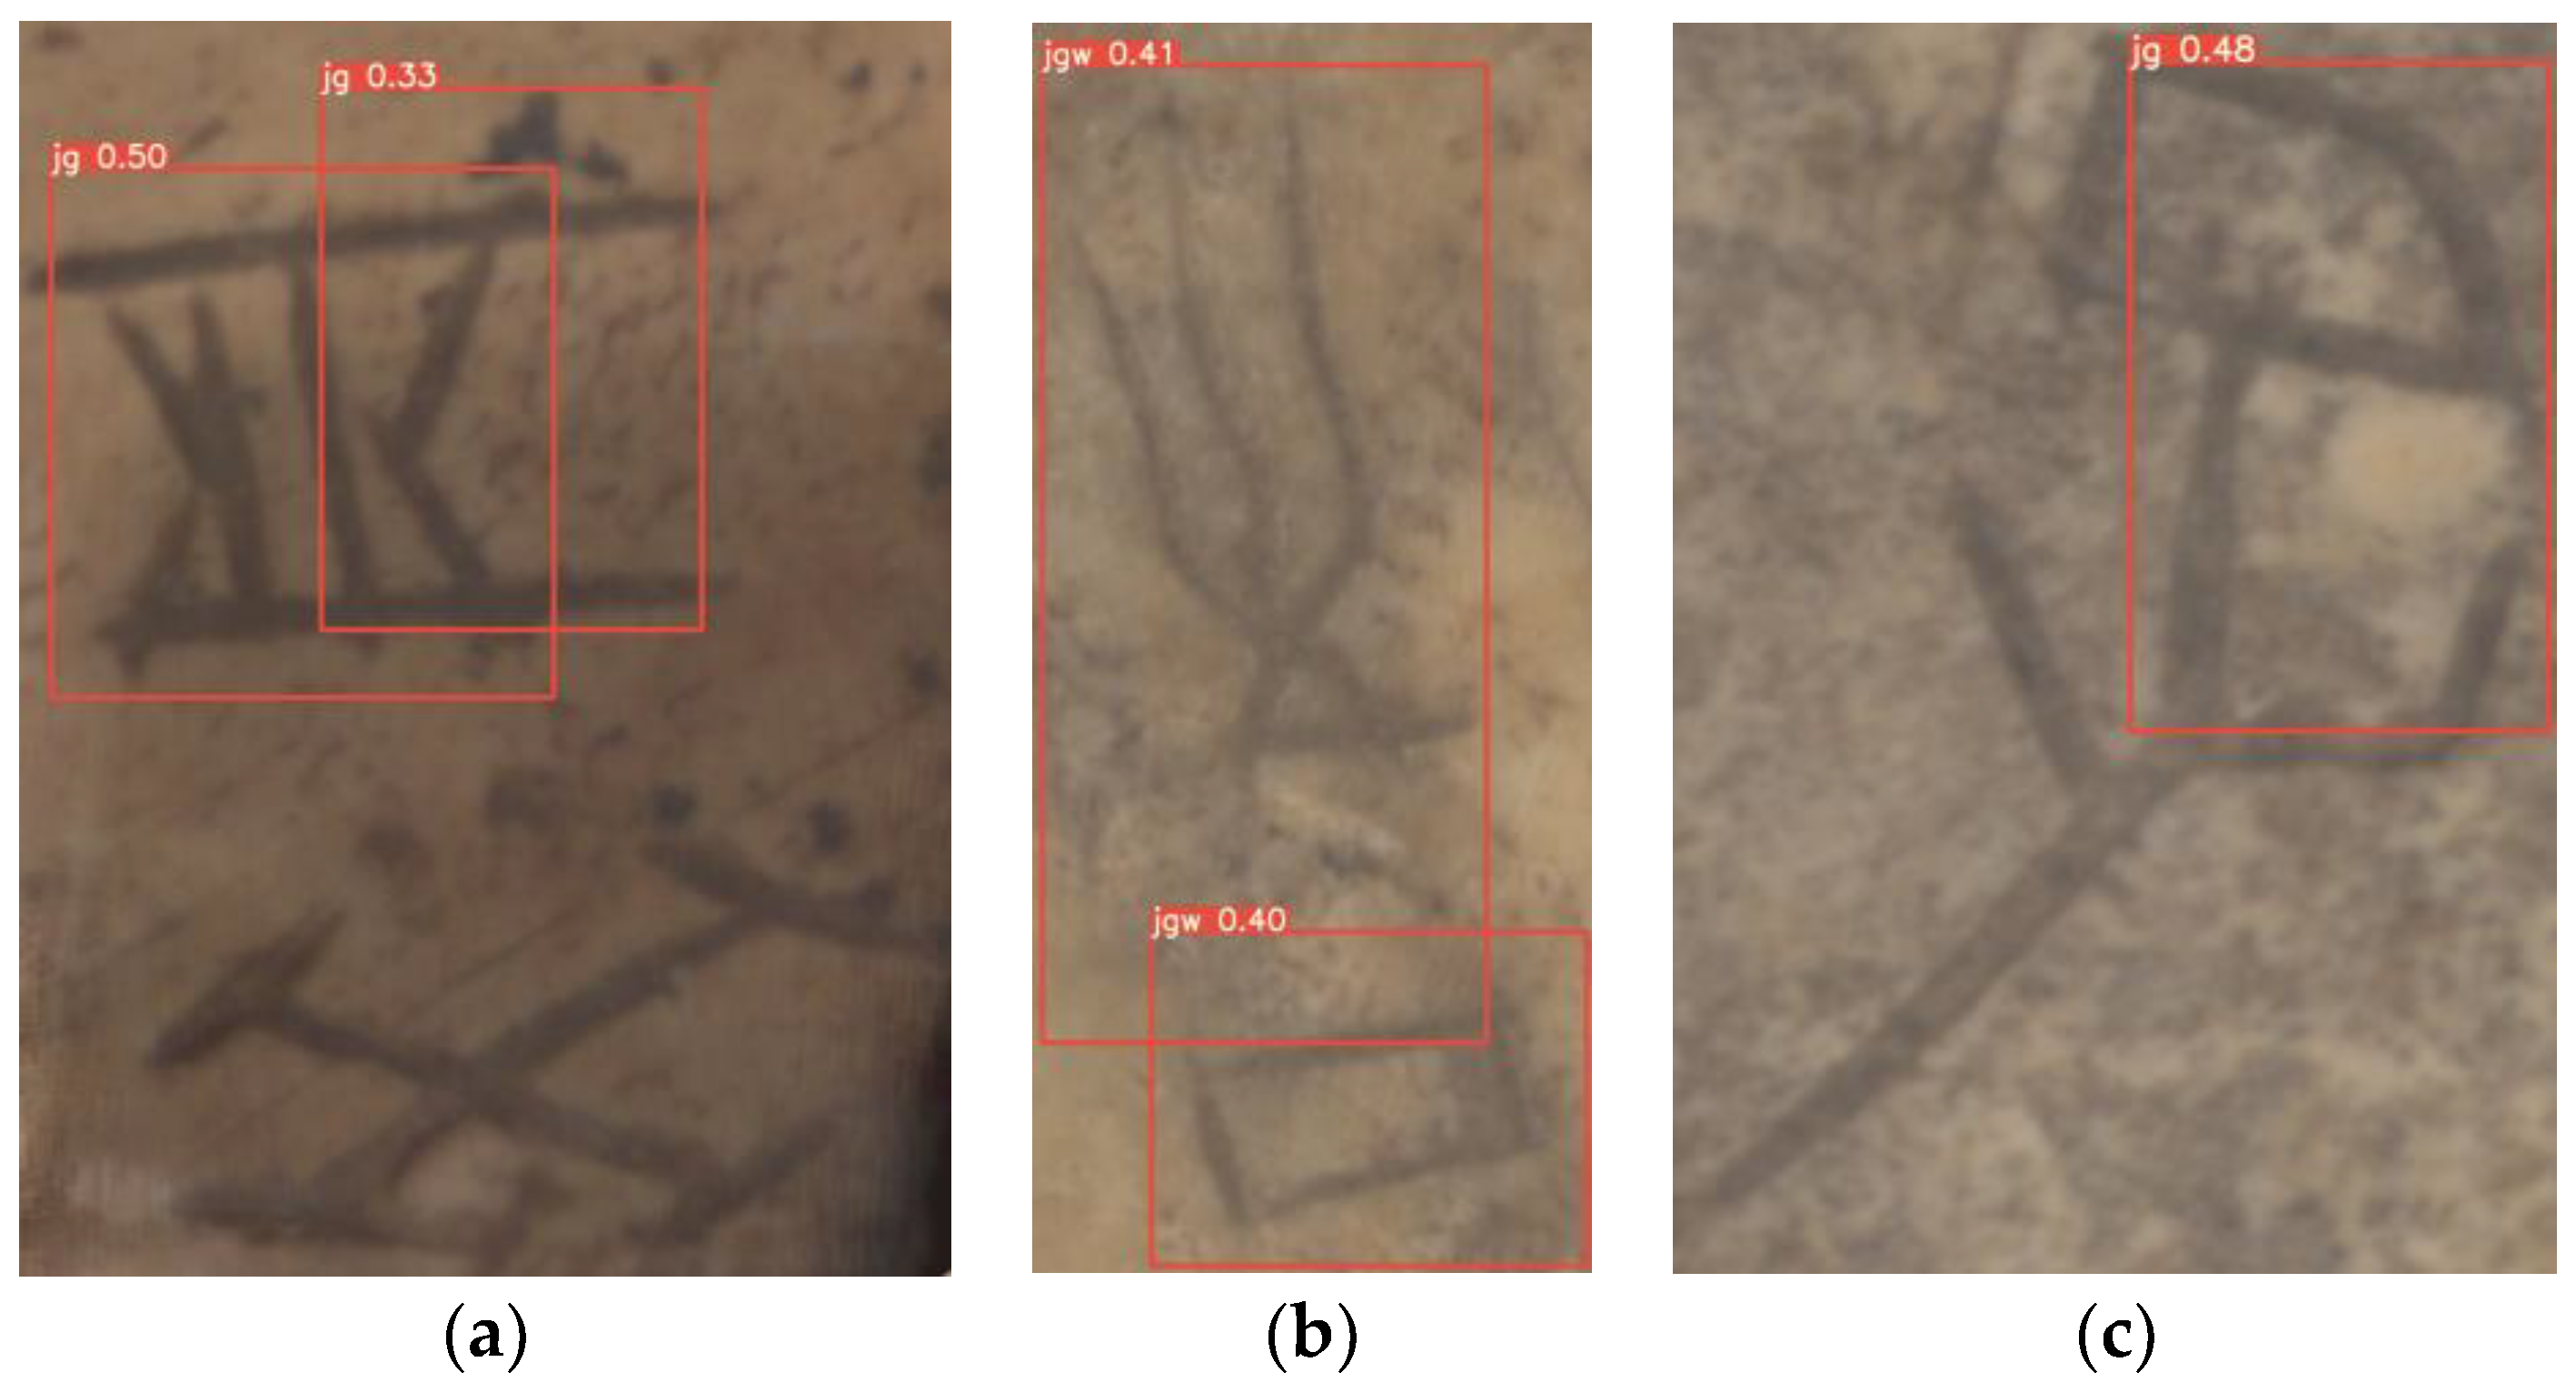
On the basis of experimental analysis, assuming that we already have high-precision 3D-OBMs, the key factors determining the final scratch extraction effect include the performance of the 2D object detector, the geometric shape of the oracle bone tablets and the density of the 3D-OBCs. Figure 19 provides some examples in which the object detectors failed to function properly, thus resulting in scratch extraction failure in the following process.
Figure 19. Example of the poor performance OBC detection, (a) detection omission and multiple bounding boxes within a single OBC, (b) bounding box overlap, (c) partial detection.
In the upper half of Figure 19a, the 2D object detectors are annotated in two bounding boxes within one OBC. This phenomenon is related to the IoU training parameters of a specific object detector. Regarding certain object detectors, a suitable parameter will eventually be found after numerous experiments, eliminating this phenomenon. In the lower part of Figure 19a, the object detector just misses the OBC. This situation is usually caused by insufficient training samples for the object detector, and increasing the numbers of training samples and training epochs is helpful for solving this problem. In Figure 19b, the boxes of the adjacent OBCs overlap, and this means that the scratch extraction failed in the process that followed. Since this phenomenon is caused by the overly dense inscribing style of some OBCs, we are unable to eliminate this phenomenon by improving the algorithms. In Figure 19c, only part of the OBC is detected and bound with a box. This phenomenon is related to image and OBC size, occurring when the OBC size significantly differs from that in the training dataset, and can be improved during training process with data augmentation method.
However, in the experiment, we found some samples that were not suitable for scratch extraction. Since our method assumes that the OBCs exist in a flat or approximately flat plane (this assumption is reasonable since the OBCs are small in size), when the plane containing OBCs clearly appears uneven, our method cannot be effective. Figure 20 provides an example of a narrow and curved 3D-OBM, and we were unable to extract any OBC scratch within this model. Fortunately, most of the oracle bone tablets appear flat.
Figure 20. The example of an 3D-OBM that defies scratch extraction.
The tm-OBIE method has the advantage that the rotation of the 3D model does not affect the results. Since the core idea of the algorithm is to segment the rectangular area containing OBC via an inverse mapping method. The texture file is created upon the construction of 3D-OBM and will not change with the rotation of the model itself. In addition to retrieving the OBCs, our method also inspires the extraction of other engraved characters. Engraved characteristics such as inscriptions on gold in ancient China and steel often have a large number of photos as research materials. When experts try to perform a character extraction on 3D models of such materials containing these characters, they may refer to our method.

6. Conclusions

The paper proposes an algorithm framework for extracting scratches from 3D-OBMs. The experiment focuses on analyzing the applicability of the algorithm and verifying its feasibility. At the same time, the algorithm framework also provides inspiration for the extraction of other ancient characters, such as the ancient Chinese inscriptions on gold. Regarding the shortcomings of the algorithm framework, our team focused on solving the extraction of densely inscribed OBCs and OBCs inscribed on non-planar plane, in order to contribute to the research directions in oracle sciences, such as interpretation and oracle bone conjugation.

Author Contributions

A.G.: Project administration, conceptualization, methodology, writing—original draft preparation; Z.Z.: formal analysis, writing—review and editing, validation; F.G.: oracle bone science suggestion; H.D.: deep learning algorithm suggestion; X.L. dataset construction; B.L. investigation. All authors have read and agreed to the published version of the manuscript.

Funding

This work was supported by the Key Research and Development and Promotion of Special (Science and Technology) Project of Henan Province (grant Numbers 222102320189, 232102321067, 222102210257, 232102210021 and 232102320169), the Natural Science Foundation of China (grant Number 62106007), the Ancient Characters and Chinese Civilization Inheritance and Development Projects (grant Numbers G1806, G1807, G2821 and G3028) and the sub project of Major Projects of the National Social Science Foundation of China (grant Number 20&ZD305).

Data Availability Statement

Not applicable.

Conflicts of Interest

The authors declare no conflict of interest.

References

  1. Sun, Y. Manifold and splendid: 120 Years of research on the oracle bone inscriptions and Shang history. Chin. Stud. Hist. 2020, 53, 351–368. [Google Scholar]
  2. Gao, F.; Zhang, J.; Liu, Y.; Han, Y. Image Translation for Oracle Bone Character Interpretation. Symmetry 2022, 14, 743. [Google Scholar] [CrossRef]
  3. Zhang, Z.; Guo, A.; Li, B. Internal Similarity Network for Rejoining Oracle Bone Fragment Images. Symmetry 2022, 14, 1464. [Google Scholar] [CrossRef]
  4. Meng, L.; Lyu, B.; Zhang, Z.; Aravinda, C.; Kamitoku, N.; Yamazaki, K. Oracle bone inscription detector based on SSD. In Proceedings of the New Trends in Image Analysis and Processing–ICIAP 2019: ICIAP International Workshops, BioFor, PatReCH, e-BADLE, DeepRetail, and Industrial Session, Trento, Italy, 9–10 September 2019; Revised Selected Papers 20. pp. 126–136. [Google Scholar]
  5. Girshick, R. Fast R-CNN. In Proceedings of the IEEE International Conference on Computer Vision, Santiago, Chile, 7–13 December 2015; pp. 1440–1448. [Google Scholar]
  6. Ren, S.; He, K.; Girshick, R.; Sun, J. Faster R-CNN: Towards Real-Time Object Detection with Region Proposal Networks. IEEE Trans. Pattern Anal. Mach. Intell. 2017, 39, 1137–1149. [Google Scholar] [CrossRef] [PubMed]
  7. He, K.; Gkioxari, G.; Dollár, P.; Girshick, R. Mask R-CNN. IEEE Trans. Pattern Anal. Mach. Intell. 2017, 42, 386–397. [Google Scholar] [CrossRef] [PubMed]
  8. Liu, W.; Anguelov, D.; Erhan, D.; Szegedy, C.; Reed, S.; Fu, C.-Y.; Berg, A.C. SSD: Single shot multibox detector. In Proceedings of the Computer Vision–ECCV 2016: 14th European Conference, Amsterdam, The Netherlands, 11–14 October 2016; Proceedings, Part I 14. pp. 21–37. [Google Scholar]
  9. Redmon, J.; Divvala, S.; Girshick, R.; Farhadi, A. You Only Look Once: Unified, Real-Time Object Detection. In Proceedings of the Computer Vision & Pattern Recognition, Las Vegas, NV, USA, 27–30 June 2016. [Google Scholar]
  10. Li, Z.; Mahapatra, D.; Tielbeek, J.A.; Stoker, J.; van Vliet, L.J.; Vos, F.M. Image registration based on autocorrelation of local structure. IEEE Trans. Med. Imaging 2015, 35, 63–75. [Google Scholar] [CrossRef] [PubMed]
  11. Zhou, F.; De la Torre, F. Factorized Graph Matching. IEEE Trans. Pattern Anal. Mach. Intell. 2016, 38, 1774–1789. [Google Scholar] [CrossRef] [PubMed]
  12. Kumar, G.; Bhatia, P.K. A detailed review of feature extraction in image processing systems. In Proceedings of the 2014 Fourth International Conference on Advanced Computing & Communication Technologies, Rohtak, India, 8–9 February 2014; pp. 5–12. [Google Scholar]
  13. Sun, R.; Lei, T.; Chen, Q.; Wang, Z.; Du, X.; Zhao, W.; Nandi, A.K. Survey of image edge detection. Front. Signal Process. 2022, 2, 826967. [Google Scholar] [CrossRef]
  14. Choy, C.B.; Gwak, J.; Savarese, S.; Chandraker, M. Universal correspondence network. In Proceedings of the Advances in Neural Information Processing Systems 29 (NIPS 2016), Barcelona, Spain, 5–10 December 2016. [Google Scholar]
  15. Rocco, I.; Cimpoi, M.; Arandjelović, R.; Torii, A.; Pajdla, T.; Sivic, J. Neighbourhood consensus networks. In Proceedings of the Advances in Neural Information Processing Systems 31 (NeurIPS 2018), Montreal, QC, Canada, 3–8 December 2018. [Google Scholar]
  16. Au, O.K.-C.; Zheng, Y.; Chen, M.; Xu, P.; Tai, C.-L. Mesh segmentation with concavity-aware fields. IEEE Trans. Vis. Comput. Graph. 2011, 18, 1125–1134. [Google Scholar]
  17. Golovinskiy, A.; Funkhouser, T. Randomized cuts for 3D mesh analysis. ACM Trans. Graph. (TOG) 2008, 27, 1–12. [Google Scholar] [CrossRef]
  18. Xin, S.-Q.; He, Y.; Fu, C.-W. Efficiently computing exact geodesic loops within finite steps. IEEE Trans. Vis. Comput. Graph. 2011, 18, 879–889. [Google Scholar]
  19. Zhang, J.; Wu, C.; Cai, J.; Zheng, J.; Tai, X.-C. Mesh snapping: Robust interactive mesh cutting using fast geodesic curvature flow. Comput. Graph. Forum 2010, 29, 517–526. [Google Scholar] [CrossRef]
  20. George, D.; Xie, X.; Tam, G.K. 3D mesh segmentation via multi-branch 1D convolutional neural networks. Graph. Models 2018, 96, 1–10. [Google Scholar] [CrossRef]
  21. Gezawa, A.S.; Wang, Q.; Chiroma, H.; Lei, Y. A Deep Learning Approach to Mesh Segmentation. CMES-Comput. Model. Eng. Sci. 2023, 135, 1745–1763. [Google Scholar]
  22. Jiao, X.; Chen, Y.; Yang, X. SCMS-Net: Self-supervised clustering-based 3D meshes segmentation network. Comput.-Aided Des. 2023, 160, 103512. [Google Scholar] [CrossRef]
  23. Bo, L.; Zhang, T.; Tian, X. Vehicle Detection from 3D Lidar Using Fully Convolutional Network. In Proceedings of the Robotics: Science and Systems 2016, Ann Arbor, MI, USA, 18–22 June 2016. [Google Scholar]
  24. Minemura, K.; Liau, H.; Monrroy, A.; Kato, S. LMNet: Real-time Multiclass Object Detection on CPU Using 3D LiDAR. In Proceedings of the 2018 3rd Asia-Pacific Conference on Intelligent Robot Systems (ACIRS), Singapore, 21–23 July 2018. [Google Scholar]
  25. Yu, F.; Koltun, V. Multi-scale context aggregation by dilated convolutions. arXiv 2015, arXiv:1511.07122. [Google Scholar]
  26. Simon, M.; Amende, K.; Kraus, A.; Honer, J.; Samann, T.; Kaulbersch, H.; Milz, S.; Michael Gross, H. Complexer-yolo: Real-time 3d object detection and tracking on semantic point clouds. In Proceedings of the IEEE/CVF Conference on Computer Vision and Pattern Recognition Workshops, Long Beach, CA, USA, 16–17 June 2019. [Google Scholar]
  27. Zeng, Y.; Hu, Y.; Liu, S.; Ye, J.; Han, Y.; Li, X.; Sun, N. RT3D: Real-Time 3-D Vehicle Detection in LiDAR Point Cloud for Autonomous Driving. IEEE Robot. Autom. Lett. 2018, 3, 3434–3440. [Google Scholar] [CrossRef]
  28. Beltran, J.; Guindel, C.; Moreno, F.M.; Cruzado, D.; Garcia, F.; Arturo, D. BirdNet: A 3D Object Detection Framework from LiDAR information. In Proceedings of the 2018 21st International Conference on Intelligent Transportation Systems (ITSC), Maui, HI, USA, 4–7 November 2018. [Google Scholar]
  29. Feng, D.; Rosenbaum, L.; Dietmayer, K. Towards safe autonomous driving: Capture uncertainty in the deep neural network for lidar 3d vehicle detection. In Proceedings of the 2018 21st International Conference on Intelligent Transportation Systems (ITSC), Maui, HI, USA, 4–7 November 2018; pp. 3266–3273. [Google Scholar]
  30. Shi, B.; Bai, S.; Zhou, Z.; Bai, X. Deeppano: Deep panoramic representation for 3-d shape recognition. IEEE Signal Process. Lett. 2015, 22, 2339–2343. [Google Scholar] [CrossRef]
Disclaimer/Publisher’s Note: The statements, opinions and data contained in all publications are solely those of the individual author(s) and contributor(s) and not of MDPI and/or the editor(s). MDPI and/or the editor(s) disclaim responsibility for any injury to people or property resulting from any ideas, methods, instructions or products referred to in the content.

Article Metrics

Citations

Article Access Statistics

Multiple requests from the same IP address are counted as one view.