Article

A Theoretical and Experimental Investigation on the Fracture Mechanism of Center-Symmetric Closed Crack in Compacted Clay under Compression–Shear Loading

1
State Key Laboratory of Mountain Bridge and Tunnel Engineering, Chongqing Jiaotong University, Chongqing 400074, China
2
School of Civil Engineering, Chongqing Jiaotong University, Chongqing 400074, China
3
Engineering Research Center of Diagnosis Technology and Instruments of Hydro-Construction, Chongqing Jiaotong University, Chongqing 400074, China
*
Author to whom correspondence should be addressed.
Symmetry 2023, 15(8), 1519; https://doi.org/10.3390/sym15081519
Submission received: 20 June 2023 / Revised: 20 July 2023 / Accepted: 30 July 2023 / Published: 1 August 2023
(This article belongs to the Special Issue Multi-Physics Phenomena in Geomaterials)

Abstract

:
In this study, a modified maximum tangential stress criterion by considering T-stress and uniaxial compression tests have been utilized to theoretically and experimentally reveal the fracture initiation mechanism of a center-symmetric closed crack in compacted clay. The results show that wing cracks occur in the linear elastic phase of the stress-strain curve. In the plastic phase of the stress-strain curve, the wing cracks extend gradually and the shear cracks occur. The crack initiation stress and peak stress of compacted clay first decrease with the rise in pre-crack inclination angle (β = 0°–40°), and then increase with the rise in pre-crack inclination angle (β = 50°–90°). When the pre-crack inclination angle is relatively small or large (β ≤ 10° or β ≥ 70°), the crack type is mainly tension cracks. Secondary shear cracks occur when the pre-crack inclination angle is 10°–80°. When the dimensionless crack length is larger than 0.35, the crack types include wing-type tension cracks and secondary shear cracks. The experimental results were compared with the theoretical values. It was found that the critical size rc of compacted clay under compression-shear loading was 0.75 mm, smaller than the value calculated by the empirical formula (12 mm). The MTS criterion considering T-stress can be used to predict the compression-shear fracture behavior of compacted clay.

1. Introduction

Cracks are a common hazard and one of the main causes of damage in geotechnical structures [1]. In the compacted clay liner system of municipal landfills, desiccation cracks are very likely to occur under the influence of the environment. Such cracks can lead to leakage problems and subsequent failure of the liner system if they propagate under overlying loads [2]. In earth-rock dams, the most common types of cracks are crest cracks and clay core wall cracks. Crest cracks [3] are typically caused by the difference in modulus between the dam shell and the core wall, water pressure during the impounding period, and wetting deformation of the upstream dam shell. These cracks, if propagated, will directly affect the long-term stability of the dam slope. Core wall cracks are primarily attributed to localized inadequate compaction of fill material, uneven settlement, and shrinkage [4]. If these cracks propagate, they can result in seepage and even dam failure. The study on the propagation of existing cracks in soils has engineering significance and practical value.
With macroscopic cracks in the soil, the external load will lead to stress concentration at the crack tip, which can be analyzed from the perspective of material fracture [5]. Since the introduction of fracture mechanics theory into geotechnics, extensive attention has been paid to crack propagation in rock-like materials. From the loading perspective, the external loads on cracks can be divided into normal force and tangential force components, and the crack propagation problem can be categorized into fracture problems under pure tension, pure shear, tension-shear and compression-shear loading conditions [6]. Since Skempton et al. [7] suggested explaining the instability of hard clay slopes with cracks in light of the concept of fracture mechanics, researchers have given attention to the soil fracture problem, mainly focusing on mode I cracks in compacted clay [8,9,10,11,12]. However, most rock-soil bodies in practical engineering are under a compression-shear stress state, and crack propagation in soils under compression-shear loading is rarely concerned.
In previous studies on the core wall cracking of earth-rock dams, researchers have employed fracture mechanics theory to analyze the problem [4,9,10,11]. Typically, the cracks were considered in a non-closed form, and the crack planes were assumed to be under a tensile-shear stress state. For clay core walls formed by layered compaction, if the compaction is insufficient, there will be a certain weak plane between the compacted clay, and from the perspective of cracks, the weak plane is in a closed state. In view of this, focusing on the propagation of closed cracks in compacted clay under compressive-shear stress, in this paper, we first carried out uniaxial compression tests for compacted clay specimens with closed cracks of different inclination angles and lengths to analyze the influence of various factors on the cracking behavior of compacted clay with closed cracks. Then, the influence of T-stress was considered in the stress field of compression-shear closed cracks. Following the approach of the MTS criterion, the propagation behavior of compression-shear closed cracks was predicted. The prediction results were compared with the experimental results to validate the applicability of the MTS criterion considering T-stress in addressing the issue of closed cracks in compacted clay.

2. Stress Field of Closed Cracks under Compression-Shear Loading

2.1. Classical Fracture Mechanics Theory

According to the classical fracture mechanics theory, the stress field at the crack tip and the crack initiation direction in the Cartesian coordinate system are defined (Figure 1).
Typically, the stress field at the crack tip can be expressed as [13]:
σ r = 1 2 2 π r K I cos θ 2 ( 3 cos θ ) + K II sin θ 2 ( 3 cos θ 1 ) σ θ = 1 2 2 π r cos θ 2 K I ( 1 + cos θ ) 3 K II sin θ τ r θ = 1 2 2 π r cos θ 2 K I sin θ + K II ( 3 cos θ 1 )
where σr, σθ and τ are the radial stress, circumferential stress, and shear stress at the crack tip, respectively; KI and KII represent the mode I and mode II stress intensity factors, respectively; r and θ in the polar coordinate system represent the polar radius and polar angle, respectively; the sign of the crack initiation angle θ0 depends on the KII direction (Figure 1).
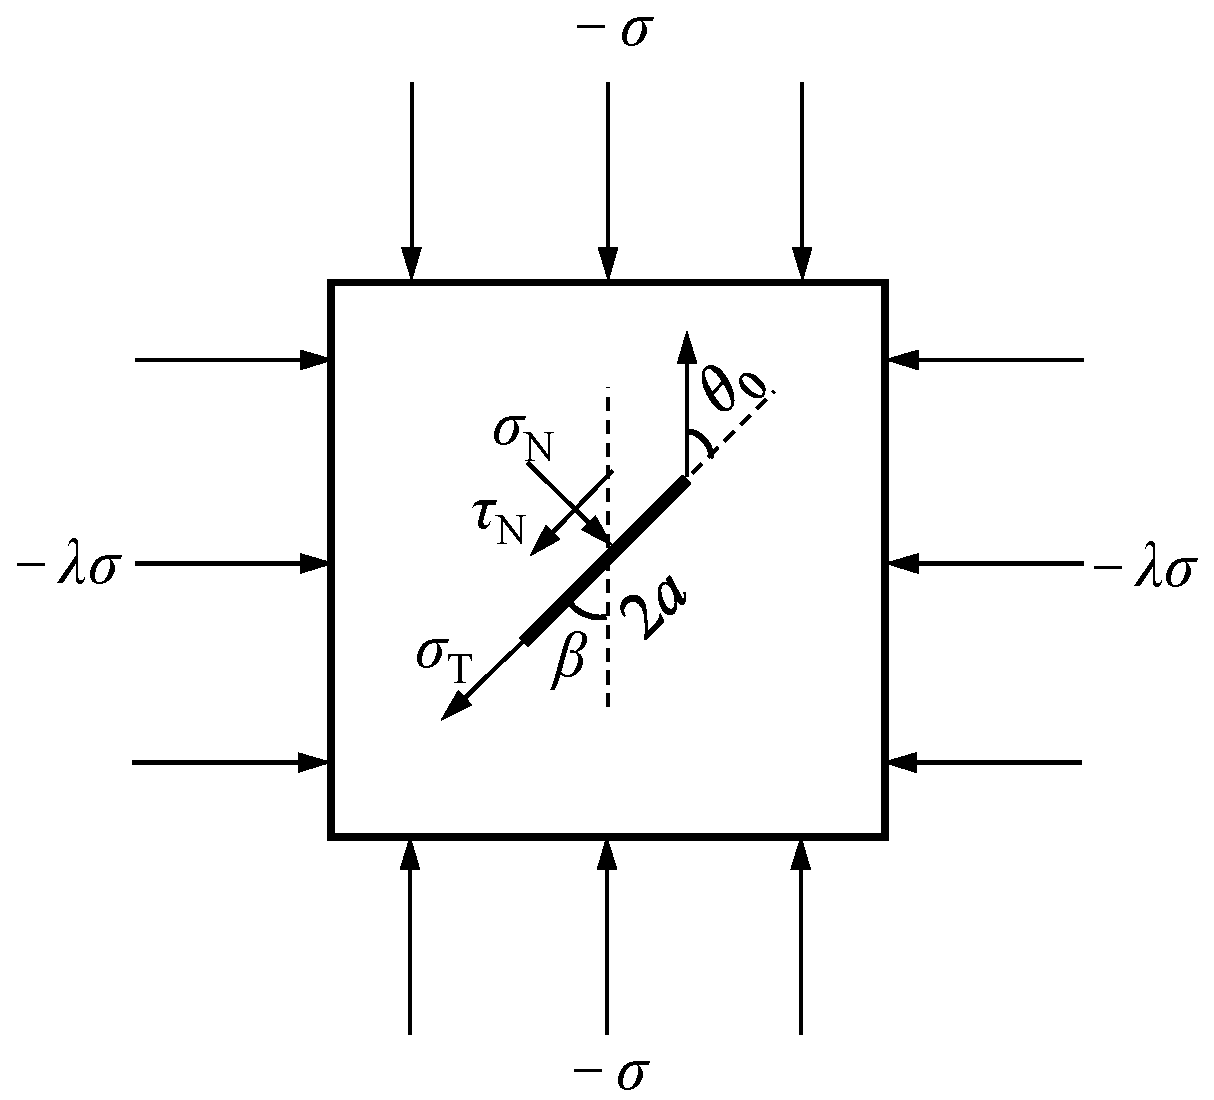
For a biaxially compressed central inclined crack (Figure 2), the stress state of the crack plane is described by Equation (2) [14]:
σ T = σ ( cos 2 β + λ sin 2 β ) σ N = σ ( sin 2 β + λ cos 2 β ) τ N = σ 1 λ sin β cos β
where β is the angle between the crack and vertical direction; λ is the lateral pressure coefficient; σT, σN and τN are the normal stress, tangential stress and shear stress on the crack plane, respectively.
In the classical fracture mechanics theory, the I/II mixed mode fracture problem generally refers to crack propagation under tensile-shear stress [15,16]. In the early stages, scholars regarded compression-shear cracks as closed under compression and took frictional forces between cracks into account; however, they altered the sign of KI (mode I stress intensity factor) without considering that for closed cracks, KI does not exist anymore [17]. With the deepening of understanding, scholars realized that cracks under compression-shear stress have two forms, i.e., non-closed cracks and closed cracks. For non-closed cracks, the compressive stress inhibits crack opening, and therefore, KI should be treated with a sign change to make KI < 0 [18]. In this case, there is no frictional effect between crack planes. For closed cracks, the original crack planes cannot penetrate each other, so KI = 0, and the friction between the crack planes needs to be considered [19].
Thus, for the open crack, the stress intensity factor at the crack tip can be expressed as:
K I = σ N π a = σ ( sin 2 β + λ cos 2 β ) π a K II = τ N π a = σ 1 λ sin β cos β π a
Once the crack has closed, the original crack planes cannot penetrate each other, making KI = 0. As a result, the stress field is mainly governed by KII. In addition, friction occurs after the crack closure, and the shear stress on the crack planes is expressed by the effective shear stress τeff. A modification in the direction of shear stress leads to a corresponding alteration in the direction of friction force. Hence, the stress intensity factor of closed cracks can be expressed as [20]:
K I = 0 K II = τ eff π a = 0                                           ( τ N μ σ N ) τ N μ σ N π a               ( τ N > μ σ N )

2.2. Modified Fracture Mechanics Theory by Considering T-Stress

According to the traditional maximum tangential stress (MTS) criterion [21], the tensile crack initiation angle of compression-shear closed cracks remains a constant value of 70.5° [22]; however, numerous experiments have shown that the crack inclination angle and length both affect tensile crack initiation angle, regardless of whether the cracks are closed or not [23,24]. With further exploration, scholars realized that the fracture process zone of the specimen in laboratory experiments should not be neglected, and the effect of T-stress should be comprehensively incorporated in the Williams expansion of the crack tip stress field [25]. The fracture process zone of compacted clay is larger than that of rock and concrete materials. Therefore, the results of laboratory experiments are more significantly affected by the fracture process zone [26,27].
Williams et al. [13] were the first to represent the stress field at the crack tip by infinite series expansion terms:
σ i , j = A 1 r 1 / 2 f i j 1 ( θ ) + A 2 r 0 f i j 2 ( θ ) + A 3 r 1 / 2 f i j 3 ( θ ) +
where the first term is a singular term (r−0.5 term), which dominates; the second term is s non-singular term (r0 term), which is a constant term, and the third and subsequent terms are higher order terms in r. In classical fracture mechanics theory, the stress field at the crack tip is typically expressed by Equation (1), ignoring the effects of constant and higher-order terms. In fracture theory analysis, the effect of r is also disregarded.
Cotterell [28] was the first to find the significant impact of the second non-singular term on the crack initiation behavior, even under the simplest tensile loading conditions. Subsequent studies [29,30] have confirmed the influence of the second non-singular term on the fracture behavior of solid materials. In general, the second non-singular term is referred to as the T-stress. It is parallel to the crack and independent of the polar radius r. Ayatollahi et al. [31] found that under mode I tensile loading, the circumferential stress along the direction of maximum circumferential stress increased with growing positive T-stress and decreased with decreasing negative T-stress. When the T-stress exceeds a certain threshold, the direction of maximum circumferential stress deviates from the original crack plane, leading to crack deviation during its initiation. The rise in T-stress leads to a reduction in apparent fracture toughness. Roychowdhury and Dodds [32], Aliha et al. [33] suggest that T-stress significantly affects the crack initiation angle and the shape and size of the plastic zone at the crack tip. Mirlohi and Aliha [34] analyzed the fracture path of an angled cracked plate considering the non-singular term of Williams infinite series expansion and confirmed the effect of T-stress on its fracture behavior. Smith et al. [25] systematically investigated the effect of T-stress on material fracture behavior under tensile-shear loading and proposed the generalized maximum circumferential stress (GMTS) criterion, which has been widely applied to studies on the I-II mixed mode fracture problem [35,36,37,38].
However, previous studies mainly focused on crack propagation under pure tensile, pure shear, and tensile-shear stress conditions, which is known as mixed-mode crack problems in classical fracture mechanics. Williams series expansion only considers the non-singular term of T-stress, Tx, which is parallel to the crack. For compression-shear closed cracks, the singularity of mode I around the crack tips does not exist. Additionally, there are frictional forces between the crack planes. In 2017, Tang conducted [39] a study on compression-shear closed cracks considering the T-stress components parallel and perpendicular to the crack plane, denoted as Tx and Ty, respectively, for the first time. Subsequently, Fan et al. [14] improved the stress field of compression-shear cracks and argued that in addition to considering the T-stress components Tx and Ty, it is also necessary to consider the frictional effect of Ty on closed cracks, represented as Txy, which is equal to μTy, where μ is the friction coefficient of the closed crack planes.
In summary, considering the T-stress in Williams series expansion, the stress field at the tip of compression-shear closed cracks can be represented as follows:
σ r = K II 2 2 π r sin θ 2 ( 3 cos θ 1 ) + T x cos 2 θ + T y sin 2 θ + T x y sin 2 θ σ θ = 3 K II 2 2 π r sin θ cos θ 2 + T x sin 2 θ + T y cos 2 θ T x y sin 2 θ τ r θ = K II 2 2 π r cos θ 2 ( 3 cos θ 1 ) + 1 2 ( T y T x ) sin 2 θ + T x y cos 2 θ
where
T x = σ ( cos 2 β + λ sin 2 β ) T y = σ ( sin 2 β + λ cos 2 β ) T x y = μ σ ( sin 2 β + λ cos 2 β )

3. Theoretical Fracture Mechanism

3.1. Fracture Criterion of Compression-Shear Closed Cracks Considering T-Stress

To determine the direction of crack initiation and the onset of crack growth, it is essential to establish the fracture criterion. Several classical fracture criteria have been proposed, including the maximum tangential stress (MTS) criterion [21], the minimum strain energy density (MSED) criterion [40] and the maximum energy release rate (MERR) criterion [41,42]. For the tensile cracking problem, the MTS criterion is widely used. It suggests that when the circumferential stress at the crack tip reaches a critical value, the crack will propagate in the direction of maximum circumferential stress. The initiation angle θ0 and the maximum circumferential stress σθmax can be calculated:
σ θ θ = 0 , 2 σ θ θ 2 < 0
In the classical MTS criterion, only the non-singular terms are considered for the analysis of the stress field at the crack tip. By substituting Equation (1) into Equation (8), the maximum circumferential stress for tensile cracking in the case of compression-shear closed cracks can be expressed as:
σ θ max = 3 2 2 π r c K II sin θ 0 cos θ 0 2
By partial derivative calculations, it is determined that the initiation angle θ0 of compression-shear closed cracks remains constant at 70.5°. This finding is consistent with the calculation under pure mode II loading conditions. However, many studies have demonstrated that the initiation angle of compression-shear closed cracks is not constant, but closely related to the initial crack inclination angle [23,43].
Considering this inconsistency, the components of the non-singular term T-stress (Tx, Ty and Txy) are considered in the analysis of the stress field of compression-shear closed cracks. By substituting Equation (6) into Equation (8), the maximum circumferential stress for tensile cracking in the case of compression-shear closed cracks can be expressed as:
σ θ max = 3 K II 2 2 π r c sin θ 0 cos θ 0 2 + T x sin 2 θ 0 + T y cos 2 θ 0 T x y sin 2 θ 0
After considering the T-stress, the critical size of the crack tip rc cannot be neglected when calculating the initiation angle and the maximum circumferential stress. In general, rc is a characteristic property of materials and is currently predicted empirically using the Schmidt classical model [44]:
r c = 1 2 π K IC σ t 2
where KIC and σt represent the mode I fracture toughness and tensile strength of the material, respectively.
Ayatollahi et al. [45] found that the theoretical predictions obtained by Equation (11) based on the GMTS criterion showed a good agreement with experimental results for several typical rock materials. Therefore, this formula is widely utilized in the studies of I-II mixed-mode fracture problems. However, the GMTS criterion is mainly suitable for the mixed mode I/II fracture problem. For compression-shear closed cracks, there are significant differences in the stress intensity factors and T stress in the crack tip stress field. Thus, there is currently no basis to determine the applicability of Equation (11) to compression-shear fracture problems. In the following text, the rc of compacted clay is predicted based on the experimental results, and the problems of this formula are discussed.
From Equation (10), it can be found that after considering the T-stress, the maximum circumferential stress of the compression-shear closed crack is jointly influenced by the crack half-length a and the critical size of the crack tip rc. To facilitate calculation, the relative critical size α = 2 r c / a is introduced. Combining with Equation (4), Equation (10) can be converted to:
σ θ max = 3 τ eff 2 α sin θ 0 cos θ 0 2 + T x sin 2 θ 0 + T y cos 2 θ 0 T x y sin 2 θ 0
In summary, based on the fundamental principles of the MTS criterion, the crack initiation criteria for compression-shear closed cracks considering the T-stress can be analyzed using Equations (6)–(8) and either Equation (10) or (12).

3.2. Effect of Compression-Shear Closed Crack Initiation Behaviors

From Equations (6) and (7), it can be seen that the stress state of compression-shear closed cracks is influenced by the lateral pressure coefficient λ, crack inclination angle β, friction coefficient μ, and critical crack tip size α. The influence of each factor will be discussed in the following sections.

3.2.1. Effect of Lateral Pressure Coefficient

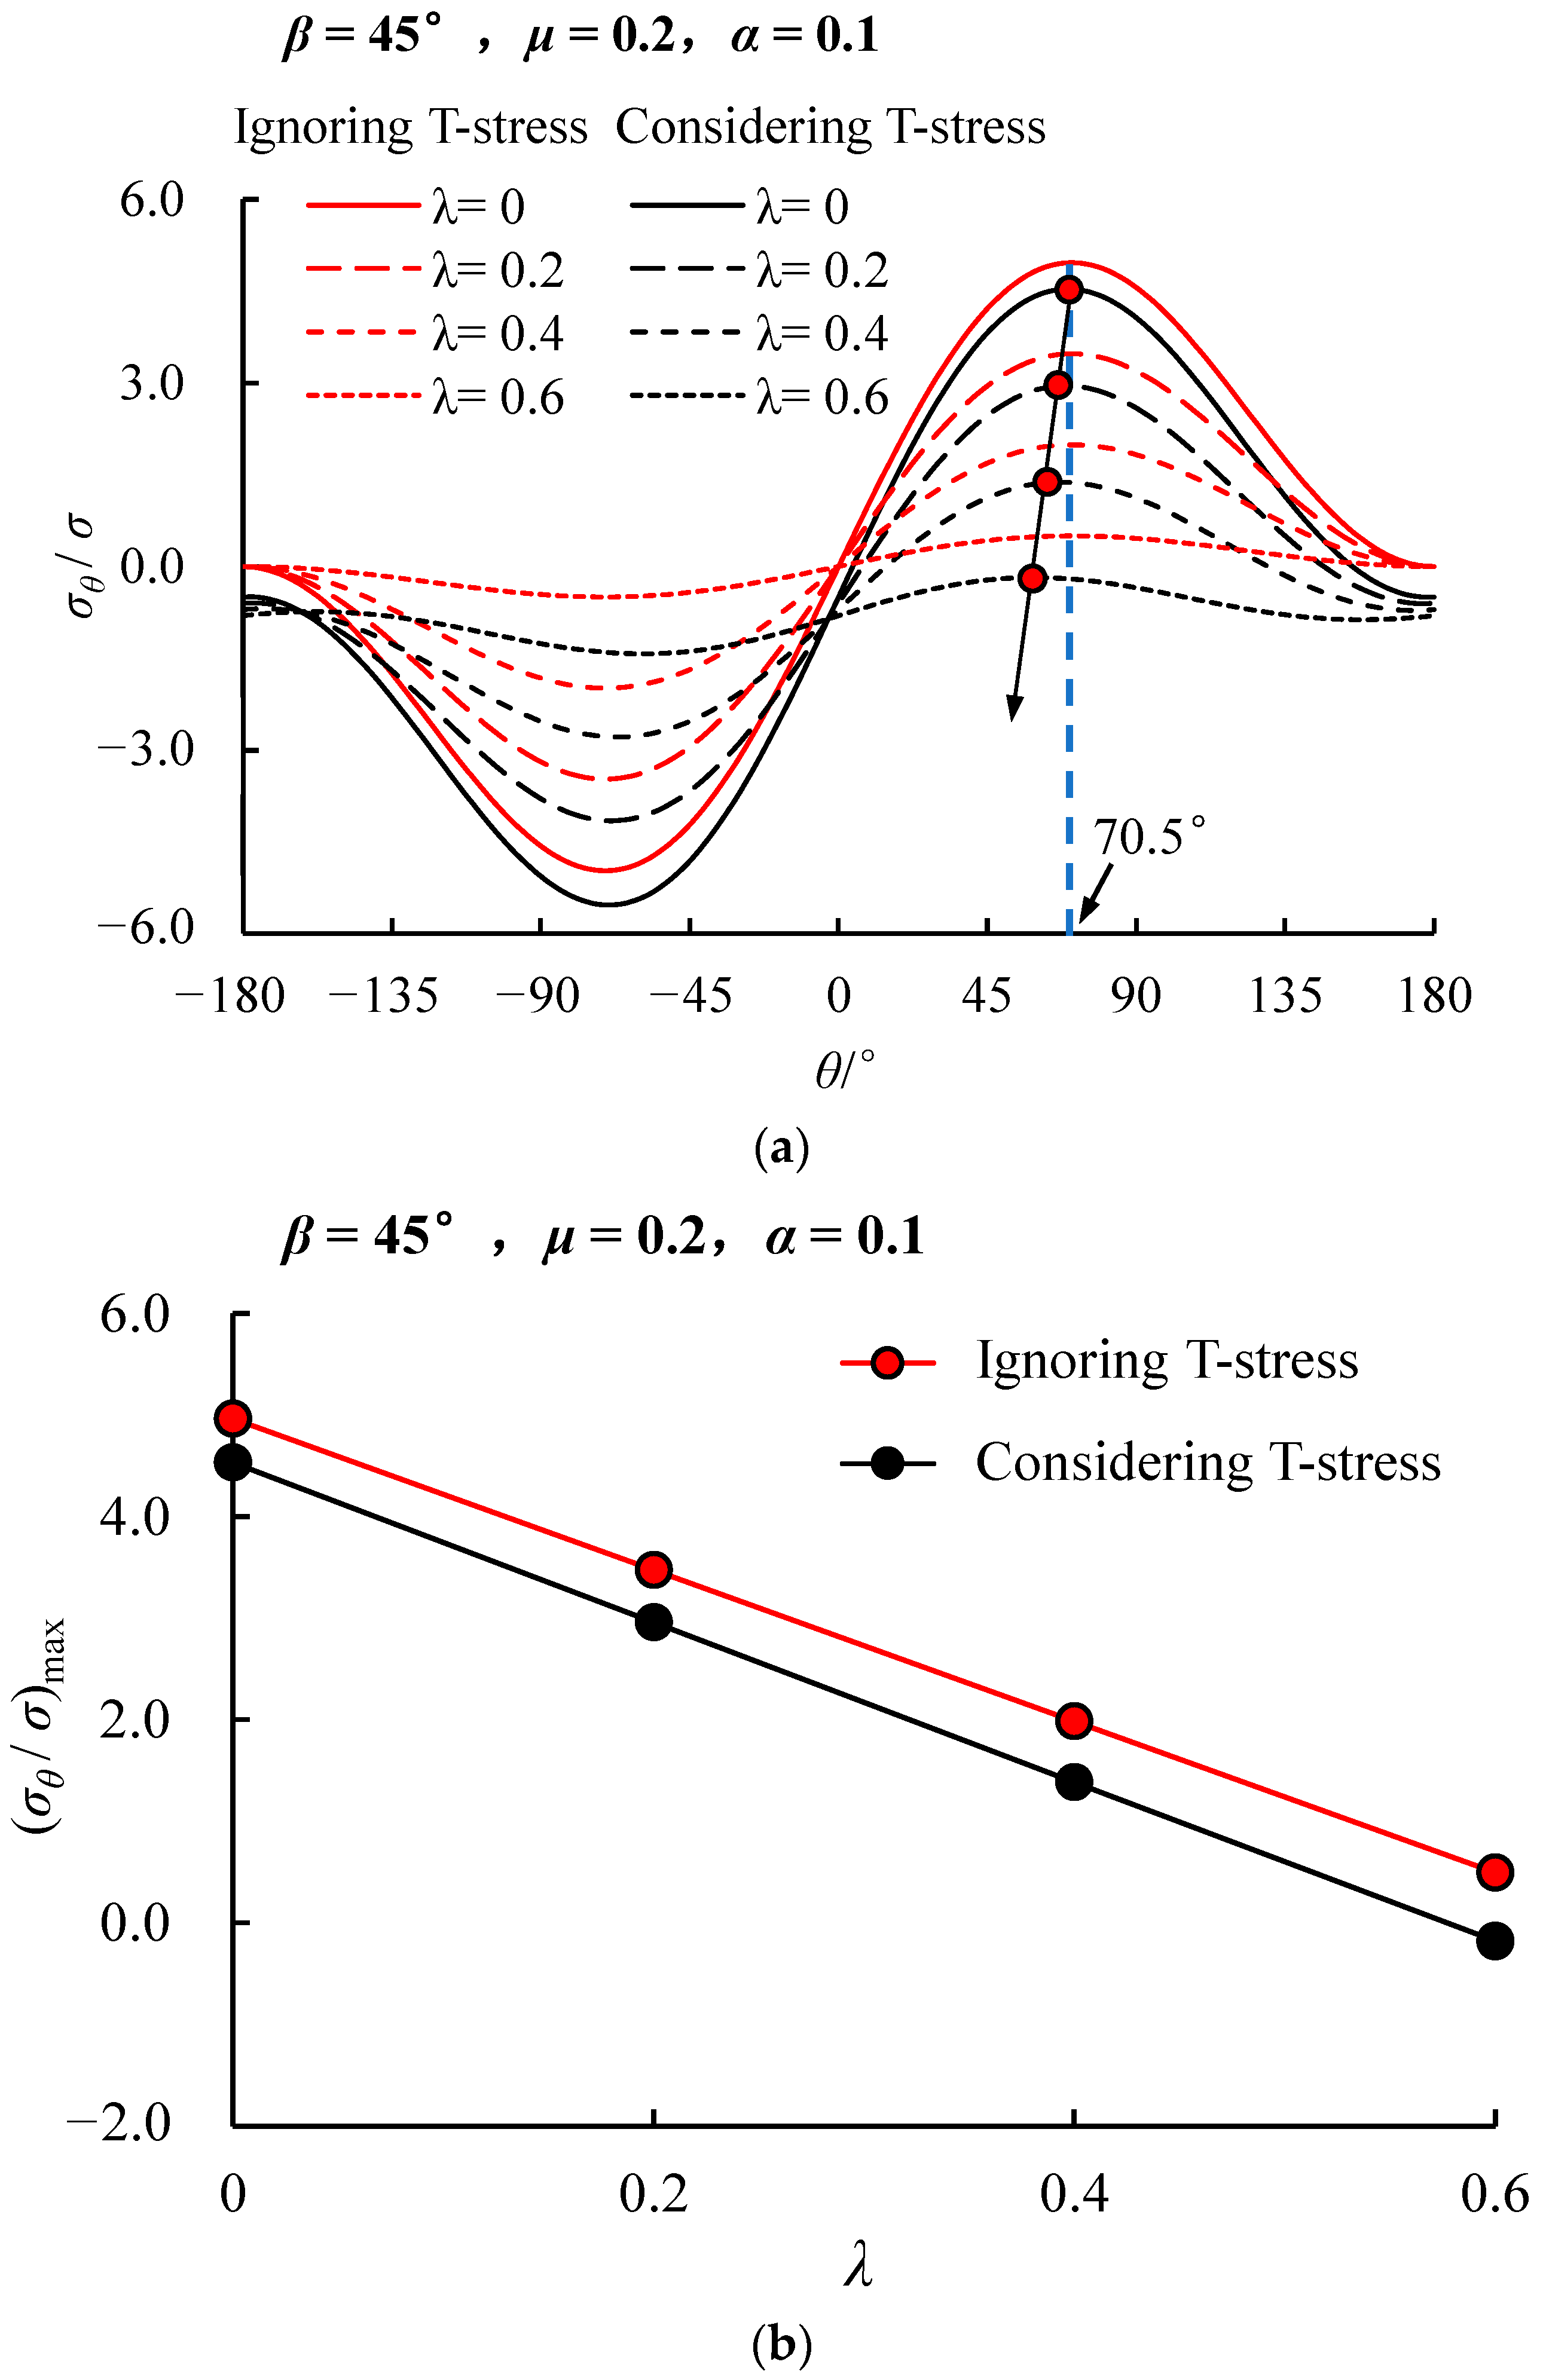
Taking β = 45°, μ = 0.2, and α = 0.1, the effect of the lateral pressure coefficient λ on the circumferential stress distribution at the tip of the compression-shear closed crack was investigated. As shown in Figure 3, after considering T-stress, as λ rises, the circumferential stress gradually decreases, and the tensile crack initiation angle θ0 gradually reduces. The maximum circumferential stresses obtained based on the conventional theory and the theory considering T-stress both decrease with increasing λ, and the magnitude of the decrease is approximately the same. Since the circumferential stress at the crack tip is mainly controlled by KII, an increase in λ corresponds to a decrease in the effective shear stress on the crack planes, and this reduction leads to a decrease in the circumferential stress at the crack tip. It is indicated that under biaxial compression, the tensile cracking of closed cracks can be suppressed.

3.2.2. Effect of Crack Inclination Angle

Taking λ = 0, μ = 0.2 and α = 0.1, the effect of crack inclination angle β on the stress distribution at the tip of the compression-shear closed cracks was explored. As can be seen from Figure 4, the maximum circumferential stresses calculated based on both theories show a trend of first increasing and then decreasing with the increase in the crack inclination angle β, similar to the distribution law of shear stress at the crack planes. For closed cracks, KI = 0, therefore, the circumferential stress at the crack tip is mainly controlled by the shear stress at the crack planes. Additionally, in the analysis based on the traditional theory, regardless of the value of the crack inclination angle β, the tensile crack initiation angle θ0 remains constant at 70.5°. After considering the T-stress, the tensile crack initiation angle θ0 gradually increases as the crack inclination angle β rises.
As can be seen from Figure 5, the maximum circumferential stress calculated considering T-stress is smaller than that obtained based on the conventional theory, indicating the inhibitory effect of T-stress on tensile cracking. In addition, the difference between the maximum circumferential stresses obtained based on the two theories gradually narrows as β increases.

3.2.3. Effect of Crack Friction Coefficient

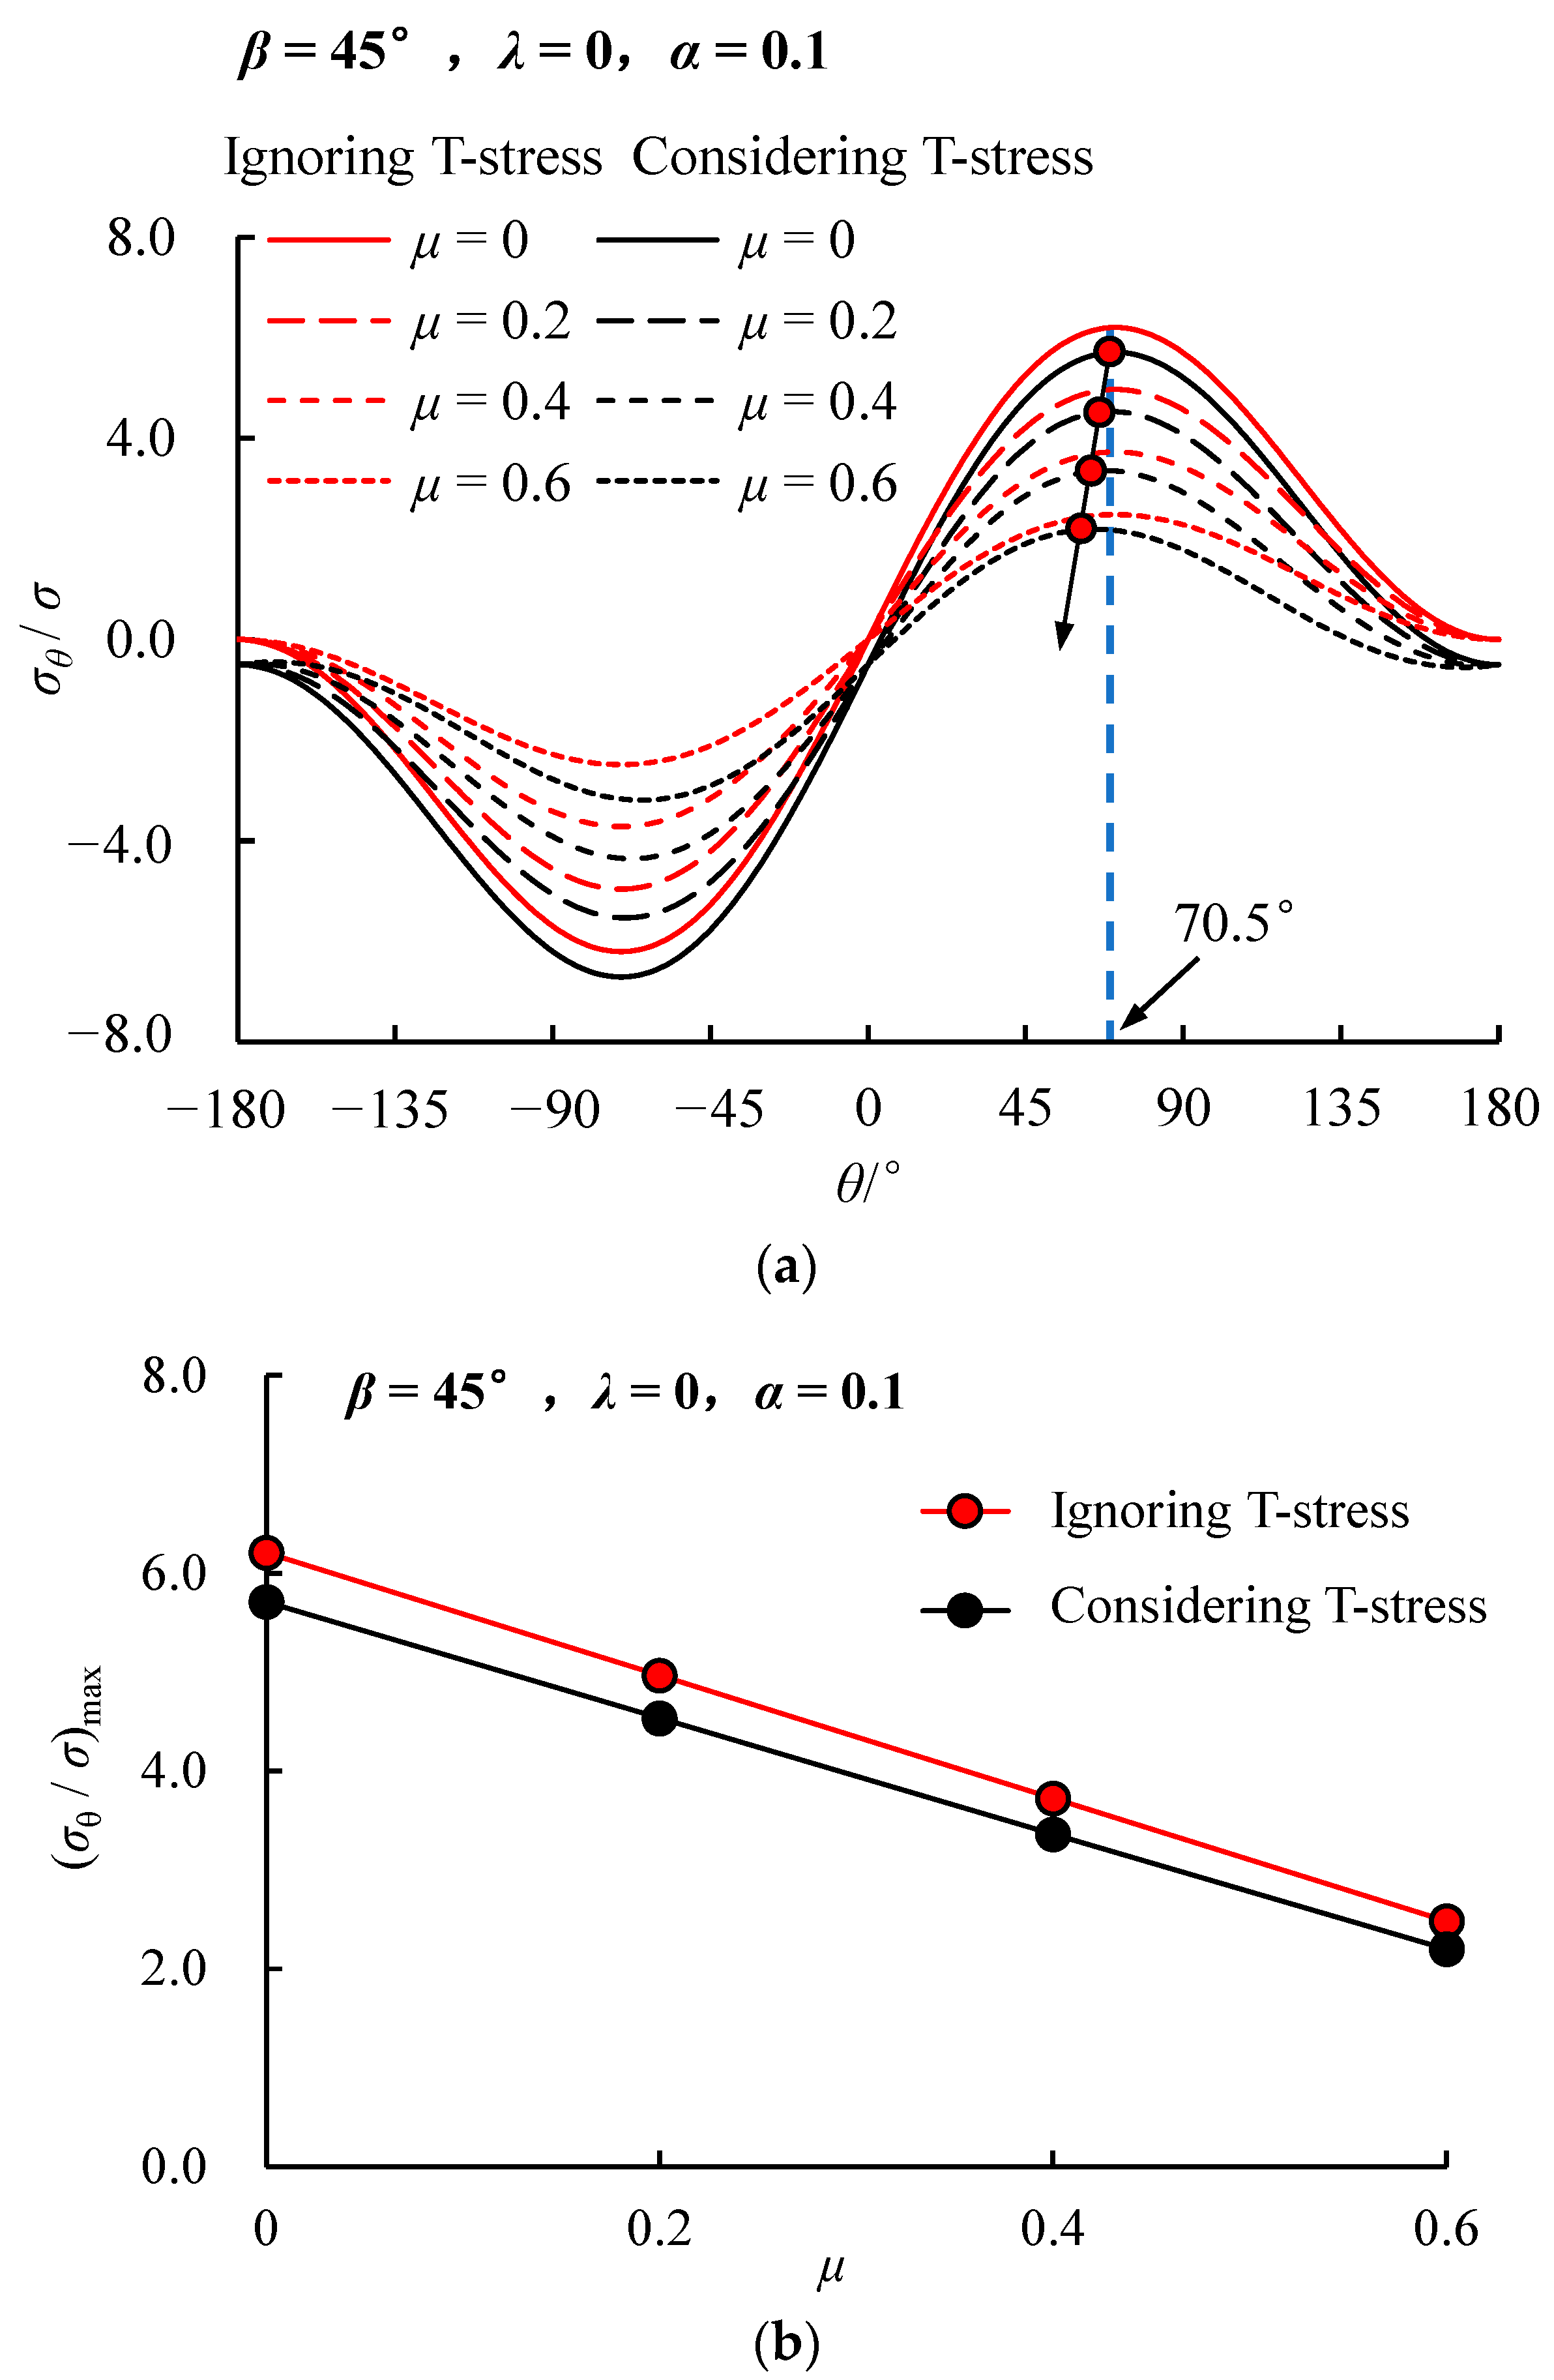
Taking β = 45°, λ = 0, and α = 0.1, the influence of friction coefficient μ on the stress distribution law at the tip of the compression-shear closed crack was studied. From Figure 6, it can be seen that as μ increases, the circumferential stress decreases and the tensile crack initiation angle θ0 gradually reduces. The maximum circumferential stresses calculated based on both theories decrease with increasing μ, and the decreased magnitude is approximately the same. Since the circumferential stress at the crack tip is mainly controlled by KII, an increase in μ corresponds to a decrease in the effective shear stress at the crack planes, resulting in a decrease in the circumferential stress. It is indicated that a higher friction coefficient contributes to a more pronounced inhibitory effect on tensile cracking.

3.2.4. Effect of Critical Size of Crack Tip

The introduction of the relative critical size α can provide a theoretical basis for understanding the differentiated fracture phenomena caused by the same material with different crack lengths or different materials with the same crack length. Taking λ = 0, μ = 0.2, β = 15° and 75°, the effect of critical size on the circumferential stress distribution at the compression-shear closed crack tip was investigated. As shown in Figure 7, after considering T-stress, when β = 15°, the tensile crack initiation angle θ0 gradually decreases as α increases; when β = 75°, the tensile crack initiation angle θ0 remains basically unchanged.
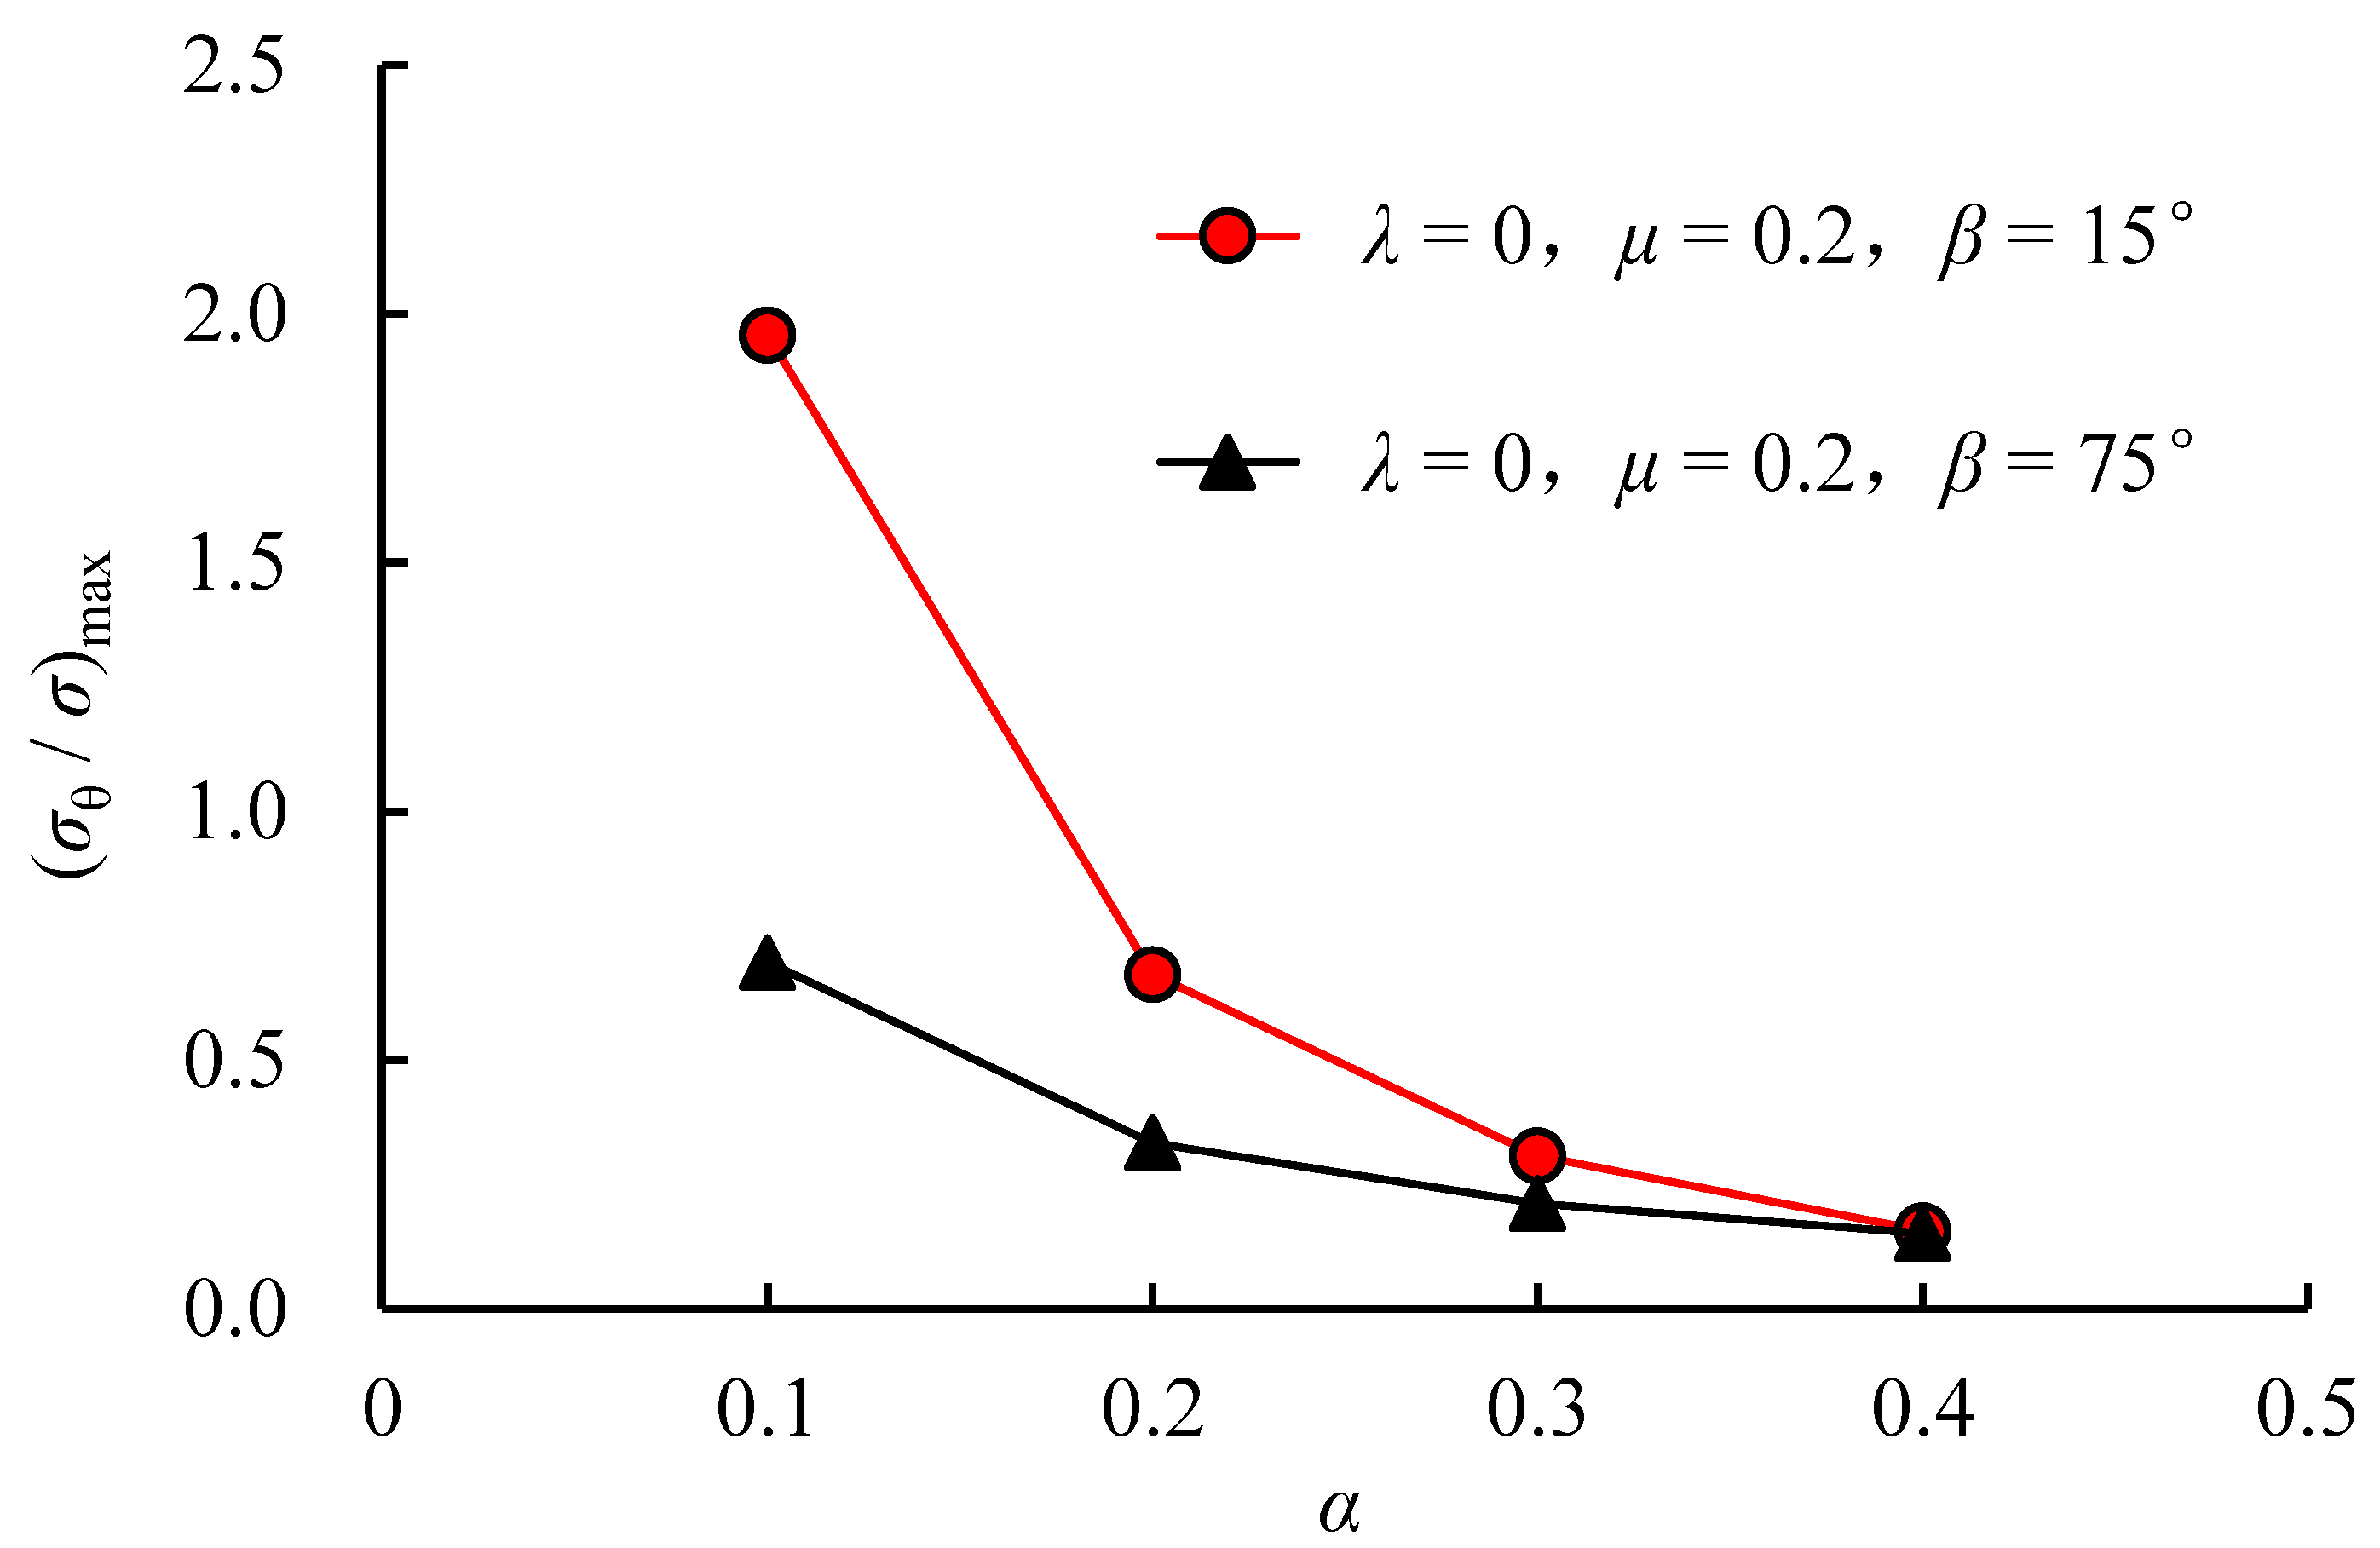
From Figure 8, it can be seen that the maximum circumferential stresses calculated based on the two theories both decrease with increasing α, and the decrease rate is gradually reduced. When α increases to a certain value, the dimensionless circumferential stress tends to 0, which means that the stress concentration degree at the crack tip is low, and the possibility of tensile cracking is small.

4. Experimental Procedures

4.1. Test Materials

The experimental soils were collected from a construction site in Chongqing, China, and their physical and mechanical properties are consistent with those reported in the literature [9]: specific gravity GS = 2.72, plasticity index IP = 20.1, liquid limit WL = 50.1%, plastic limit WP = 30.0%, maximum dry density ρmax = 1.68 g/cm3, and optimum moisture content wop = 16.6%. The particle size distribution is as follows: 0.5–0.25 mm (0.5%), 0.25–0.1 mm (17.9%), 0.1–0.075 mm (41.6%), <0.075 mm (40.0%). In the literature [9], the tensile strength σt and fracture toughness KIC of the soils were determined using semicircular bend specimens and straight cracked semicircular bend specimens. The values obtained were σt = 62 kPa and KIC = 17 kPa·m, respectively.

4.2. Specimen Preparation Molds

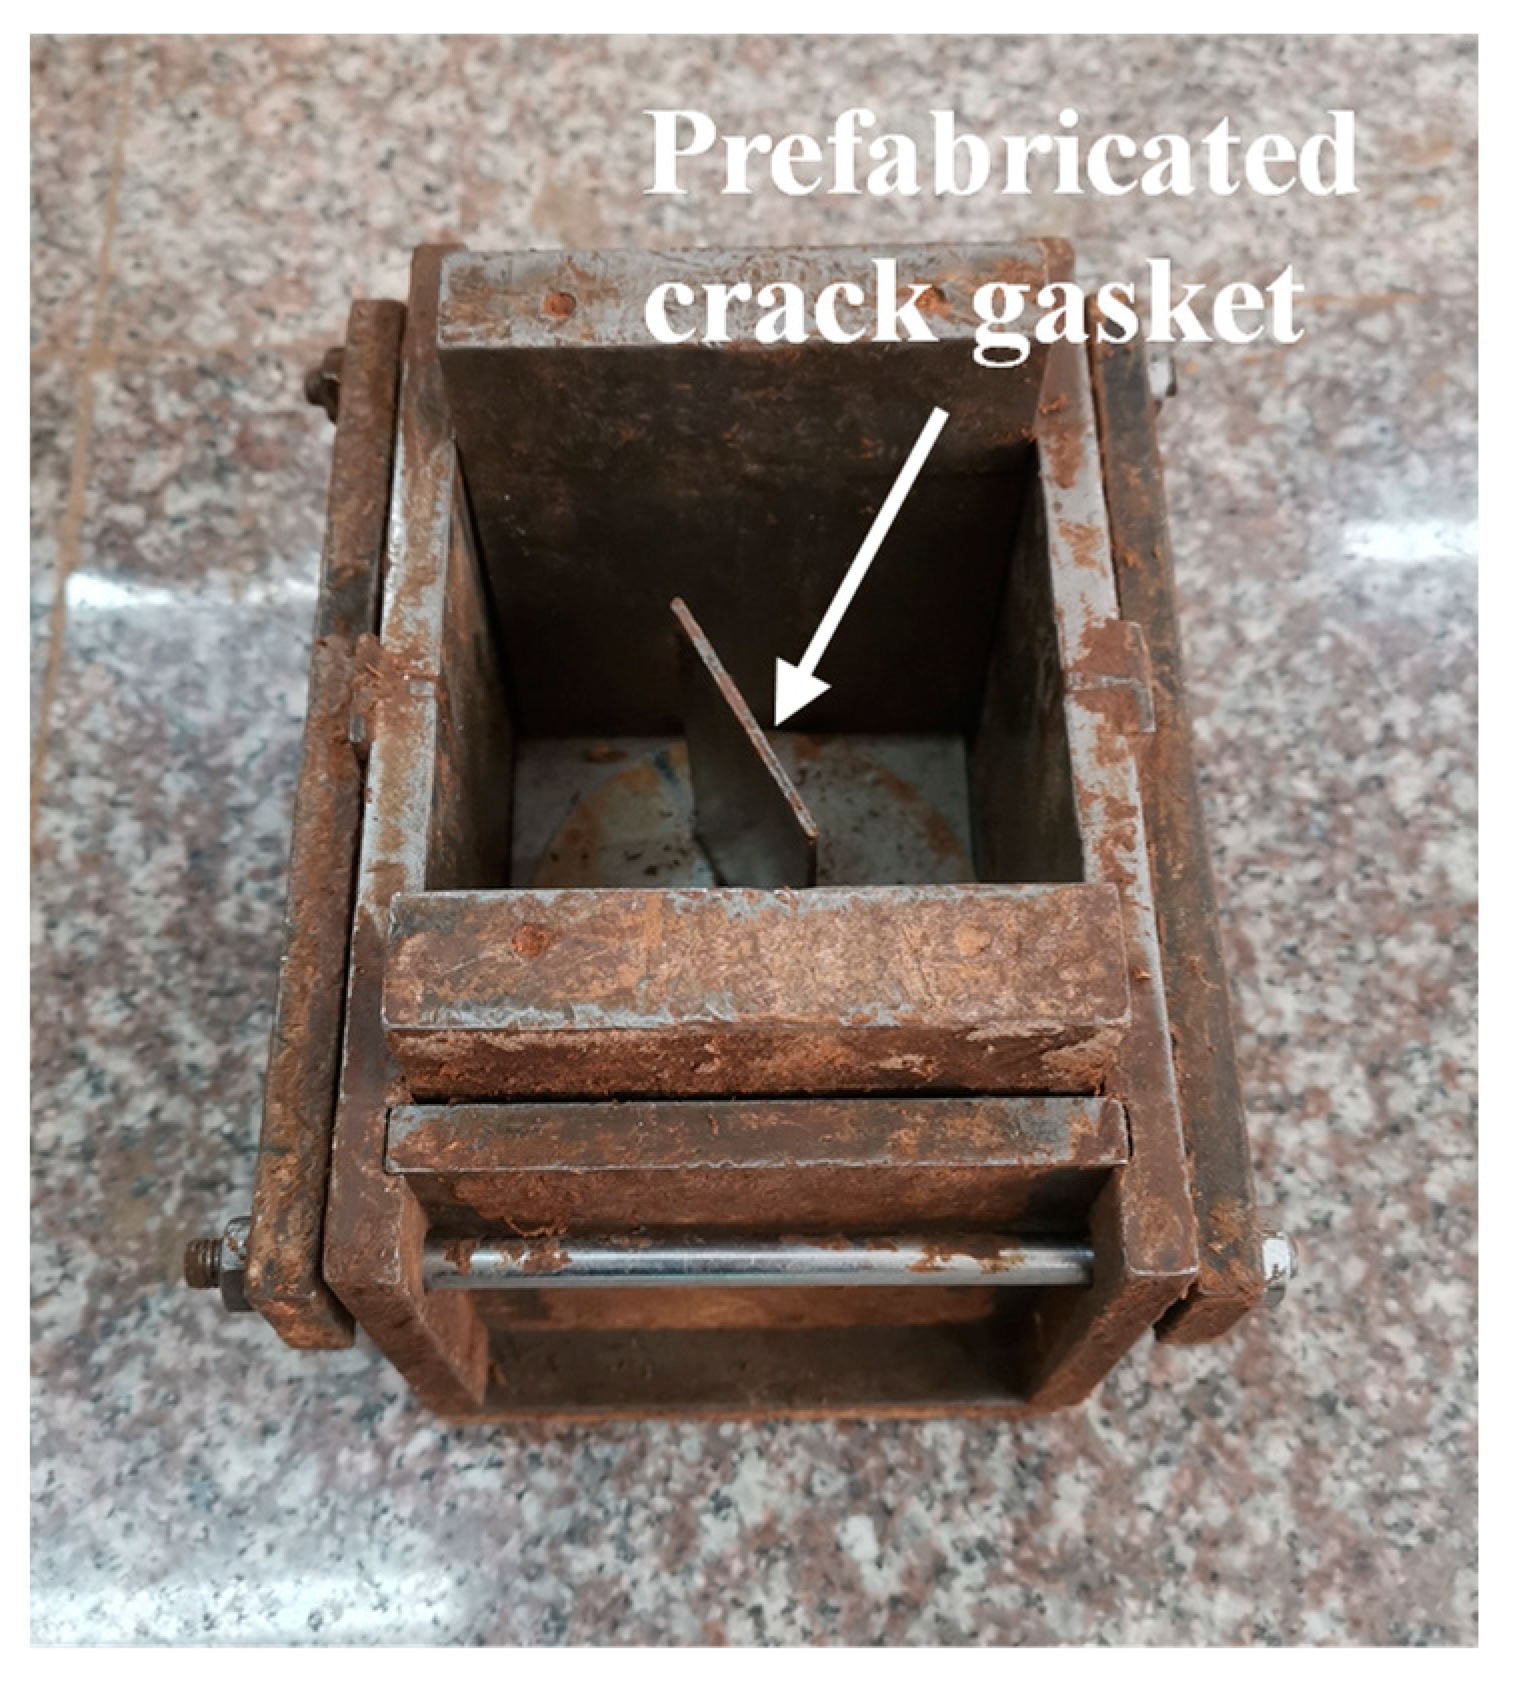
A customized cubic steel mold was used for compacted clay specimen preparation, as shown in Figure 9. A circular recess is provided at the bottom of the mold to hold the prefabricated crack gasket, and by rotating the gasket, pre-cracks at different angles can be formed. Before specimen preparation, appropriate gaskets were selected according to the preset central crack length, and then the gaskets were rotated according to the preset central crack inclination angle. Once the gaskets were properly positioned, the prepared soils were placed into the mold for compaction.
Gaskets in four specifications were customized to prefabricate central cracks of varying lengths, as shown in Figure 9, where a denotes the crack half-length, mm, and W denotes the specimen side length, mm.

4.3. Specimen Preparation Method

The process of preparing compacted clay specimens with central pre-cracks is as follows:
(1)
The masses of natural clay and water required were calculated based on the predetermined dry density (1.66 g/cm3) and water content (16.6%), see Figure 10a.
(2)
The weighted soil and water were mixed evenly in a container (Figure 10b) and sealed for 24 h.
(3)
The mixed soil was evenly spread into the cubic mold in three layers for compaction, ensuring that the compaction effort was the same for each layer. Scraping should be performed for each layer to ensure good integrity of the specimen, and petroleum jelly should be applied evenly on the inner wall of the mold and on the surface of the gaskets before compaction, see Figure 10c.
(4)
The clay specimen was moved out by dismantling the mold, and the next step was filling the opening cracks of the specimen. Paraffin wax was heated at a high temperature to make it melt into a liquid state. After being filled with liquid paraffin wax, the specimen was left undisturbed until the wax solidified, completing the preparation of the specimen with central closed cracks, see Figure 10d.
Figure 10. Specimen preparation process. (a) Natural soil; (b) Mixing soil; (c) Before compacting; (d) After compacting.
Symmetry 15 01519 g010
Paraffin wax, a crystalline wax made of n-alkanes, is widely used in daily life and industrial manufacturing. It has a wide range of sources, has a certain strength, and is not prone to cracking. It features a low melting point and is easy to melt under laboratory conditions; in addition, it cools faster at room temperature. These characteristics enable it to be a suitable filling material for prefabricated closed cracks in this test. The paraffin wax used in this paper is 58# paraffin wax (melting point 58 °C) with a linear shrinkage rate of 0.47%. The linear shrinkage rate is an important indicator that represents the amount of shrinkage when the wax material transitions from a liquid state to a solid state. It reflects the precision of the mold dimensions. The prefabricated closed cracks in this experiment were all 2 mm wide. The liquid paraffin wax was poured into the non-closed cracks, and the shrinkage in the thickness direction after the paraffin solidified was only 0.0094 mm, which was negligibly small. The cracks were considered to be completely closed.
The coefficient of friction between the solidified paraffin wax and the tested compacted clay was measured according to the method in the literature [14], and μ = 0.38.

4.4. Loading Method and Test Protocol

The experimental instrument was the YDS-200 two-dimensional fracture apparatus for rock-soil mass, developed by Jiangsu Yongchang Geotechnical Testing Systems Co., Ltd (Liyang City, China). The instrument consists of three main components: the loading system, the data acquisition system, and the computer control system. The data acquisition system consists of load sensors with a precision of 0.01 kN and a displacement acquisition system. The computer control system is responsible for controlling the loading and unloading processes of the instrument, as well as the data acquisition process. From the computer control system, load-displacement curves and load-time relationship curves can be obtained. The loading rate is set at 0.8 mm/min.
For the compacted clay specimens (150 × 150 × 150 mm) with closed cracks, uniaxial compression tests were carried out considering two influencing factors, i.e., the pre-crack inclination angle β and the dimensionless crack length 2a/W. The test protocol was designed using the control variate method, as shown in Table 1.
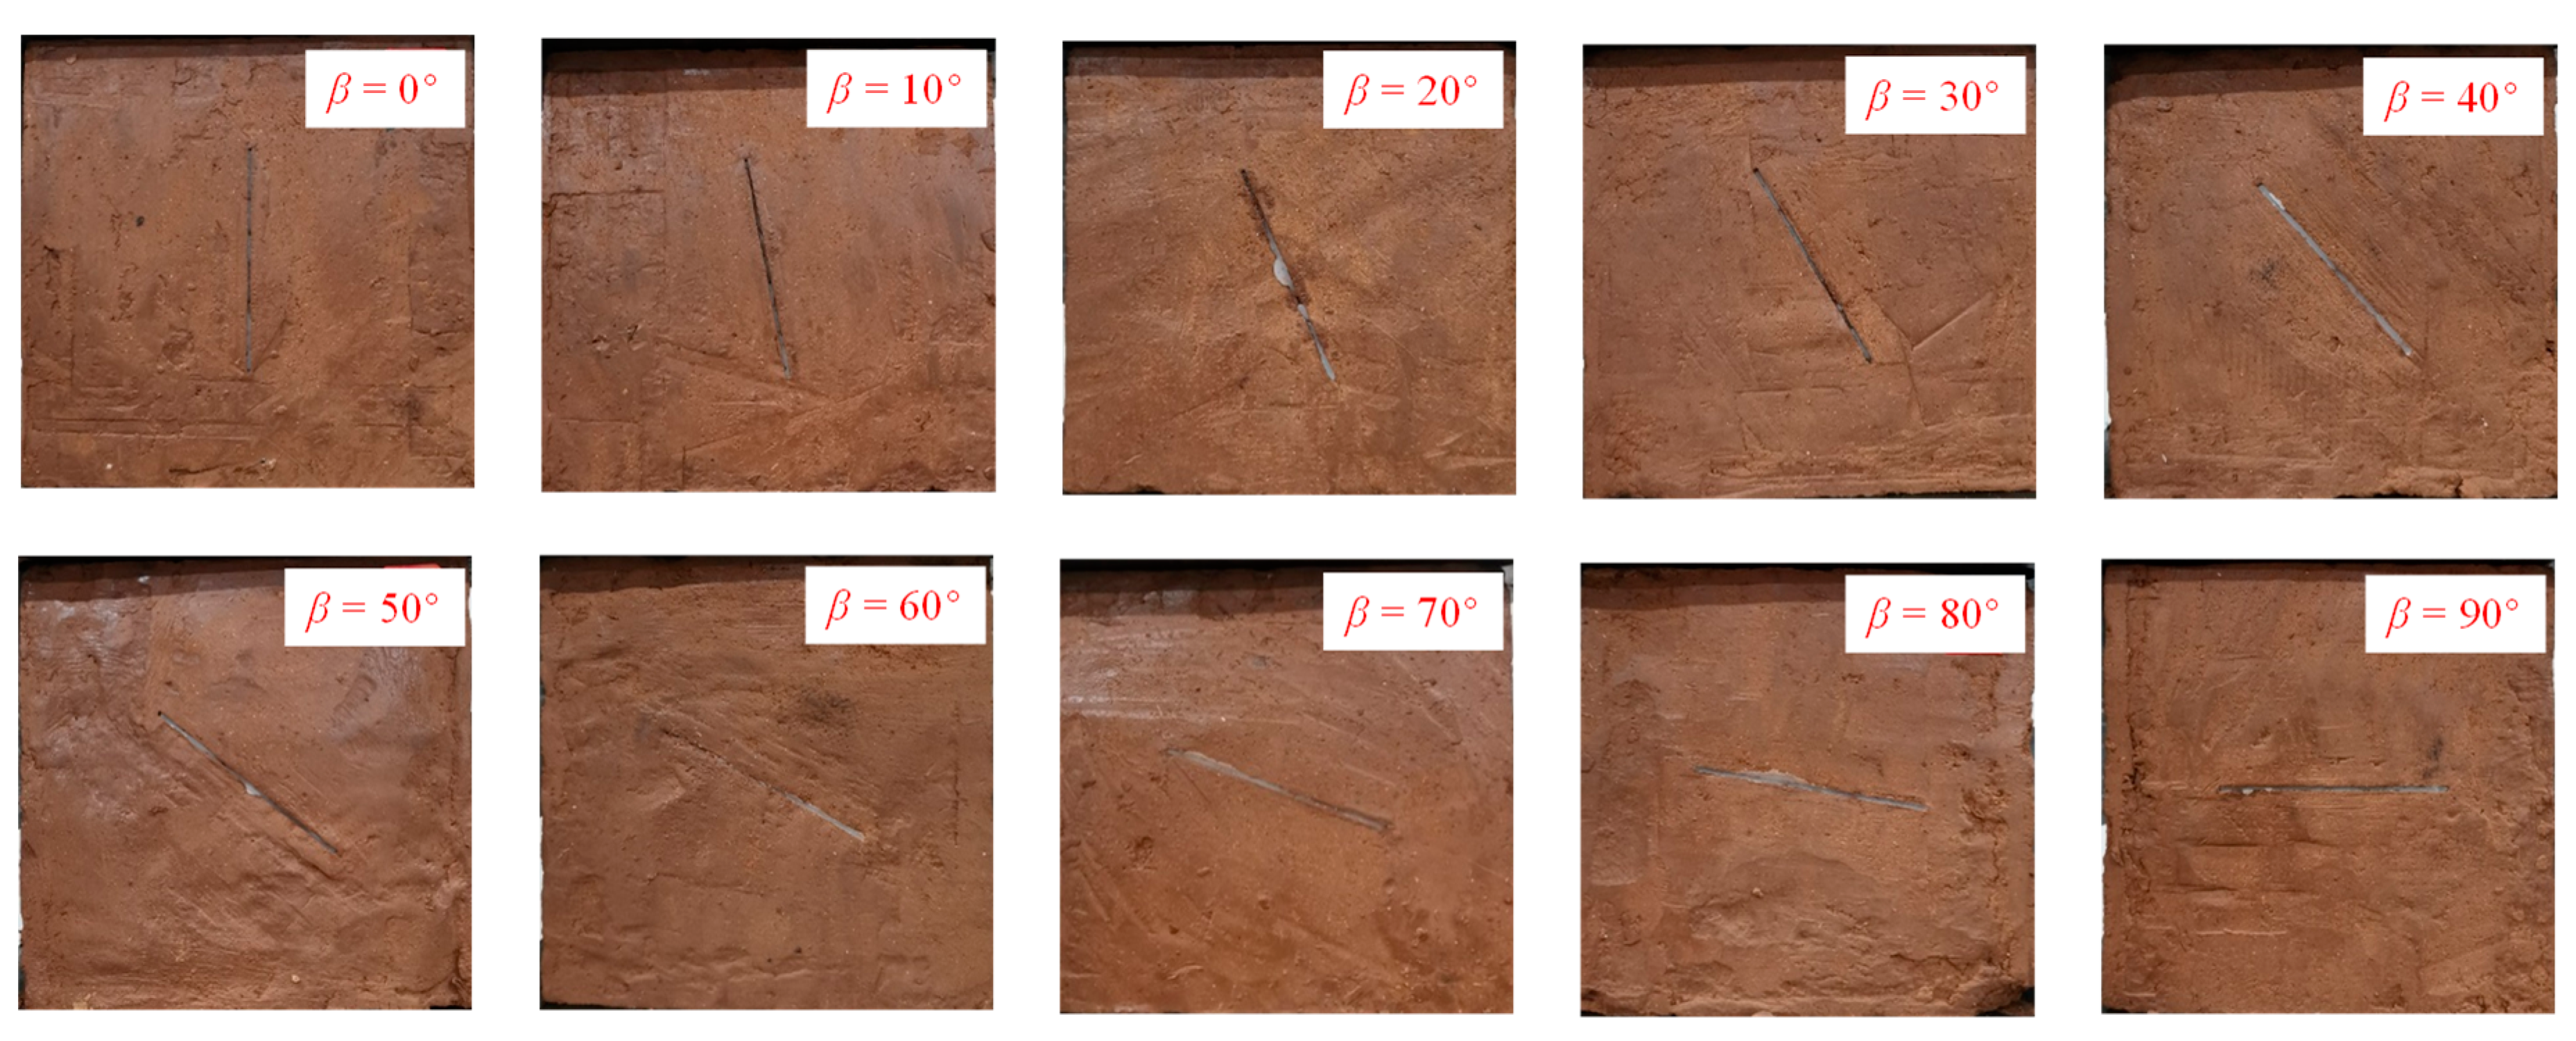
The prepared specimens are shown in Figure 11 and Figure 12.

5. Experiment Results

5.1. Stress-Strain Curve

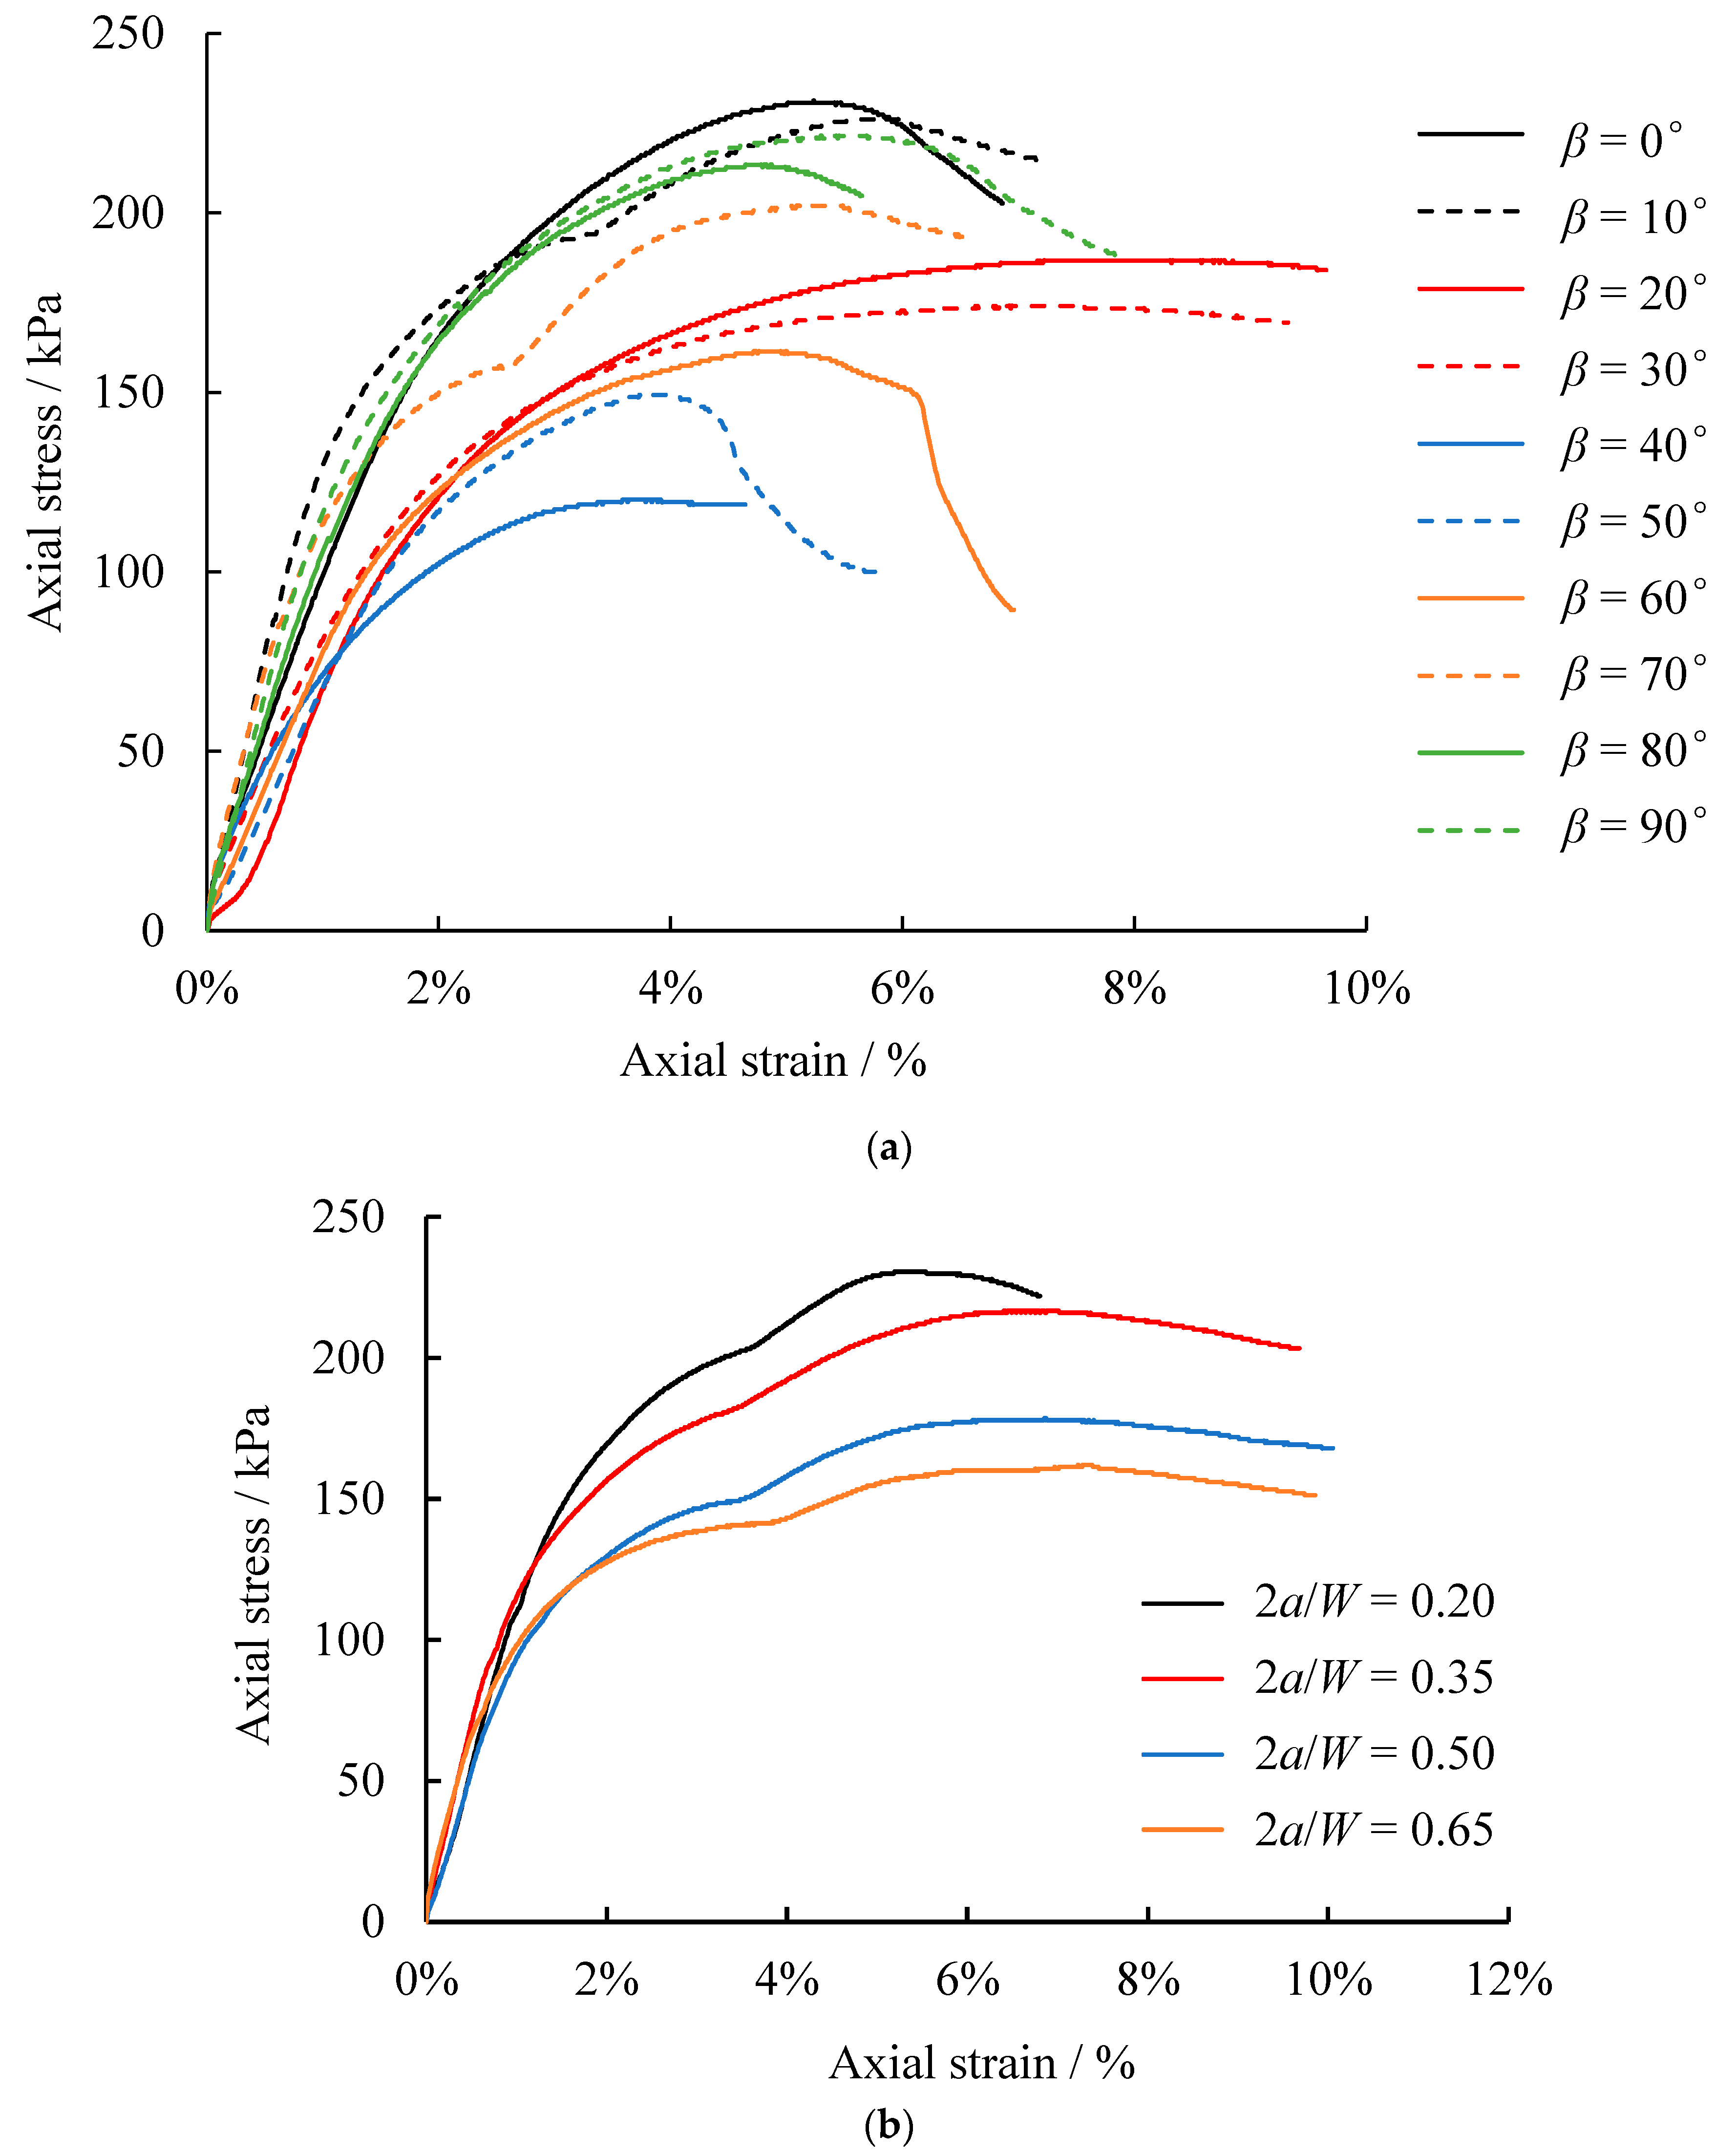
The typical stress-strain curves of the specimens with different crack inclination angles and dimensionless crack lengths are shown in Figure 13. Each specimen exhibits a distinct stress peak on the stress-strain curve. During the experiment, the process of tensile cracking in the specimens was captured using a high-speed camera. It was observed that crack initiation all occurred during the linear phase of the stress-strain curve.
The variation patterns of crack initiation stress and peak stress with the crack inclination angle are shown in Figure 14. The crack initiation stress and peak stress first decrease and then increase with the increase in the pre-crack inclination angle. When β = 40°, the crack initiation stress and peak stress reached the minimum values of 81.67 kPa and 125 kPa, respectively. When β = 0°, the crack initiation stress and peak stress reached the maximum values of 234.67 kPa and 218.1 kPa, respectively. The gap between the crack initiation stress and the peak stress first widens and then narrows with the increase in the crack inclination angle, and the gap is 7.6%, 53%, and 4.2% when β = 0°, 40°, 90°, respectively.
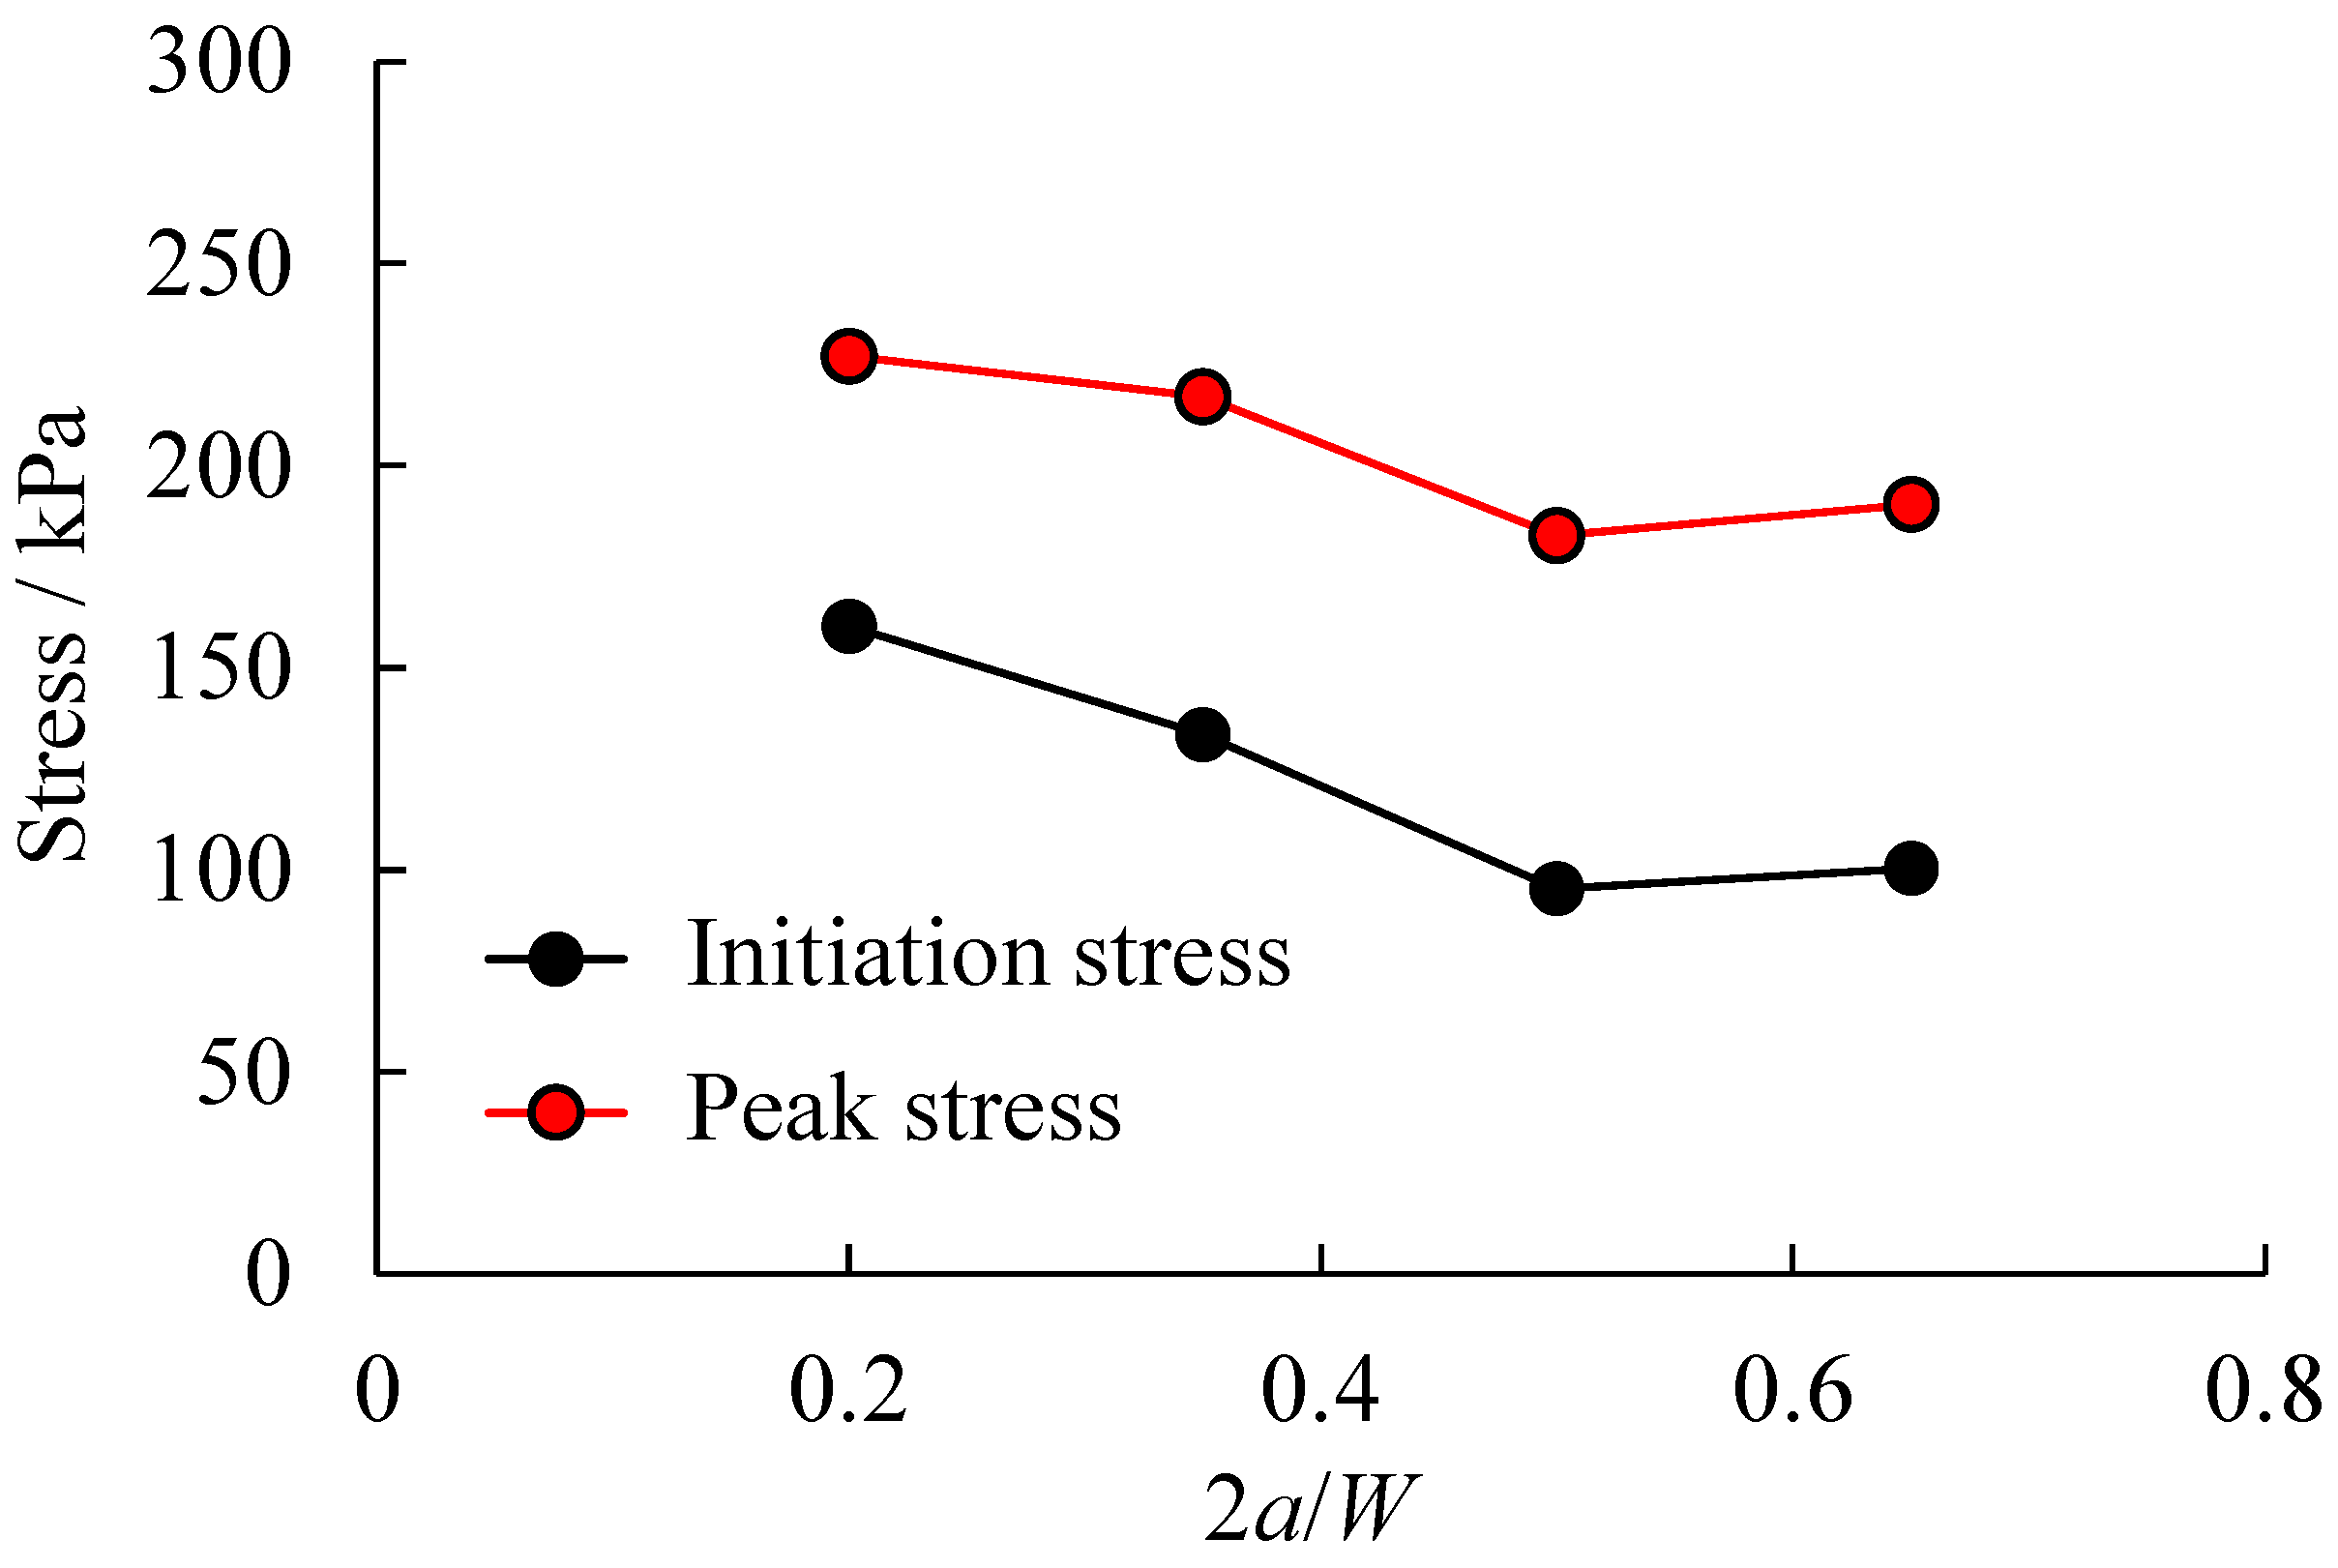
The variation patterns of the crack initiation stress and peak stress with the dimensionless pre-crack length are shown in Figure 15. It can be seen that with the increase in dimensionless crack length, both the crack initiation stress and peak stress show a gradual decrease. The decrease in cracking stress and peak stress is more significant when 2a/W is 0.35–0.5. When 2a/W = 0.5, the crack initiation stress and peak stress decrease by 39.6% and 19.1%, respectively, compared with the corresponding value when 2a/W = 0.35. When 2a/W is 0.5–0.65, the variation of crack initiation stress and peak stress is small.

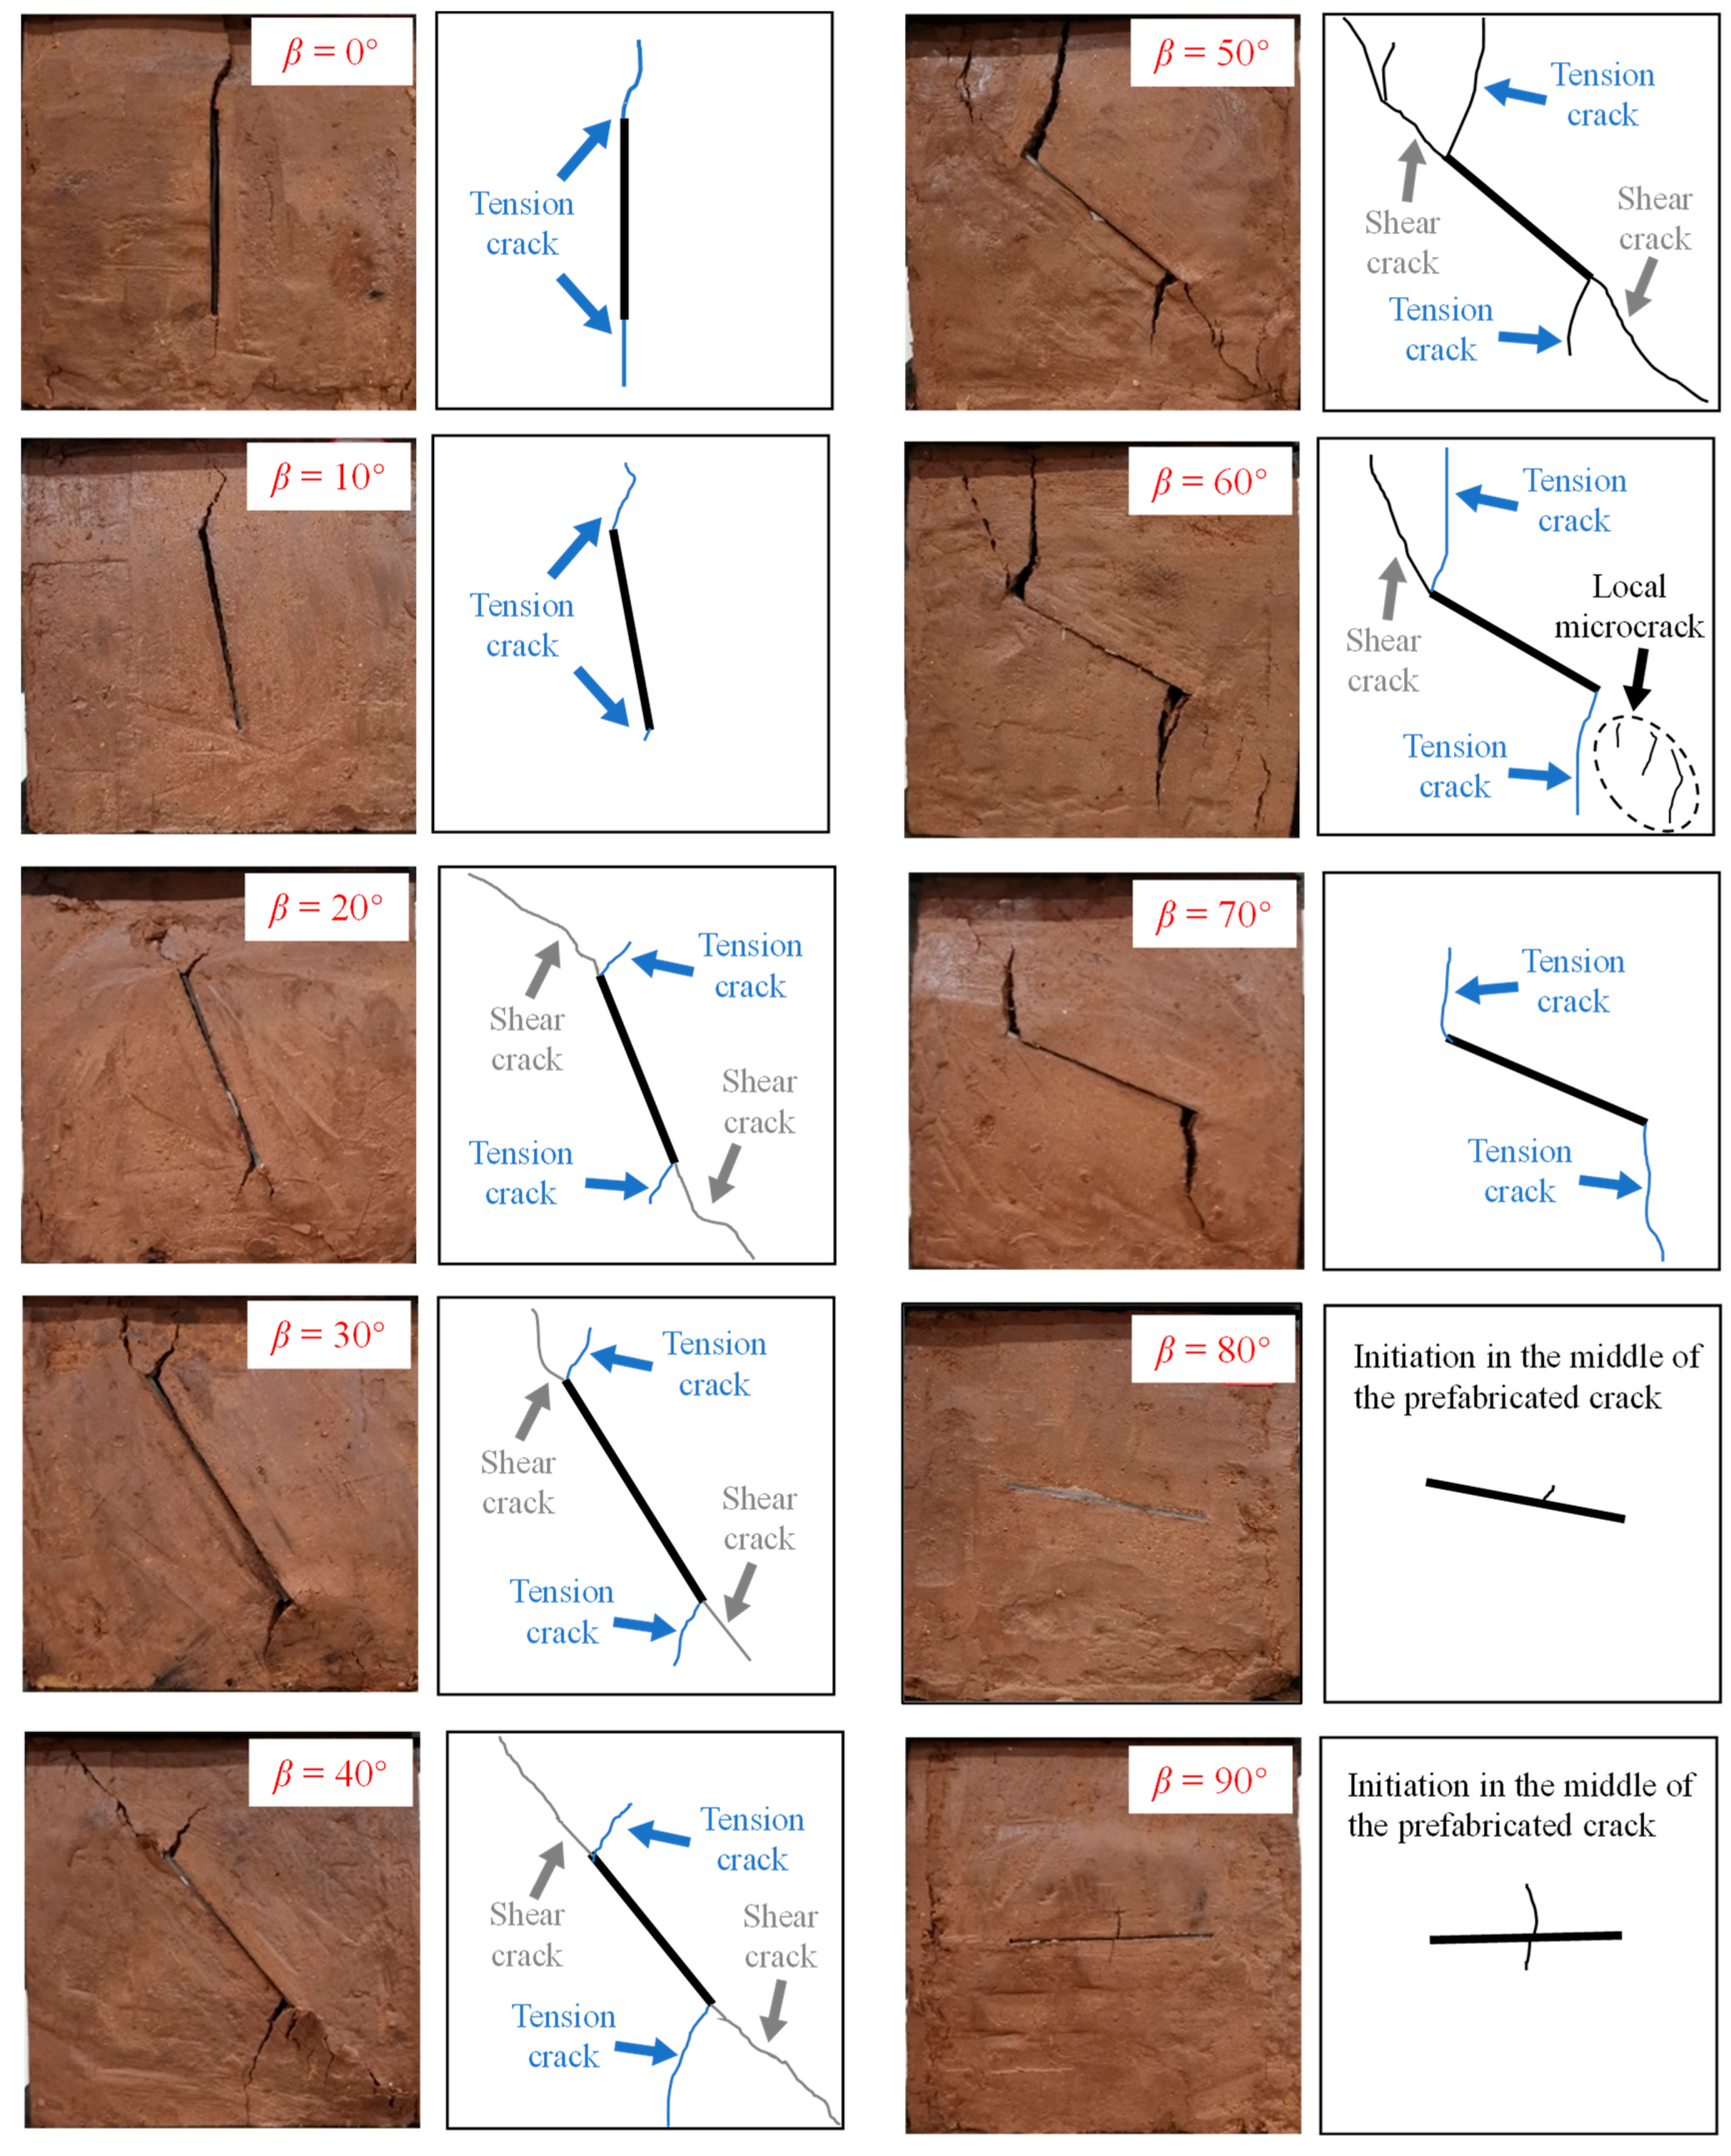
5.2. Crack Propagation Process

Photographs of the final failure mode of the specimen are shown in Figure 16. The left image is a photograph of the final failure mode and the right image is a sketch. When β = 0° and 10°, only wing-shaped tension cracks appeared at the ends of the pre-cracks, and no secondary shear cracks were observed throughout the loading process. From Figure 16, it can be seen that when β = 20°, 30°, 40°, 50° and 60°, during the loading process, the wing-type tension cracks appeared first at the ends of the pre-cracks, and the secondary shear cracks developed and propagated during the expansion of the wing-type tension cracks. When β = 70°, there were only wing-type tension cracks at the ends of the pre-cracks during loading. When β = 80° and 90°, the wing-type tension cracks did not initiate from the ends of the pre-cracks; instead, they appeared in the middle area of the pre-cracks. No secondary shear cracks occurred when the crack inclination angle was relatively small or large. The reason for the above phenomenon is as follows. The effective shear stress is high when the crack inclination angle is 10°–80°, leading to secondary shear cracks in the specimen. When the crack inclination angle is relatively small or large, the effective shear stress is minimal or zero, and therefore, tension cracks dominate.
The crack initiation characteristics of the specimen under the influence of dimensionless crack length are shown in Figure 17. When 2a/W = 0.2, the crack type was single, and there were only wing-type tension cracks during specimen loading. When 2a/W = 0.35, 0.5, and 0.65, wing-type tension cracks appeared at the end of the pre-cracks at the beginning of loading, and secondary shear cracks developed and expanded during the extension of the tension cracks. When the dimensionless crack length was large, the specimen was generally damaged into two parts by the original pre-cracks and secondary shear cracks penetrating through it.

6. Discussion

6.1. Comparison of Test Results and Theoretical Values at Different Crack Inclination Angles

Combining Equations (8) and (10) and taking the lateral pressure coefficient λ = 0 and the friction coefficient μ = 0.38, the theoretical prediction values of tension crack initiation angle corresponding to varying pre-rack inclination angles at different relative critical sizes α were calculated and compared with the experimental values. The comparison results are shown in Figure 18.
It can be seen that the theoretical and experimental values of crack initiation angle gradually increase with the increase in the crack inclination angle of the specimen, and the growth rate of the theoretical values of crack initiation angle at different relative critical sizes gradually decreases with the increase in the crack inclination angle. The experimental value of the crack initiation angle of the specimen agrees well with the theoretical value at the relative critical size α = 0.2, but the difference between the experimental value and the theoretical prediction is large when the crack inclination angle is greater than 80°. The reason for the deviation lies in that when the crack inclination is 80° and 90°, the cracks initiate from the middle of the pre-cracks, while the calculation theory assumes that the crack initiation occurs at the ends of the pre-cracks.
With α = 0.2, the critical size rc of the specimen was calculated as 0.75 mm. However, according to the Schmidt classical model, the rc calculated by Equation (11) is 12 mm, which differs significantly from the value (rc= 0.75) obtained by back-calculation based on the fitting results. When rc = 12 mm, the relative critical size α = 0.8. As can be seen from Figure 19, the theoretical prediction value of the tension crack initiation angle when α = 0.8 deviates significantly from the experimental value, and they are not in agreement. Wang et al. [46] found a similar pattern in the compression-shear fracture test of gypsum, and the rc obtained by back-calculation based on the test results was larger than that calculated by Equation (11), indicating that Equation (11) may not be suitable for the calculation related to compressive-shear mixed mode fractures.
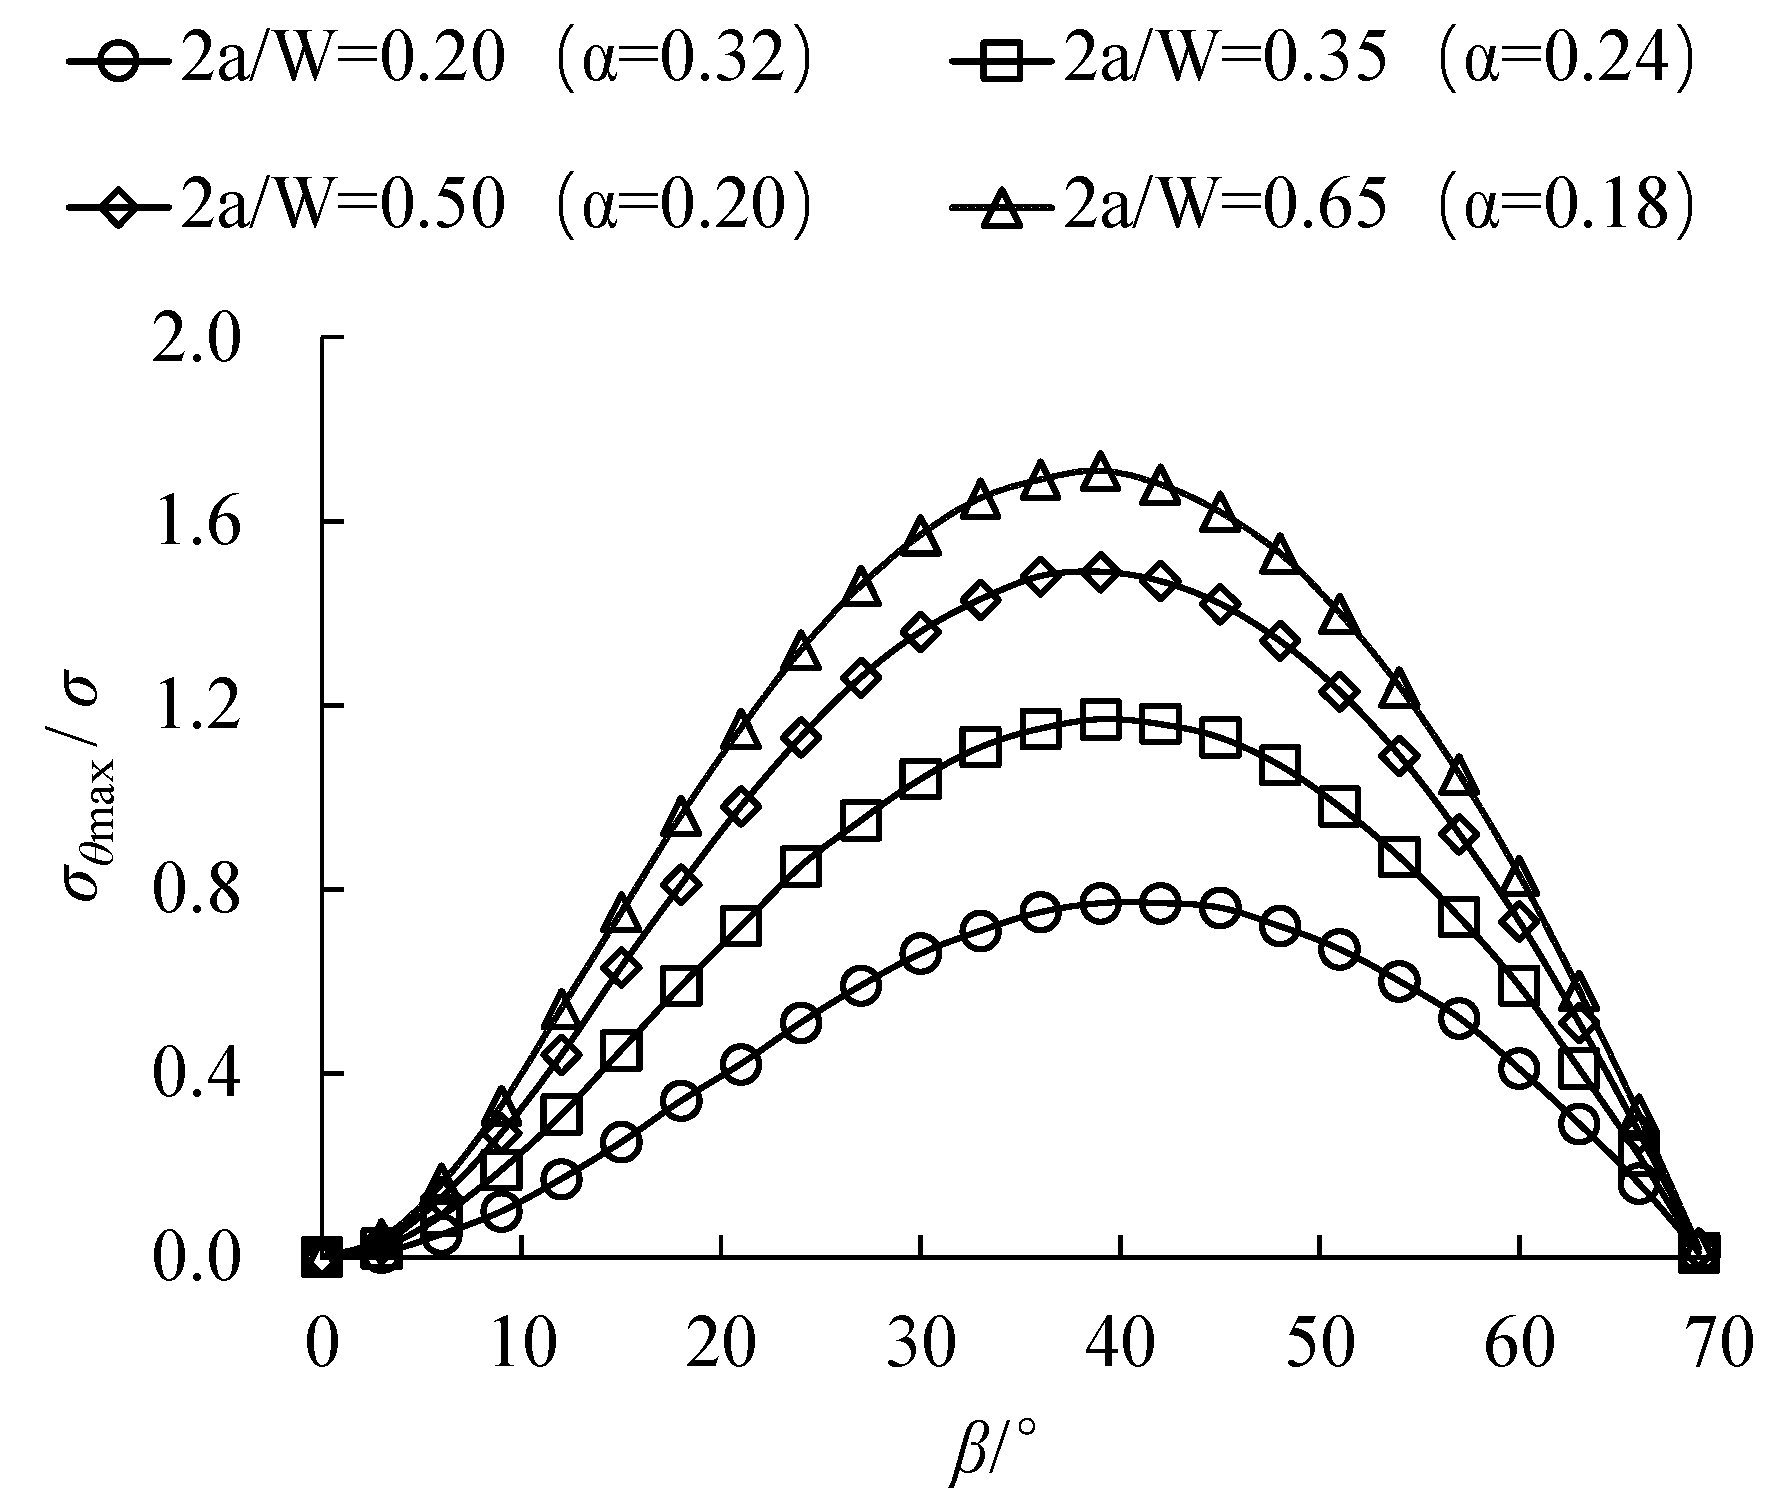
The influence of crack inclination angle on the distribution patterns of the maximum circumferential stresses obtained by fitting and empirical formula corresponding to two values of relative critical size α is shown in Figure 19. As can be seen from Figure 19, when the relative critical size α = 0.2, the maximum circumferential stress at the crack tip tends to increase and then decrease with the increase in the crack inclination angle, i.e., the crack initiation stress of the specimen should decrease and then increase with the increase in the crack inclination angle, and the maximum circumferential stress value is the largest when β = 40°. It is indicated that the minimum crack initiation stress corresponds to a crack inclination angle of 40°, which is consistent with the experimental result.
When the relative critical size α = 0.8, the maximum circumferential stress is 0 when the crack inclination angle is less than 30°, and no tension cracking occurs. However, according to the test phenomenon in Section 4.2, tension cracking occurs when the crack inclination angle is 10°, 20°, and 30° and when the relative critical size α = 0.8, the peak value of the maximum circumferential stress corresponds to a crack inclination angle of 50°, i.e., the minimum value of crack initiation stress corresponds to a crack inclination angle of 50°. The calculation result is inconsistent with the test result, which further illustrates the limitation of Equation (11).

6.2. Comparison of Experimental Results with Theoretical Values at Different Crack Lengths

The crack tip critical size of the 150-mm specimen obtained by back-calculation based on the fitting results is rc = 0.75 mm. Based on this value, the relative critical size α at different dimensionless crack lengths was calculated, and the distribution patterns of the maximum circumferential stress corresponding to various dimensionless crack lengths were plotted, as shown in Figure 20. It can be seen that when the compression-shear stress ratio is fixed (the crack inclination angle is the same), with a larger crack length, the relative critical size is smaller, the maximum circumferential stress is larger, and the specimen is more prone to tensile cracking. In other words, with a larger dimensionless crack length, the stress required for tensile cracking is lower, which is consistent with the experimental result.
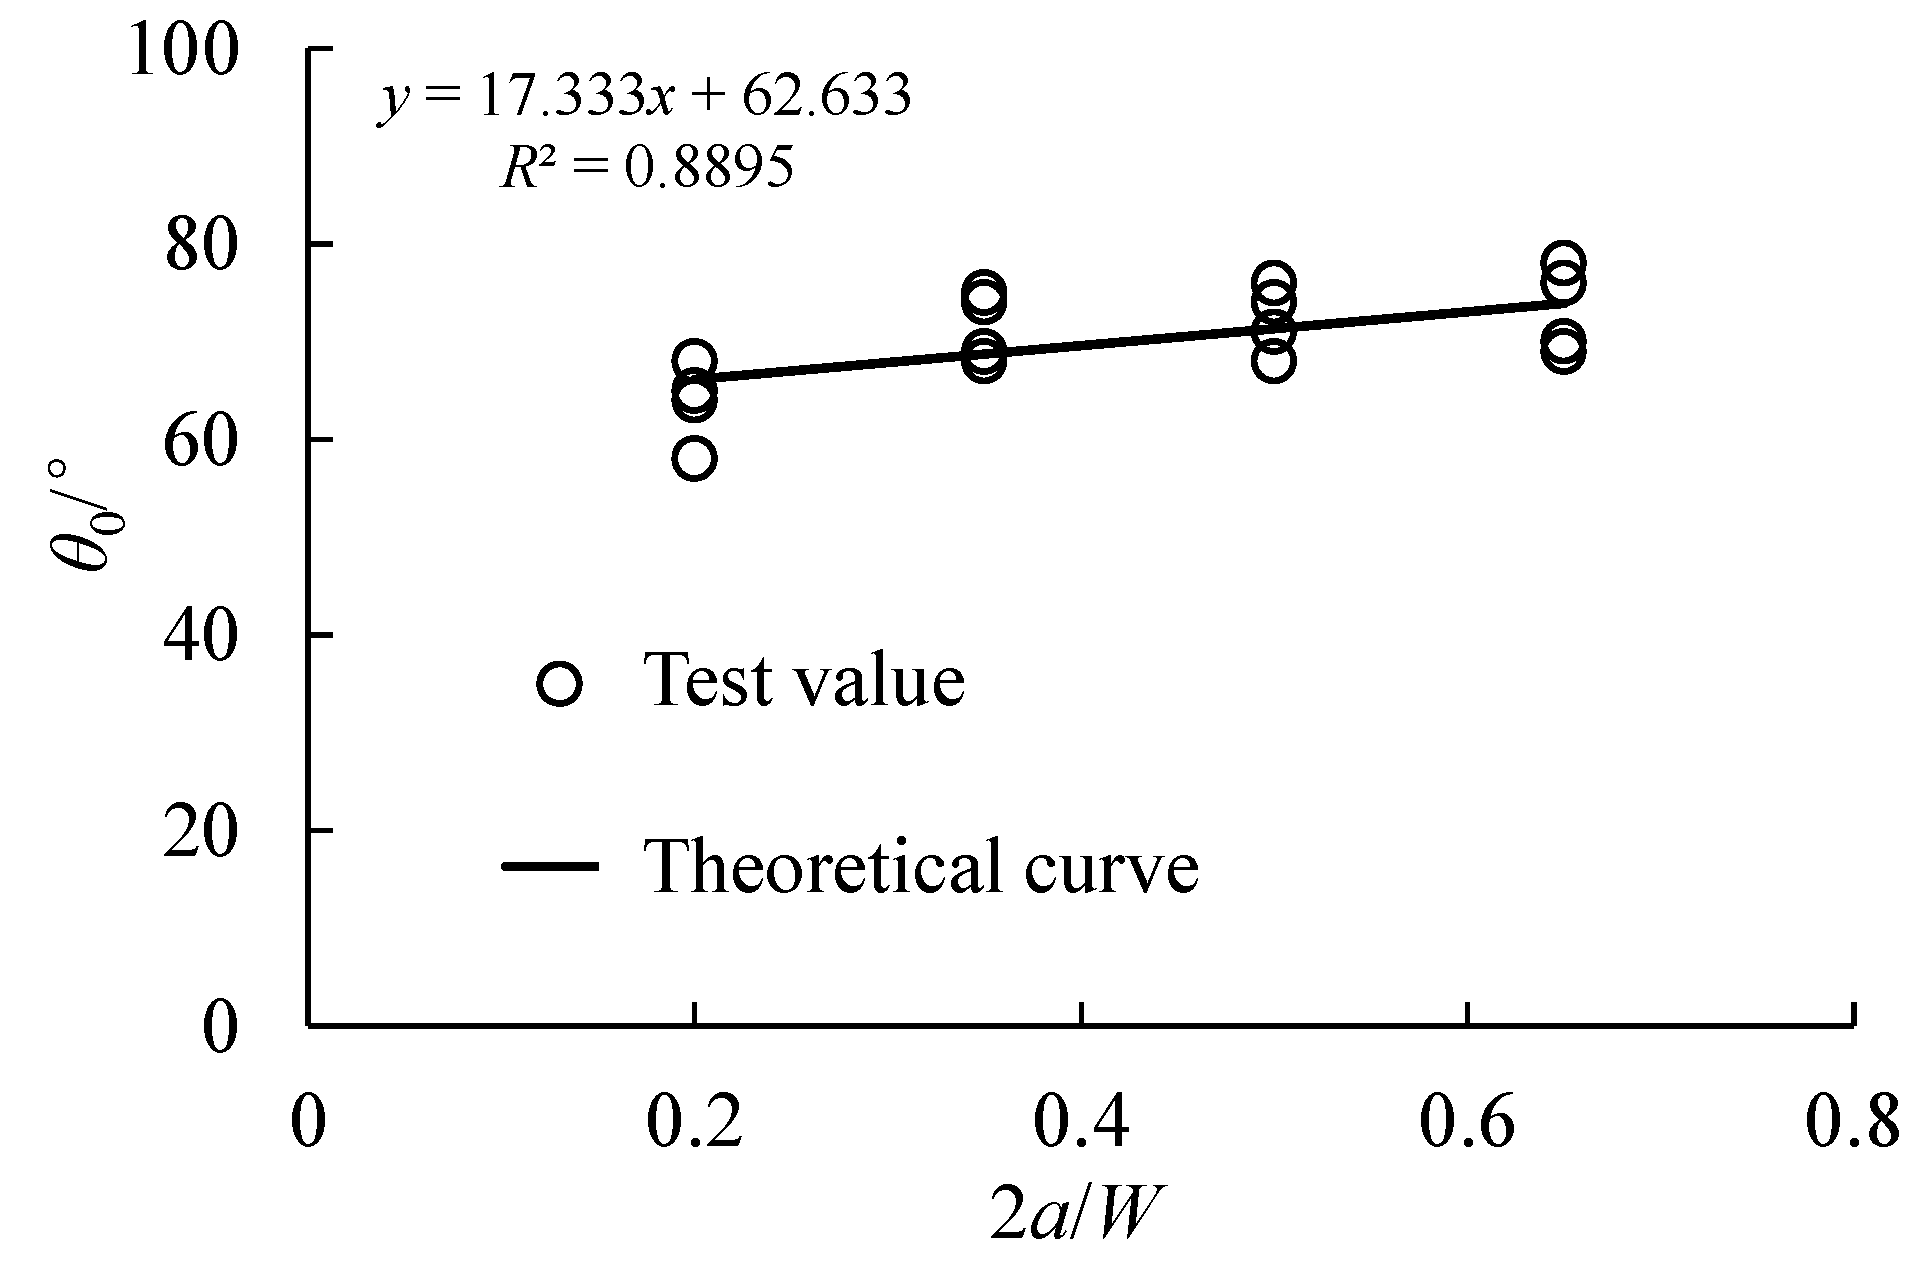
The theoretical prediction values of tension crack initiation angle under different dimensionless crack lengths when the crack inclination angle β = 30° were obtained by Equations (8) and (10) and compared with the experimental values, as shown in Figure 21. It can be seen that the tensile crack initiation angle of the specimen increases with increasing dimensionless crack length, and the theoretical values of the tensile crack initiation angle calculated based on the closed crack compression-shear-tension fracture criterion considering T-stress are closer to the experimental value, which proves the applicability and rationality of the criterion for analyzing the compression-shear fracture behavior of compacted clay.

7. Conclusions

(1) The maximum circumferential stress calculated based on the MTS criterion and the MTS criterion considering T-stress decreases with the increase in lateral pressure coefficient and friction coefficient; it first increases and then decreases with the increase in crack inclination angle β. The maximum circumferential stress obtained considering the T-stress is smaller.
(2) The crack initiation stress and peak stress of compacted clay first decrease with the rise in pre-crack inclination angle (β = 0°~40°), and then increase with the rise in pre-crack inclination angle (β = 50°~90°). The crack initiation stress and peak stress of compacted clay show a gradual decrease with the growth in dimensionless crack length. In addition, crack initiation all occurred during the linear phase of the stress-strain curve.
(3) When the pre-crack inclination angle is relatively small or large (β ≤ 10° or β ≥ 70°), the crack type is mainly tension cracks. Secondary shear cracks occur when the pre-crack inclination angle is 10°–80°. When the dimensionless crack length is larger than 0.35, the crack types include wing-type tension cracks and secondary shear cracks.
(4) By comparing the experimental and theoretical values of the crack initiation angle, the critical size rc of compacted clay is predicted to be 0.75 mm, which is smaller than the value calculated by the empirical formula (12 mm). The reason may be that the Schmidt classical model is derived from mode I crack, the calculated rc value could not represent the critical size of the crack tip.

Author Contributions

Conceptualization, S.H. and H.D.; Methodology, W.Y. and H.D.; Software, X.Z. and X.L.; Validation, S.H. and W.Y.; Formal analysis, S.H., X.Z. and W.Y.; Investigation, S.H., X.Z., W.Y. and X.L.; Resources, S.H., W.Y. and H.D.; Data curation, S.H., X.Z. and W.Y.; Writing—original draft preparation, S.H. and X.Z.; Writing—review and editing, S.H., H.D. and S.J.; Visualization, X.Z., X.L., H.D. and S.J.; Supervision, S.H. and H.D.; Funding acquisition, S.H. All authors have read and agreed to the published version of the manuscript.

Funding

This work was funded by the National Natural Science Foundation of China (Grant No. 52109113, 52209121), the Natural Science Foundation of Chongqing, China (cstc2021jcyj-msxmX1114), the Postdoctoral special Funding Project of Chongqing, China (2020921002), and the Ministry of Water Conservancy Embankment Safety and Disease Prevention Engineering Technology Research Center Open Subject Fund Funded Projects (LSDP202101).

Data Availability Statement

The data that supports the findings of this study are available within the manuscript.

Conflicts of Interest

The authors declare no conflict of interest.

References

  1. Xu, J.; Tang, C.; Cheng, Q.; Xu, Q.; Inyang, H.I.; Lin, Z.; Shi, B. Investigation on desiccation cracking behavior of clayey soils with a perspective of fracture mechanics: A review. J. Soil Sediment 2022, 22, 859–888. [Google Scholar] [CrossRef]
  2. Camp, S.; Gourc, J.P.; Ple, O. Landfill clay barrier subjected to cracking: Multi-scale analysis of bending tests. Appl. Clay Sci. 2010, 48, 384–392. [Google Scholar] [CrossRef]
  3. Zhang, H.; Jing, Y.; Chen, J.; Gao, Z.; Xu, Y. Characteristics and causes of crest cracking on a high core-wall rockfill dam: A case study. Eng. Geol. 2022, 297, 106488. [Google Scholar] [CrossRef]
  4. Ji, E.; Fu, Z.; Chen, S.; Zhu, J.; Geng, Z. Numerical Simulation of Hydraulic Fracturing in Earth and Rockfill Dam Using Extended Finite Element Method. Adv. Civ. Eng. 2018, 2018, 1782686. [Google Scholar] [CrossRef]
  5. Thusyanthan, N.I.; Take, W.A.; Madabhushi, S.P.G.; Bolton, M.D. Crack initiation in clay observed in beam bending. Géotechnique 2007, 57, 581–594. [Google Scholar] [CrossRef] [Green Version]
  6. Liu, H.; Lin, J.; He, J.; Xie, H. Dominant mode of planar fractures and the role of material properties. Eng. Fract. Mech. 2018, 195, 57–79. [Google Scholar] [CrossRef]
  7. Skempton, A.W.; Schuster, R.L.; Petley, D.J. Joints and Fissures in The London Clay at Wraysbury and Edgware. Géotechnique 1970, 20, 208–209. [Google Scholar] [CrossRef]
  8. Qiao, L.; Liu, J.; Li, X.; Li, Q.; Xie, J. Experimental study on mode I fracture characteristics of compacted bentonite clay. Eng. Fract. Mech. 2023, 285, 109294. [Google Scholar] [CrossRef]
  9. Wang, J.; Huang, S.; Guo, W.; Qiu, Z.; Kang, K. Experimental study on fracture toughness of a compacted clay using semi-circular bend specimen. Eng. Fract. Mech. 2020, 224, 106814. [Google Scholar] [CrossRef]
  10. Wang, J.; Huang, S.; Hu, J. Limit of crack depth in KIC testing for a clay. Eng. Fract. Mech. 2016, 164, 19–23. [Google Scholar] [CrossRef]
  11. Wang, J.; Zhu, J.; Chiu, C.F.; Zhang, H. Experimental study on fracture toughness and tensile strength of a clay. Eng. Geol. 2007, 94, 65–75. [Google Scholar] [CrossRef]
  12. Amarasiri, A.L.; Costa, S.; Kodikara, J.K. Determination of cohesive properties for mode I fracture from compacted clay beams. Can. Geotech. J. 2011, 48, 1163–1173. [Google Scholar] [CrossRef]
  13. Williams, J.G.; Ewing, P.D. Fracture under complex stress—The angled crack problem. Int. J. Fract. Mech. 1972, 8, 441–446. [Google Scholar] [CrossRef]
  14. Fan, Y.; Zhu, Z.; Zhao, Y.; Zhou, L.; Qiu, H.; Niu, C. Analytical solution of T-stresses for an inclined crack in compression. Int. J. Rock Mech. Min. 2021, 138, 104433. [Google Scholar] [CrossRef]
  15. Sakha, M.; Nejati, M.; Aminzadeh, A.; Ghouli, S.; Saar, M.O.; Driesner, T. On the validation of mixed-mode I/II crack growth theories for anisotropic rocks. Int. J. Solids Struct. 2022, 241, 111484. [Google Scholar] [CrossRef]
  16. Ayatollahi, M.R.; Aliha, M.R.M. On the use of Brazilian disc specimen for calculating mixed mode I–II fracture toughness of rock materials. Eng. Fract. Mech. 2008, 75, 4631–4641. [Google Scholar] [CrossRef]
  17. Zhao, Y.; Wang, Y.; Tang, L. The compressive-shear fracture strength of rock containing water based on Druker-Prager failure criterion. Arab. J. Geosci. 2019, 12, 452. [Google Scholar] [CrossRef]
  18. Sun, D.; Rao, Q.; Wang, S.; Shen, Q.; Yi, W. Shear fracture (Mode II) toughness measurement of anisotropic rock. Theor. Appl. Fract. Mec. 2021, 115, 103043. [Google Scholar] [CrossRef]
  19. Miao, S.; Pan, P.; Yu, P.; Zhao, S.; Shao, C. Fracture analysis of Beishan granite after high-temperature treatment using digital image correlation. Eng. Fract. Mech. 2020, 225, 106847. [Google Scholar] [CrossRef]
  20. Liu, H. Wing-crack initiation angle: A new maximum tangential stress criterion by considering T-stress. Eng. Fract. Mech. 2018, 199, 380–391. [Google Scholar] [CrossRef]
  21. Erdogan, F.; Sih, G.C. On the Crack Extension in Plates Under Plane Loading and Transverse Shear. J. Basic Eng. 1963, 85, 519–525. [Google Scholar] [CrossRef]
  22. Irwin, G. Analysis of Stresses and Strains Near End of a Crack Traversing a Plate. J. Appl. Mech. 1957, 24, 361–364. [Google Scholar] [CrossRef]
  23. Zhang, X.; Wong, L.N.Y. Cracking Processes in Rock-Like Material Containing a Single Flaw Under Uniaxial Compression: A Numerical Study Based on Parallel Bonded-Particle Model Approach. Rock Mech. Rock Eng. 2011, 45, 711–737. [Google Scholar] [CrossRef]
  24. Lin, H.; Yang, H.; Wang, Y.; Zhao, Y.; Cao, R. Determination of the stress field and crack initiation angle of an open flaw tip under uniaxial compression. Theor. Appl. Fract. Mec. 2019, 104, 102358. [Google Scholar] [CrossRef]
  25. Smith, D.J.; Ayatollahi, M.R.; Pavier, M.J. The role of T-stress in brittle fracture for linear elastic materials under mixed-mode loading. Fatigue Fract. Eng. M 2001, 24, 137–150. [Google Scholar] [CrossRef]
  26. Aminzadeh, A.; Bahrami, B.; Ayatollahi, M.R.; Nejati, M. On the role of fracture process zone size in specifying fracturing mechanism under dominant modeII loading. Theor. Appl. Fract. Mec. 2022, 117, 103150. [Google Scholar] [CrossRef]
  27. Wei, M.; Dai, F.; Liu, Y.; Li, A.; Yan, Z. Influences of Loading Method and Notch Type on Rock Fracture Toughness Measurements: From the Perspectives of T-Stress and Fracture Process Zone. Rock Mech. Rock Eng. 2021, 54, 4965–4986. [Google Scholar] [CrossRef]
  28. Cotterell, B. Brittle fracture in compression. Int. J. Fract. Mech. 1972, 8, 195–208. [Google Scholar] [CrossRef]
  29. Ayatollahi, M.R.; Rashidi Moghaddam, M.; Berto, F. T-stress effects on fatigue crack growth—Theory and experiment. Eng. Fract. Mech. 2018, 187, 103–114. [Google Scholar] [CrossRef] [Green Version]
  30. Tang, S.; Dong, Z.; Huang, R. Determination of T-stress using finite element analysis. Sci. China Technol. Sci. 2017, 60, 1211–1220. [Google Scholar] [CrossRef]
  31. Ayatollahi, M.R.; Pavier, M.J.; Smith, D.J. Mode I cracks subjected to large T-stresses. Int. J. Fract. 2002, 117, 159–174. [Google Scholar] [CrossRef]
  32. Roychowdhury, S.; Dodds, R.H. Effect of T-stress on fatigue crack closure in 3-D small-scale yielding. Int. J. Solids Struct. 2004, 41, 2581–2606. [Google Scholar] [CrossRef]
  33. Aliha, M.R.M.; Ayatollahi, M.R.; Smith, D.J.; Pavier, M.J. Geometry and size effects on fracture trajectory in a limestone rock under mixed mode loading. Eng. Fract. Mech. 2010, 77, 2200–2212. [Google Scholar] [CrossRef]
  34. Nasiraldin Mirlohi, S.; Aliha, M.R.M. Crack growth path prediction for the angled cracked plate using higher order terms of Williams series expansion. Eng. Solid Mech. 2013, 1, 77–84. [Google Scholar] [CrossRef] [Green Version]
  35. Mousavi, S.S.; Aliha, M.R.M.; Imani, D.M. On the use of edge cracked short bend beam specimen for PMMA fracture toughness testing under mixed-mode I/II. Polym. Test 2020, 81, 106199. [Google Scholar] [CrossRef]
  36. Torabi, A.R.; Jabbari, M.; Akbardoost, J. Mixed mode notch fracture toughness assessment of quasi-brittle polymeric specimens at different scales. Theor. Appl. Fract. Mec. 2020, 109, 102682. [Google Scholar] [CrossRef]
  37. Aliha, M.R.M.; Mousavi, S.S. Sub-sized short bend beam configuration for the study of mixed-mode fracture. Eng. Fract. Mech. 2020, 225, 106830. [Google Scholar] [CrossRef]
  38. Bahmani, A.; Aliha, M.R.M.; Jebalbarezi Sarbijan, M.; Mousavi, S.S. An extended edge-notched disc bend (ENDB) specimen for mixed-mode I+II fracture assessments. Int. J. Solids Struct. 2020, 193–194, 239–250. [Google Scholar] [CrossRef]
  39. Tang, S.B.; Bao, C.Y.; Liu, H.Y. Brittle fracture of rock under combined tensile and compressive loading conditions. Can. Geotech. J. 2017, 54, 88–101. [Google Scholar] [CrossRef] [Green Version]
  40. Sih, G.C. Strain-energy-density factor applied to mixed mode crack problems. Int. J. Fract. 1974, 10, 305–321. [Google Scholar] [CrossRef]
  41. Nuismer, R.J. An energy release rate criterion for mixed mode fracture. Int. J. Fract. 1975, 11, 245–250. [Google Scholar] [CrossRef]
  42. Chen, H.; Xing, H.; Imtiaz, H.; Liu, B. How to obtain a more accurate maximum energy release rate for mixed mode fracture. Forces Mech. 2022, 7, 100077. [Google Scholar] [CrossRef]
  43. Tang, S.B. The effect of T-stress on the fracture of brittle rock under compression. Int J Rock Mech Min 2015, 79, 86–98. [Google Scholar] [CrossRef]
  44. Schmidt, R. A microcrack model and its significance to hydraulic fracturing and fracture toughness testing. In Proceedings of the 21st U.S. Symposium on Rock Mechanics (USRMS), Rolla, MI, USA, 27–30 May 1980; pp. 581–590. [Google Scholar]
  45. Ayatollahi, M.R.; Razavi, S.M.J.; Berto, F. Crack path stability in brittle fracture under pure mode I loading. Procedia Struct. Integr. 2018, 13, 735–740. [Google Scholar] [CrossRef]
  46. Wang, J.; Lv, C.; Huang, S.; Qiu, Z. Size effect on fracture behavior of quasi-brittle materials during uniaxial compression tests. Arch. Appl. Mech. 2023, 93, 3171–3188. [Google Scholar] [CrossRef]
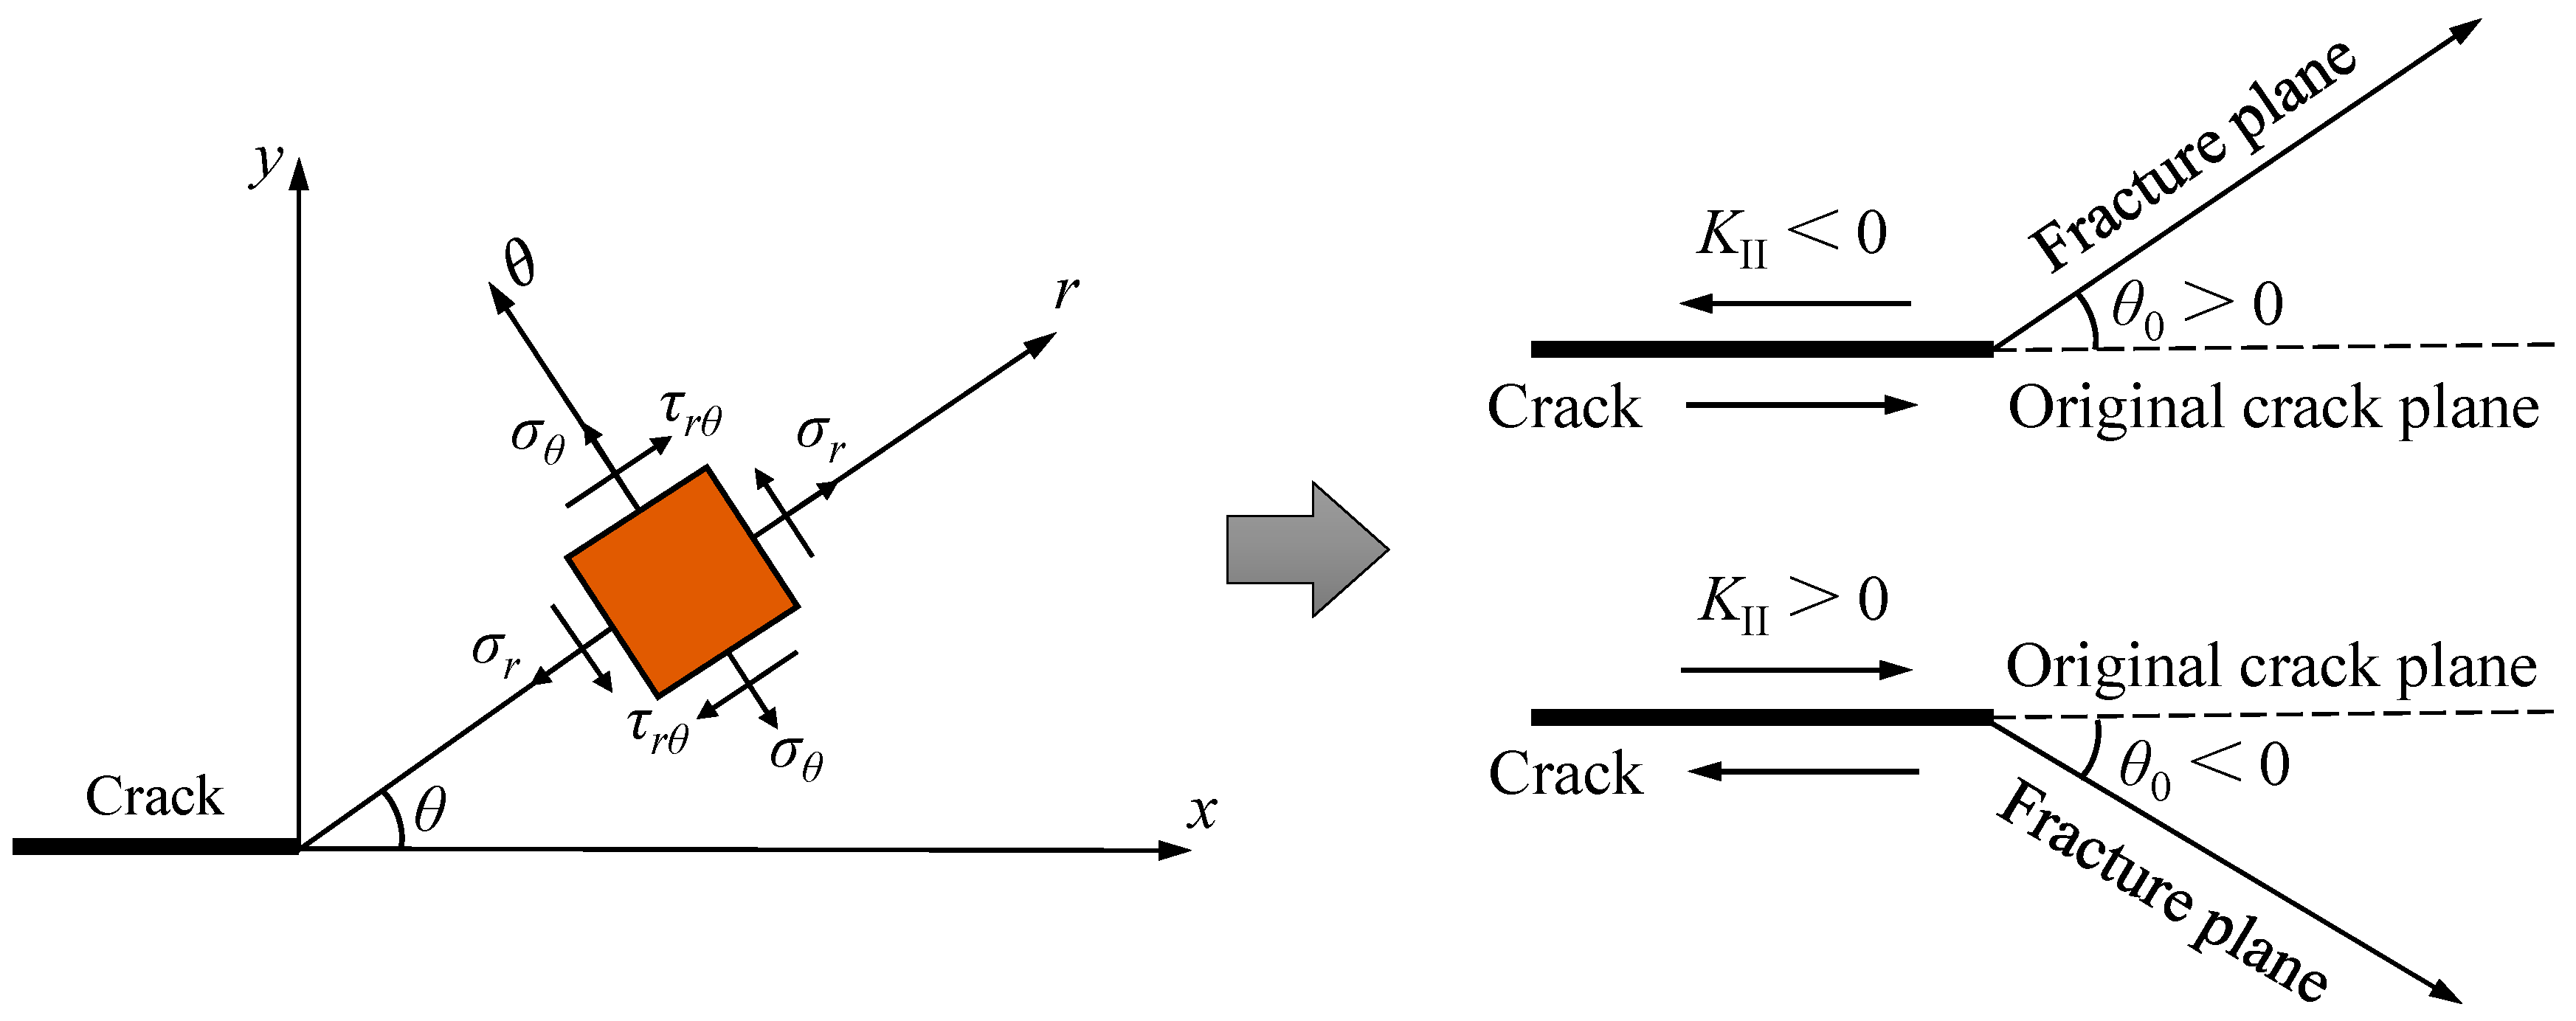
Figure 1. Stress field at the crack tip and crack initiation direction.
Symmetry 15 01519 g001
Figure 2. Stress field of central inclined crack under biaxial compression.
Symmetry 15 01519 g002
Figure 3. Effect of lateral pressure coefficient λ on the circumferential stress at the crack tip. (a) Circumferential stress distribution; (b) Maximum circumferential stress.
Symmetry 15 01519 g003
Figure 4. Effect of crack inclination angle β on the dimensionless circumferential stress distribution. (a) Ignoring T-stress; (b) Considering T-stress.
Symmetry 15 01519 g004
Figure 5. Effect of crack inclination angle β on the maximum dimensionless circumferential stress.
Symmetry 15 01519 g005
Figure 6. Effect of friction coefficient μ on the circumferential stress at the crack tip (β = 45°). (a) Circumferential stress distribution; (b) Maximum circumferential stress.
Symmetry 15 01519 g006
Figure 7. Effect of relative critical size α on the maximum dimensionless circumferential stress. (a) β = 15°; (b) β = 75°.
Symmetry 15 01519 g007
Figure 8. Effect of relative critical size α on the maximum dimensionless circumferential stress.
Symmetry 15 01519 g008
Figure 9. Specimen compaction container and pre-cracking mold.
Symmetry 15 01519 g009
Figure 11. Specimens with different crack inclination angles.
Symmetry 15 01519 g011
Figure 12. Specimens with different crack lengths (β = 30°).
Symmetry 15 01519 g012
Figure 13. Stress-strain curve. (a) Different pre-crack inclination angle; (b) Different dimensionless crack lengths.
Symmetry 15 01519 g013
Figure 14. Effect of crack inclination angle on strength properties of specimens with closed cracks.
Symmetry 15 01519 g014
Figure 15. Effect of dimensionless crack length on strength properties of specimens with closed cracks.
Symmetry 15 01519 g015
Figure 16. Effect of crack inclination angle on the closed crack initiation characteristics.
Symmetry 15 01519 g016
Figure 17. Effect of dimensionless crack length on the fracture initiation characteristics of closed cracks.
Symmetry 15 01519 g017
Figure 18. Experimental and theoretical values of tension crack initiation angle for specimens with different crack inclination angles.
Symmetry 15 01519 g018
Figure 19. Variation of maximum circumferential stress at the crack tip with the crack inclination angle.
Symmetry 15 01519 g019
Figure 20. Effect of dimensionless crack length on maximum circumferential stress at the crack tip.
Symmetry 15 01519 g020
Figure 21. Effect of dimensionless crack length on the tension crack initiation angle of compression-shear closed cracks.
Symmetry 15 01519 g021
Table 1. Test protocol.
Test Protocolβ2a/W
1~100, 10, 20, 30, 40, 50, 60, 70, 80, 900.5
11~13300.15, 0.35, 0.65
Disclaimer/Publisher’s Note: The statements, opinions and data contained in all publications are solely those of the individual author(s) and contributor(s) and not of MDPI and/or the editor(s). MDPI and/or the editor(s) disclaim responsibility for any injury to people or property resulting from any ideas, methods, instructions or products referred to in the content.