Abstract
This research articles proposes a comparative symmetric examination of the four maximum-power point-tracking algorithms under partial shaded conditions, including Conservative MPPT, Grey Wolf Optimization, and Fast Terminal Sliding Mode MPPT. In addition, the genetic algorithm MPPT, particle-swarm optimization MPPT, Grey Wolf optimization MPPT, and perturb and observe MPPT are included in this study. A smart method was to use Fast Terminal Sliding Mode Grey Wolf Optimization algorithms under partly shadowed situations on a global MPPT. This study included a GWO methodology that successfully set the efficient FTSM controller parameters such that the global maximum-power photovoltaic (PV) device point-tracking was monitored under partial shading. In the MATLAB setting and test performance, it was programmed for the suggested methodology of changing the shade pattern status dynamically. The findings were assessed and compared with other symmetric algorithms. Unlike other algorithms, the methodology used herein wasa less accurate way to monitor a global MPP. These methods were also evaluated and contrasted with PV arrays under various partial shadowing circumstances. The experimental investigations were used to verify the control techniques and stability analysis based on the asymmetric nonlinear load method of analysis in a closed-loop design.
1. Introduction
Nearly all countries around the world are using various advantages, such as lower greenhouse gas emissions, unstoppable solar power, environmental sources, etc. as alternatives to photovoltaic (PV) systems. By 2022, India had planned to produce 100 GW of power in large and small solar parks to meet its growing demand for electricity [1]. These photovoltaic units must be run on an equal footing in a single- or two-diode variant to ensure optimal production at a maximum-power point (MPP) due to their low power output. Such PV devices include Perovskite solar cells (PSCs), and their photovoltaic modules are only operable under certain environmental conditions (due to moving fog, shadows, waste of birds, etc.) If a PSC is non-linear, it must then operate on global maximum-power point-tracking (GMPPT) due to the bypass diode function of a shaded module [2]. A PSC’s influence is reduced by many of the forms in which MPPT controllers, PV array renovations, electronic power convertor settings, are presented. Our study consisted of using an MPPT controller in a PSC MPP for a global PV system. Whilst classical MPPT methodologies, including perturbation and observation (P&O), incremental behavior, hill climbing, etc., are capable of tracking MPPs in a consistent shady state, global PSC-MPPs cannot [3,4,5,6,7,8,9]. Though some writers [10,11,12,13,14,15] have focused on intelligence techniques such as an ANN structure or a fuzzy structure to achieve a PSC’s highest strengths, they require adequate planning and method-based formulations. Due to their precision and system independence, metaheuristic MPPT techniques have recently become popular [16,17,18]. ventured of researchers have proposed MPPT algorithms that concentrate on particle-swarm optimization (PSO) [19], such as the Cuckoo Search [20], Grey Wolf Optimization (GWO) [21], and Whale Optimization algorithms. Some authors have suggested MPPT algorithms based on the optimization of particle swarms [22]. All of these algorithms vary greatly in their efficiency, performance, time, and complexity [23]. A new hybrid MPPT algorithm that combines Grey Wolf Optimization (GWO) and the perturb an dobserve (P&O) technique was used for tracking techniques [24]. Overt and indirect control methods are also referred to as MPPT strategies based on the vector determination they use to follow an MPP. α and β wolves are used in the quest mechanism in standard GWO algorithms since the wolves are below α and β [25]. The conventional perturb and observe technique has been combined with soft computing techniques to enable more efficiency in using an MSX-64 module is presented [26]. The reliability problem of PV models when using different combinations of PV cells has led to hot-spotting damages, and these have been addressed [27]. Modified cuckoo search algorithms with PSO have been introduced to harvest maximum power [28]. Global maximum-power point-tracking is used to control the harvesting of the PV power, and the frog leaping algorithm has been utilized here to tackle the MPPT [29]. Modified particle-swarm optimization (MPSO) techniques have been adapted to increase the output power of PV systems under abnormal conditions to achieve better performance compared to other methods [30]. To reduce the effect of partially shaded conditions, hybrid PV array configurations, such as series-parallel: total-cross-tied (SP-TCT), have been proposed to address the issues [30], and the author made a remarkable comparison of existing maximum-power point-tracking systems with different algorithms [31].
The contributions of this paper are:
- A comparative analysis using MPPT algorithms with the P&O, GA, PSO, GWO, and GWO-FTSM algorithms
- A comparative analysis carried out to validate the proficiency of PV systems in two separate cases
The organization of this paper is as follows: Section 2 defines the proposed system. The proposed algorithm’s FTSM description is provided in Section 3, and the simulation results are provided in Section 4. In addition, there is a presentation on the effectiveness of the MPPT algorithms and a comparative analysis. In Section 5, we discuss the experimental results. Finally, conclusions are provided in Section 6.
2. Proposed System Modeling
2.1. PV Modeling
The proposed PV cell with an interleaved boost inverter and GWO with a TSMC is presented in the Figure 1. A typical solar equivalent cell consists of a PN layer formed using a semiconductor material similar to a diode. It acts either as a voltage source or as a current source. An equivalent PV model of a solar cell is shown in Figure 2, and the current source with an anti-parallel series-related diode and parallel resistance are presented. The circuit description and complete mathematical modeling are described in detail in [20,27].
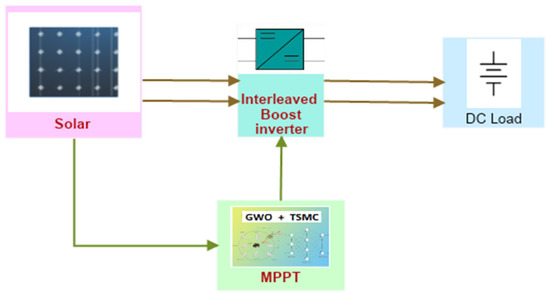
Figure 1.
Block diagram of the proposed system.
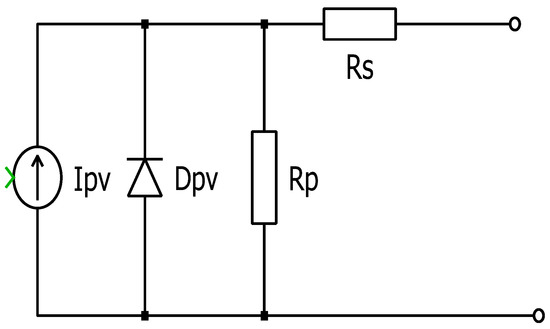
Figure 2.
Equivalent PV model.
2.2. Interleaved Boost Converter
The circuit configuration of the interlocking boost converter, as seen in Figure 3, is intended to maximize power-processing capacity for operating solar systems at maximum capacity. The interlinked topology step-up converters working at 180° degree binary branches from each other. Typically, each procedure works in the same way as a standard boost converter, as described above. The current increases in the inductor L2 whenever two switches are turned on. At this time, the diode D2, which is an energy-saving induction source (S2), has been turned off so that the output voltages are higher than the input voltages.If two switches, S1 and S2, are switched off, the two diodes, D1 and D2, connect and provide the capacitor with energy and load and the two ramps with a path downstream current, depending on the difference between the source voltage and the load voltage. Applying a transition to complete the same case will loop one-half of a switching time later. Due to an efficient improvement in the switching frequency, the interleaved boost converter can offer a low winging strength at the input level, thereby the minimizing output and input condenser Cin the filters, which are comparatively high if a traditional boost transformer is used [11]. Additionally, the transfer and division of the current between the two arms lead to better stability, minimizing major power losses (I2R). Moreover, the changing of the input current between both weapons dramatically reduces power losses by shifting and dividing them (I2R). In addition, the converter puts low stress on the passive and active components because of the existing partitions, which increase the power-processing capacity [12,13,14,15]. On the other hand, with a connected boost converter, the sum of the topology components can lead to higher costs. Optimization-based tuning of the FTSM controller is shown in Figure 4.
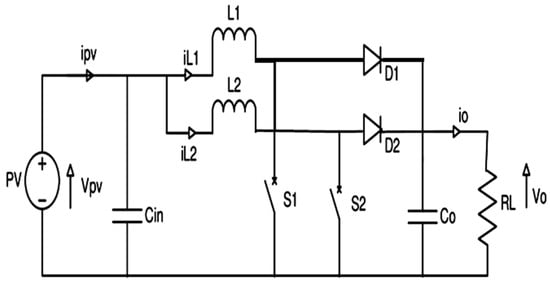
Figure 3.
Interleaved boost converter.
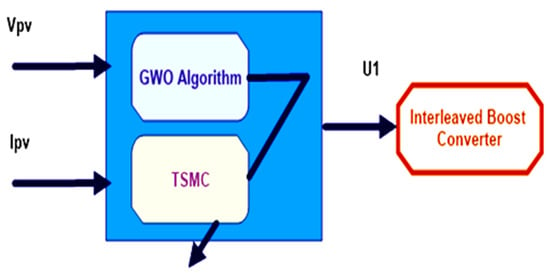
Figure 4.
Optimization-based tuning of an FTSM controller.
3. Fast Terminal Sliding Mode Algorithm
A maximum-power point is obtained when , where ,
To minimize the error, E = .
The regulator output is equal to theduty cycle correction, and with respect to the above equations, is the change in the power (in watts), is the change in the photovoltaic voltage (in volts), and is the change in photovoltaic current (in amps).
3.1. PSO MPPT Algorithm
PSO is a socio-psychological optimization algorithm [18,19]. This algorithm is also based on a population-based search method, with each position identified as an element that is updated regularly, thereby enabling it to keep track of its position and its fitness in the search area to achieve the most effective solution.
The PSO algorithm shows improvements in its particle velocity, and each interaction corresponds to the best solution both locally and globally. For each event, the acceleration parameter is random and separate. The inertia weight w, for the purposes of this study, was defined as 0.1, and the damping ratio for the inertia was set to 0.99, the personal coefficient of learning (C1) was set to 1.5, the global learning coefficient (C2) was set to 2, and the particle speed was fixed at [−0.085, 0.085] (its maximum and minimum, respectively). The PSO-based MPPT algorithms are explained in [18]. The PSO-based MPPT procedure flow map is shown in Figure 5.
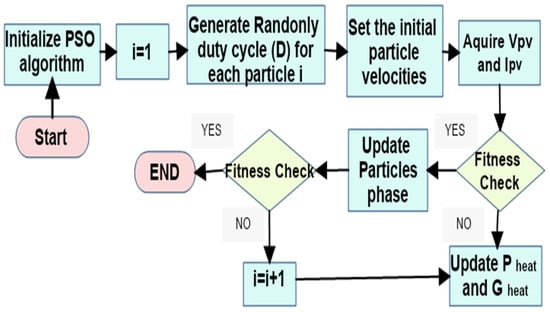
Figure 5.
PSO algorithm: the step-by-step procedure.
3.2. GWO MPPT Algorithm
The GWO is an organic algorithm focused on grey wolves’ comportment in the quest for a beast. This algorithm attempts to replicate the behavior of grey wolves with their known hierarchy using four groups of wolves: alpha (α), beta (β), gamma (γ), and omega-fasts [17]. The parameters α, β, γ, and ω represent the leadership of the pyramid in which the α wolves decide on the quest field, the second(β) is a leader, and the third (γ) is a leader that helps the alpha leader make decisions while the rest have to obey the leaders’ decisions. The GWO-based MPPT algorithm is explained in full and in-depth in [17]. Figure 6 shows a flow diagram of the GWO-based MPPT process in which Pbest,I refers to the best I iteration solution and Gbest refers to the best solution found globally by wolves.
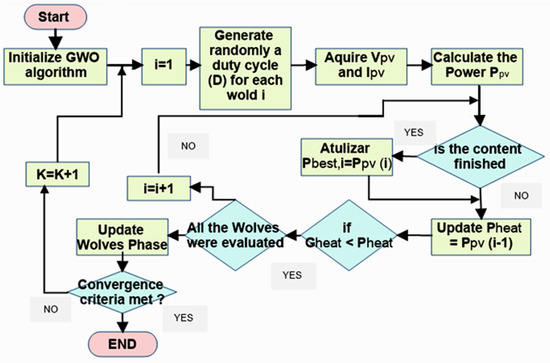
Figure 6.
Step-by-step procedure of the GWO and the controller design.
3.3. Perturb and ObserveAlgorithm
In this study, the perturb and observe (P&O) MPPT algorithm was simulated, along with a boost converter for the maximum utilization of available power [26]. Figure 7 shows the flow of the system used for the simulation.
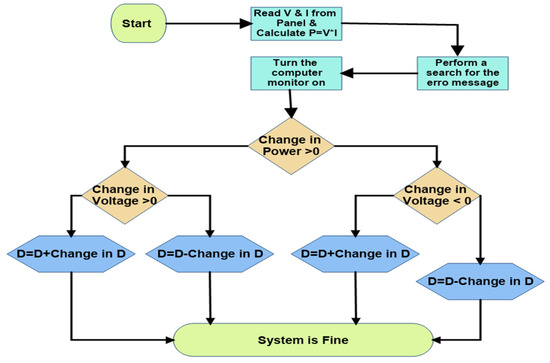
Figure 7.
Step-by-step procedure of the P&O algorithm.
3.4. Proposed System
The strategy of the FTSM switches involved the tuning of a set of unknown parameters (αk, βk, γk, and λk),as shown in Figure 4. The assortment of these operative bounds was a hard and time-consuming problem. Since the iterative trial and error procedures had become ineffective, such a tuning problem was formulated as a constrained optimization program as follows [25]: The designed controllers were used to allow Vpv to reach the MPPT reference voltage (Vref). When Vpv attained nVref, the entire PV system would operate at the peak of the Ppv—Vpv curve during the MPPT searching algorithm adjustment.
4. Simulation Results and Discussion
To validate the concepts presented, simulation and experimental testing were conducted. The comparisons were made with the different P&O, GA, PSO, and GWO methodologies. The controller’s aim was to adjust the duty cycle D. The maximum strength of the GWO-FTSM panel optimization technique was adopted for the MPPT for this proposed model. This problem was designed and simulated in MATLAB/Simlink, and the maximum energy harvested by the solar panel was evaluated. The step-by-step procedure of the GA methodology is shown in Figure 8.
where refer to the leadership in the pyramid, is the scaling factor, VPV is the photovoltaic voltage (in volts), IPV is the photovoltaic current (in amps), Vref is the reference voltage (in volts), R is the effective resistance (in ohms), and Rs is the shunt resistance (in ohms).
k1 (t) = VPV (t), k2 (t) = IPV (t), k3 (t) = Vb (t), kref(t) = Vref (t),
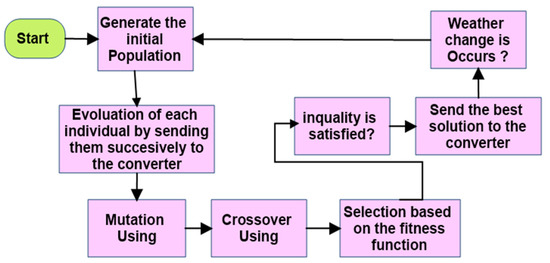
Figure 8.
Step-by-step procedure of the GA methodology.
The model included a solar panel, an optimization technique MPPT block, and a conversion converter which was used at the end to increase the DC capacity.
4.1. Case 1
The simulation was conducted with the following parameters: E = 1000 W/m2 and T = 25 °C, with subsequent measures applied at t1 = 0 to 0.25 (500 W/m2), t2 = 0.25 to 0.5 (750 W/m2), t3 =0.5 to 0.95 (1000 W/m2), t4 = 1750 W/m2, and t5 = 1000 W/m2, as shown in Figure 9a,b. The simulation was conducted with the starting conditions E = 1000 W/m2 and T = 25 °C. In order to equate this in the proposed GWO-FTSM, which would control the performance, the same simulation was performed for the P&O, GA, PSO, and GWO algorithms. In the case of the P&O-based MPPT’s output power, output voltage, and output current, Vin = 100 V, Iin = 8.6 A, D = 0.5, Vout = 200 V, Iout = 4.3 A, and Pout = 860 W, as shown in Figure 10. In the case of the GA-based MPPT’s output power, output voltage, and output current, Vin = 100 V, Iin = 8.6 A, D = 0.5, Vout = 200 V, Iout = 4.8 A, and Pout = 960 W, as shown in Figure 11. The PV module power PPV, IPV output current, and VPV output voltage effects were compared to the optimal power and optimal tension from the MPPT search algorithm, respectively. In addition, at the first irradiance stage, GWO offered a low output power and less output voltage relative to the GWO-FTSM controller. The control system then used a constant temperature, T = 25 °C, and a varying sinusoidal E radiation. The value of E was given in the following way: the traditional controllers were employed; meanwhile, an oscillating reaction wasted part of the available power generated by the photovoltaic model, thereby reducing the efficiency of the entire generation system (Appendix A). In the case of the PSO-based MPPT’s output power, output voltage, and output current, Vin = 100 V, Iin = 8.6 A, D = 0.5145,Vout = 206 V, Iout = 4.8 A, and Pout = 984 W, as shown in Figure 12, where the PSO MPPT algorithm was mostly affected by local MPPT trapping. The GWO algorithm is rarely affected by local MPP trapping, whereas the GWO-TSMC MPPT algorithm was not trapped and was tracked for all trail runs. In the case of the GWO-based MPPT’s output power, output voltage, and output current, Vin = 100 V, Iin = 8.6 A, D = 0.576, Vout = 236 V, Iout = 5.8 A, and Pout = 1368 W, as shown in Figure 13. In the case of the GWO-fed FTS-based MPPT’s output power, output voltage, and output current, Vin = 100 V, Iin = 8.6 A, D = 0.6, Vout = 250 V, Iout = 5.8 A, and Pout = 1450 W, as shown in Figure 14.

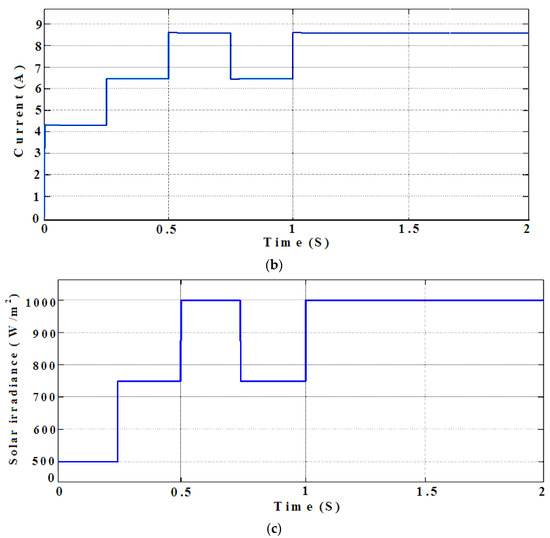
Figure 9.
(a) Proposed system and input voltage. (b) Proposed system input current. (c) Proposed system solar irradiation.
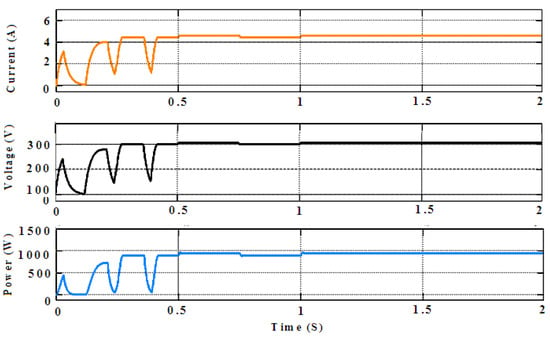
Figure 10.
P&O-based MPPT output power, output voltage, and output current (Vin = 100 V, Iin = 8.6 A, D = 0.5,Vout = 200 V, Iout = 4.3 A, and Pout = 860 W).
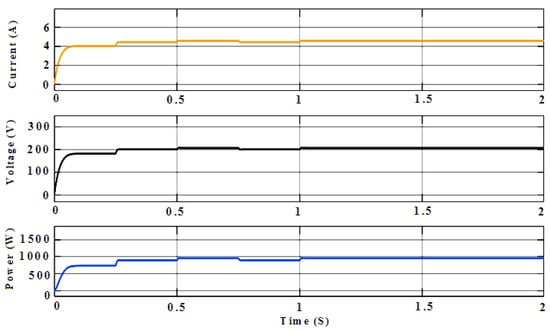
Figure 11.
GA-based MPPT output power, output voltage, and output current (Vin = 100 V, Iin = 8.6 A, D = 0.5,Vout = 200 V, Iout = 4.8 A, and Pout = 960 W).
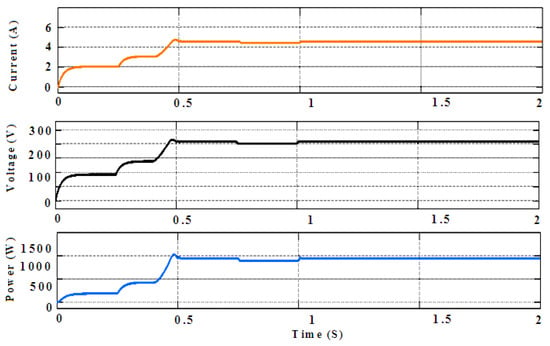
Figure 12.
PSO-based MPPT output power, output voltage, and output current (Vin = 100 V, Iin = 8.6 A, D = 0.5145, Vout = 206 V, Iout = 4.8 A, and Pout = 984 W).
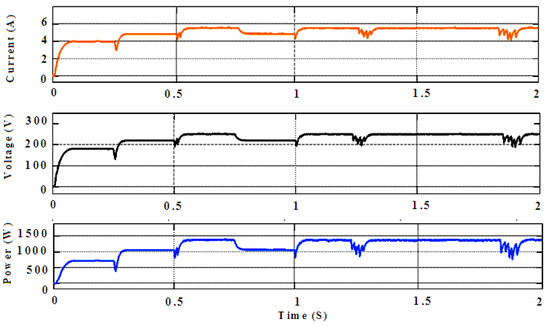
Figure 13.
GWO-based MPPT output power, output voltage, and output current (Vin = 100 V, Iin = 8.6 A, D = 0.576,Vout = 236 V, Iout = 5.8 A, and Pout = 1368 W).
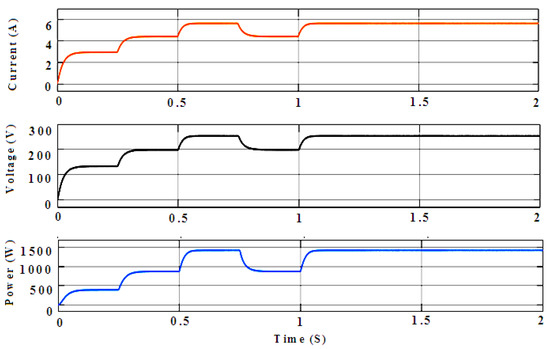
Figure 14.
GWO-fed FTS-based MPPT output power, output voltage, and output current (Vin = 100 V, Iin = 8.6 A, D = 0.6,Vout = 250 V, Iout = 5.8 A, and Pout = 1450 W).
4.2. Case 2
The initial parameters E = 1000 W/m2 and T = 25 °C and the successive t1 = 0.25 (500 W/m2), t2 = 0.25 to 0.5 (750 W/m2), t3 = 0.5 to 0.75 (1000 W/m2), and t4 = 0.75 to 1750 W/m2 were performed in the simulation (Appendix A), as shown in Figure 15. The results of the simulation revealed that the GWO-FTSM yielded better results than the GWO. A reliable performance could not be achieved by the GWO. In the case of the GWO-fed FTS-based MPPT’s output power, output voltage, and output current, Vin = 100 V, Iin = 8.6 A, D = 0.609,Vout = 256 V, Iout = 5.8 A, and Pout = 1484 W, as shown in Figure 15. In the case of the GWO-based MPPT’s output power, output voltage, and output current, Vin = 100 V, Iin = 8.6 A, D = 0.5967,Vout = 246 V, Iout = 5.8 A, and Pout = 1438 W, as shown in Figure 16. Table 1 and Table 2 provide our successful analysis. Table 1 reveals the comparison study of the performance of the various algorithms. Table 2 illustrates the efficiency of each approach, which was computed by dividing the maximum theoretical power by the instantaneous extracted power, which was defined as follows:
Efficiency η = Pact/Pmax.
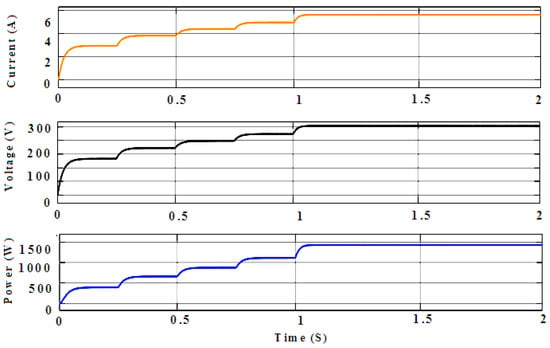
Figure 15.
GWO-fed FTS-based MPPT output power, output voltage, and output current (Vin = 100 V, Iin = 8.6 A, D = 0.609,Vout = 256 V, Iout = 5.8 A, and Pout = 1484 W).
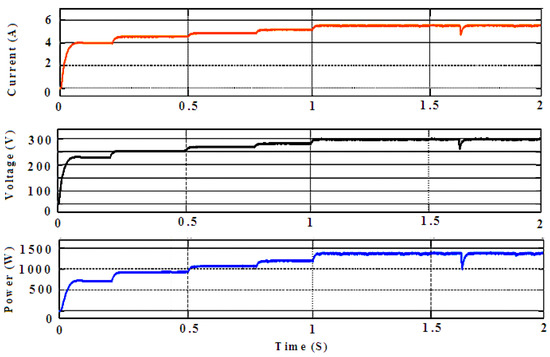
Figure 16.
GWO-based MPPT output power, output voltage, and output current (Vin = 100 V, Iin = 8.6 A, D = 0.5967,Vout = 246 V, Iout = 5.8 A, and Pout = 1438 W).

Table 1.
Performance comparisons.

Table 2.
Comparison of the MPPTs’ efficiencies for the various algorithms.
An appropriate duty ratio was achieved by using the MPPT techniques at 1000 W/m2, with a variation in solar radiation ranging from 0 W/m2 to 500 W/m2 passing through the range of 750 W/m2 to 1000 W/m2.
5. Experimental Results and Discussions
A module as defined by Table 1 was required to implement the experimental configuration for the MPPT ILC converter in real-time. The voltage rating system was 26 V. A package of four solar modules was designed to generate different voltages. The PV array was connected to the ILC converter using the monitored PWM signal with a 50 Hz carrier wave provided by WMS320F28335. The distortion of the current waveforms occurred in light-charge situations due to the switching noise. The switches for the closed-loop control were under varying load conditions.
6. Conclusions
The P&O, GA, PSO, GWO, and GWO-FTSM architectures for voltage control and photovoltaic (PV) systems were discussed in this article. In comparison with the P&O, GA, PSO, and GWO algorithms, the performance of the GWO-FTSM controller proposed improved the built controllers, which improved the stability and the dynamic performance of the PV system. With the simulation results, the P&O, GA, PSO, GWO, and GWO–FTSM methods were easy to implement with the interleaved boost converter system and lead to better tracking capability, even under uniform and non-uniform irradiation conditions. The study also demonstrated the influence of temperature variations and irradiation on power production. The power consumption increased with the appropriate cell temperature and irradiance level. The best output voltage, current, and power were acquired from the table by the GWO-FTSM (1450 W and 1484 W). Due to the oscillation, the P&O, GA, PSO, and GWO could not generate the best output values. For applying the proposed system and MPPT, the PV emulator was used in real-time. The laboratory constructed a prototype, and the experimental findings validated the efficiency of the suggested energy conservation technique and the stability analysis based on the non-linear analytical approach employed in the closed-loop construction.
Author Contributions
Conceptualization, methodology, and supervision, E.A.; formal analysis and validation, K.C.; writing, K.S. All authors have read and agreed to the published version of the manuscript.
Funding
This research received no external funding.
Institutional Review Board Statement
Not applicable.
Informed Consent Statement
Not applicable.
Data Availability Statement
Not applicable.
Conflicts of Interest
The authors declare no conflict of interest.
Appendix A
Case I: E = 1000 W/m2 and T = 25 °C, and t1 = 0 to 0.25 (500 W/m2), t2 = 0.25 to 0.5 (750 W/m2), t3 = 0.5 to 0.95 (1000 W/m2), t4 = 1.750 W/m2, and t5 = 1.000 W/m2
Case II: E = 1000 W/m2 and T = 25 °C, and t1 = 0.25 (500 W/m2), t2, = 0.25 to 0.5 (750 W/m2),t3 = 0.5 to 0.75 (1000 W/m2), and t4 = 0.75 to 1750 W/m2
References
- Xu, M.; Ruan, X.B.; Liu, F.X.; Yang, D.S. Energy Management for hybrid photovoltaic-fuel cell power system. Trans. China Electrotech. Soc. 2010, 25, 166–175. [Google Scholar]
- Zhou, H.H.; Bhattacharya, T.; Duong, T.; Siew, T.S.T.; Khambadkone, A.M. Composite Energy Storage System Involving Battery and Ultracapacitor with Dynamic Energy Management in Microgrid Applications. IEEE Trans. Power Electron. 2011, 26, 923–930. [Google Scholar] [CrossRef]
- Liao, Z.L.; Xu, Y.J.; Shi, W.D. Wind-Photovoltaic Hybrid Double-Input Buck-Boost DC/DC Converter. IEEE Trans. Ind. Electron. 2014, 51, 63–66. [Google Scholar]
- Umuhoza, J.; Zhang, Y.Z.; Zhao, S.; Mantooth, H.A. An adaptive control strategy for power balance and the intermittency mitigation in battery-PV energy system at residential DC microgrid level. In Proceedings of the 2017 IEEE Applied Power Electronics Conference and Exposition (APEC), Tampa, FL, USA, 26–30 March 2017. [Google Scholar]
- Das, S.; Akella, A.K. A control strategy for power management of an isolated micro hydro-pv-battery hybrid energy system. In Proceedings of the ICEES, Chennai, India, 7–9 February 2018. [Google Scholar]
- Xu, Q.; Hu, X.; Wang, P. A Decentralized Dynamic Power Sharing Strategy for Hybrid Energy Storage System in Autonomous DC Microgrid. IEEE Trans. Ind. Electron. 2017, 64, 5930–5941. [Google Scholar] [CrossRef]
- Jia, Y.H.; Liu, T.; Wu, H.F. A SiC-based dual-input buck-boost converter with independent MPPT for photovoltaic power systems. In Proceedings of the IECON, Washington, DC, USA, 21–23 October 2018. [Google Scholar]
- Patel, H.; Gupta, M.; Bohre, A.K. Mathematical modeling and performance analysis of MPPT based solar PV system. In Proceedings of the 2016 International Conference on Electrical Power and Energy Systems (ICEPES), Bhopal, India, 14–16 December 2016. [Google Scholar]
- Anounce, K.; Bouya, M.; Ghazouani, M. Hybrid renewable energy system to maximize the electrical power production. In Proceedings of the IRSEC, Marrakech, Morocco, 14–17 November 2016. [Google Scholar]
- Bayat, P.; Baghramian, A. Analysis and Control of a New Dual-input Impedance-based DC–DC Converter for Hybrid PV-FC Systems. Adv. Electr. Comput. Eng. 2019, 19, 47–56. [Google Scholar] [CrossRef]
- Venmathi, M.; Ramaprabha, R. Investigation on Fuzzy Logic Based Centralized Control in Four-Port SEPIC/ZETA Bidirectional Converter for Photovoltaic Applications. Adv. Electr. Comput. Eng. 2016, 16, 53–60. [Google Scholar] [CrossRef]
- Rezk, H.; Aly, M.; Al-Dhaifallah, M.; Shoyama, M. Design and Hardware Implementation of New Adaptive Fuzzy Logic-Based MPPT Control Method for Photovoltaic Applications. IEEE Access 2019, 7, 106427–106438. [Google Scholar] [CrossRef]
- Ali, M.N.; Mahmoud, K.; Lehtonen, M.; Darwish, M.M. An Efficient Fuzzy-Logic Based Variable-Step Incremental Conductance MPPT Method for Grid-Connected PV Systems. IEEE Access 2021, 9, 26420–26430. [Google Scholar] [CrossRef]
- Priyadarshi, N.; Padmanaban, S.; Holm-Nielsen, J.B.; Blaabjerg, F.; Bhaskar, M.S. An Experimental Estimation of Hybrid ANFIS–PSO-Based MPPT for PV Grid Integration Under Fluctuating Sun Irradiance. IEEE Syst. J. 2020, 14, 1218–1229. [Google Scholar] [CrossRef]
- Al Nabulsi, A.; Dhaouadi, R. Efficiency Optimization of a DSP-Based Standalone PV System Using Fuzzy Logic and Dual-MPPT Control. IEEE Trans. Ind. Inform. 2012, 8, 573–584. [Google Scholar] [CrossRef]
- Zhang, X.; Yang, B.; Yu, T.; Jiang, L. Dynamic Surrogate Model Based Optimization for MPPT of Centralized Thermoelectric Generation Systems Under Heterogeneous Temperature Difference. IEEE Trans. Energy Convers. 2020, 35, 966–976. [Google Scholar] [CrossRef]
- Khanam, N.; Khan, B.H.; Imtiaz, T. Maximum power extraction of solar pv system using meta-heuristic MPPT techniques: A comparative study. In Proceedings of the 2019 International Conference on Electrical, Electronics and Computer Engineering (UPCON), Aligarh, India, 8–10 November 2019. [Google Scholar]
- Omine, L.T.; de Brito, M.A.; Pinto, J.O.; García, R.C. Hybrid MPPT algorithms for photovoltaic systems. In Proceedings of the 2018 IEEE 4th Southern Power Electronics Conference (SPEC), Singapore, 10–13 December 2018. [Google Scholar]
- Ibrahim, A.W.; Shafik, M.B.; Ding, M.; Sarhan, M.A.; Fang, Z.; Alareqi, A.G.; Almoqri, T.; Al-Rassas, A.M. PV maximum power-point tracking using modified particle swarm optimization under partial shading conditions. Chin. J. Electr. Eng. 2020, 6, 106–121. [Google Scholar] [CrossRef]
- Ishaque, K.; Salam, Z.; Amjad, M.; Mekhilef, S. An Improved Particle Swarm Optimization (PSO)–Based MPPT for PV With Reduced Steady-State Oscillation. IEEE Trans. Power Electron. 2012, 27, 3627–3638. [Google Scholar] [CrossRef]
- Nugraha, D.A.; Lian, K.L. A Novel MPPT Method Based on Cuckoo Search Algorithm and Golden Section Search Algorithm for Partially Shaded PV System. Can. J. Electr. Comput. Eng. 2019, 42, 173–182. [Google Scholar] [CrossRef]
- Mohanty, S.; Subudhi, B.; Ray, P.K. A New MPPT Design Using Grey Wolf Optimization Technique for Photovoltaic System Under Partial Shading Conditions. IEEE Trans. Sustain. Energy 2016, 7, 181–188. [Google Scholar] [CrossRef]
- Kumar, N.; Hussain, I.; Singh, B.; Panigrahi, B.K. Single Sensor-Based MPPT of Partially Shaded PV System for Battery Charging by Using Cauchy and Gaussian Sine Cosine Optimization. IEEE Trans. Energy Convers. 2017, 32, 983–992. [Google Scholar] [CrossRef]
- Mohanty, S.; Subudhi, B.; Ray, P.K. A Grey Wolf-Assisted Perturb & Observe MPPT Algorithm for a PV System. IEEE Trans. Energy Convers. 2017, 32, 340–347. [Google Scholar]
- Anwer, A.M.O.; Omar, F.A.; Kulaksiz, A.A. Design of a Fuzzy Logic-based MPPT Controller for a PV System Employing Sensorless Control of MRAS-based PMSM. Int. J. Control Autom. Syst. 2020, 18, 2788–2797. [Google Scholar] [CrossRef]
- Mahdi, A.S.; Mahamad, A.K.; Saon, S.; Tuwoso, T.; Elmunsyah, H.; Mudjanarko, S.W. Maximum power point tracking using perturb and observe, fuzzy logic and ANFIS. SN Appl. Sci. 2020, 2, 89. [Google Scholar] [CrossRef]
- Dhimish, M.; Holmes, V.; Mather, P.; Sibley, M. Novel hot spot mitigation technique to enhance photovoltaic solar panels output power performance. Sol. Energy Mater. Sol. Cells 2018, 179, 72–79. [Google Scholar] [CrossRef]
- Abo-Elyousr, F.K.; Abdelshafy, A.M.; Abdelaziz, A.Y. MPPT based particle swarm and cuckoo search algorithms for PV systems. In Modern Maximum Power Point Tracking Techniques for Photovoltaic Energy Systems; Eltamaly, A.E., Abdelaziz, A.Y., Eds.; Springer: Cham, Switzerland, 2020. [Google Scholar]
- Mao, M.; Zhou, L.; Yang, Z.; Zhang, Q.; Zheng, C.; Xie, B.; Wan, Y. A hybrid intelligent GMPPT algorithm for partial shading PV system. Control Eng. Pract. 2019, 83, 108–115. [Google Scholar] [CrossRef]
- Bonthagorla, P.K.; Mikkili, S. Performance investigation of hybrid and conventional PV array configurations for grid-connected/standalone PV systems. CSEE J. Power Energy Syst. 2020, 8, 682–695. [Google Scholar]
- Swanepoel, N.C.; Richards, C.G.; Nnachi, A.F.; Ehlers, P.J. A comparative study of maximum power point tracking algorithms for PV arrays. In Proceedings of the 2020 6th IEEE International Energy Conference (ENERGYCon), Gammarth, Tunisia, 8 September 2020–1 October 2020; pp. 819–823. [Google Scholar]
Disclaimer/Publisher’s Note: The statements, opinions and data contained in all publications are solely those of the individual author(s) and contributor(s) and not of MDPI and/or the editor(s). MDPI and/or the editor(s) disclaim responsibility for any injury to people or property resulting from any ideas, methods, instructions or products referred to in the content. |
© 2023 by the authors. Licensee MDPI, Basel, Switzerland. This article is an open access article distributed under the terms and conditions of the Creative Commons Attribution (CC BY) license (https://creativecommons.org/licenses/by/4.0/).