Abstract
Long-term exposure to high levels of vibration and noise can have detrimental effects on the health of tractor drivers. This study aimed to evaluate the subjective comfort experienced by drivers operating large-horsepower tractors. A total of 10 tractors sourced from 5 different manufacturers were subjected to testing. The assessment encompassed three operational conditions, namely, idle, maximum torque, and rated power. Objective measurements, including A-weighted sound pressure level (A-SPL), loudness, sharpness, roughness, articulation index (AI), hand vibration, and seat vibration, were collected. Additionally, subjective comfort evaluations were carried out using a paired comparison test. To predict the subjective comfort of tractor drivers, a novel prediction model was developed by employing a simulated annealing (SA) algorithm to optimize a backpropagation neural network (BPNN). The model successfully achieved accurate predictions of subjective comfort, yielding a maximum prediction error of 4.4%. The study findings revealed that vibration had a more pronounced impact on driver comfort in environments with lower-amplitude noise, whereas high-decibel noise exerted a masking effect on vibration-induced discomfort. In conclusion, the SA-BPNN model, utilizing A-SPL, loudness, sharpness, roughness, AI, hand vibration, and seat vibration as objective parameters, effectively predicted the subjective comfort of tractor drivers. This discovery holds significant implications for tractor manufacturers, who can employ the model to optimize the design of tractor cabs and enhance driver comfort.
1. Introduction
The tractor plays a pivotal role in contemporary agricultural production, with more than 90% of agricultural operations relying on its utilization. Nevertheless, the use of diesel engines to power tractors introduces challenges related to combustion noise and engine imbalance, leading to substantial levels of vibration and noise. These effects become particularly pronounced when tractors operate on unpaved roads. The symmetrical wheels of the tractor are subjected to impact forces from the uneven terrain, thereby intensifying the adverse impacts of vibration and noise on the health of tractor drivers.
Research showed that long-term exposure to high levels of vibration and noise can lead to hearing loss, cardiovascular disease, and musculoskeletal disorders in tractor operators. Therefore, the vibration and noise comfort of the tractor cab plays a critical role in shaping customer perception of tractor quality and directly affects purchase intention [1,2].
The engine serves as the primary source of vibration and noise in tractors, exerting a significant influence on the tractor’s ride comfort. In order to enhance the comfort of the driver, designers commonly implement various measures, including cab vibration isolation and cab sound insulation. Cab vibration isolation aims to minimize the transfer of engine-induced vibrations to the driver’s compartment, while cab sound insulation is employed to reduce the transmission of engine noise into the cab. These measures collectively contribute to improving the overall ride comfort experienced by the tractor operator. Traditionally, research on cab comfort has focused on the study of noise levels, with A-weighted sound pressure level (A-SPL) being one of the most commonly used evaluation parameters. However, studies found that decreases in sound pressure levels do not always correspond to decreases in subjective discomfort. To more objectively reflect the detailed characteristics of the acoustic environment in the cab, researchers proposed objective parameters of sound characteristics from the perspective of psychoacoustics. These parameters include loudness, sharpness, roughness, fluctuation strength, and pitch, which can influence subjective comfort [3]. The objective parameters selected in previous studies are shown in Table 1 [4,5,6,7,8,9,10,11,12,13,14].

Table 1.
Objective parameters selected in previous studies.
In fact, regardless of the method used, the evaluation of sound quality ultimately comes down to people’s subjective perception. Based on well-evaluated subjective tests, objective parameters are combined with subjective human perceptions in order to build predictive models about sound quality. Researchers have done a huge amount of exploration on how to use objective indicators to represent subjective indicators. They took combinations of several different objective parameters to describe the different perceptions of the transient changes of the sound signal to human hearing. Although traditional psychoacoustic measures had achieved good results in previous studies, there were still some shortcomings, such as the lack of ISO standards for psychoacoustic parameters other than loudness, which can lead to differences in calculations between researchers. Additionally, differences in vehicle operating conditions and human preferences for sound frequency components can also affect the selection of objective parameters and subjective perceptions of sound quality. Given the complexity and nonlinearity of human subjective perception, researchers have applied various intelligent prediction methods to automotive sound quality evaluation, such as multiple linear regression, fuzzy mathematics, genetic algorithms, artificial neural networks, gray system theory, and support vector machines [9]. For instance, Zuo used in-vehicle noise at different locations and speeds as the research object and established a multiple regression model of noise subjective preference and objective psychoacoustic parameters by calculating several objective psychoacoustic parameters [12]. Liao and Zhang et al. selected multiple objective parameters that were highly correlated with subjective evaluations based on the prediction model of the fuzzy reconstruction algorithm. The correlation analysis of multiple samples accurately quantified the relationship between subjective preferences and objective parameters to improve the acoustic comfort of the vehicle [15,16]. Wang et al. developed a BP neural network model for vehicle interior noise sound quality evaluation using traditional psychoacoustic parameters to evaluate the sound quality of vehicle interior noise via jury testing. The correlation between traditional psychoacoustic parameters and subjective evaluation was analyzed, and the effectiveness of the model in sound quality prediction was demonstrated for guiding vehicle acoustic design and improvement [8]. Pan designed a gray-correlation-analysis-based sound quality evaluation index analysis and selection scheme, which provided a comprehensive analysis and prediction of objective and subjective vehicle indicators, providing a basis for further optimization and control of in-vehicle sound quality [17]. Liu addressed the drawback that using the conventional semantic differential method makes it difficult to accurately evaluate acceleration noise with time-varying non-stationary characteristics, and uses a support vector machine model to investigate the subjective evaluation of in-vehicle sound samples with different sound quality characteristics during acceleration [11]. While these previous works have made significant contributions to the field of NVH, further research is needed to address the limitations and drawbacks of the models and methods used in these studies.
Previous research has focused on improving the accuracy of sound quality prediction models due to the non-linear relationship between objective parameters and subjective perceptions. Researchers have explored various approaches to improving these models, such as coupling multiple algorithms together. For example, some studies have optimized BP neural networks using simulated annealing or genetic algorithms, while others have integrated techniques such as empirical mode decomposition, Hilbert transform, and correlation vector machine for sound quality evaluation models [18]. Additionally, researchers have created models using genetic algorithm-optimized BP neural networks or support vector regression models [4]. These approaches have shown promise in improving sound quality prediction accuracy, but further research is needed to determine which methods are most effective for different contexts.
Current research primarily focuses on examining the relationship between sound quality parameters and subjective human perception. However, tractors, which commonly utilize diesel engines, possess distinct operational characteristics that result in higher levels of vibration and noise compared with gasoline engines or electric motors. A significant contributing factor is the implementation of rubber vibration isolation systems in tractor cabs as opposed to the suspension systems found in cars. Consequently, vibrations are more easily transmitted to the driver through the cab structure. Moreover, tractor cabs are designed with extensive use of glass and thin-walled metal panels to ensure an unobstructed view of the work process. This design choice presents challenges in implementing comprehensive acoustic packaging through absorption and sound insulation treatments. As a result, vibrations transmitted to the cab can generate structural noise, while external noise can readily infiltrate the cab interior through the glass and thin-walled panels. These factors create a more demanding vibration and noise environment for tractor drivers compared with car cabins. It is crucial to consider that within the enclosed cab environment, the perception of vibrations and noise by the human body cannot be isolated, as both factors mutually influence each other. Therefore, overlooking the impact of cab vibration on the human body and relying solely on sound quality parameters, such as the A-weighted sound pressure level, loudness, and roughness, would inadequately reflect the true subjective comfort experienced by tractor drivers [19,20].
This study aimed to investigate the subjective comfort evaluation of tractor drivers in the context of the severe vibration and noise exposure they experience within the closed environment of the cab. To achieve this, this study used a BP neural network to establish a tractor driver comfort prediction model that combines subjective evaluations with objective parameters, such as the A-weighted sound pressure level, objective parameters of sound quality, driver’s hand vibration, and seat vibration. The model was optimized using a simulated annealing algorithm to improve its prediction accuracy. The study’s methodology involved training the neural network using a dataset of tractor noise and vibration measurements and selecting input parameters based on their correlation with subjective evaluations of driver comfort. The resulting model can be used to predict driver comfort levels in tractor cabs based on objective noise and vibration measurements. This study’s contribution is a more accurate and objective method for evaluating tractor driver comfort that can guide the design and improvement of tractor cabs to reduce vibration and noise exposure.
2. Methodology
The process of evaluating the comfort inside the tractor cab is shown in Figure 1. It included the following steps:
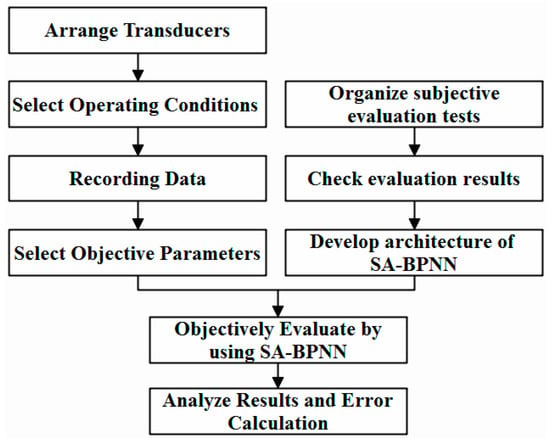
Figure 1.
Flow chart for subjective and objective evaluations using an SA-BPNN.
- First, we chose the appropriate operating conditions and sampling rate to record the tractor driver’s ear-side noise, hand, and seat vibration data;
- In the second step, the subjective evaluation of vibration and noise in the cab was performed using the pairwise comparison method, and the results were tested using Pearson correlation analysis;
- In the third step, the SA-BPNN prediction model for tractor cab comfort was developed to evaluate the operating comfort of the tractor, and the error of the prediction results was calculated and analyzed.
2.1. Noise and Vibration Acquisition Test
A test was conducted to evaluate the noise and vibration characteristics of 10 types of large-horsepower tractors from 5 manufacturers. Drivers operating tractors within the cab are not only influenced by the noise present in the environment but also by the vibrations transmitted through the steering wheel and seat, both of which significantly impact driver comfort [21]. The goal of the test was to accurately measure the noise and vibration levels inside the tractor cab under different working conditions while taking into account the human binaural masking effect on the time and frequency domain signals. To achieve this, an HMS III artificial head produced by HEAD was utilized. As the structure of the tractor cab is symmetric, the artificial head was mounted on the driver’s seat, with its binaural microphones positioned at a height of 0.7 m ± 0.05 m above the seat-back junction, as shown in Figure 2. This setup allowed for the collection of noise samples that accurately reflected the real acoustic characteristics inside the tractor cab. In addition to the artificial head, acceleration sensors made by B&K were used to measure the vibrations of the steering wheel and seat, as shown in Figure 3 and Figure 4. The test was conducted in an open area with no sound reflectors within 50 m of the surrounding area, and the cab air conditioner and windows were closed during the test. To ensure that sufficient data were gathered for analysis, a signal time duration of 10 s and a sampling rate of 48 kHz were used. The analysis of the noise data took into account the range of sound perception by the human ear, which spans from 20 Hz to 20,000 Hz. Hand vibrations at the steering wheel position were analyzed within the frequency range of 1 Hz to 1000 Hz, while seat vibrations were analyzed within the range of 1 Hz to 80 Hz. The tractors were tested under idle, maximum torque, and rated power conditions, and a total of 30 data samples were collected. The noise and vibration data for each tractor model under each condition are presented in Table 2. The subscript of the sample number indicates the tractor number, while I, T, and R represent the three different working conditions of idle, maximum torque, and rated power, respectively. VH and VS represent the hand vibration and seat vibration of the driver, respectively. In conclusion, the test results provided valuable insights into the noise and vibration characteristics of large horsepower tractors under different working conditions. The methodology used in the test, including the use of artificial head and acceleration sensors, provided a reliable and accurate means of measuring noise and vibration levels inside the tractor cab.
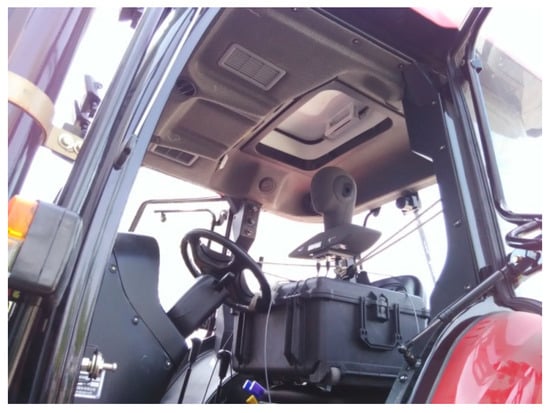
Figure 2.
HMS III artificial head test.
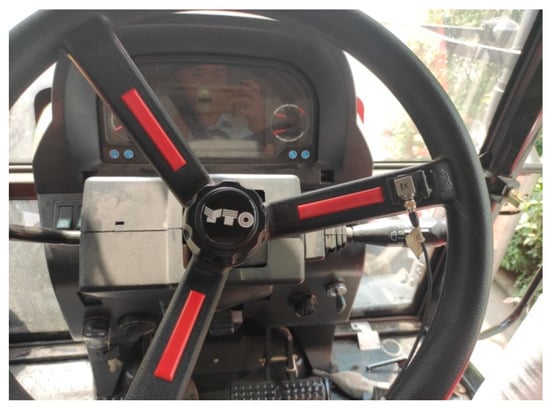
Figure 3.
Hand vibration test.
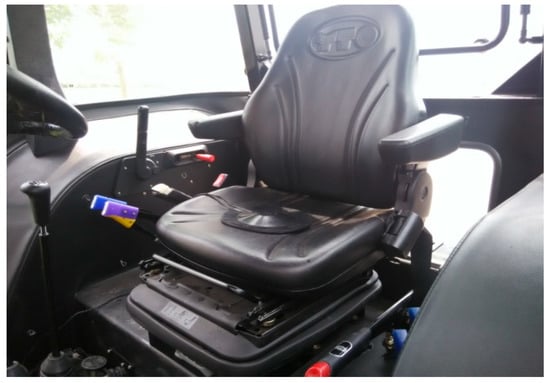
Figure 4.
Seat vibration test.

Table 2.
The results of the test measurement.
Loudness, sharpness, roughness, and AI are calculated using Equations (1)–(6) [22,23,24,25,26,27].
The loudness is calculated using Equations (1) and (2).
In the equation, N′ represents the characteristic loudness of each Bark threshold after dividing the noise frequency domain signal into 24 critical bands with Bark as the unit, with the overall unit being the sone. ETQ represents the excitation under the entire hearing threshold. E0 represents the reference sound pressure corresponding to excitation. E represents the excitation of each critical frequency band. N represents the total loudness of the noise.
The sharpness is calculated using Equations (3) and (4).
In these equations, g(z) represents the weighted value of the zth critical frequency band.
The roughness is calculated using Equation (5).
In the equation, N′max(z) and N′min(z) represent the maximum and minimum characteristic loudness within each Bark threshold. fmod represents the modulation frequency. The equation for calculating the AI is as follows:
where M1 is the number of listened-to sound units and Mtotal is the number of total sound units [28].
Compared with automobiles, tractors typically generate higher levels of noise and vibration within the driver’s cabin. Our measurements indicate that the maximum sound pressure level inside the sample tractors was approximately 90 dB(A), which is dangerously close to the threshold for permanent hearing damage. Prolonged exposure to such high levels of noise and vibration can lead to irreversible harm to the driver’s physical and mental well-being.
2.2. Statistical Analysis of Drivers’ Subjective Perception Data
The subjective evaluation experiment is a crucial aspect of this study since it reflects consumers’ direct subjective feelings. Various subjective evaluation methods exist, such as the ranking method, pairwise comparison method, semantic subdivision method, and hierarchical evaluation method, each with its advantages and disadvantages. Given the specificity of this test, the pairwise comparison method was used to subjectively evaluate the tractors. The method involved scoring the subjective feeling of the human body on a scale of 1 to 10, ranging from the degree of discomfort to comfort, as shown in Figure 5. The scale has ten basic levels between “Very Bad” and “Excellent”, each with a different score. The arithmetic mean of all the evaluators’ scores is the comfort level of the sample, with lower ratings indicating lower comfort levels [5].
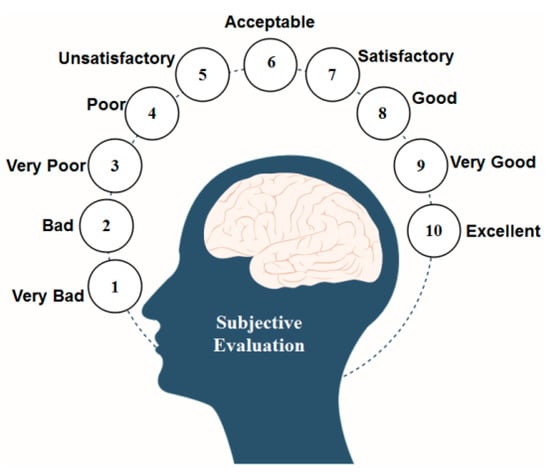
Figure 5.
Subjective evaluation indicators.
To ensure diverse perspectives, 40 jury members, including 5 females, were selected based on their gender, age, health level, and driving experience. They ranged between 26 and 50 years old, had no hearing impairment, had at least three years of experience driving a car or tractor, and had basic expertise in vibration noise. During the subjective evaluation, each person evaluated randomly paired tractors for approximately 20 min, with a maximum overall evaluation time of 60 min per day. The evaluators selected the appropriate comfort level based on the vibration noise of the tractor samples. If necessary, they could compare samples again until making a clear judgment based on their subjective perception.
2.3. Establishment of the Sound Quality Prediction Model
The backpropagation (BP) neural network is a popular machine learning method known for its powerful nonlinear mapping capability. It consists of three layers, namely, the input layer, the hidden layer, and the output layer, which establish a connection between the input and output data, thereby simulating the human learning process. The BP neural network is widely used for modeling, prediction, and decision-making tasks in various fields. Its success is attributed to the ability to automatically learn complex patterns in data and map them to appropriate outputs. The learning process in the BP neural network involves adjusting the weights and biases of the network using an iterative algorithm based on the error between the predicted output and the actual output. The ultimate goal of training the BP neural network is to minimize the error and achieve high accuracy in predicting new data [29].
To utilize a BP neural network, learning data is fed into the input layer. The input data is then processed in the hidden layer through weighted calculations before being passed on to the output layer. This process enables the forward propagation of the data, which generates the output value. In cases where the error between the predicted output and the actual output does not meet the termination condition set by the system, the error signal is propagated backward through the network, following the same path as the forward propagation. This backward propagation enables the adjustment of weights and thresholds for each neuron in each layer to minimize the error. This process is repeated iteratively until the error reaches the termination condition, indicating that the network has learned to generalize from the input–output data pairs.
In a 3-layer BPNN (backpropagation neural network) model, the input layer comprises nodes xi, the hidden layer consists of nodes hj, and the output layer consists of nodes yk. The weights between the input layer nodes and the hidden layer nodes are represented by wij, with the corresponding thresholds denoted as bj. Likewise, the weights between the hidden layer nodes and the output layer nodes are indicated by wjk, and the associated thresholds are represented by bk. When the desired output of the output layer node is tk, the error can be calculated using Equation (9).
The output of the hidden layer node is
The output of the output layer node is
The error of the output layer node is
From the 30 collected samples, 6 were chosen as test samples, and the remaining 24 samples were designated as training samples. Before the training process, data normalization was performed to address the issue of different parameter dimensions. For input layer nodes, the objective parameters, namely, A-weighted sound pressure level (A-SPL), loudness, sharpness, roughness, AI, hand vibration, and seat vibration, were selected as the input variables. On the other hand, the output layer nodes corresponded to the subjective evaluation values of tractor cab comfort.
In a BPNN, the number of neurons in the hidden layer affects the complexity and accuracy of the model. If the number of neurons is too small, the model may underfit and fail to capture the complex relationships between the inputs and outputs. On the other hand, if the number of neurons is too large, the model may overfit the training data, resulting in poor generalization performance on new data.
Moreover, the initial weights and thresholds also play important roles in determining the convergence speed and the quality of the model. Poorly chosen initial values can cause the algorithm to get stuck in a local optimum and fail to find the global optimum. Therefore, careful selection of the number of hidden neurons and initial values is crucial for building an accurate and efficient BPNN model.
The number of neurons in the hidden layer is calculated using Equation (10).
where ij represents the number of neurons in the input layer, Oj represents the number of neurons in the output layer, and α is a parameter between 1 and 10 [7]. The average error percentage of the BPNN model is utilized as the metric to determine the optimal number of nodes in the hidden layer through the trial-and-error method. Based on the calculation results of the BPNN (backpropagation neural network) shown in Figure 6, it was determined that the optimal number of nodes for the hidden layer was 10. Therefore, the topology of the constructed neural network was (7-10-1), which is illustrated in Figure 7.
hj = (ij + Oj)1/2 + α
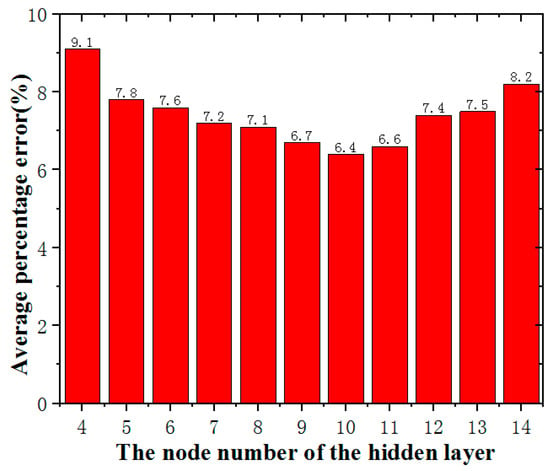
Figure 6.
The average percentage error of the BPNN at different node numbers of the hidden layer.
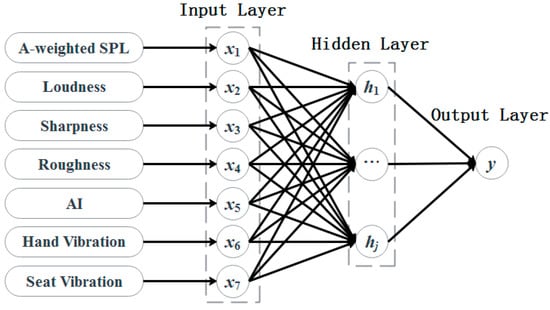
Figure 7.
Structural chart of the BP prediction model.
The simulated annealing (SA) algorithm was used in this study to optimize the BP neural network and overcome its limitations, such as slow training speed and the risk of getting trapped in a local optimum. The SA algorithm is a probabilistic algorithm that is inspired by the annealing process in metallurgy. It is used to find the global optimum of a given function. It has fewer constraints on initial conditions and is widely used for searching for optimal solutions compared with other algorithms.
The core of the SA algorithm is the Metropolis criterion, which accepts new states with certain probabilities. When using the Metropolis criterion, it usually starts with an initial solution S0. The system energy changes from E(i) to E(I + 1) when the sample point (Si) generates a new sample point (Si + 1) along a vector with a random magnitude (or length) and direction. Define the acceptance probability of the system changing from Si to Si + 1 as p. If the new state is accepted, it becomes the current state, and the process is repeated. Otherwise, the current state is retained, and the perturbation process is repeated until a suitable solution is found. The SA algorithm gradually reduces the probability of accepting worse solutions as the algorithm progresses, which helps to avoid getting stuck in a local optimum.
p = 1, if E(i + 1) ≤ E(i)
or, p = exp((E(i) − E(i + 1))/T), if E(i + 1) > E(i)
or, p = exp((E(i) − E(i + 1))/T), if E(i + 1) > E(i)
The annealing temperature, denoted by T, is gradually reduced during the optimization process according to the cooling regime. The Metropolis criterion ensures that suboptimal sampling designs are accepted with a given probability and avoids sampling designs that are at a local optimum [18].
The SA algorithm is incorporated into the BPNN as a distinct module to create an SA-BPNN neural network prediction model, which has both global optimization capability and faster convergence. The structural framework of this model is illustrated in Figure 8. The training parameters are critical for achieving high prediction accuracy. In this study, the sigmoid function was employed as the activation function for the SA-BPNN prediction model. The initial temperature was set to 1000 °C, the annealing rate was set to 0.9, the learning rate was set to 0.1, the desired error was 0.005, and the number of training iterations was 1000.
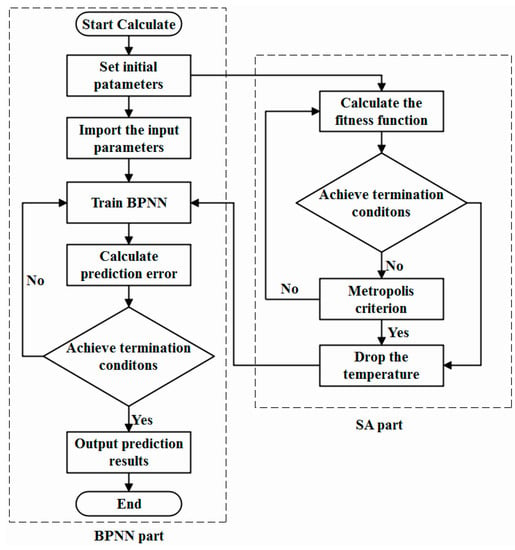
Figure 8.
The framework of the SA-BPNN.
3. Results and Discussion
3.1. Comparison of Results between BPNN and SA-BPNN
To ensure the accuracy and reliability of the test results, a Pearson correlation coefficient analysis was performed on the seven objective parameters (A-SPL, loudness, sharpness, roughness, AI, hand vibration, seat vibration) associated with human subjective experiences and the subjective evaluation of driver comfort. The findings of this analysis are presented in Table 3.

Table 3.
The results of the correlation coefficients.
When using the objective parameters as the inputs for the SA-BPNN, it is important to note that each parameter may have a different magnitude. Therefore, it is necessary to use a normalization method to ensure that the data are in a similar range between [0, 1]. This normalization process helps to build a more accurate and reliable subjective evaluation prediction model.
Xir = (Xi − Xmin)/(Xmax − Xmin)
In Equation (3), Xmin and Xmax represent the minimum and maximum values of the data, respectively. Xi represents the original values of the data and Xir represents the normalized values, which are transformed to lie between 0 and 1 using the normalization process [30].
The prediction error of the model is denoted by ε, which represents the average difference between the predicted subjective evaluation value and the actual subjective evaluation value of the test samples.
where n is the number of samples, Xi and Yi are the input and output values of the test samples (objective and subjective evaluation values of the samples, respectively), and Y(Xi) is the predicted subjective evaluation value by the SA-BPNN model.
ε = abs(Yi − Y(Xi))/Yi
In Table 3, the Pearson correlation coefficient analysis reveals the degree of influence of each objective parameter on the driver’s subjective comfort evaluation. The order of influence was as follows: loudness, roughness, sharpness, A-SPL, AI, hand vibration, and seat vibration. The absolute values of the Pearson correlation coefficients of loudness, roughness, sharpness, A-weighted sound pressure level, and speech intelligibility on the subjective driver comfort evaluation all exceeded 0.6, indicating that these five objective parameters had significant impacts on the subjective driver comfort evaluations. Loudness and roughness had the greatest influences on the subjective evaluation results, with their Pearson correlation coefficients exceeding 0.9 in absolute value [15].
To assess the importance of each objective parameter in relation to subjective comfort, their significance levels were calculated. The results revealed that the p-values for all objective parameters with respect to subjective comfort were below the predetermined significance threshold of p < 0.05. This indicates that there was a statistically significant relationship between these objective parameters and subjective comfort. Moreover, it suggests that all objective parameters had a significant effect on subjective comfort.
Figure 9 and Figure 10 show that the SA-BPNN model had a generally higher prediction accuracy than the BPNN model. The maximum absolute percentage error of the predicted value of the BPNN model was 8%, while the minimum value was 5%. In contrast, the maximum absolute percentage error of the SA-BPNN model was 4.4%, and the minimum absolute percentage error was 1.1%, both of which were below 5% and indicate that the SA-BPNN model could accurately predict subjective driver comfort. When comparing the maximum prediction error of the genetic algorithm–BP neural network (GA-BPNN) model, as reported in [4] with a value of 10.74%, to that of the genetic algorithm–support vector regression (GA-SVR) model with a maximum prediction error of 6.75%, the SA-BPNN model employed in this study demonstrated a higher prediction accuracy. Consequently, the SA-BPNN model was capable of more accurately predicting driver subjective comfort.
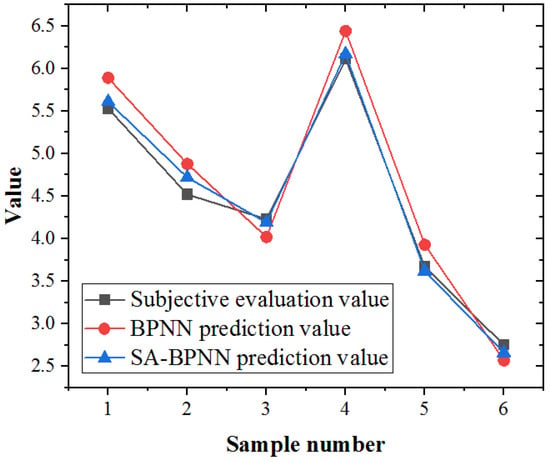
Figure 9.
Comparison of the subjective evaluation values of different methods.
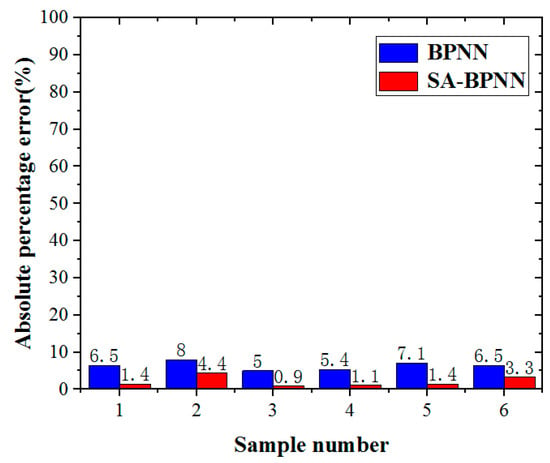
Figure 10.
Errors comparison of the subjective evaluation values of different algorithms.
3.2. Effect of Vibration Parameters on the Prediction Accuracy of the SA-BPNN Model
To evaluate the impact of vibration on driver comfort, the SA-BPNN model was used to predict driver comfort without the objective parameters of vibration (input parameters were loudness, roughness, sharpness, A-SPL, and AI), and the results were compared with the predicted results of the SA-BPNN model with all seven objective parameters, as shown in Figure 11 and Figure 12. The maximum absolute percentage error of the predicted values of driver comfort without the vibration input parameters was 27.3% and the minimum was 6.6%, with the tractor and working condition information corresponding to the different test samples shown in Table 4.
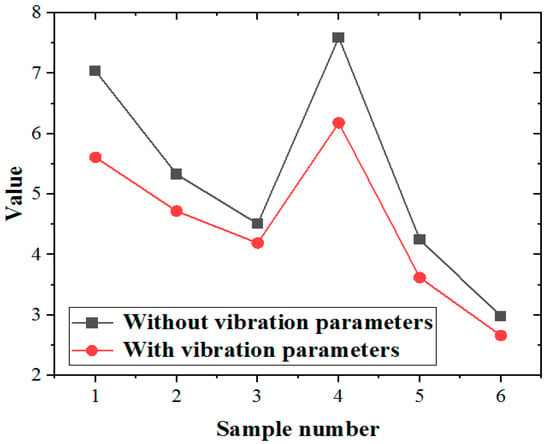
Figure 11.
Comparison of subjective evaluation values with and without vibration parameters.
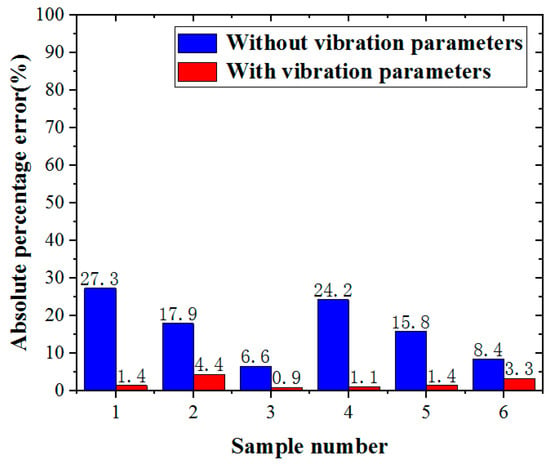
Figure 12.
Errors comparison of the subjective evaluation values with and without vibration parameters.

Table 4.
Comparison of the subjective evaluation errors.
These results indicate that the vibration parameters of hand vibration and seat vibration had significant impacts on the subjective evaluation of driver comfort. Therefore, when analyzing and evaluating the comfort of agricultural machinery operators, it is necessary to comprehensively consider the effects of both sound and vibration factors, and take measures to reduce vibration levels to improve operator comfort.
Test samples 1 and 4, which were measured in idling conditions, showed poor prediction accuracy for driver comfort without the objective parameters of vibration, with prediction errors of 27.3% and 24.2%, respectively. As the engine speed increased, the prediction accuracy for driver comfort without the vibration objective parameters improved. Test samples 2 and 5, which were measured at the maximum torque operating condition, had prediction errors of 17.9% and 15.8%, respectively. Test samples 3 and 6, which were measured at the rated power operating condition, had further reduced prediction errors of only 6.6% and 8.4%, respectively. These findings indicate that vibration had a greater impact on driver subjective comfort at low engine speed operating conditions.
Further analysis revealed that the engine speed played a role in masking the discomfort caused by vibration. As the engine speed increased from idle speed through the maximum torque to rated power, the resulting high decibel noise masked the discomfort caused by vibration, reducing the effect of vibration on the driver’s subjective comfort. Conversely, when the subjects were in a lower-amplitude noise environment, the vibration of the steering wheel and seat tended to mask the discomfort caused by low-level noise, and drivers focused more on the effect of the vibration on the subjective comfort of the human body. In higher-amplitude noise environments, the noise reduced the subjective human perception of vibration discomfort. This suggests that as the noise exposure increased, the human body became less sensitive to whole-body vibration. This observation aligns with previous findings that indicate that higher amplitude noise has a suppressive effect on vibration discomfort [20,31]. Overall, these findings have important implications for optimizing the design of tractor cabs and improving driver comfort.
The studies mentioned above indicate that when evaluating driver comfort in agricultural machinery, such as tractors, the impact of vibration on subjective cab comfort cannot be disregarded. Unlike gasoline or electric vehicles, there is a lesser focus on cab vibration studies in agricultural machinery. Therefore, it is essential to consider vibration as a significant parameter while developing subjective cab comfort evaluation models for tractors.
4. Conclusions
This study developed a new tractor cab subjective comfort prediction model (SA-BPNN) by combining the simulated annealing algorithm with a BP neural network. The main findings of the study were as follows:
- The SA-BPNN model outperformed the BPNN model, with a maximum prediction error of only 4.4%, indicating a higher prediction accuracy for the subjective comfort of tractor drivers;
- The analysis of the Pearson correlation coefficient showed that loudness, roughness, and sharpness had greater effects on the subjective comfort of the drivers;
- Vibration had a greater effect on driver subjective comfort in a lower amplitude noise environment;
- High-decibel noise had a masking effect on the discomfort caused by vibration.
Overall, the SA-BPNN model with loudness, roughness, sharpness, A-SPL, AI, hand vibration, and seat vibration as input parameters could effectively predict the subjective comfort of tractor drivers. This finding has important implications for tractor manufacturers, who can use this model to optimize the design of tractor cabs and improve driver comfort. The study’s rigorous methodology and the practical applications of the findings make this research relevant to industry professionals and researchers in the field of noise, vibration, and harshness.
Author Contributions
Conceptualization, Z.W.; methodology, Z.W.; software, Z.W.; validation, L.S.; formal analysis, L.S.; investigation, L.S.; resources, L.S.; data curation, Z.W.; writing—original draft preparation, Z.W.; writing—review and editing, Y.Z.; visualization, Z.W.; supervision, Y.Z.; project administration, Y.Z.; funding acquisition, Y.Z. All authors have read and agreed to the published version of the manuscript.
Funding
This research was funded by the National Natural Science Foundation of China, grant number 51575238 and Ministry of Science and Technology of the People’s Republic of China, grant number 2022YFD2001202.
Data Availability Statement
Not applicable.
Conflicts of Interest
The authors declare no conflict of interest.
References
- Pascale, A.; Fernandes, P.; Guarnaccia, C.; Coelho, M. A study on vehicle Noise Emission Modelling: Correlation with air pollutant emissions, impact of kinematic variables and critical hotspots. Sci. Total Environ. 2021, 787, 147647. [Google Scholar] [CrossRef]
- Wang, F.; Wang, H.; Zhou, X.; Fu, R. A Driving Fatigue Feature Detection Method Based on Multifractal Theory. IEEE Sens. J. 2022, 22, 19046–19059. [Google Scholar] [CrossRef]
- Shang, Z.; Hu, F.; Zeng, F.; Wei, L.; Xu, Q.; Wang, J. Research of transfer path analysis based on contribution factor of sound quality. Appl. Acoust. 2020, 173, 107693. [Google Scholar] [CrossRef]
- Chen, P.; Xu, L.; Tang, Q.; Shang, L.; Liu, W. Research on prediction model of tractor sound quality based on genetic algorithm. Appl. Acoust. 2022, 185, 108411. [Google Scholar] [CrossRef]
- Huang, X.; Huang, H.; Wu, J.; Yang, M.; Ding, W. Sound quality prediction and improving of vehicle interior noise based on deep convolutional neural networks. Expert Syst. Appl. 2020, 160, 113657. [Google Scholar] [CrossRef]
- Jin, Y.; Jin, H.; Kang, J. Effects of sound types and sound levels on subjective environmental evaluations in different seasons. Build. Environ. 2020, 183, 107215. [Google Scholar] [CrossRef]
- Qian, K.; Hou, Z. Intelligent evaluation of the interior sound quality of electric vehicles. Appl. Acoust. 2021, 173, 107684. [Google Scholar] [CrossRef]
- Wang, Y.S.; Shen, G.Q.; Xing, Y.F. A sound quality model for objective synthesis evaluation of vehicle interior noise based on artificial neural network. Mech. Syst. Signal Process. 2014, 45, 255–266. [Google Scholar] [CrossRef]
- Wang, Z.; Li, P.; Liu, H.; Yang, J.; Liu, S.; Xue, L. Objective sound quality evaluation for the vehicle interior noise based on responses of the basilar membrane in the human ear. Appl. Acoust. 2021, 172, 107619. [Google Scholar] [CrossRef]
- Zhang, J.; Xia, S.; Ye, S.; Xu, B.; Zhu, S.; Xiang, J.; Tang, H. Sound quality evaluation and prediction for the emitted noise of axial piston pumps. Appl. Acoust. 2019, 145, 27–40. [Google Scholar] [CrossRef]
- Liu, Z.; Li, X.; Du, S.; Chen, W.; Shao, J.; Zheng, Q. Strategy and implementing techniques for the sound quality target of car interior noise during acceleration. Appl. Acoust. 2021, 182, 108171. [Google Scholar] [CrossRef]
- Zuo, Y.Y.; Zhou, S.L.; Zhou, W.F. Subjective Analysis and Objective Evaluation of Vehicle Sound Quality. Adv. Mater. Res. 2013, 716, 674–679. [Google Scholar] [CrossRef]
- Wang, X.; Song, Y.; Wang, T.; Wang, Y.; Liu, N. Hybrid vibro-acoustic active control method for vehicle interior sound quality under high-speed. Appl. Acoust. 2022, 186, 108419. [Google Scholar] [CrossRef]
- Huang, H.B.; Huang, X.R.; Li, R.X.; Lim, T.C.; Ding, W.P. Sound quality prediction of vehicle interior noise using deep belief networks. Appl. Acoust. 2016, 113, 149–161. [Google Scholar] [CrossRef]
- Liao, X.; Zheng, S. Quantification and characterization of the role of subjective preferences on vehicle acceleration sound quality. Mech. Syst. Signal Process. 2020, 138, 106549. [Google Scholar] [CrossRef]
- Zhang, E.; Zhuo, J.; Hou, L.; Fu, C.; Guo, T. Comprehensive annoyance modeling of forklift sound quality based on rank score comparison and multi-fuzzy analytic hierarchy process. Appl. Acoust. 2021, 173, 107705. [Google Scholar] [CrossRef]
- Pan, J.; Cao, X.; Wang, D.; Chen, J.; Yuan, J. Vehicle Interior Sound Quality Evaluation Index Selection Scheme Based on Grey Relational Analysis. Fluct. Noise Lett. 2020, 19, 2050031. [Google Scholar] [CrossRef]
- Lu, Y.; Zuo, Y.; Wang, H.; Wu, C. Sound quality prediction for power coupling mechanism of HEV based on CEEMD-HT and RVM. Neural Comput. Appl. 2020, 33, 8201–8216. [Google Scholar] [CrossRef]
- Li, D.; Huang, Y. The discomfort model of the micro commercial vehicles interior noise based on the sound quality analyses. Appl. Acoust. 2018, 132, 223–231. [Google Scholar] [CrossRef]
- Huang, Y.; Griffin, M.J. The effects of sound level and vibration magnitude on the relative discomfort of noise and vibration. J. Acoust. Soc. Am. 2012, 131, 4558–4569. [Google Scholar] [CrossRef]
- Lu, Z.-Q.; Gu, D.-H.; Ding, H.; Lacarbonara, W.; Chen, L.-Q. Nonlinear vibration isolation via a circular ring. Mech. Syst. Signal Process. 2020, 136, 106490. [Google Scholar] [CrossRef]
- Zwicker, E.; Fastl, H.; Widmann, U.; Kurakata, K.; Kuwano, S.; Namba, S. Program for calculating loudness according to DIN 45631 (ISO 532B). Acoust. Sci. Technol. 2011, 12, 39–42. [Google Scholar] [CrossRef]
- Sottek, R.; Krebber, W.; Stanley, G. Tools and Methods for Product Sound Design of Vehicles. In SAE Technical Paper; SAE: Warrendale, PA, USA, 2005. [Google Scholar] [CrossRef]
- Zwicker, E.; Fastl, H. Psychoacoustics: Facts and Models; Springer Science & Business Media: Berlin, Germany, 2013. [Google Scholar]
- Bismarck, G.V. Sharpness as an attribute of the timbre of steady sounds. Acta Acust. United Acust. 1974, 30, 159–172. [Google Scholar]
- Aures, W. Der sensorische wohlklang als funktion psychoakustischer empfindungsgrössen. Acta Acust. United Acust. 1985, 58, 282–290. [Google Scholar]
- Aures, W. A procedure for calculating auditory roughness. Acustica 1985, 58, 268–281. [Google Scholar]
- Qian, K.; Hou, Z.; Sun, Q.; Gao, Y.; Sun, D.; Liu, R. Evaluation and optimization of sound quality in high-speed trains. Appl. Acoust. 2021, 174, 107830. [Google Scholar] [CrossRef]
- Khan, S.U.; Al-Sabri, E.H.A.; Ismail, R.; Mohammed, M.M.S.; Hussain, S.; Mehmood, A. Prediction Model of a Generative Adversarial Network Using the Concept of Complex Picture Fuzzy Soft Information. Symmetry 2023, 15, 577. [Google Scholar] [CrossRef]
- Li, L.; Ke, Y.; Zhang, T.; Zhao, J.; Huang, Z. A Human Defecation Prediction Method Based on Multi-Domain Features and Improved Support Vector Machine. Symmetry 2022, 14, 1763. [Google Scholar] [CrossRef]
- Howart HV, C.; Griffin, M.J. Subjective response to combined noise and vibration: Summation and interaction effects. J. Sound Vib. 1990, 143, 443–454. [Google Scholar] [CrossRef]
Disclaimer/Publisher’s Note: The statements, opinions and data contained in all publications are solely those of the individual author(s) and contributor(s) and not of MDPI and/or the editor(s). MDPI and/or the editor(s) disclaim responsibility for any injury to people or property resulting from any ideas, methods, instructions or products referred to in the content. |
© 2023 by the authors. Licensee MDPI, Basel, Switzerland. This article is an open access article distributed under the terms and conditions of the Creative Commons Attribution (CC BY) license (https://creativecommons.org/licenses/by/4.0/).