A Framework for Detection of Exact Global and Partial Symmetry in 3D CAD Models


Abstract
1. Introduction
1.1. Computer-Aided Symmetry Detection
1.2. Planes and Axes of Symmetry Candidates
1.3. Symmetry Detections in 3D CAD Models
1.4. Symmetry Measures
1.5. Similarity Measures
2. Materials and Methods
2.1. B-Rep Analysis
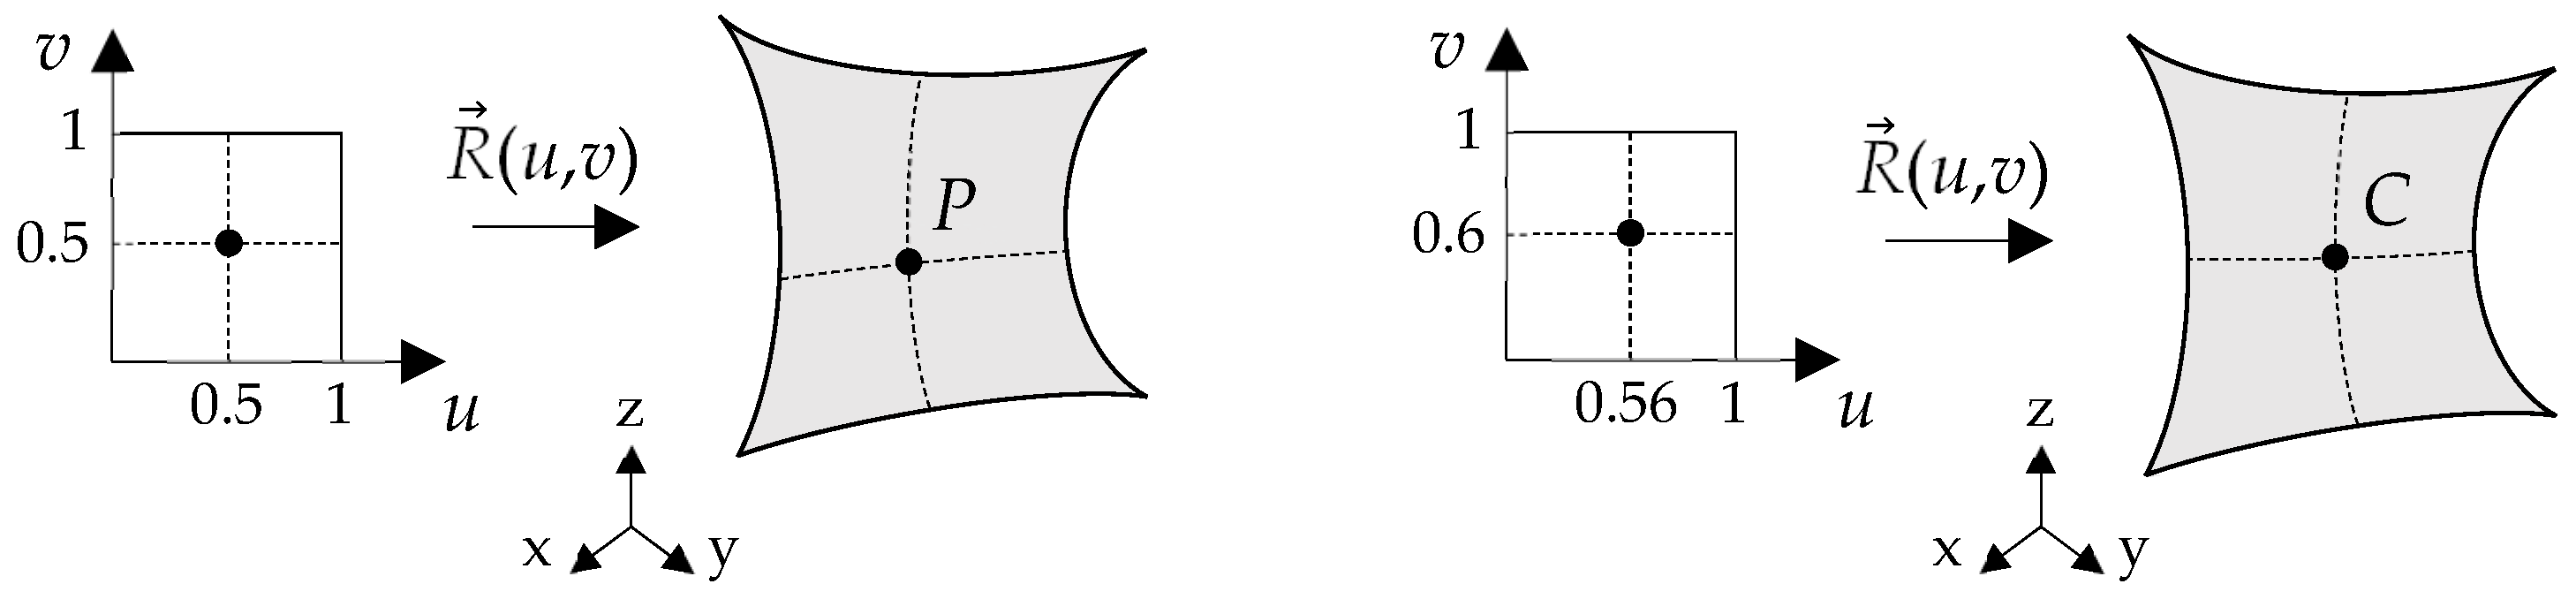
Computing Surface Properties
2.2. Generating Planes and Axes of Symmetry Candidates
2.2.1. Planes of Symmetry Candidates
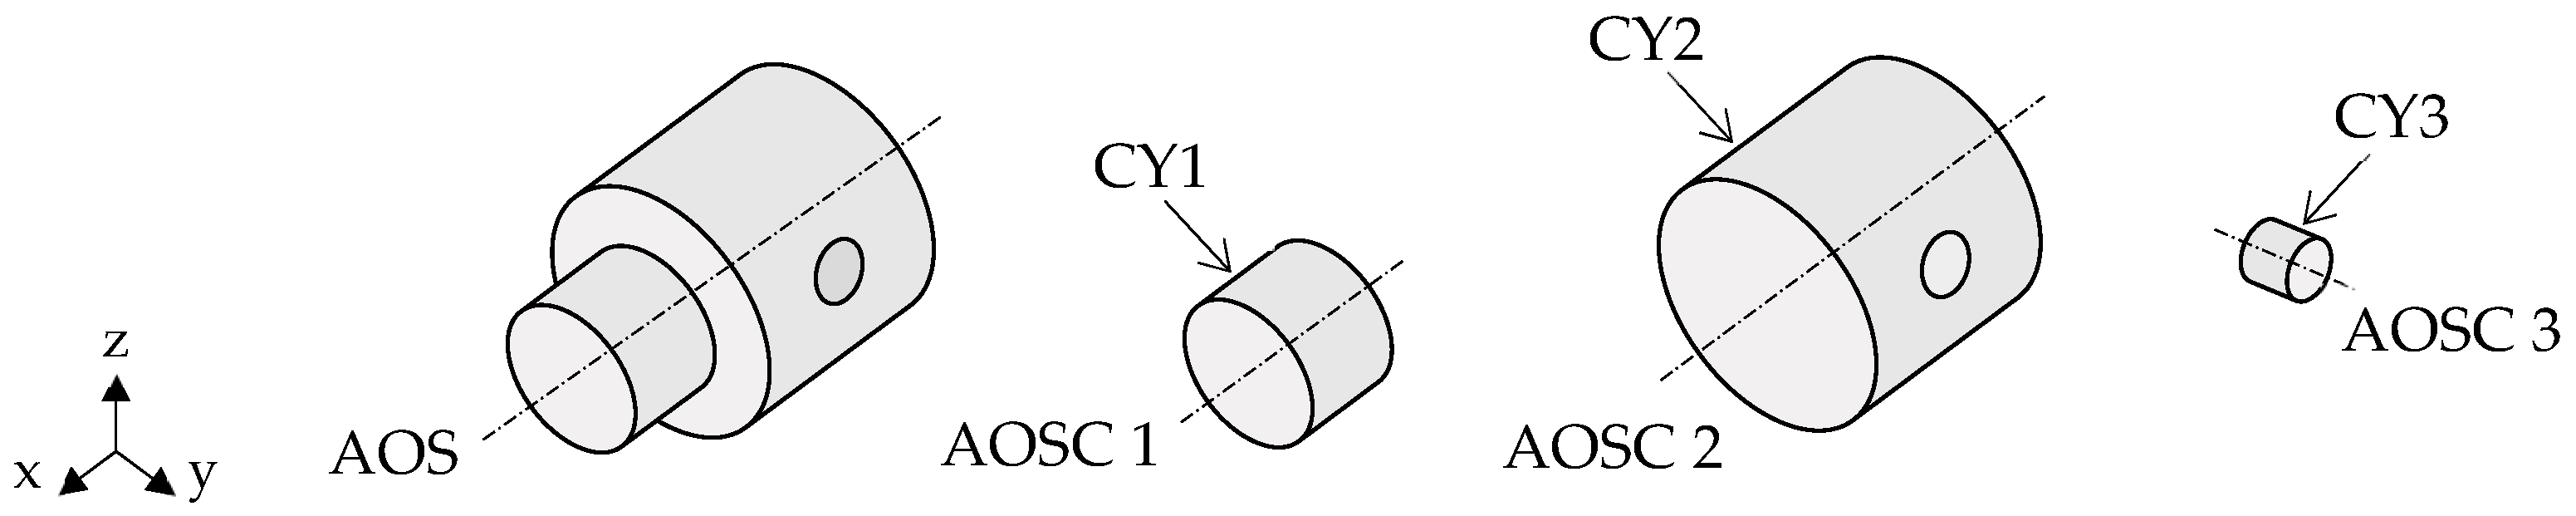
2.2.2. Axes of Symmetry Candidates
2.3. Trimming Planes and Axes of Symmetry Candidates
2.4. Symmetry Detection
2.4.1. Reflectional Symmetry
2.4.2. Axisymmetry
2.4.3. Global Symmetry Index
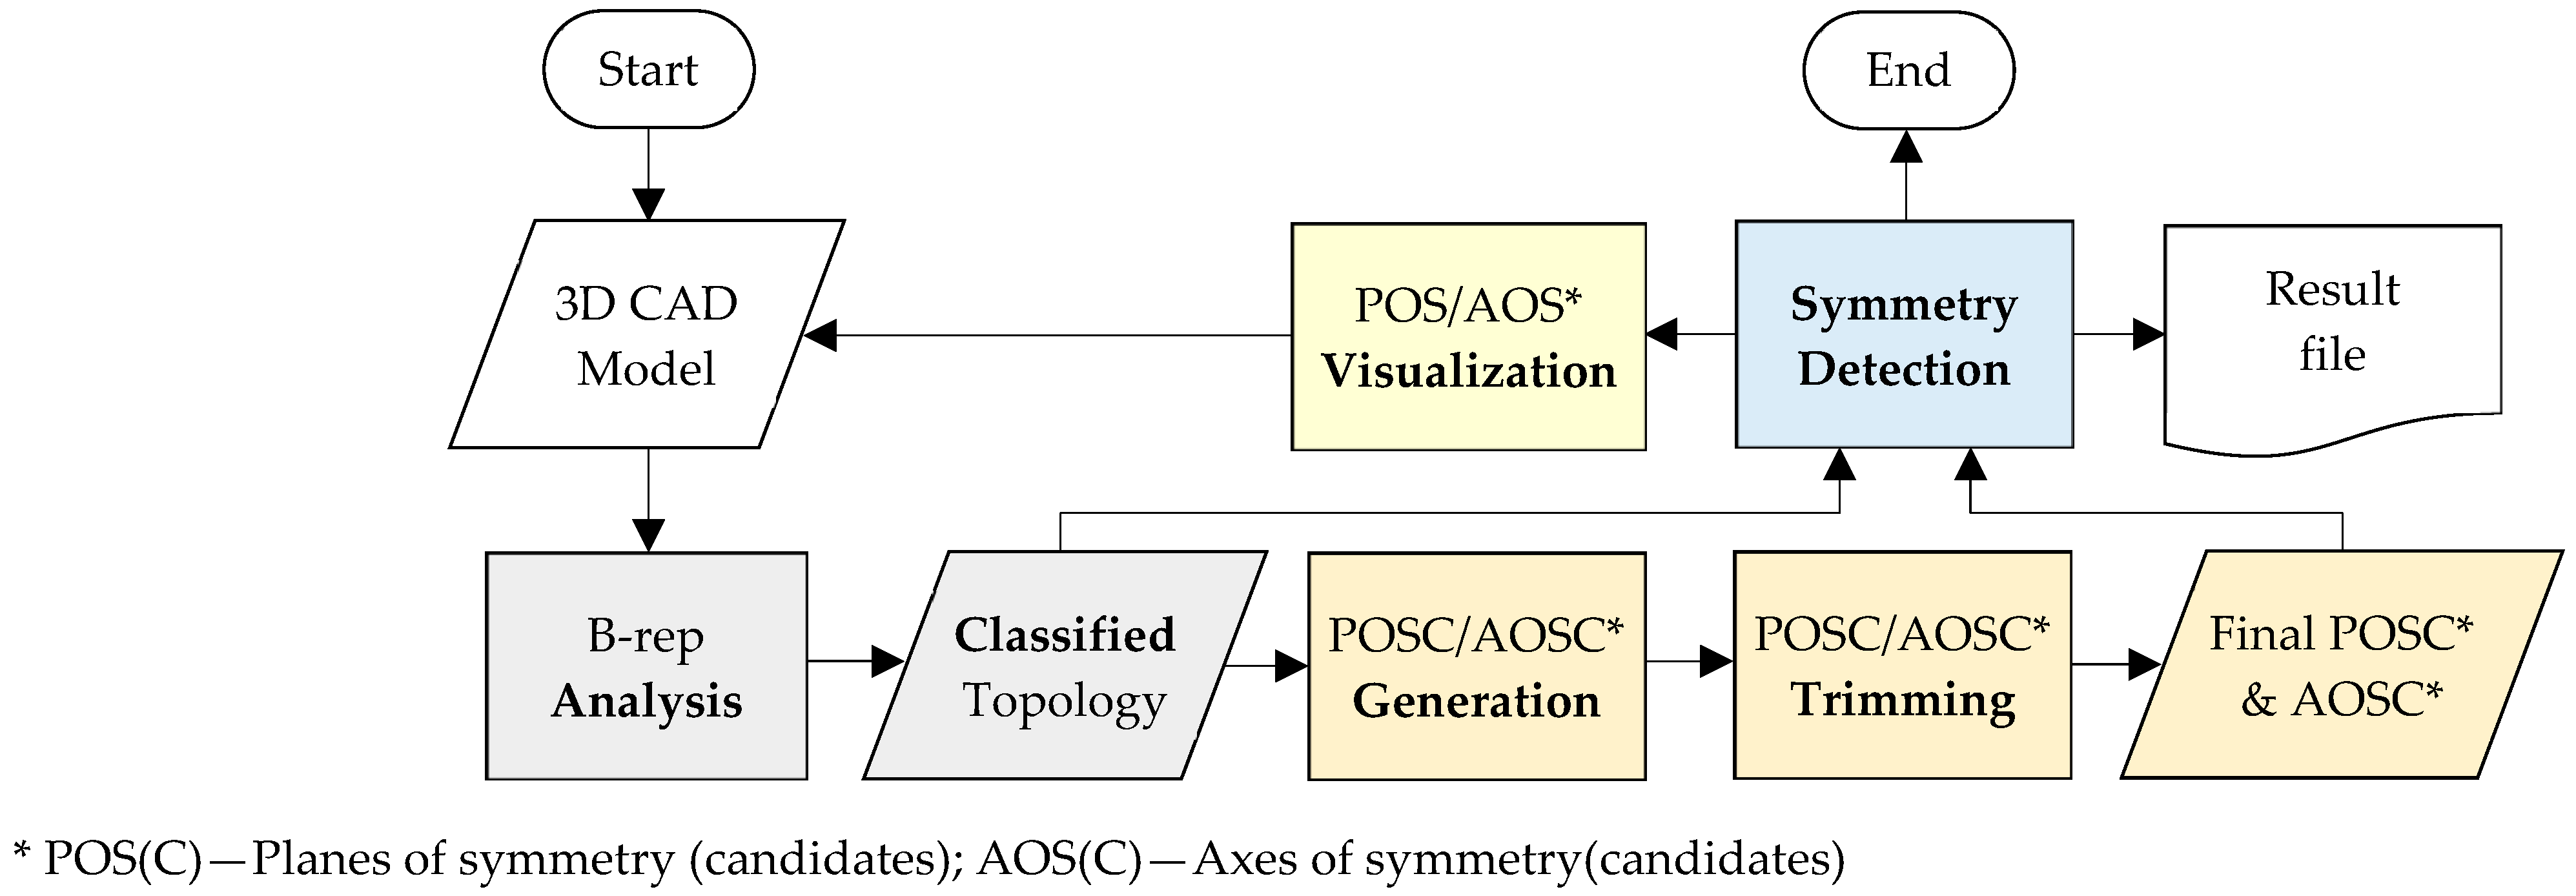
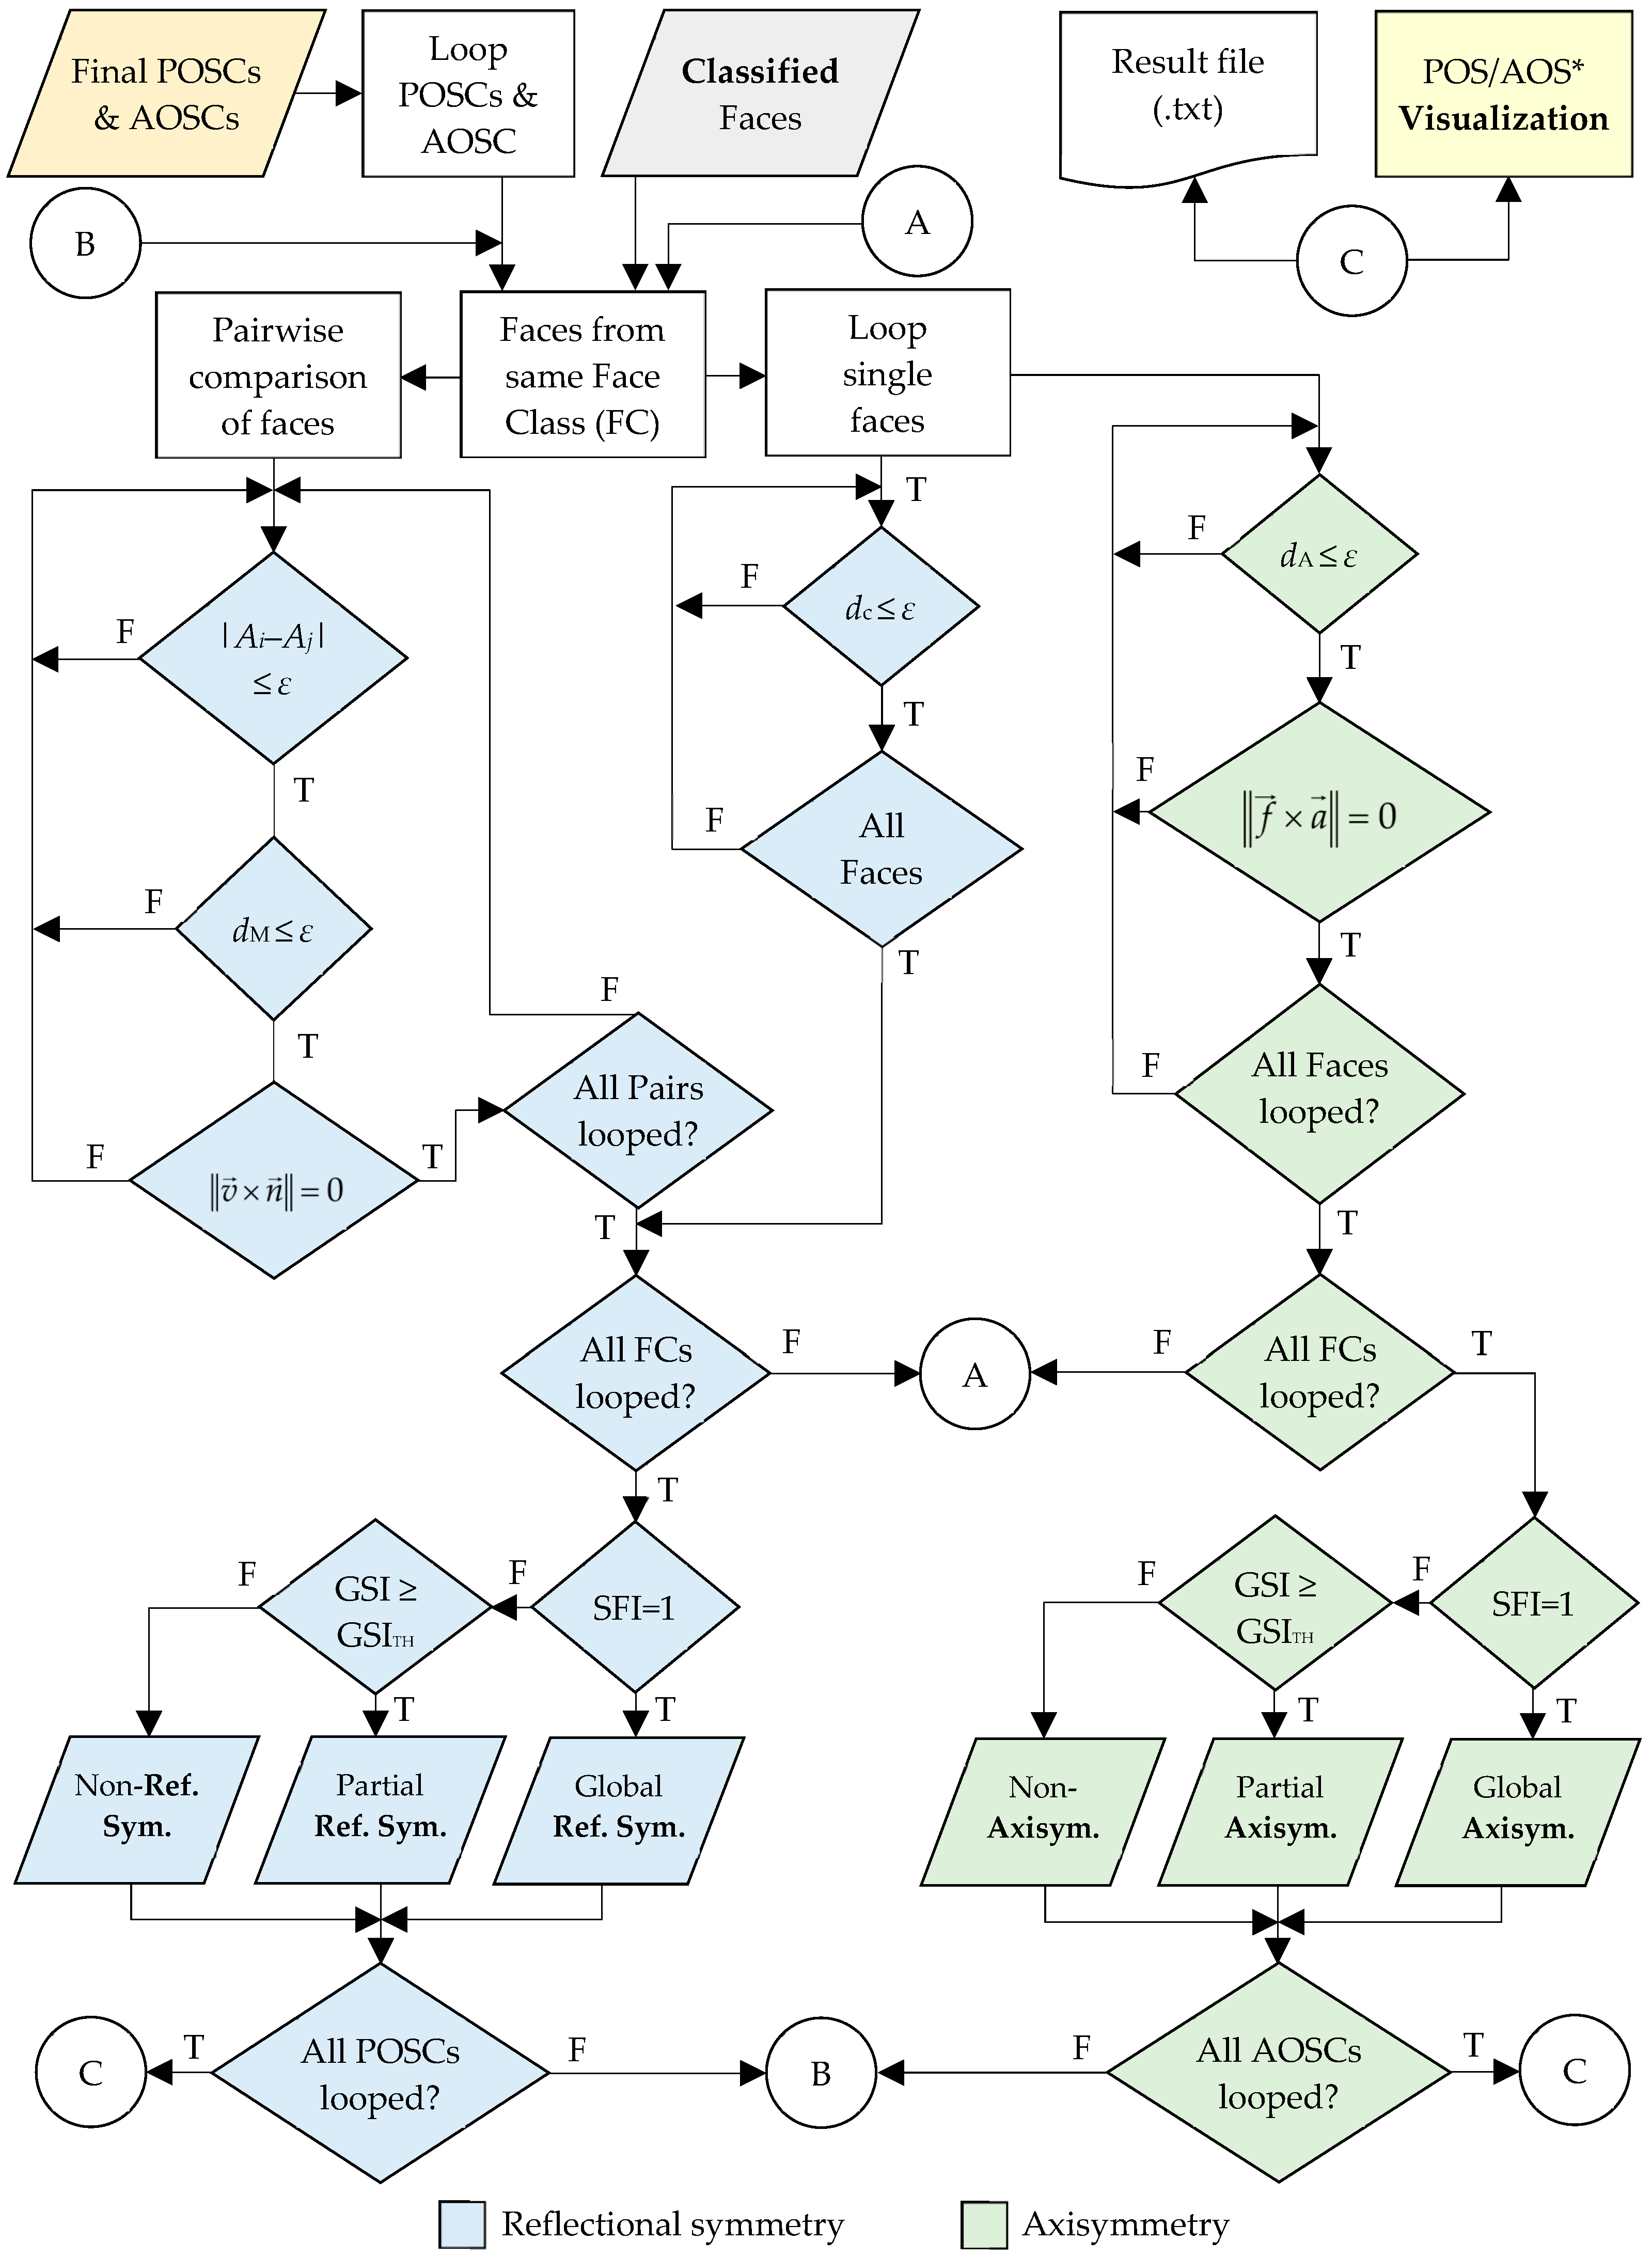
2.4.4. Flowchart of the Symmetry Detection
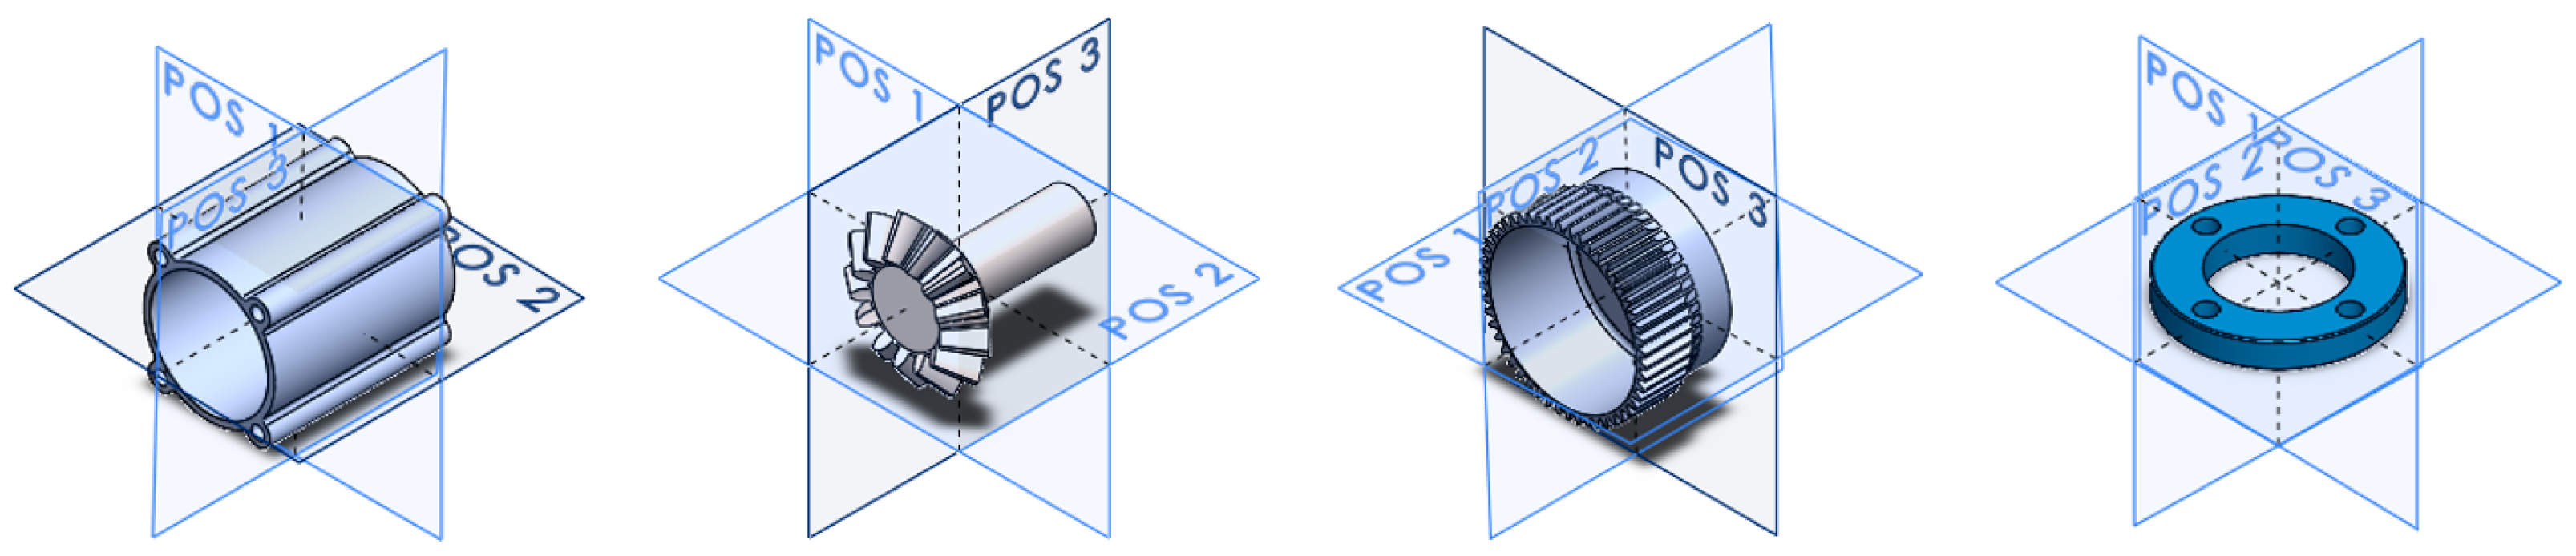
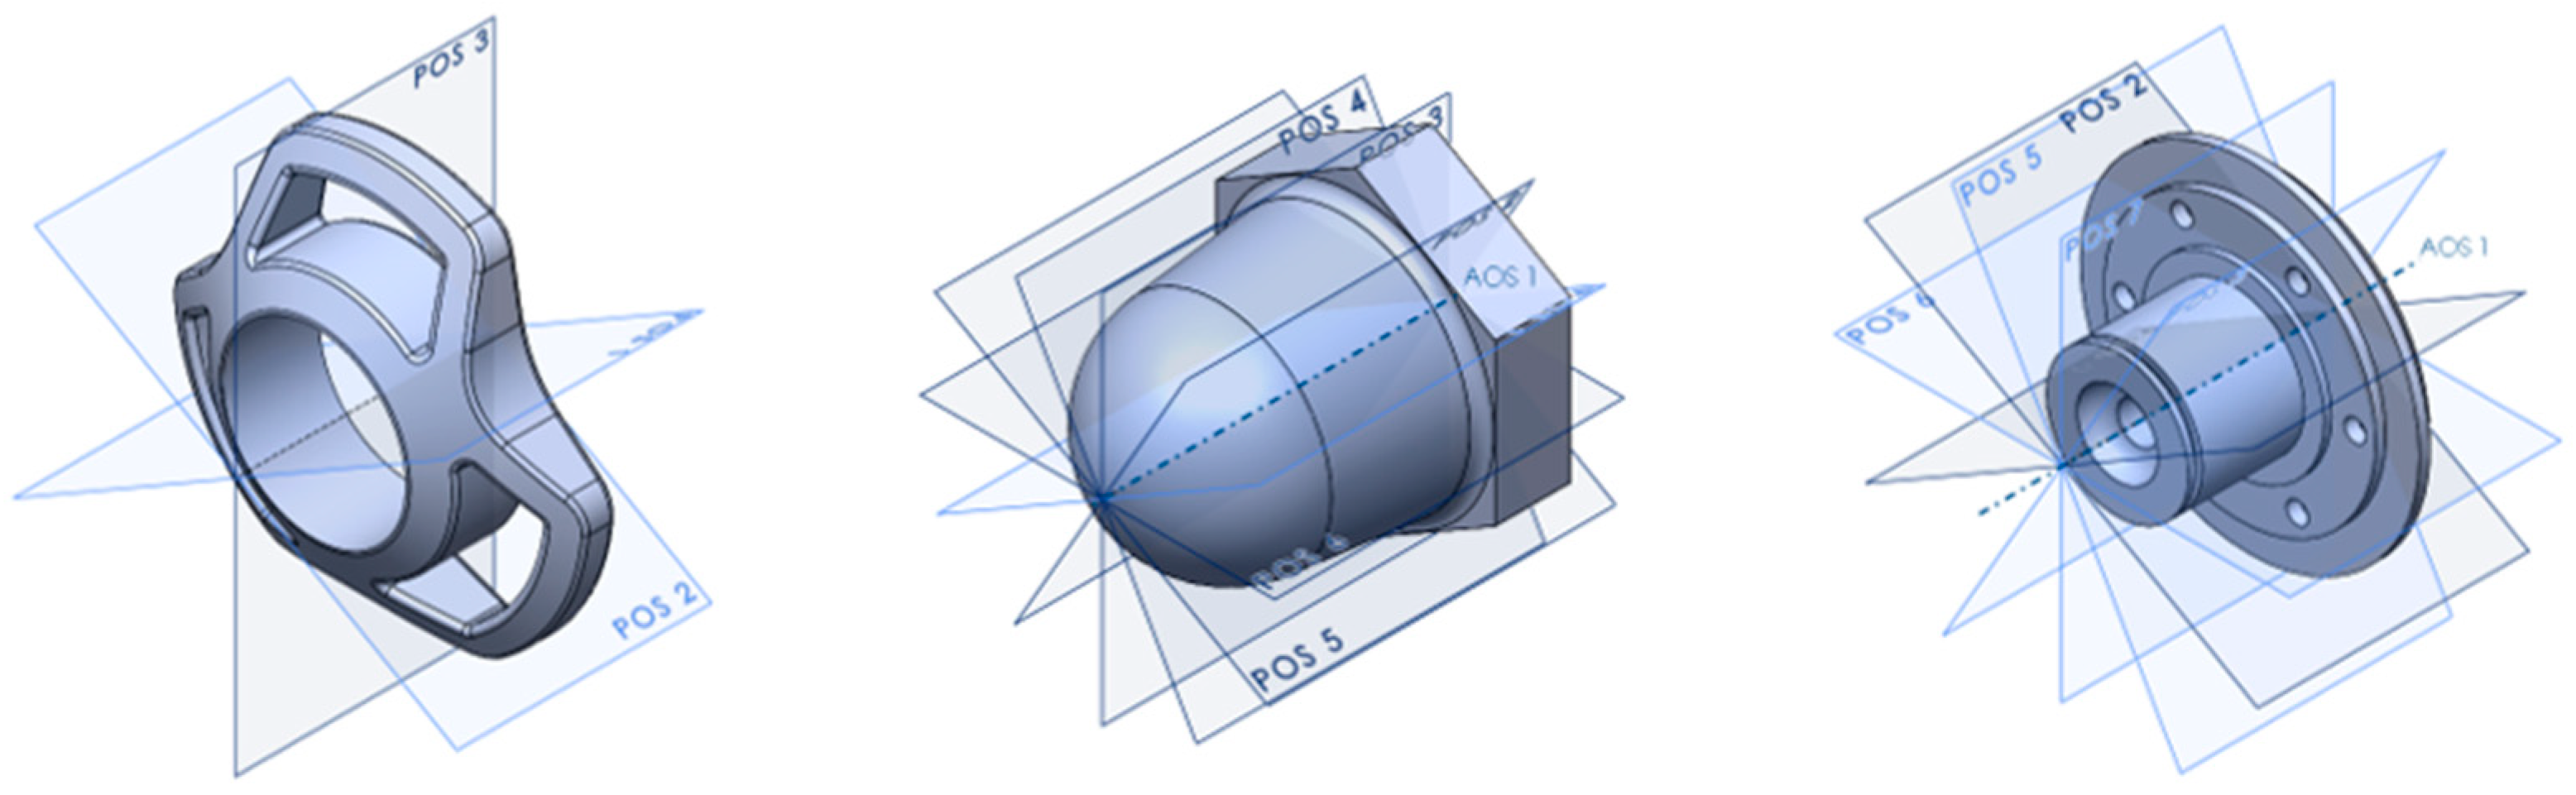
2.5. Visualization of the Planes and Axes of Symmetry
2.6. Implementation
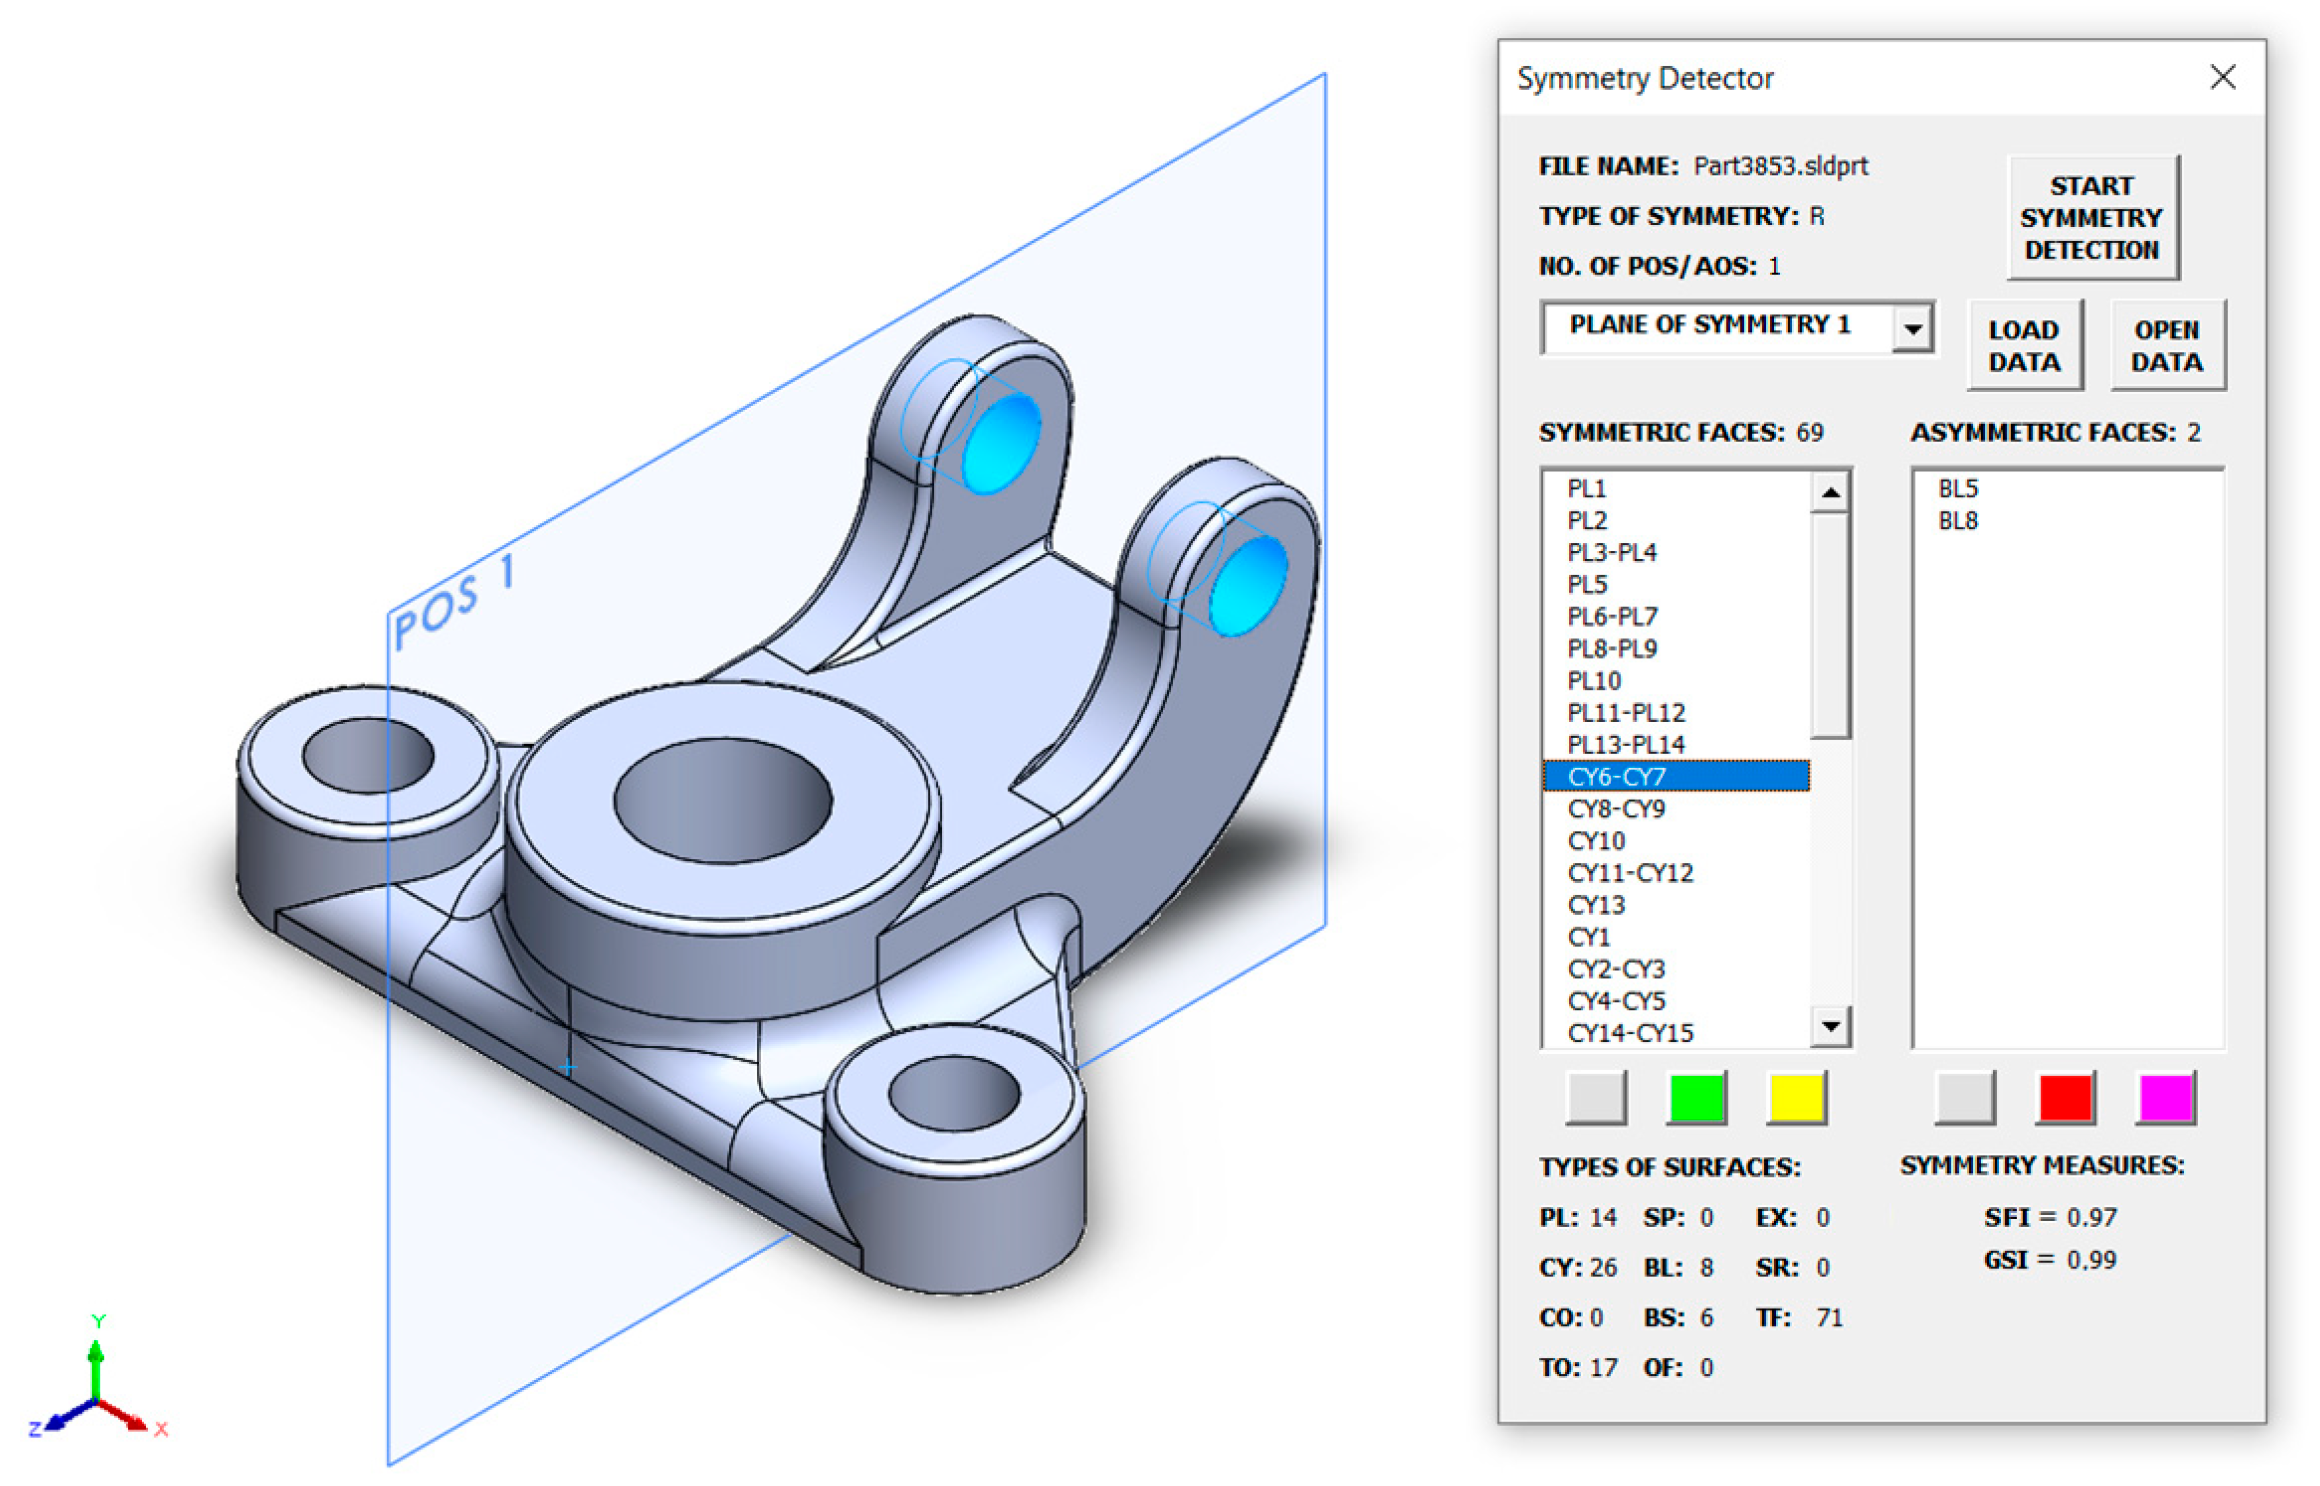
2.6.1. Graphical User Interface
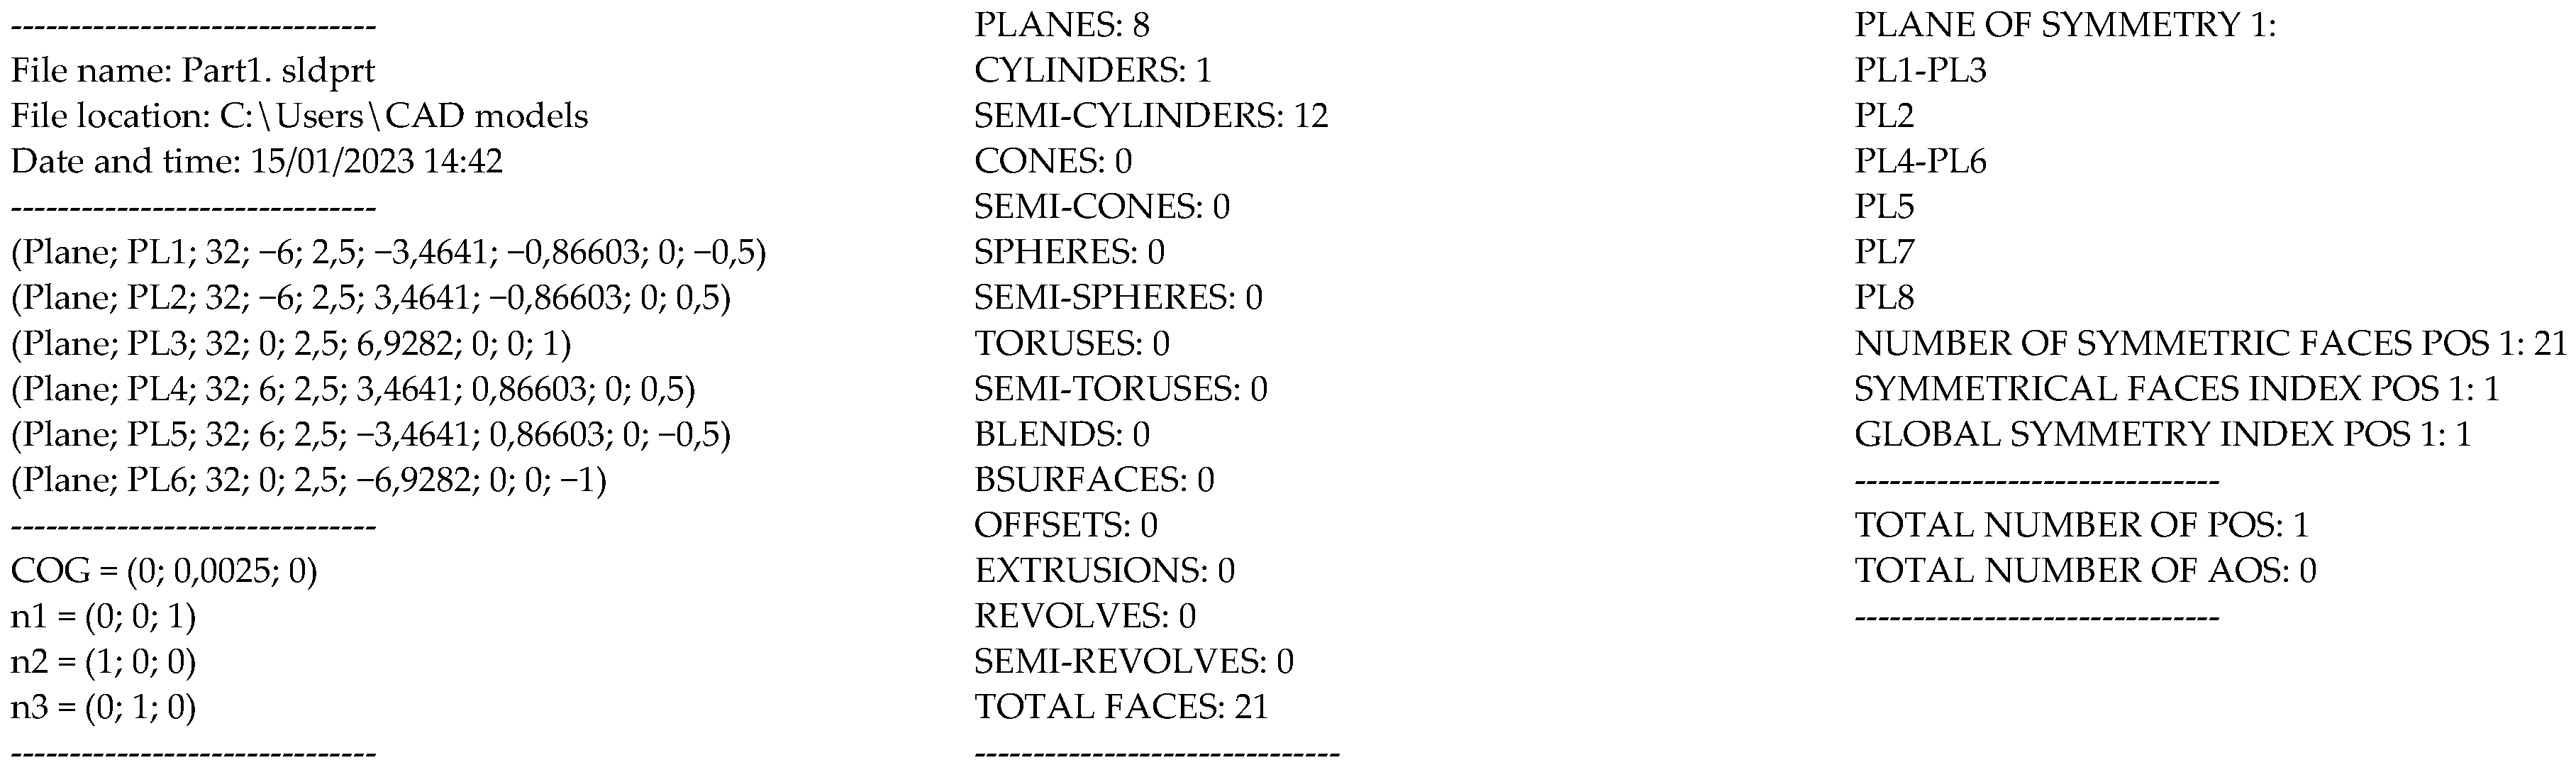
2.6.2. Result File
3. Results
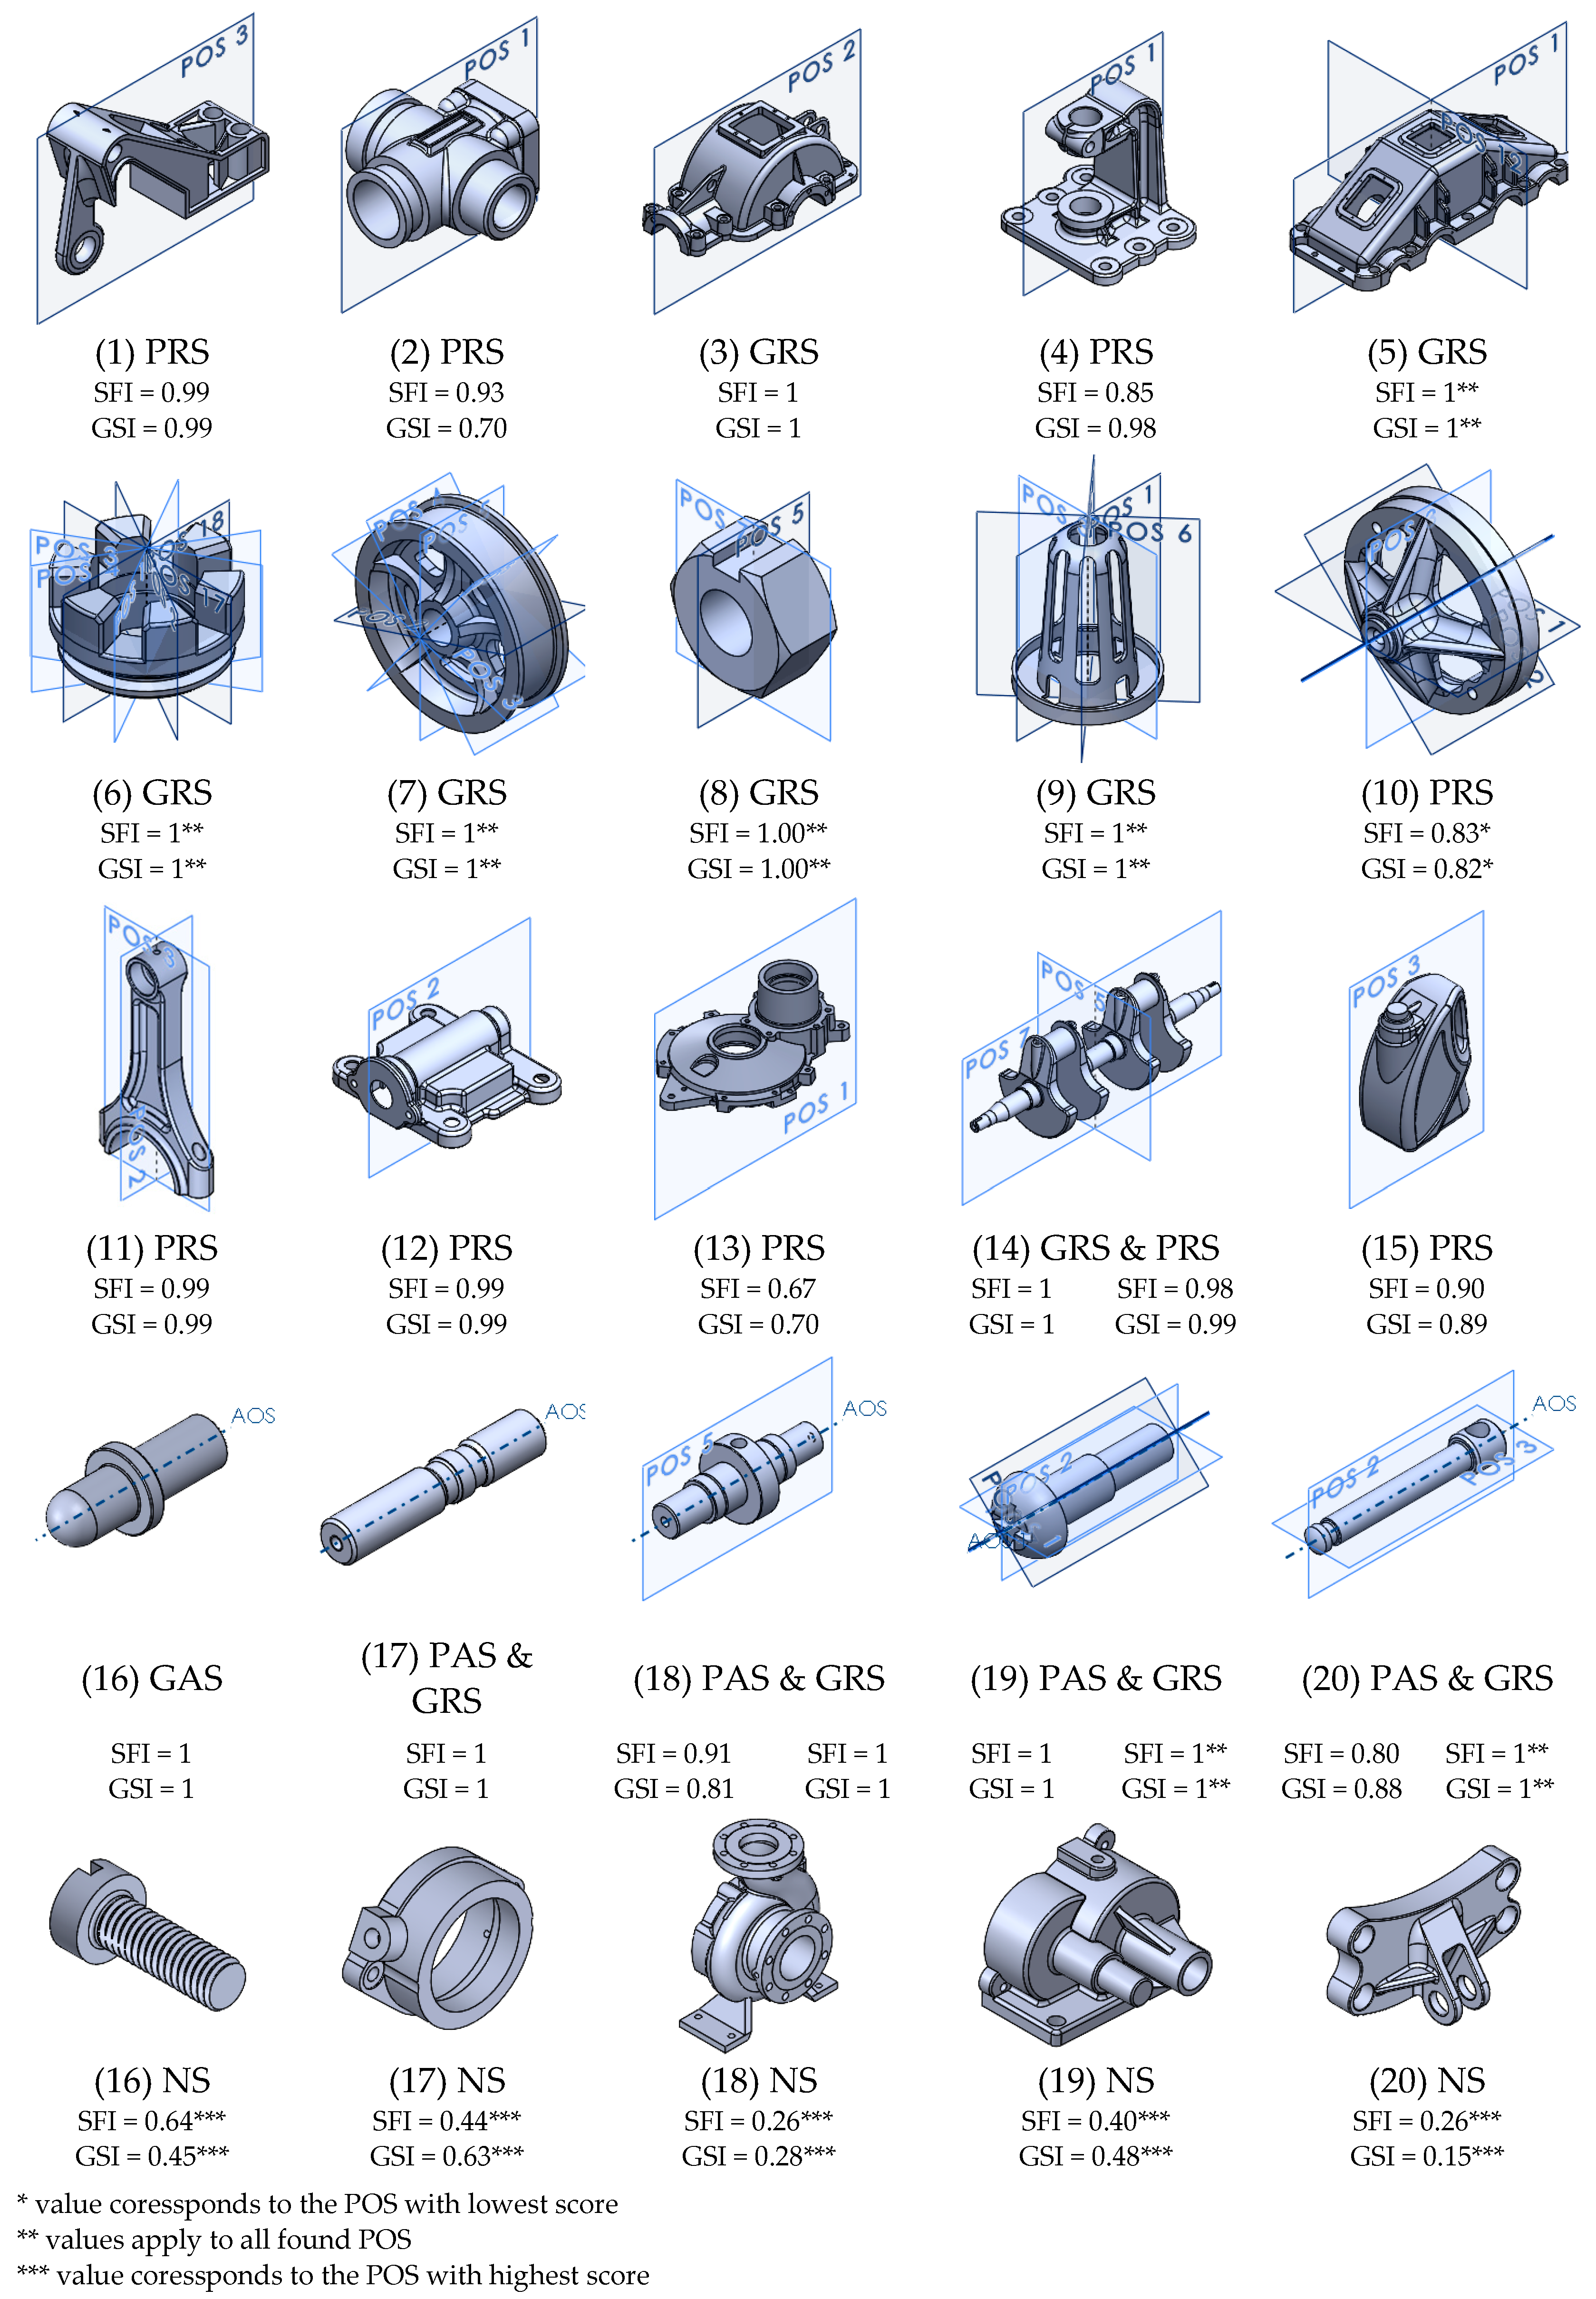
3.1. Validation
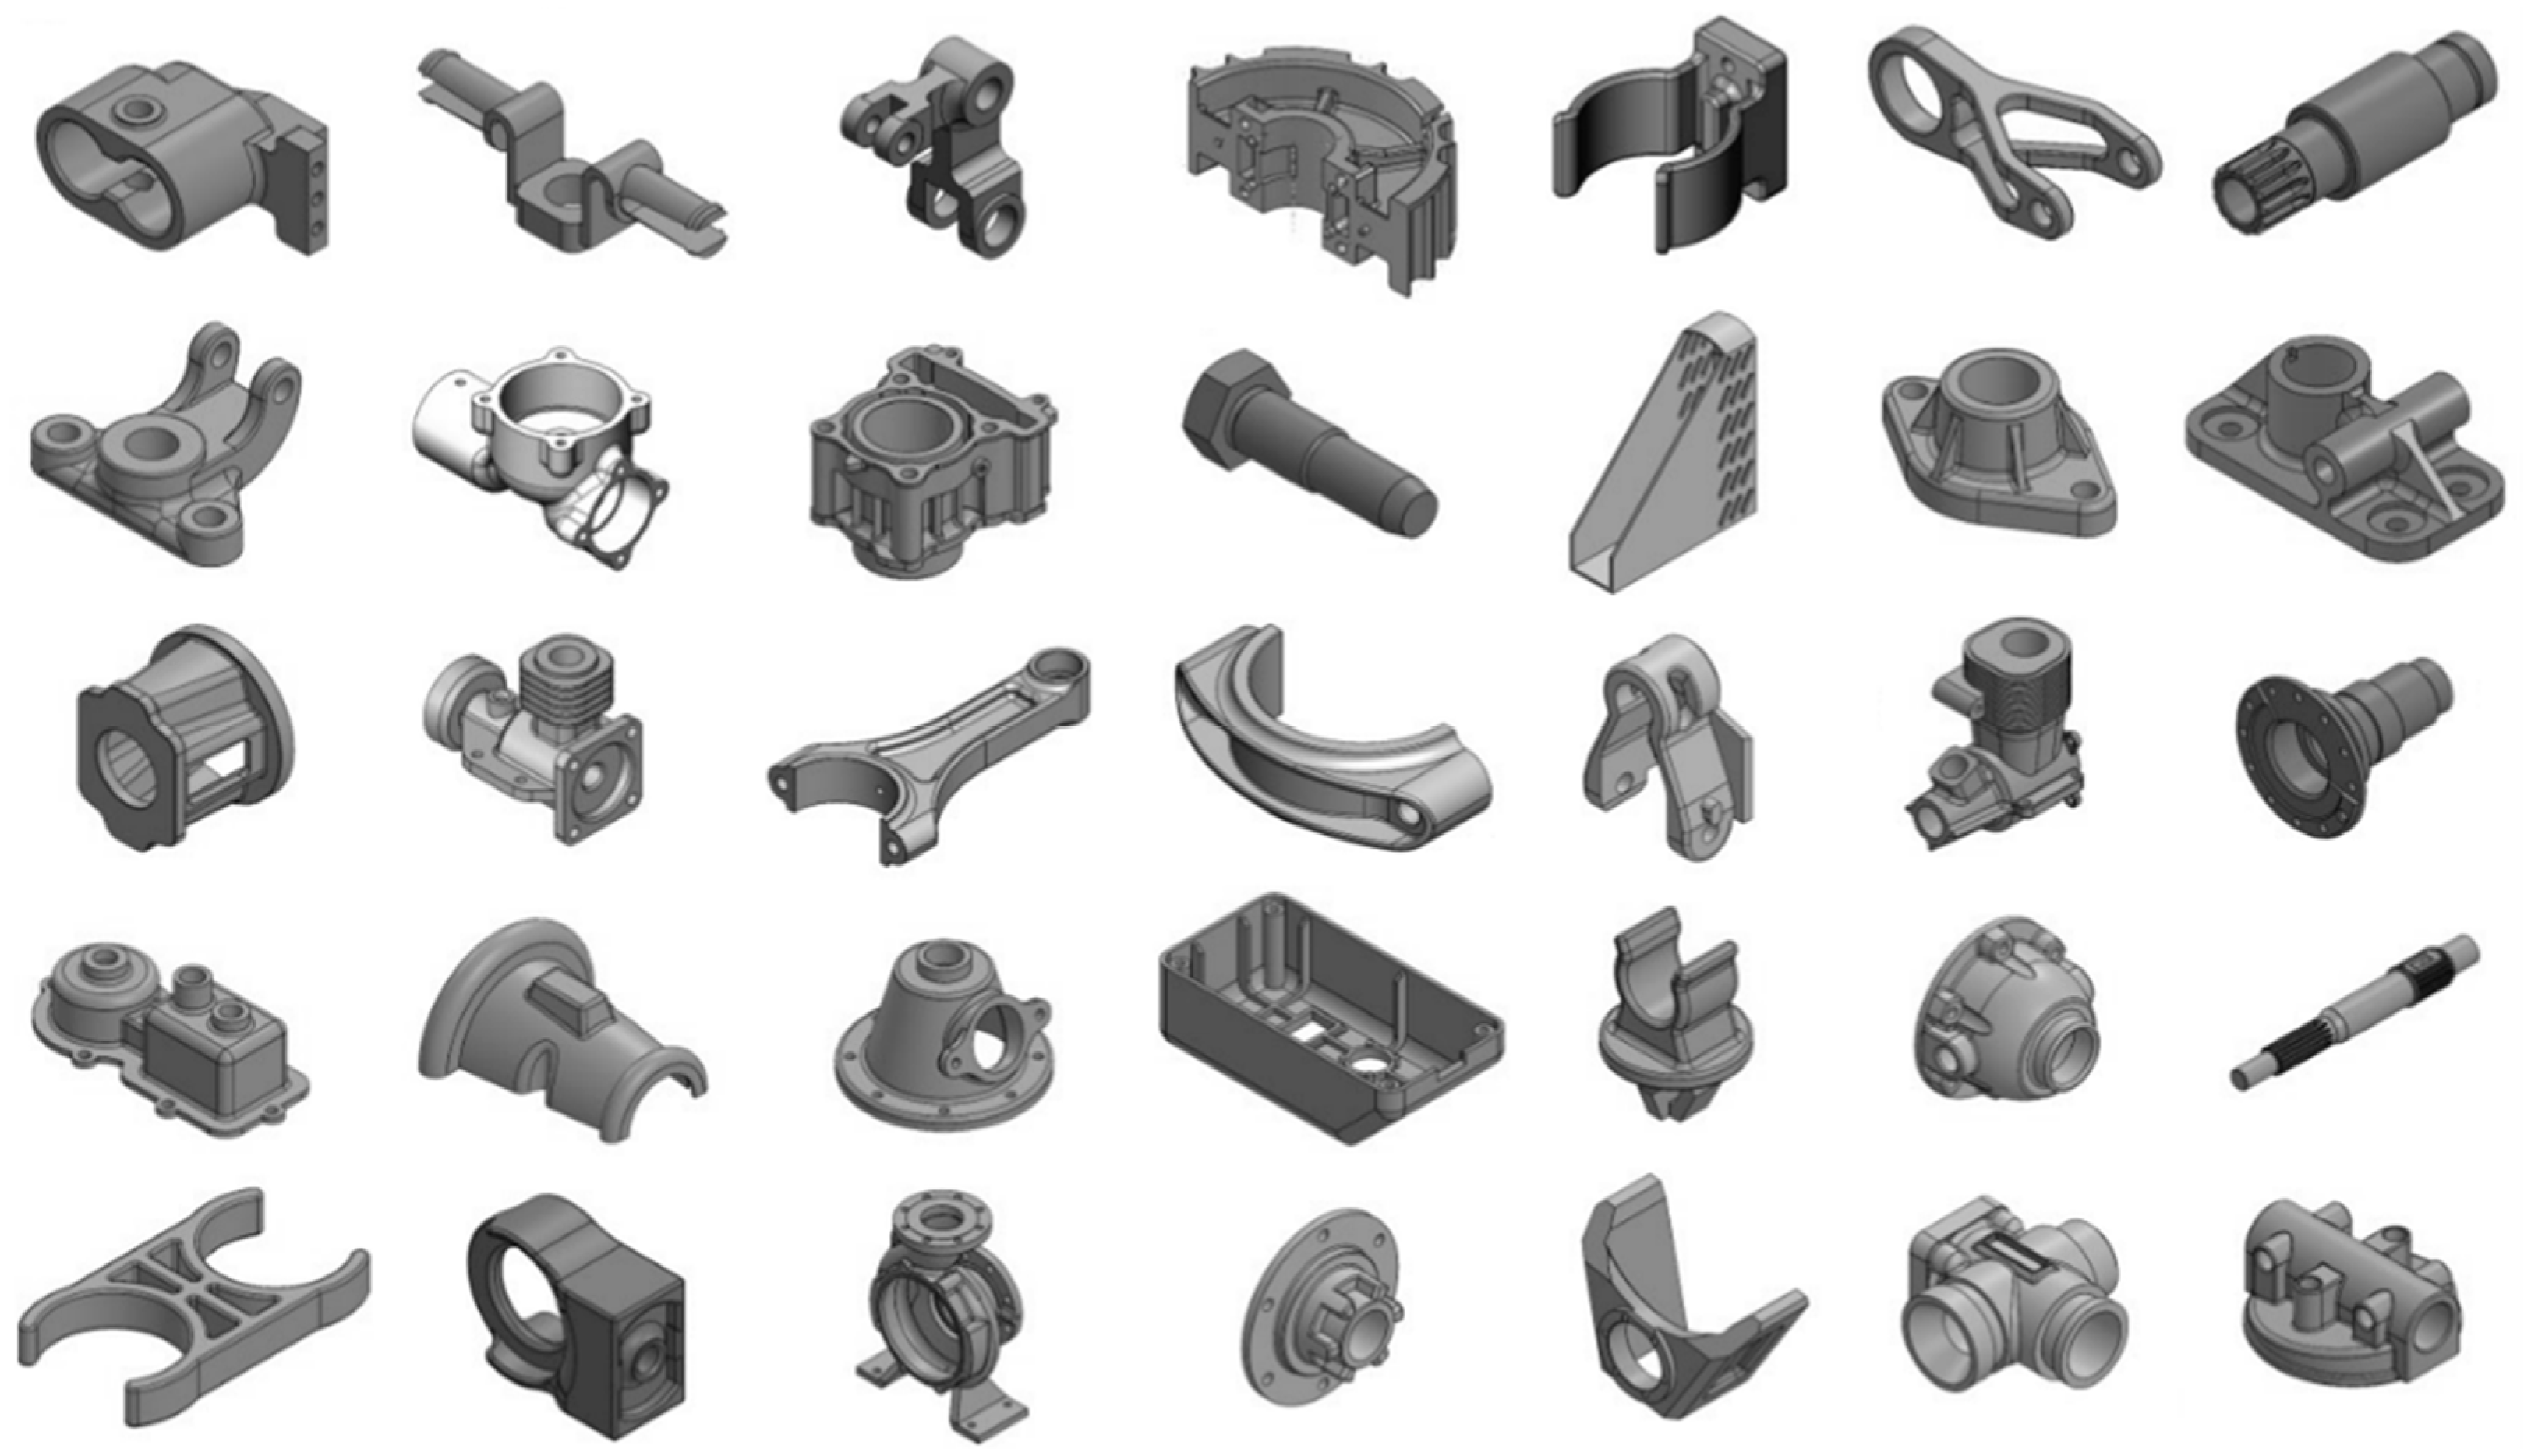
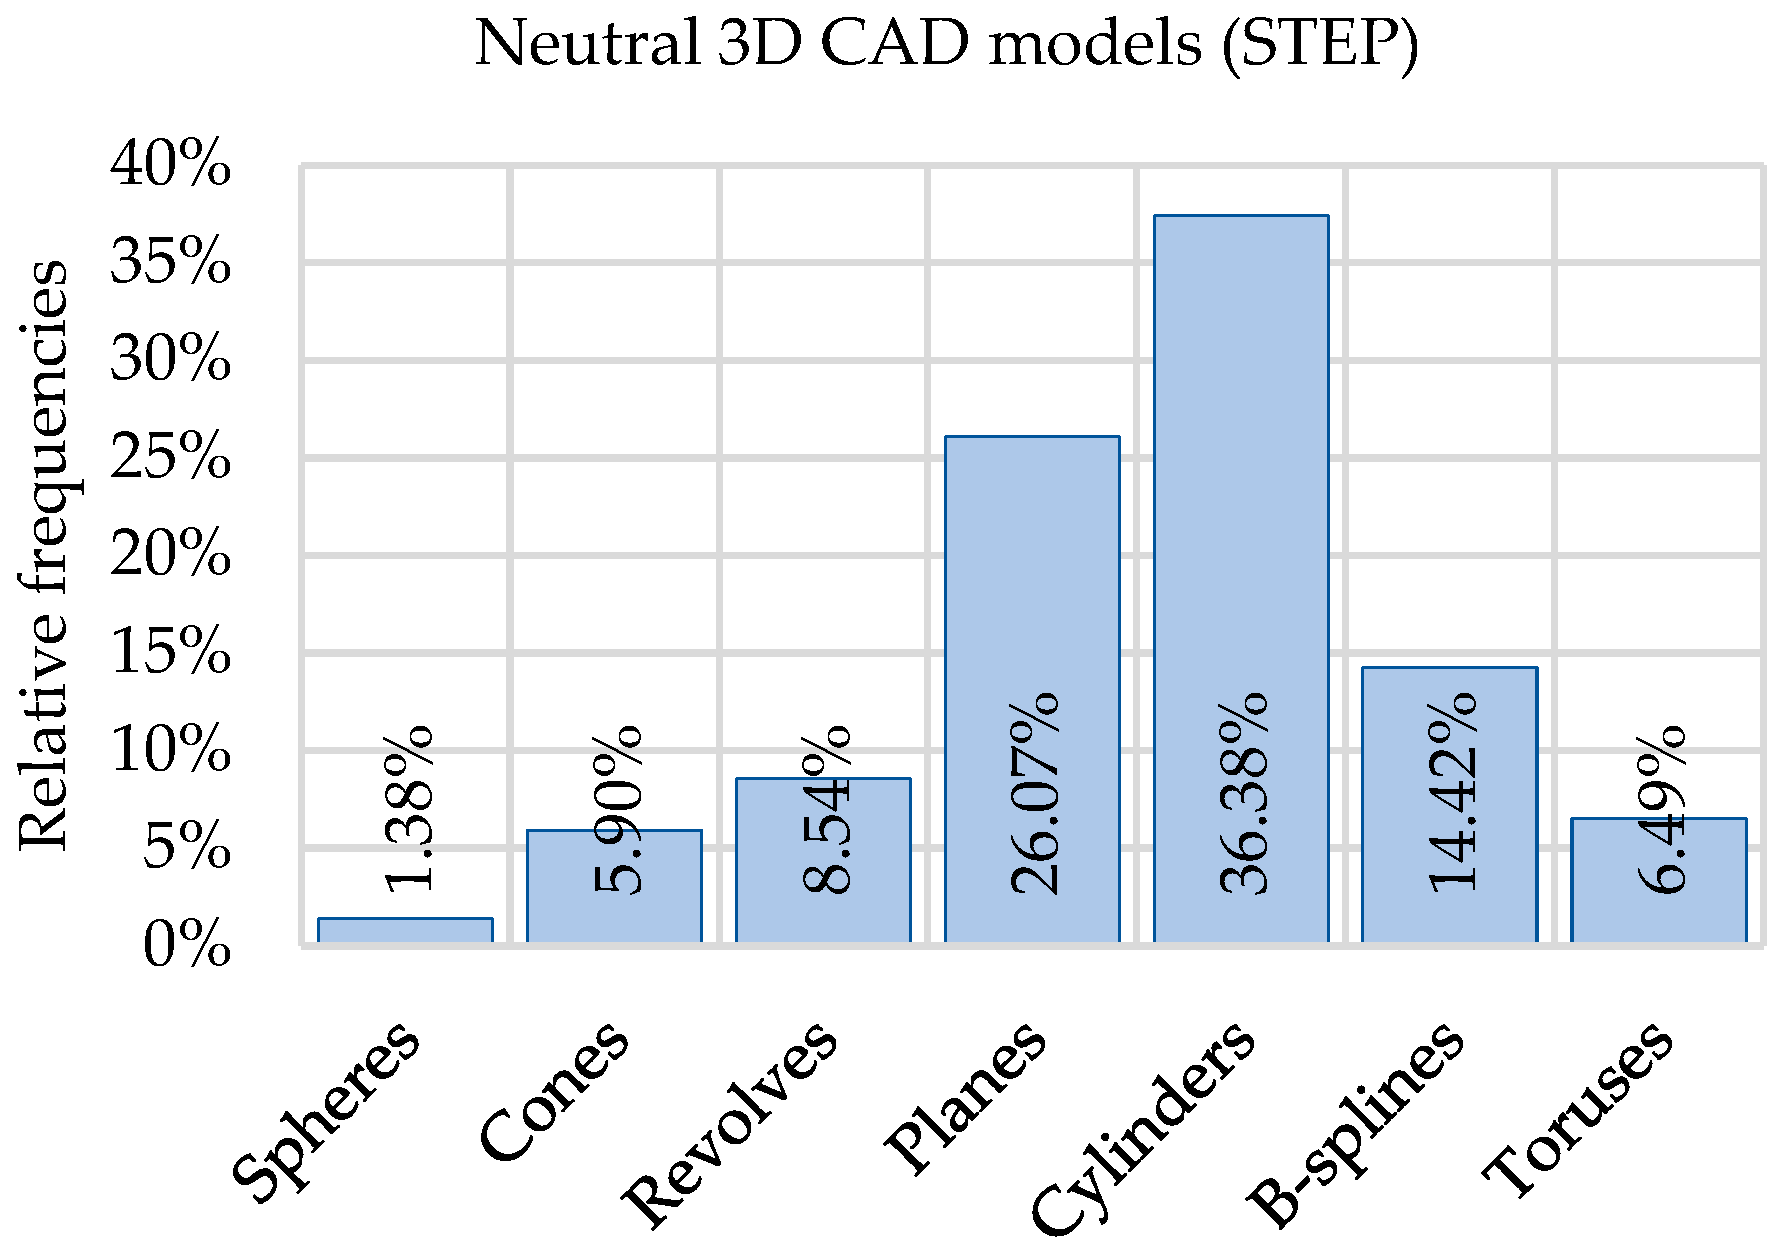
3.2. Data Collection
3.3. Performance
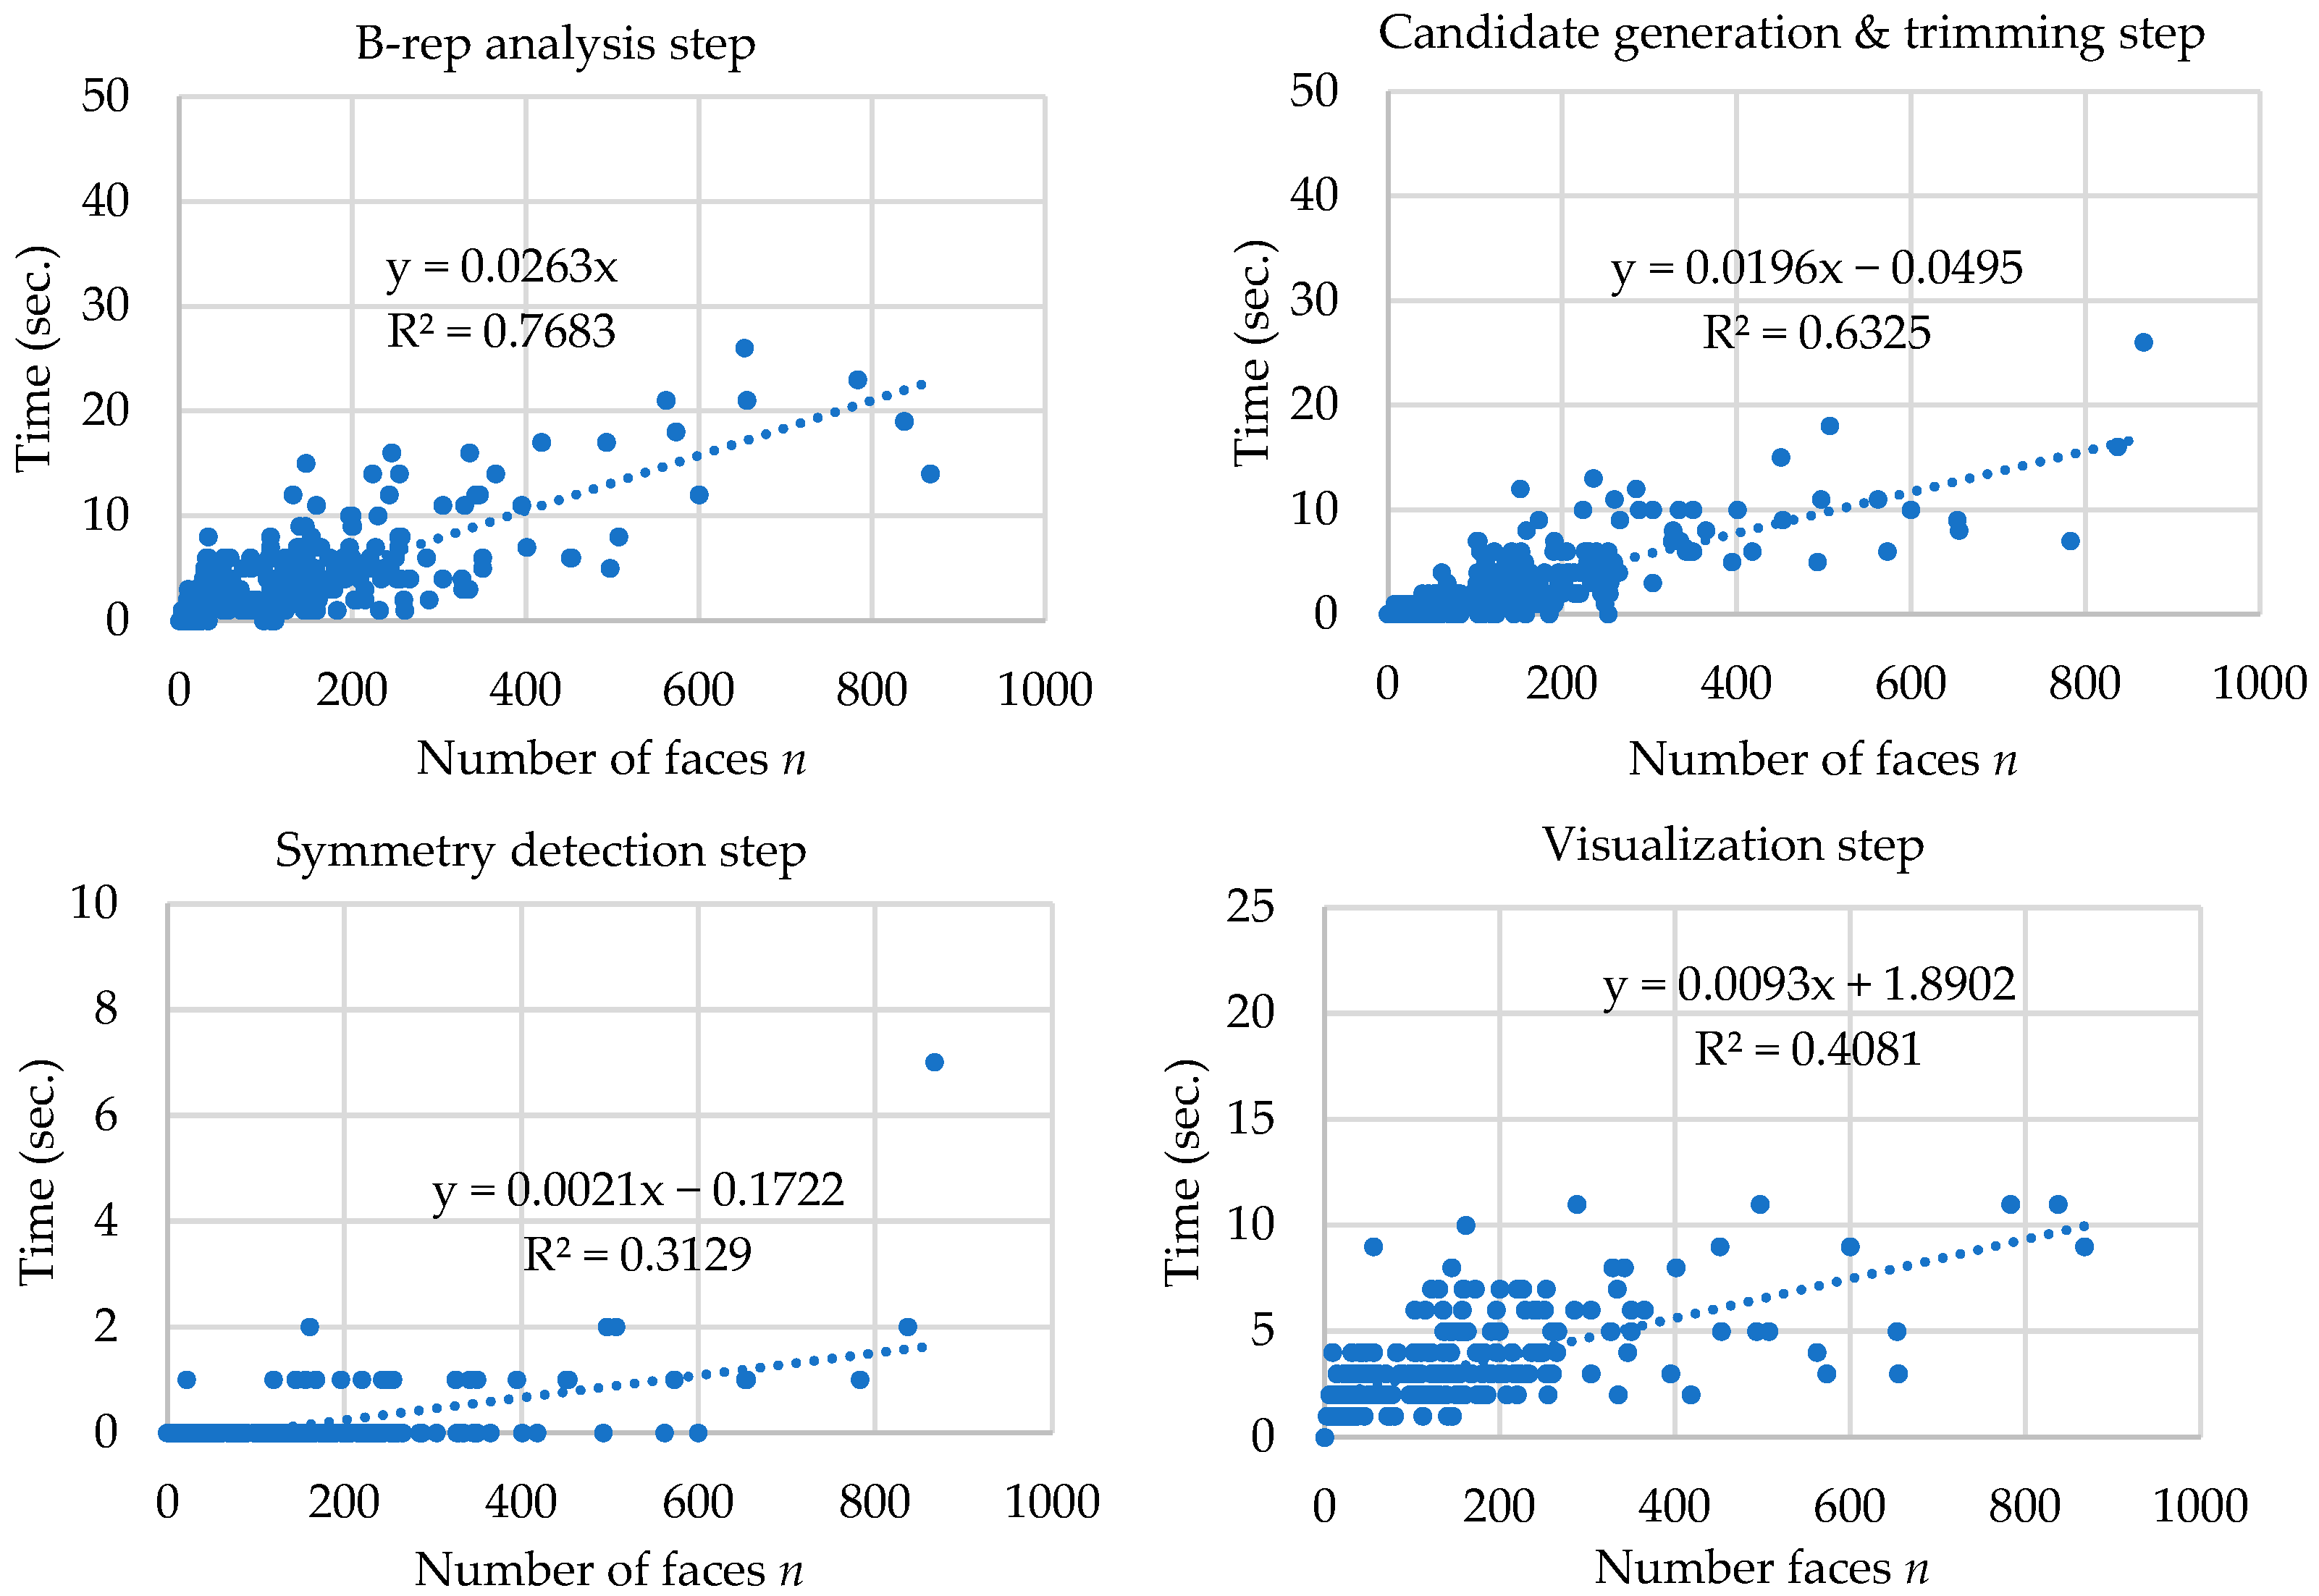
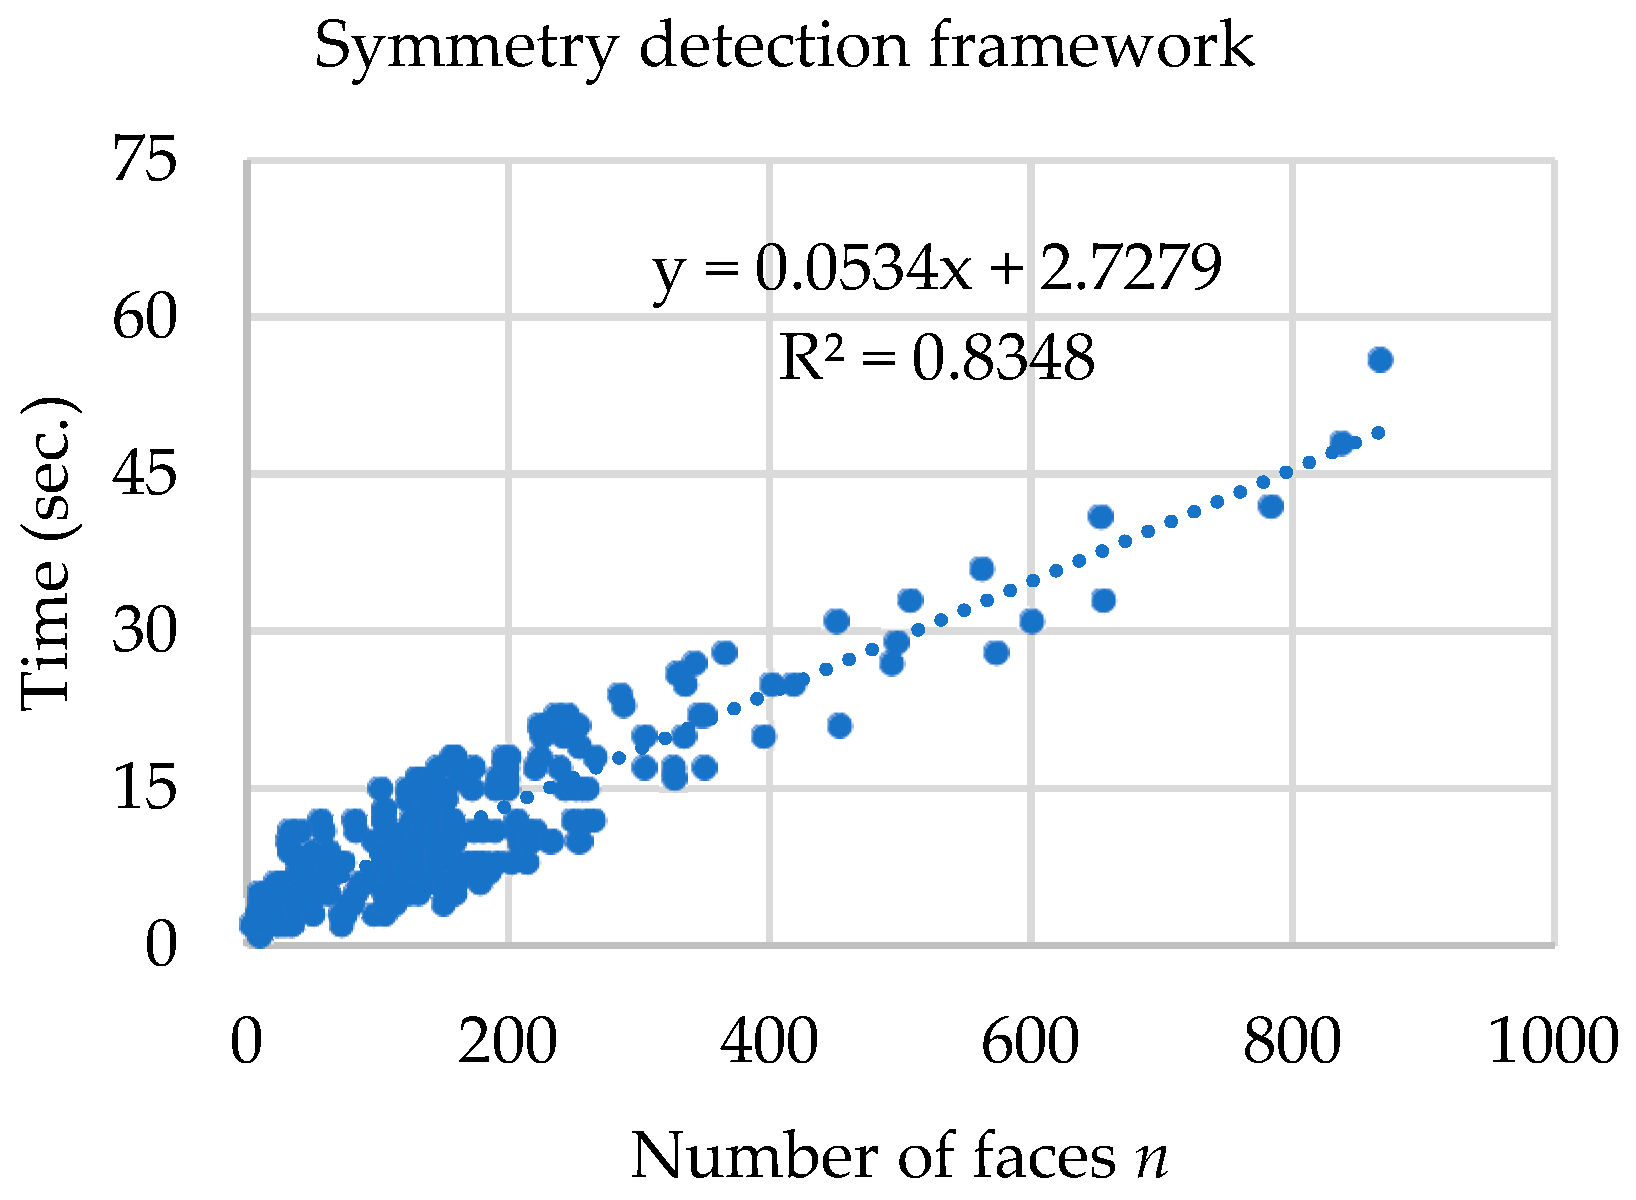
3.4. Time Complexity
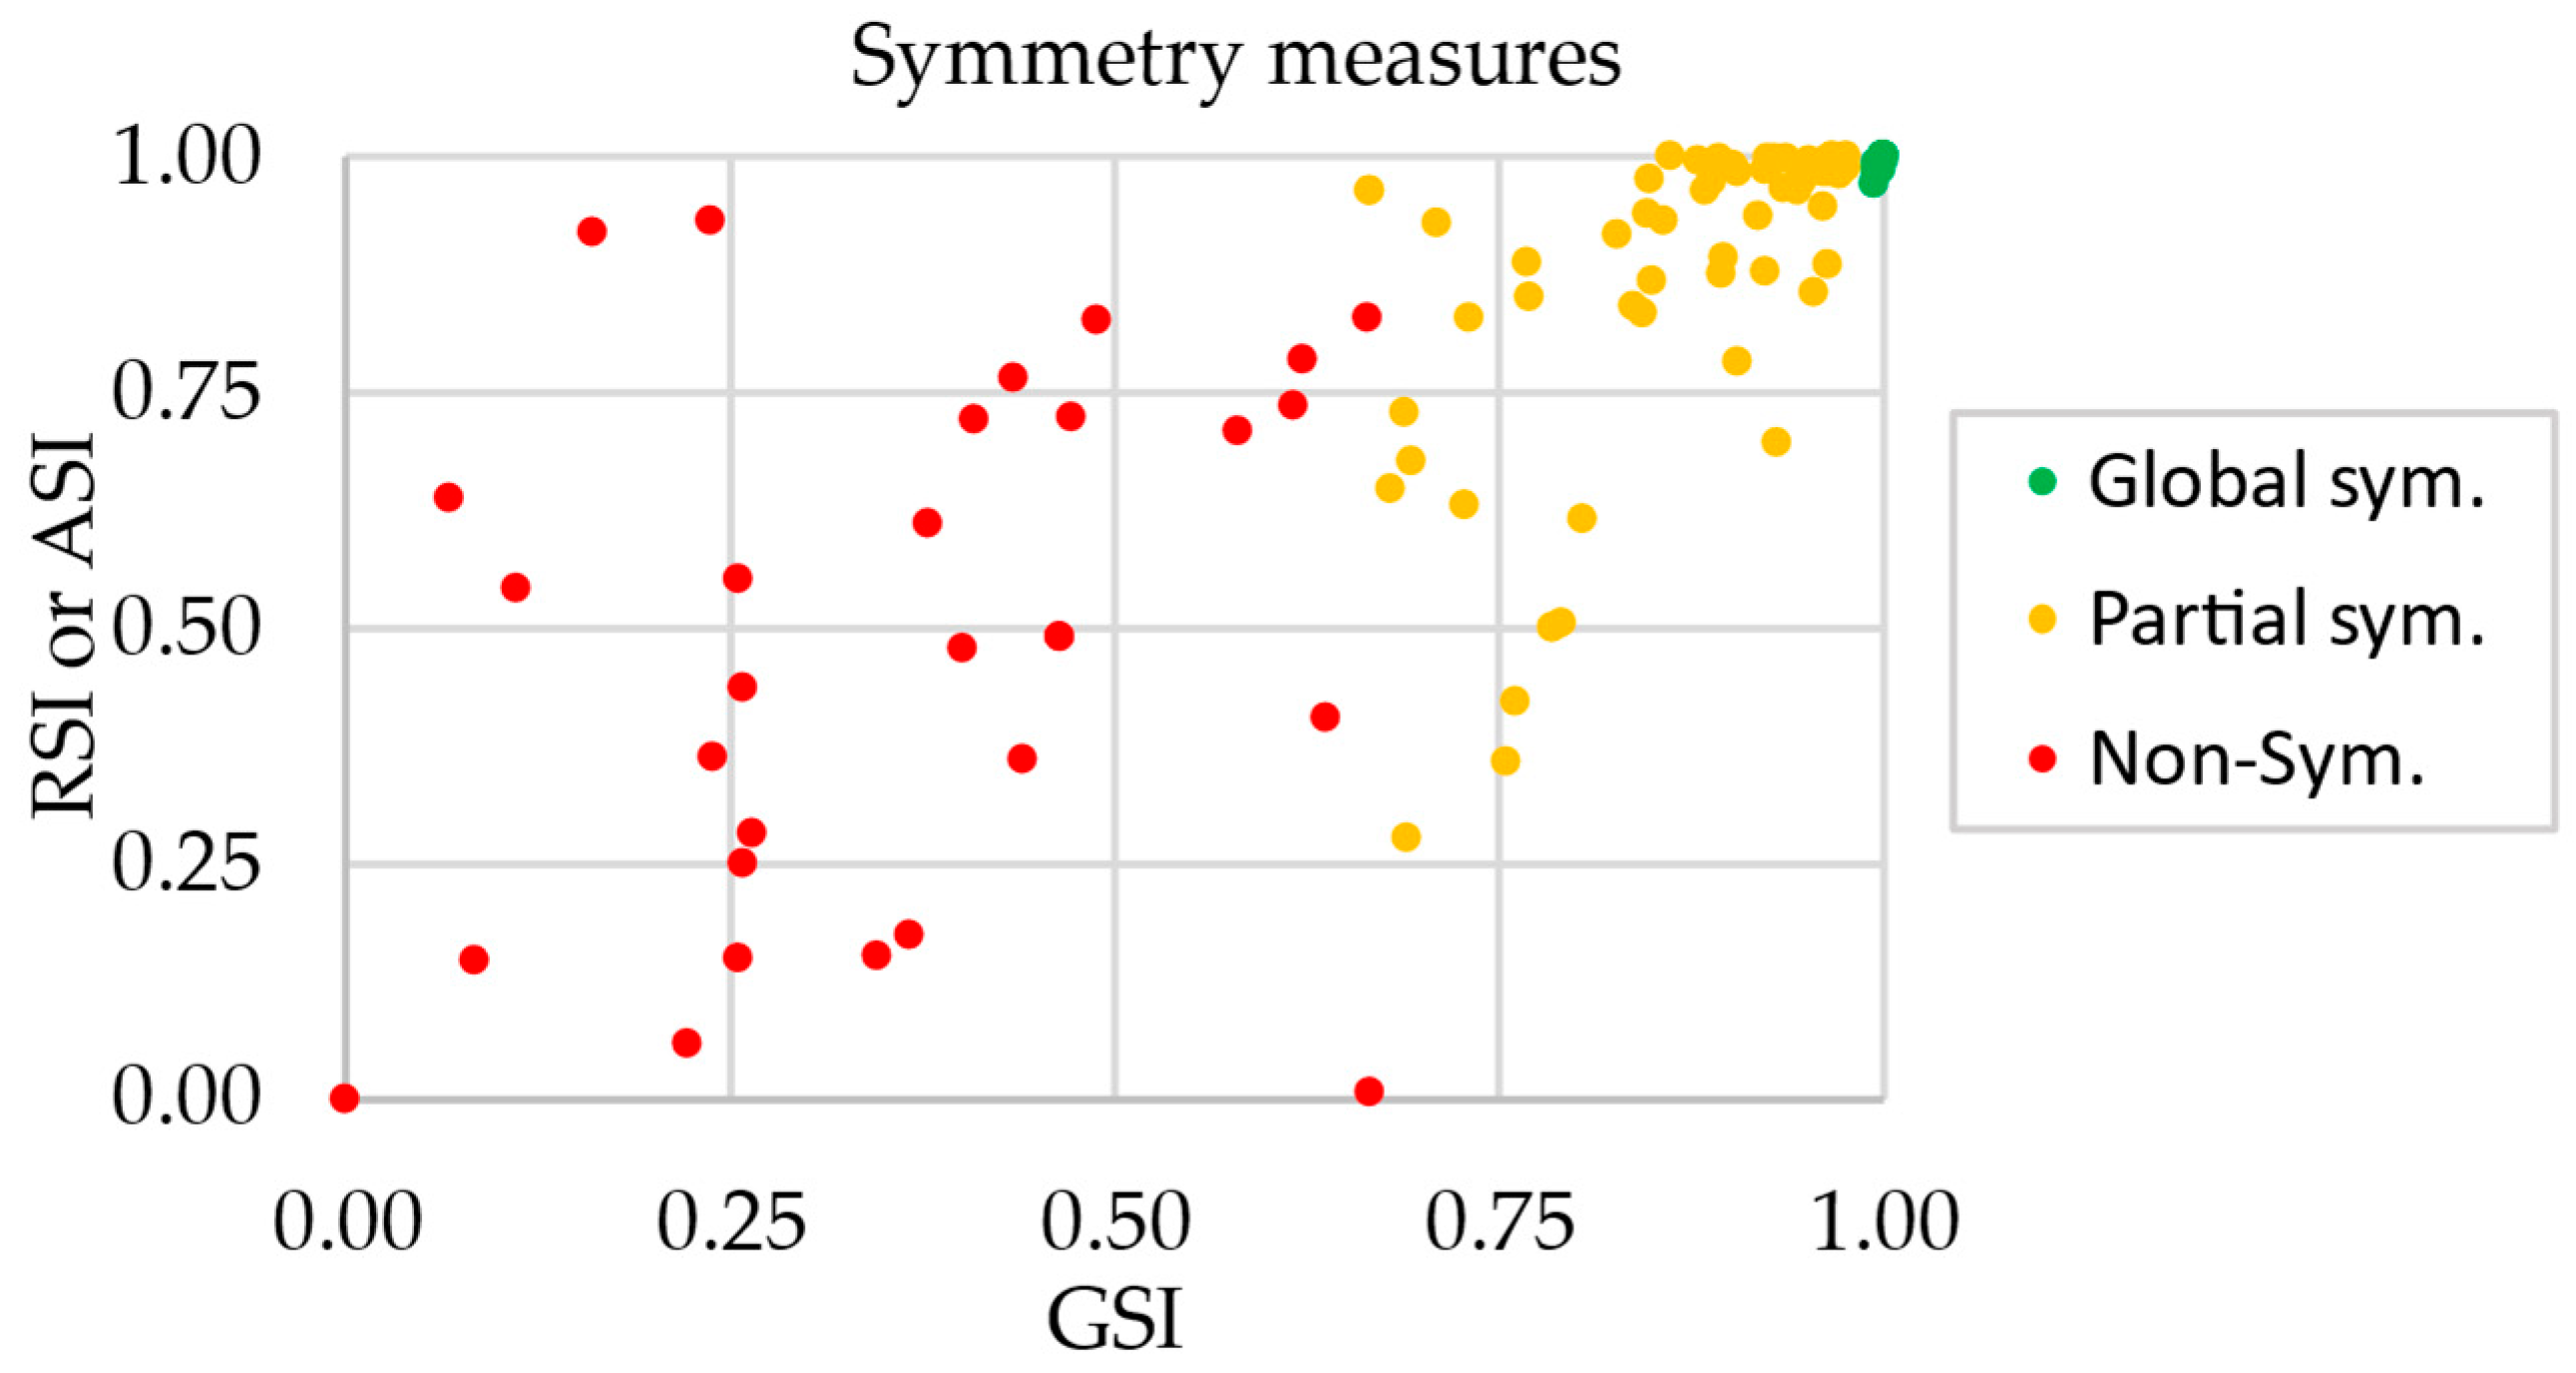
3.5. Global Symmetry Index Threshold
4. Discussion
5. Conclusions
Author Contributions
Funding
Data Availability Statement
Conflicts of Interest
Appendix A

References
- Simmons, C.H.; Phelps, N. Manual of Engineering Drawing Technical Product Specification and Documentation to British and International Standards, 4th ed.; Butterworth-Heinemann: Oxford, UK, 2012. [Google Scholar]
- Giesecke, F.E.; Lockhart, S.; Goodman, M.; Johnson, C. Technical Drawing with Engineering Graphics, 15th ed.; Pearson Education: Hoboken, NJ, USA, 2016. [Google Scholar]
- Li, K.; Foucault, G.; Leon, J.; Trlin, M. Fast global and partial reflective symmetry analyses using boundary surfaces of mechanical. Comput. Aided Des. 2014, 53, 70–89. [Google Scholar] [CrossRef]
- Tierney, C.; Boussuge, F.; Robinson, T.; Nolan, D.; Armstrong, C. Efficient symmetry-based decomposition for meshing quasi-axisymmetric assemblies. Comput. Aided Des. Appl. 2019, 16, 478–495. [Google Scholar] [CrossRef]
- Ma, Z.; Zhang, T.; Liu, F.; Yang, J. Knowledge discovery in design instances of mechanical structure symmetry. Adv. Mech. Eng. 2015, 7, 1–19. [Google Scholar] [CrossRef]
- Qiu, Q.; Chen, X.; Yang, C.; Feng, P. Classification and Effects of Symmetry of Mechanical Structure and Its Application in Design. Symmetry 2022, 13, 683. [Google Scholar] [CrossRef]
- Zingoni, A. Insights on the vibration characteristics of double-layer cable nets of D4h symmetry. Int. J. Solids Struct. 2018, 135, 261–273. [Google Scholar] [CrossRef]
- Tate, S.; Jared, G. Recognising symmetry in solid models. Comput. Aided Des. 2003, 35, 673–692. [Google Scholar] [CrossRef]
- Li, W.H.; Zang, A.M.; Kleeman, L. Bilateral Symmetry Detection for Real-time Robotics Applications. Int. J. Robot. Res. 2008, 27, 785–814. [Google Scholar] [CrossRef]
- Deng, X.; Wang, J. Research on the manufacturing of mechanical parts based on the theory of space symmetry group. Acad. J. Manuf. Eng. 2017, 15, 64–71. [Google Scholar]
- Li, C.; Li, M.; Gao, S. Multi-scale symmetry detection of CAD models. Comput. Aided Des. Appl. 2018, 16, 50–66. [Google Scholar] [CrossRef]
- Zingoni, A. Symmetry recognition in group-theoretic computational schemes for complex structural systems. Comput. Struct. 2012, 94, 34–44. [Google Scholar] [CrossRef]
- Mitra, N.; Pauly, M.; Wand, M.; Ceylan, D. Symmetry in 3D Geometry: Extraction and Applications. Comput. Graph. Forum. 2013, 32, 1–23. [Google Scholar] [CrossRef]
- Buric, M.; Brcic, M.; Bojcetic, N.; Skec, S. Computer-Aided Detection of Exact Reflection and Axisymmetry in B-rep CAD Models. In Proceedings of the CAD’22, Beijing, China, 11–13 July 2022. [Google Scholar] [CrossRef]
- Buric, M.; Brcic, M.; Bojcetic, N.; Skec, S. Computer-Aided Detection of Exact Reflection and Axisymmetry in B-rep CAD Models. Comput. Aided Des. Appl. 2023, 20, 884–897. [Google Scholar] [CrossRef]
- Jiang, J.; Chen, Z.; He, K. A feature-based method of rapidly detecting global exact symmetries in CAD models. Comput. Aided Des. 2013, 45, 1081–1094. [Google Scholar] [CrossRef]
- Alcázara, J.G.; Hermosoa, C.; Muntinghb, G. Symmetry Detection of Rational Space Curves from their Curvature and Torsion. Comput. Aided Geom. Des. 2015, 33, 51–65. [Google Scholar] [CrossRef]
- Nagar, R.; Raman, S. 3DSymm: Robust and Accurate 3D Reflection Symmetry Detection. Pattern Recognit. 2020, 107, 107483. [Google Scholar] [CrossRef]
- Xue, F.; Chen, K.; Lu, W. Architectural Symmetry Detection from 3D Urban Point Clouds: A Derivative-Free Optimization (DFO) Approach. In Advances in Informatics and Computing in Civil and Construction Engineering: Proceedings of the 35th CIB W78 2018 Conference: IT in Design, Construction, and Management; Springer: Berlin/Heidelberg, Germany, 2019; pp. 513–519. [Google Scholar] [CrossRef]
- Fotouhi, J.; Taylor, G.; Unberath, M.; Johnson, A.; Lee, S.C.; Osgood, G.; Navab, N. Exploring Partial Intrinsic and Extrinsic Symmetry in 3D Medical Imaging. Med. Image Anal. 2020, 72, 102127. [Google Scholar] [CrossRef]
- Dang, Q.; Morin, G.; Mouysset, S. Symmetry and Fourier Descriptor: A Hybrid Feature for NURBS based B-Rep Models Retrieval. In Proceedings of the Eurographics Workshop on 3D Object Retrieval, Strasbourg, France, 6 April 2014; pp. 45–52. [Google Scholar] [CrossRef]
- Tayangkanon, T.; Sompagdee, P.; Li, X. 3D Model Compression over ASCII Encoded Using Rotational and Reflective Symmetry. In Proceedings of the 10th International Conference on Knowledge and Smart Technology (KST 2018), Chiangmai, Thailand, 21 January–3 February 2018; pp. 53–58. [Google Scholar] [CrossRef]
- Tedjokusumo, J.; Leow, W.K. Normalization and Alignment of 3D Objects Based on Bilateral Symmetry Planes. In Advances in Multimedia Modeling; MMM 2007, Lecture Notes in Computer Science; Springer: Berlin/Heidelberg, Germany, 2006; Volume 4351, pp. 74–78. [Google Scholar] [CrossRef]
- Dang, Q.; Mouysset, S.; Morin, G. Symmetry-Based Alignment for 3D Model Retrieval. In Proceedings of the 12th International Workshop on Content-Based Multimedia Indexing (CBMI), Klagenfurt, Austria, 18–20 June 2014. [Google Scholar] [CrossRef]
- Li, M.; Langbein, F.; Martin, R. Detecting design intent in approximate CAD models using symmetry. Comput. Aided Des. 2010, 42, 183–201. [Google Scholar] [CrossRef]
- Gothandaraman, R.; Jha, R.; Muthuswamy, S. Reflectional and rotational symmetry detection of CAD models based on point cloud processing. In Proceedings of the IEEE 4th Conference on Information & Communication Technology (CICT), Chennai, India, 3–5 December 2020. [Google Scholar] [CrossRef]
- He, C.; Wang, L.; Zhang, Y.; Wang, C. Dominant Symmetry Plane Detection for Point-Based 3D Models. Adv. Multimed. 2020, 5, 8861367. [Google Scholar] [CrossRef]
- Gao, L.; Zhang, L.; Meng, H.; Ren, Y.H.; Lai, Y.K.; Kobbelt, L. PRS-Net: Planar Reflective Symmetry Detection Net for 3D. IEEE Trans. Vis. Comput. Graph. 2021, 27, 3007–3018. [Google Scholar] [CrossRef]
- Hruda, L.; Kolingerová, I.; Váša, L. Robust, fast and flexible symmetry plane detection based on differentiable symmetry measure. Vis. Comput. 2022, 38, 555–571. [Google Scholar] [CrossRef]
- Chen, Y.; Linzi, F.; Feng, J. Automatic and Exact Symmetry Recognition of Structures Exhibiting High-Order Symmetries. J. Comput. Civ. Eng. 2018, 32, 04018002. [Google Scholar] [CrossRef]
- Hruda, L. Symmetry Detection in Geometric Models. Master’s Thesis, University of West Bohemia, Plzen, Czech Republic, May 2018. [Google Scholar]
- Ji, P.; Liu, X. A fast and efficient 3D reflection symmetry detector based on neural networks. Multimed. Tools. Appl. 2019, 78, 35471–35492. [Google Scholar] [CrossRef]
- Hruda, L.; Dvorak, J. Estimating Approximate Plane of Symmetry of 3D Triangle Meshes. In Proceedings of the CESCG 2017: The 21st Central European Seminar on Computer Graphics, Wien, Austria, 12 April 2017. [Google Scholar]
- Li, B.; Johan, H.; Ye, Y.; Lu, Y. Efficient 3D reflection symmetry detection: A view-based approach. Graph. Models 2016, 83, 2–14. [Google Scholar] [CrossRef]
- Tate, S.J. Symmetry and Shape Analysis for Assembly-Oriented CAD. Ph.D. Thesis, Cranfield University, Bedford, UK, May 2000. [Google Scholar]
- Li, K. Shape Analysis of B-Rep CAD Models to Extract Partial and Global Symmetries. PhD Thesis, University Grenoble, Saint-Martin-d’Hères, France, November 2011. [Google Scholar]
- Davis, L.S. Understanding Shape: II. Symmetry. IEEE Trans. Syst. Man Cybern. 1977, 7, 204–212. [Google Scholar]
- Parui, S.K.; Dutta Majumder, D. Symmetry analysis by computer. Pattern Recognit. 1983, 16, 63–67. [Google Scholar] [CrossRef]
- Jiang, J.; Chen, Z.; He, K. A feature-based approach for detecting global symmetries in CAD models with free-form surfaces. In Proceedings of the 13th International Conference on Computer-Aided Design and Computer Graphics, Guangzhou, China, 16–18 November 2013; pp. 383–384. [Google Scholar] [CrossRef]
- Jiang, J.; Gong, Q.; Chen, Z.; He, K.; Ruang, R. A Feature-based Method of Rapidly Detecting Global Symmetries of Static Assembly CAD Models. Jisuanji Fuzhu Sheji Yu Tuxingxue Xuebao/J. Comput.-Aided Des. Comput. Graph. 2017, 29, 950–957. [Google Scholar]
- Marola, G. On the Detection of the Axes of Symmetry of Symmetric and Almost Symmetric Planar Images. IEEE Trans. Pattern Anal. Mach. Intell. 1989, 11, 104–108. [Google Scholar] [CrossRef]
- Zabrodsky, H.; Peleg, S.; Avnir, D. Symmetry as a continuous feature. IEEE Trans. Pattern Anal. Mach. Intell. 1995, 17, 1154–1166. [Google Scholar] [CrossRef]
- Kulkarni, P.; Dutta, D.; Saigal, R. An Investigation of Techniques for Asymmetry Rectification. J. Mech. Des. 1995, 117, 620–626. [Google Scholar] [CrossRef]
- Cardone, A.; Gupta, S.K.; Deshmukh, A.; Karnik, M. Machining feature-based similarity assessment algorithms for prismatic machined parts. Comput. Aided Des. 2006, 38, 954–972. [Google Scholar] [CrossRef]
- Seifoddini, H.; Djassemi, M. Merits of the production volume based similarity coefficient in machine cell formation. J. Manuf. Syst. 1995, 14, 35–44. [Google Scholar] [CrossRef]
- Zehtaban, L.; Elazhary, O.; Roller, R. A framework for similarity recognition of CAD models. J. Comput. Des. Eng. 2016, 3, 274–285. [Google Scholar] [CrossRef]
- Stroud, I.; Nagy, H. Solid Modelling and CAD Systems: How to Survive a CAD System; Springer: London, UK, 2011. [Google Scholar] [CrossRef]
- Piegl, L.; Tiller, W. The NURBS Book, 2nd ed.; Springer: New York, NY, USA, 1996. [Google Scholar]
- Parry-Barwick, S.; Bowyer, A. Symmetry analysis and geometric modelling. In Proceedings of the DCTA’93, Digital Image Computing-Techniques and Applications, Sydney, NSW, Australia, 8–10 December 1993. [Google Scholar]
- Sipser, M. Introduction to the Theory of Computation, 3rd ed.; Cengage Learning: Boston, MA, USA, 2021. [Google Scholar]
- Blessing, L.; Chakrabarti, A. DRM, a Design Research Methodology; Springer: London, UK, 2009. [Google Scholar] [CrossRef]
- GrabCAD. Available online: https://grabcad.com/dashboard (accessed on 10 October 2022).
- PARTcommunity. Available online: https://b2b.partcommunity.com/community/ (accessed on 10 October 2022).
- TraceParts. Available online: https://www.traceparts.com/en (accessed on 10 October 2022).
- Li, Y.; Wang, W.; Tu, C. Optimal Sampling of Parametric Surfaces. Comput. Aided Des. Appl. 2012, 9, 55–60. [Google Scholar] [CrossRef]


| Surface Type | Relevant Vector | Relevant Point | |
|---|---|---|---|
| Plane | Normal vector | Centroid | |
| Cylinder | Open | Normal vector | Center |
| Closed | Axis vector | Centroid | |
| Cone | Open | Normal vector | Center |
| Closed | Axis vector | Centroid | |
| Sphere | Normal vector | Center | |
| Torus | Open | Normal vector | Center |
| Closed | Axis vector | Centroid | |
| Revolved | Open | Normal vector | Center |
| Closed | Axis vector | Centroid | |
| B-spline | Normal vector | Center | |
| Face Pairs | Cosine Similarity |
|---|---|
 | 1 |
 | 0.93 |
 | 0.76 |
 | 0.67 |
 | 0.62 |
 | 0 |
| Type | No. of CAD Models |
|---|---|
| TP | 269 |
| FP | 0 |
| FN | 31 |
| F1-score | 0.94 |
| Step | Time Complexity |
|---|---|
| B-rep Analysis | O(n) |
| Candidate generation and trimming | O(n2) |
| Symmetry Detection | O(n2) |
| Visualization | O(n) |
| Symmetry Detection Framework | O(n2) |
Disclaimer/Publisher’s Note: The statements, opinions and data contained in all publications are solely those of the individual author(s) and contributor(s) and not of MDPI and/or the editor(s). MDPI and/or the editor(s) disclaim responsibility for any injury to people or property resulting from any ideas, methods, instructions or products referred to in the content. |
© 2023 by the authors. Licensee MDPI, Basel, Switzerland. This article is an open access article distributed under the terms and conditions of the Creative Commons Attribution (CC BY) license (https://creativecommons.org/licenses/by/4.0/).
Share and Cite
Buric, M.; Bosner, T.; Skec, S. A Framework for Detection of Exact Global and Partial Symmetry in 3D CAD Models. Symmetry 2023, 15, 1058. https://doi.org/10.3390/sym15051058
Buric M, Bosner T, Skec S. A Framework for Detection of Exact Global and Partial Symmetry in 3D CAD Models. Symmetry. 2023; 15(5):1058. https://doi.org/10.3390/sym15051058
Chicago/Turabian StyleBuric, Mladen, Tina Bosner, and Stanko Skec. 2023. "A Framework for Detection of Exact Global and Partial Symmetry in 3D CAD Models" Symmetry 15, no. 5: 1058. https://doi.org/10.3390/sym15051058
APA StyleBuric, M., Bosner, T., & Skec, S. (2023). A Framework for Detection of Exact Global and Partial Symmetry in 3D CAD Models. Symmetry, 15(5), 1058. https://doi.org/10.3390/sym15051058