Abstract
The novel red-emitting BaBi2−xEuxB4O10 (x = 0.05, 0.1, 0.2, 0.25, 0.3, 0.4, 0.5, 0.6) phosphors were obtained by a crystallization from a glass. Distribution of the Eu3+ ions over cation sites were refined for x = 0.1, 0.3 and 0.4 from single-crystal X-ray diffraction data. Emission and excitation spectra of the Eu3+-doped BaBi2B4O10 phosphors were investigated for the first time, where it was shown that characteristic lines are attributed to the intraconfigurational 4f-4f transitions. The optimal concentration for the BaBi2−xEuxB4O10 phosphors is x = 0.4, after which a luminescence intensity decreases. The CIE chromaticity coordinates for the BaBi2B4O10:Eu3+ (x = 0.4) phosphor (0.65, 0.35) are close to the NTSC standard values (0.67, 0.33) for commercial red phosphor. The obtained results show that the BaBi2B4O10:Eu3+ phosphors are promising candidates for solid state lighting application.
1. Introduction
Nowadays, white light-emitting diodes (wLED) are an important part of light source devices. The wLED-based devices have many advantages, such as high luminescence efficiency, environmental friendliness, long working lifetime, small size, light weight, durability, etc. [1,2,3] There are several ways to fabricate the wLED: (1) an exciting of single-phase yellow-emitting or mixed green- and red-emitting phosphors by a blue LED chip; (2) the exciting of red-, green- and blue-emitting phosphors by near ultraviolet LED chips; (3) a combination of red, green and blue separate monochromatic LED chips (RGB wLED) [4,5]. The fabrication of the latter ones is associated with many problems, such as high cost, complexity of fabricating, unstable aging of components, different thermal behavior, etc. [6] Generally, a commercial wLED is a combination of yellow-emitting phosphor Y3Al5O12:Ce3+ (YAG: Ce3+) with high photoluminescence quantum yield and good thermal stability with a blue diode chip. However, due to the absence of a red-light component in the emission of YAG: Ce3+, this phosphor cannot be used as a source of warm white light with a high-color-rendering index and low correlated color temperature [7]. Thus, it is an actual scientific task to find novel red phosphors to solve the current problems.
Hence, borates activated with rare earth elements are of a great interest, and these are promising materials for the fabrication of various types of the wLED due to wide transparency in the ultraviolet range, relatively easy synthesis, high optical damage threshold and thermal stability, and environmental friendliness in comparison to commercial red-emitting phosphors such as (Sr, Ca)S:Eu2+, Y2O2S:Eu3+ and other.
Complex compounds in the MO–Bi2O3–B2O3 (M = Ca, Sr, Ba) borate systems are actively studied in order to obtain promising optical matrices and materials. For example, structurally similar MBi2B2O7 (M = Ca, Sr, Ba) [8,9,10,11] borates form a family of prospective red-emitting phosphors. The photoluminescence properties of the M3Bi2(BO3)4:Eu3+ (M = Sr, Ba) compounds were investigated in [12,13], and the crystal structure and photoluminescence of CaBi2B4O10:Eu3+ phosphors were studied in [14]. Optical, structural, dielectric and photoluminescence properties of MO–Bi2O3–B2O3 (M = Ca, Sr, Ba) glasses were studied in [15,16,17,18,19,20,21,22,23].
The crystal structure of BaBi2B2O7 contains three crystallographically independent sites for the Ba and Bi atoms. These sites split on the Bi and Ba subpositions. The average distance between centers of photoluminescence in the BaBi1.60Eu0.40B2O7 sample with optimal concentration is 21.7 Å [11]. The crystal structure of Ba3Bi2(BO3)4 also contains three disordered independent sites for the Ba and Bi atoms. Initially, the Eu3+ ions occupy the M2 site only. The concentration quenching occurs when the Eu3+ ions start to distribute over all three cation sites in the Ba3Bi2(BO3)4:Eu3+ phosphor. The critical distance in the Ba3BiEu(BO3)4 sample with optimal concentration is 9.5 Å. In the Ba3Bi(B3O6)3-Ba3Eu(B3O6)3 series of phosphors, the concentration quenching does not occur due to the large distance between the Bi(Eu) sites of about 7.2 Å [24].
This paper reports on the synthesis of the novel red-emitting BaBi2B4O10:Eu3+ phosphors and glasses, its crystal structure refinement from single-crystal X-ray diffraction data, and investigation of its luminescent properties.
2. Materials and Methods
The BaBi2−xEuxB4O10 phosphors (x = 0, 0.05, 0.1, 0.2, 0.25, 0.3, 0.4, 0.5, 0.6) were obtained by high-temperature solid phase synthesis. Barium carbonate BaCO3 (Neva Reaktiv, 99.90% purity), boric acid H3BO3 (Neva Reaktiv, 99.90% purity), bismuth oxide Bi2O3 (Neva Reaktiv, 99.90% purity) and europium oxide Eu2O3 (Kyrgyz CMC, 99.93% purity) were mixed in stoichiometric proportions. Initially, Eu2O3 was heated at 900 °C for 3 h, BaCO3 and Bi2O3—at 600 °C for 10 h. The powders were ground in an agate mortar for 1 h. Then the powders were pressed into pellets using a LabTools hydraulic press at a pressure of 80 kg/cm2. The pellets were placed on platinum crucibles and melted in the Nabertherm HTC furnace at 900 °C for 1 h. The melts were poured out onto a cold steel plate. As a result, the BaBi2−xEuxB4O10 glasses were obtained (Figure 1). The polycrystalline samples were obtained by a crystallization of the glasses at 600 °C for 15 h.
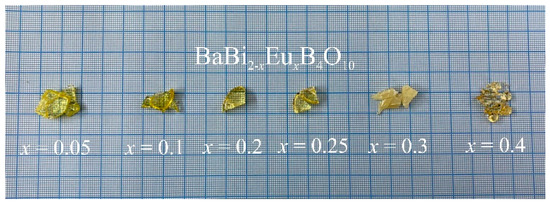
Figure 1.
The BaBi2−xEuxB4O10 glasses (x = 0.05–0.4).
Powder diffraction data of the BaBi2−xEuxB4O10 (x = 0–0.6) were collected using a Rigaku MiniFlex II diffractometer (CuKα, 2θ = 10–70°, step 0.02°). The phase composition was determined using PDXL integrated X-ray powder diffraction software and PDF-2 2016 (ICDD) database.
The distribution of the Eu3+ ions through the crystallographic sites was studied by means of Rigaku XtaLab Synergy-S diffractometer equipped with high-speed direct-action detector HyPix-6000HE (microfocus monochromatic MoKα radiation (λ = 0.71073 Å), frame widths 1.0° in ω). The optical microscope was used for single crystal selection of the BaBi2−xEuxB4O10 (x = 0.1, 0.3, 0.4) phosphors. Then the crystals were fixed on cryoloops with a Paratone-N oil. The obtained data was analyzed using the CrysAlisPro software (2015).
An absorption correction was introduced using the SCALE3 ABSPACK algorithm. The crystal structures of the BaBi2−xEuxB4O10 (x = 0.1, 0.3, 0.4) phosphors were refined in the P21/c space group using JANA2006 program [25]. Crystallographic data and refined parameters are given in Table 1, atomic coordinates, equivalent displacement parameters, atomic anisotropic displacement parameters and selected bond lengths are given in Tables S1–S3. Further details of the crystal structure investigations can be obtained from the Cambridge Structural Database on quoting the depository numbers CSD 2222018, 2222019 and 2222020.

Table 1.
Crystal data, data collection and details of refinement of the BaBi2−xEuxB4O10 (x = 0.1, 0.3, 0.4) phosphors.
The chemical composition (5) was studied using a QUANTA 200 3D electron microprobe equipped with an energy-dispersive spectroscopy system, operated at 16 kV and 780 pA, with a beam size of 1 μ. Analytical results are given in Table S4. The empirical formulae calculated on the basis of 10 O atoms per formula unit are Ba1.01Bi1.58Eu0.40B4.02O10 (x = 0.4) and Ba0.98Bi1.90Eu0.10B4.01O10 (x = 0.1).
Raman spectra were measured using Horiba LabRam HR800 spectrometer with a spectral resolution 3 cm−1 at 488 nm excitation. The laser beam was focused on the sample surface with 50× objective; the scattered light was collected four times for 1 min for each spectrum.
Absorption spectra were measured using a PerkinElmer Lambda 1050 spectrophotometer in a 150 mm integrating sphere with spectral resolution of 1 nm. Polycrystalline BaSO4 powder was used as a reference sample.
The luminescence excitation and emission spectra as well as kinetic curves luminescence quantum yields were measured on a Horiba Fluorolog-3 spectrometer. A Horiba LabRam HR800 spectrometer equipped with confocal microscope was used to correctly compare the efficiency of photoluminescence in glasses and crystalline samples. The emission spectra were obtained using a 50× objective, which allows the excitation light to be focused into a focal region with a diameter of 2 μm. Thus, the emission spectra were measured from the same volume of glass or crystalline samples under other equal experimental conditions.
3. Results and Discussion
3.1. Powder X-ray Diffraction of the BaBi2−xEuxB4O10 (x = 0–0.6)
X-ray phase analysis revealed that the polycrystalline samples of BaBi2−xEuxB4O10 (x = 0–0.3) were homogenous. The sample with x = 0.4 contained in its phase composition BaBi2B2O7 and/or BaBi2-xEuxB2O7 as an impurity in a quantity of about 30 wt.% (see Figure 2), which is due to a limitation of the Eu3+ → Bi3+ isomorphic substitution for these solid solutions. This leads to the area of immiscibility for the 0.3 ≤ x ≤ 0.4 samples. The sample with x = 0.5 contains of about 18 wt.% of Ba(Bi,Eu)2B4O10, 36 wt.% of Ba3(Bi,Eu)B9O18, 24 wt.% of (Bi,Eu)4B2O9 and 22 wt.% of EuBO3 (P63/mmc), and the sample with x = 0.6 contains 11 wt.% of Ba(Bi,Eu)2B4O10, 36 wt.% of Ba3(Bi,Eu)B9O18, 31 wt.% (Bi,Eu)4B2O9 and 22 wt.% of EuBO3 (P63/mmc).
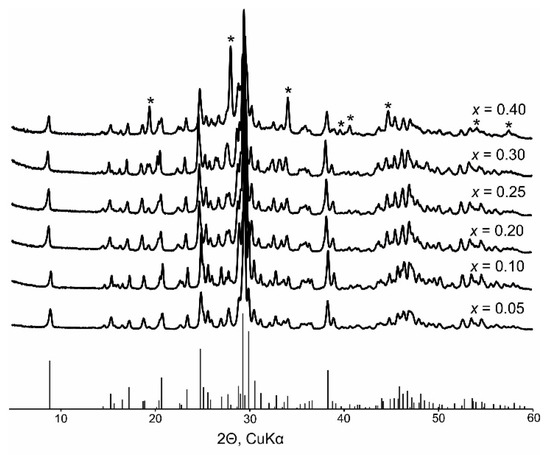
Figure 2.
Powder X-ray diffraction patterns of the BaBi2−xEuxB4O10 (x = 0.05–0.4) phosphors. Asterisks (*) mark the BaBi2B2O7 impurity in the x = 0.4 sample.
Figure 3 shows the unit cell parameters and volume vs. the Eu3+ concentration. This dependence can be approximated by a linear function, but a slight bend can be noticed. Perhaps this is due to the fact that, with an increase in the europium content, the Eu3+ ions can replace Bi3+ in nonequivalent crystallographic sites. It can be also assumed that as the amount of the europium increases, the Eu3+ ions can replace the Bi3+ ones in different crystallographic sites.
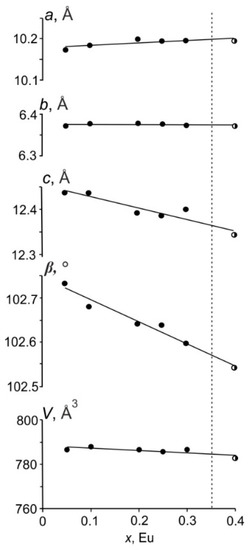
Figure 3.
Dependence of unit cell parameters and volume vs. europium x(Eu3+) concentration in the BaBi2−xEuxB4O10 (x = 0.05–0.4) phosphors. Black-white circles indicate the two-phase sample (x = 0.4).
3.2. Crystal Structure of the BaBi2−xEuxB4O10 (x = 0.1, 0.3, 0.4) Phosphors
The BaBi2B4O10:Eu3+ phosphors crystallize in the BaBi2B4O10 structure type, monoclinic system, space group P21/c, Z = 4 (Figure 4a) [26]. Refined formulae of the BaBi1.94Eu0.06B4O10, BaBi1.67Eu0.33B4O10 and BaBi1.57Eu0.43B4O10 crystal structures are close to the BaBi1.90Eu0.10B4O10, BaBi1.70Eu0.30B4O10 and BaBi1.60Eu0.40B4O10 (5, 15, 20 at % Eu) stoichiometric mixtures. There are one Ba, two Bi, four B and ten O sites in asymmetric unit (Tables S1 and S2). The B(1), B(3) and B(4) atoms are surrounded by four oxygen atoms to form tetrahedra with bond lengths that vary in the range 1.44–1.51, 1.46–1.59, 1.44–1.51 Å (for x = 0.1), 1.44–1.51, 1.45–1.56, 1.45–1.51 Å (x = 0.3) and 1.44–1.50, 1.44–1.62, 1.44–1.50 Å (x = 0.4) (Table S3). The B(2) atom is triangularly coordinated by oxygen atoms and the B–O bonds are in the range 1.36–1.41 Å (for x = 0.1), 1.35–1.40 Å (x = 0.3) and 1.34–1.40 Å (x = 0.4). cm−1.
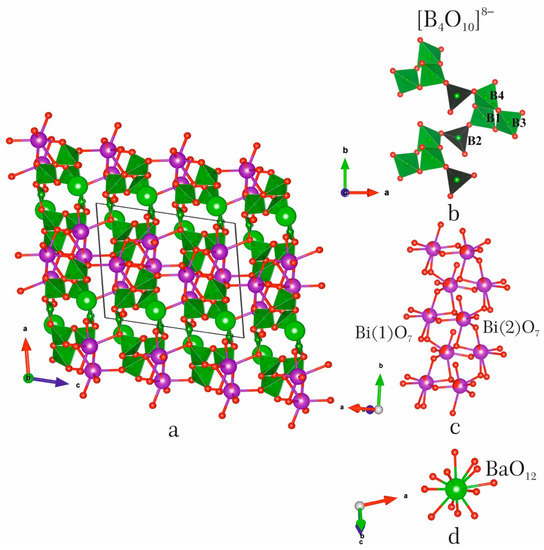
Figure 4.
Structural fragments and crystal structure of BaBi1.90Eu0.10B4O10 (a): (b)—[B4O10] chain, (c)—[Bi2O7] chain, (d)—BaO12.
According to [26], corner-sharing borate polyhedra form the [B4O10]8− chain consisting of triborate group and single BO3 triangle. The triborate group is formed by three independent tetrahedra B(1)O4, B(3)O4 and B(4)O4. This group can be written as <3□> in accordance with notation of Burns et al. [27]. The full notation of the [B4O10]8− borate polyanion is 4B:∆3□:<3□>∆ (Figure 4b). Such a borate polyanion is unique because it was found only in the BaBi2B4O10 structure type.
The Bi(1) and Bi(2) atoms form four short Bi–O bonds in the range 2.14–2.41 Å, and three and two relatively long bonds (2.56–2.87 and 2.59–2.89 Å, respectively). It results in the formation of the BiO7 and BiO6 polyhedra with [4+3] and [4+2] coordinations of Bi. Such a coordination of the Bi atoms is asymmetric due to the presence of the 6s2 stereoactive lone electron pair. The Bi(1)O7 and Bi(2)O6 polyhedra share edges to form the [Bi2O10] dimers. These dimers are linked through the O(5) atoms to form [Bi2O7] chains along the [010] direction [26] (Figure 4c). The Bi–O chains share edges (O3), forming [Bi2O5] bismuthate layers in bc plane. The Ba(1) site has an eightfold coordination (Figure 4d) with the Ba–O bond lengths vary in the range 2.75–2.90 Å (x = 0.1), 2.75–2.91 Å (x = 0.3) and 2.74–2.89 Å (x = 0.4). The next four bonds are in the range 3.10–3.20 Å.
Generally, the lone electron pair of the Bi3+ ion is stereoactive if the Lewis basicity strength presents in a crystal structure. In the BaBi2B4O10 crystal structure, the unique borate anion [B4O10]8− is a structural unit. A knowledge of coordination numbers of cations and anions in a structural unit lets us calculate the Lewis basicity of the unit [27,28,29,30,31]. In the [B4O10]8− structural unit, the average coordination number of the O atoms is 3.9. There are 39 bonds in the crystal structure that involve the O atoms of the structural unit. Within the structural unit, there are 15 bonds in the BO4 tetrahedra and BO3 triangle. Therefore, the Lewis basicity of the structural unit is 8/24 = 0.30 vu. The presence of such a strong Lewis base is the determining factor for the stereoactivity of the Bi3+ lone electron pair. The bond-valence calculations were performed using empirical parameters taken from Brown and Altermatt (1985) [32] (Table S2).
3.3. A Distribution of the Eu3+ Ions over the Crystallographic Sites
The Ba and Bi cations are fully ordered in the BaBi2B4O10 crystal structure [26]. In the BaBi1.90Eu0.10B4O10 crystal structure, the Eu3+ atoms occupy only the Bi(1) site. Then, the Eu3+ atoms occupy 22% of the Bi(1) site and 11% of the Bi(2) site in the BaBi1.70Eu0.30B4O10 crystal structure, and 31% of the Bi(1) site and 11% of the Bi(2) site in the BaBi1.60Eu0.40B4O10 crystal structure, respectively (Figure 5).
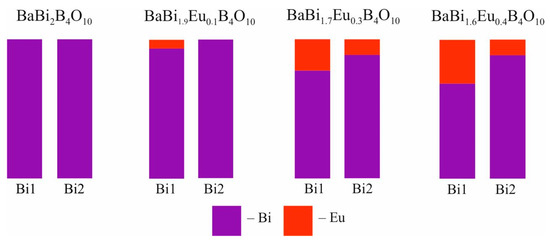
Figure 5.
Occupation (%) of the crystallographic sites in the BaBi2−xEuxB4O10 (x = 0, 0.1, 0.3, 0.4) crystal structures. Data for BaBi2B4O10 are given in [26].
The immiscibility of the BaBi2−xEuxB4O10 solid solutions may be caused by structural distortions. Presumably, a main reason for structural distortions is a five-fold coordination of the O(2) atom by the B(1), B(3), Bi(1), Bi(2) and Ba(1) ones. The B(1)–O(2) and B(3)–O(2) bond lengths are 1.49 and 1.56 Å in BaBi2B4O10, and 1.50 and 1.62 Å in BaBi1.60Eu0.40B4O10. Usually, the B–O bond lengths in the BO4 tetrahedron vary in the range 1.462–1.512 Å [33]. Perhaps, the longest B–O bond (1.69 Å) was found in the crystal structure of high boracite [34], where the one O site is surrounded by four B ones. The Bi(1)–O(2) and Bi(2)–O(2) bond lengths are 2.73 and 2.59 Å in BaBi2B4O10. The Eu atoms substitute the Bi ones in the Bi(1) and Bi(2) sites. The ionic radius of the Eu3+ ion (1.15 Å) is smaller than the Bi3+ one (1.24 Å) for the coordination number equals 7 [35]. Therefore, in the BaBi1.60Eu0.40B4O10 crystal structure, the Bi(1)–O(2) and Bi(2)–O(2) bond lengths are shorter (2.66 and 2.60 Å). The Ba(1)–O(2) bond practically does not change (see Table S2). Apparently, these structural distortions are caused by the Eu3+ → Bi3+ substitution. The bond valence of the B(1)–O(2) bond decreases from 0.60 vu in in BaBi2B4O10 to 0.50 vu in BaBi1.60Eu0.40B4O10. Such a decrease is partially compensated by an increase in the valence of the Bi(1)–O(2) bond from 0.18 to 0.21 vu. The bond valence sum for the O(2) site decreases from 1.97 to 1.87 vu. Presumably, this is one of the reasons leading to the immiscibility of the BaBi2−xEuxB4O10 solid solutions.
3.4. Raman Spectroscopy
The Raman spectra of the samples are shown in Figure 6. According to the spectra, the structure of the samples does not change up to when the Eu3+ concentration equals 0.30. A further increase in the concentration of the activator ion leads to the area of immiscibility of the BaBi2−xEuxB4O10 solid solutions. The sample with x = 0.4 contained about 70 wt.%, BaBi2−xEuxB4O10 and 30 wt.% BaBi2B2O7 and/or BaBi2−xEuxB2O7 in its phase composition. The samples with x = 0.5 and 0.6 have difficult phase compositions (see Section 3.1). With an increase in the Eu content, the concentration of phases (Ba3(Bi,Eu)B9O18 and (Bi,Eu)4B2O9) containing only the BO3 triangular radicals also increases. Broad Raman bands confirm a disordered model of the crystal structure. The main structural units are the BO4 tetrahedra and the BO3 triangles.
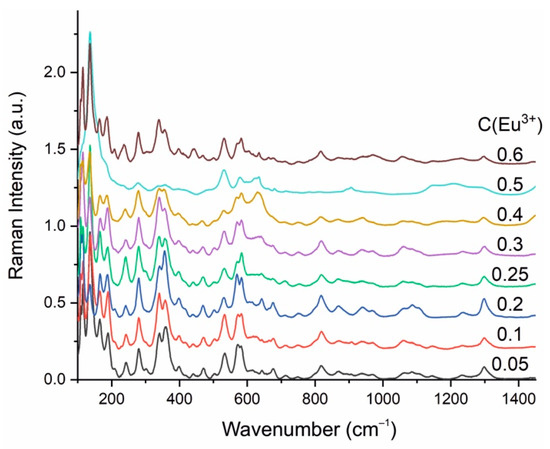
Figure 6.
Raman spectra of the BaBi2−xEuxB4O10 (x = 0.05–0.6) samples (the x = 0.05–0.6 concentrations are shown by different color).
Assignment of the Raman bands is presented in Table 2. Due to the combination of one BO3 and three crystallographic independent BO4 units consisting the [B4O10]8− chain, the more detailed assignment of the vibrations is difficult. The positions of the Raman bands are assigned in accordance with [36,37].

Table 2.
Raman bands assignment for the BaBi2−xEuxB4O10 (x = 0–0.6) samples.
3.5. Absorption Spectroscopy
The absorption spectra of the BaBi2−xEuxB4O10 (x = 0–0.6) samples (Figure 7a) demonstrate that the blue edge of the optical transparency window is below 400 nm. Narrow peaks correspond to the transitions between electronic states of Eu3+ ions. The position of the fundamental absorption edge plotted in Tauc coordinates was used to determine the optical band gap. The obtained values of the optical band gap depending on the concentration of active ions are shown in Figure 7b. The decrease in the band gap may be due to the occurrence of the immiscibility area between the 0.3 ≤ x ≤ 0.4 samples and the formation of defective localized states in the band gap at high concentrations of europium ions.
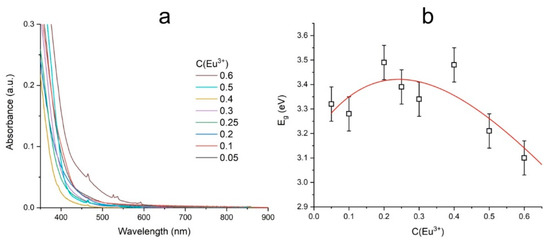
Figure 7.
UV-Vis absorption spectra (a) and dependence of bandgap energy on Eu3+ concentration (b) in the BaBi2−xEuxB4O10 (x = 0–0.6) crystalline samples.
3.6. Photoluminescence Properties
All narrow bands in the luminescence excitation spectra correspond to the f-f transitions of the Eu3+ ions (Figure 8a). The broad band to the left of 350 nm is a charge transfer band which corresponds to the electronic transitions from 2p orbitals of O2− to 4f orbitals of the Eu3+ ions [10.1016/j.jlumin.2013.10.002]. It can be seen that the optimal pump wavelength for the BaBi2−xEuxB4O10 (x = 0–0.6) samples is 392 nm, which corresponds to the 7F0-5L6 transition of the Eu3+ ions. Therefore, all experiments of the studied samples’ luminescent properties were carried out at 392 nm excitation. Figure 8b shows the luminescence spectra of the BaBi2−xEuxB4O10 (x = 0–0.6) samples depending on the europium ions concentration.
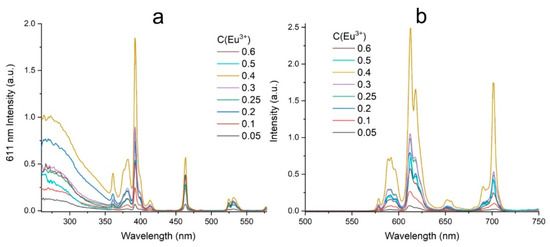
Figure 8.
Excitation spectra of 611 nm luminescence band (a); photoluminescence spectra at 392 nm excitation (b).
To determine the optimal concentration of active ions, the integrated intensity of the luminescence spectra was compared. The obtained concentration dependence of the integral intensity of Eu3+ ions is shown in Figure 9a. Obviously, the optimal concentration of the europium ions in the samples under study is x = 0.4. With a further increase in the concentration, the luminescence intensity decreases due to the concentration quenching and area of the immiscibility of the solid solution. The quantum yield measured for the x = 0.4 sample is 10% (Figure 9b).
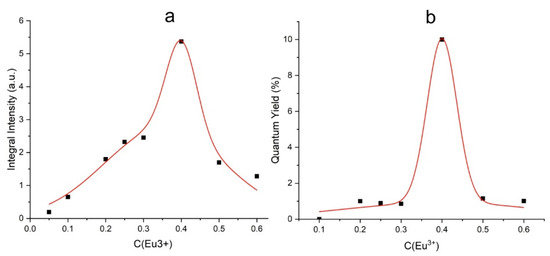
Figure 9.
Dependence of the photoluminescence integral intensity on Eu3+ concentration (a); quantum yield of the BaBi2−xEuxB4O10 (x = 0–0.6) samples (b).
All luminescence kinetic curves fit well with a single-exponential function (Figure 10a). One of the parameters sensitive to the environment of the active ions is the lifetime of excited states. The figure shows the dependence of the lifetime of the 5D0 level on the concentration of the Eu3+ ions (Figure 10b).
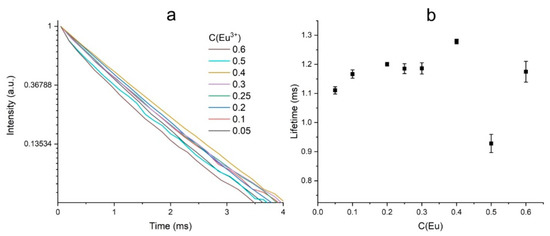
Figure 10.
Photoluminescence kinetic curves in the region of the 611 nm band upon excitation at 392 nm (a); dependence of Eu3+ 5D0 level lifetime on Eu3+ concentration (b).
The photoluminescence properties of glass and polycrystalline samples were compared using a Horiba LabRam HR800 spectrometer. The comparison was carried out according to the luminescence band in the region of 700 nm. It can be seen that the band is wider in the amorphous sample than in the crystalline one (Figure 11a). To compare the luminescent properties, the integral intensities were measured. The integrated intensity of amorphous samples is higher than crystalline ones with the corresponding concentration of active ions in the entire concentration range (Figure 11b).
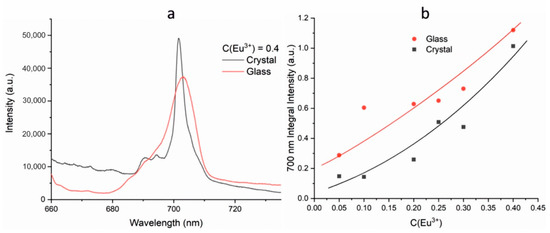
Figure 11.
Luminescence spectra of glass and polycrystalline BaBi2−xEuxB4O10 (x = 0–0.4) samples upon 632.8 nm excitation (a); integral intensity of luminescence for glass and polycrystalline BaBi2−xEuxB4O10 (x = 0–0.4) samples (b).
The CIE chromaticity coordinates are given in Table 3 and presented in Figure 12. The CIE chromaticity coordinates for the BaBi1.60Eu0.40B4O10 phosphor at room temperature were (0.65, 0.35). This is close to the NTSC standard values (0.67, 0.33) for commercial red phosphor.

Table 3.
CIE (CIE 1931) chromaticity coordinates of BaBi2−xEuxB4O10 (x = 0.05–0.6) samples.
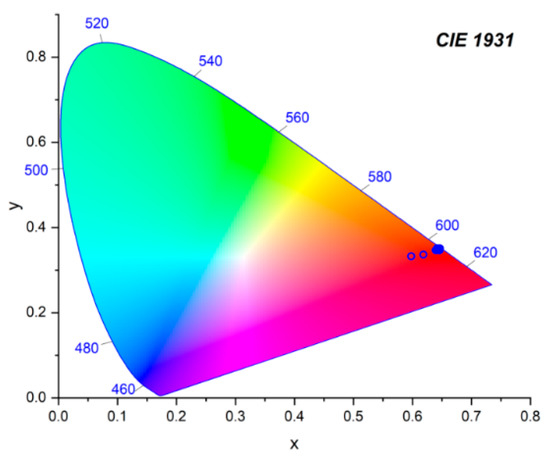
Figure 12.
CIE chromaticity coordinates of the BaBi2−xEuxB4O10 (x = 0–0.6) concentration series.
3.7. Energy Migration
The energy transfer between luminescence centers is determined mainly by the distance between the sites occupied by the activator ions in the crystal structure. According to the Dexter’s theory [38], a critical distance of 5 Å or less is necessary for achievement of the exchange interaction. Usually, the emission intensity decreases at high doping concentration and that can be explained as a result of the dipole-dipole interaction between the Eu3+ ions, the probability of which increases with decreasing distance between active ions. The distance between the Bi atoms in the chain is approximately 3.6 Å, and between the Bi sites from different [Bi2O7] chains within the layer is approximately 3.7 Å (Figure 13). The distance between the Bi sites which belong to different layers is already much greater than ~6.0 Å, which means that in this borate, with a high degree of probability, two-dimensional energy transfer between luminescence centers occurs. According to [39,40], this leads to an increase in the value of concentration quenching relative to the three-dimensional energy transfer between luminescence centers, and a decrease relative to the one-dimensional one.
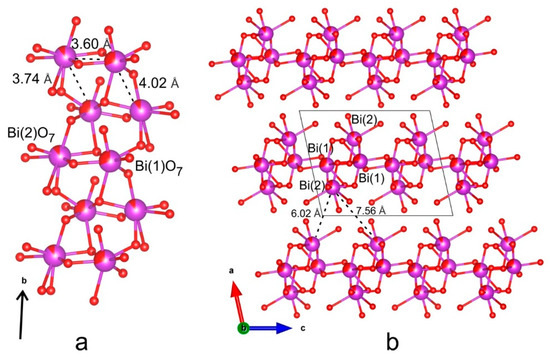
Figure 13.
Bi–O chain (a) and Bi–O layers (b) in the BaBi1.60Eu0.40B4O10 crystal structure.
The emission intensity of these borates can be explained in terms of the area of miscibility of the BaBi2−xEuxB4O10 solid solutions (x = 0–0.35) because the sample with x = 0.4 contains two phases (BaBi2−xEuxB4O10 and BaBi2B2O7 or BaBi2−xEuxB2O7). Although, the optimal concentration for the BaBi2−xEuxB4O10 phosphors is x = 0.4 because this sample has the highest quantum yield. Although the critical energy transfer distance Rc between the europium ions was not achieved, it seems interesting to compare the energy transfer distance for optimal concentrations. The critical energy transfer distance can be calculated using an equation proposed by [41]:
where xc is the critical doping content, N—the number of cation sites in the unit cell that can be occupied by activator ions and V—the volume of unit cell. Using these parameters, Rc was found to be 26.3 Å.
4. Conclusions
The novel red-emitting BaBi2−xEuxB4O10 (x = 0.05, 0.1, 0.2, 0.25, 0.3, 0.4, 0.5, 0.6) phosphors were obtained by a crystallization from the glass. Crystal structures of the novel BaBi2−xEuxB4O10 (x = 0.1, 0.3, 0.4) phosphors were refined. Single-crystal X-ray diffraction showed that the Eu3+ → Bi3+ isomorphic substitution does not change the monoclinic system of the solid solutions. It is shown that the Eu3+ atoms first occupy the Bi(1) and then start to substitute the Bi(2) sites. This leads to the existence of the area of immiscibility for the 0.3 ≤ x ≤ 0.4 samples. An analysis of the distances between the luminescence centers shows that two-dimensional (2D) energy transfer can occur in these phosphors. The highest emission intensity with a quantum yield of 10% was demonstrated by BaBi1.60Eu0.40B4O10. In terms of the highest quantum yield, the optimal concentration for the BaBi2−xEuxB4O10 phosphors is found to be x = 0.4. The CIE chromaticity coordinates for the BaBi2B4O10:Eu3+ (x = 0.4) phosphor were determined to be (0.65, 0.35) which are close to those for the NTSC standard (0.67, 0.33) for commercial red phosphor.
Supplementary Materials
The following supporting information can be downloaded at: https://www.mdpi.com/article/10.3390/sym15040918/s1, Table S1: Atomic coordinates, structural occupancy factors, and equivalent isotropic and anisotropic displacement parameters (Å2) for BaBi1.90Eu0.10B4O10, BaBi1.70Eu0.30B4O10 and BaBi1.60Eu0.40B4O10; Table S2: Selected interatomic distances and bond valence values for BaBi1.90Eu0.10B4O10, BaBi1.70Eu0.30B4O10 and BaBi1.60Eu0.40B4O10; Table S3: Atomic anisotropic displacement parameters for BaBi1.90Eu0.10B4O10, BaBi1.70Eu0.30B4O10 and BaBi1.60Eu0.40B4O10; Table S4: Chemical composition of BaBi1.90Eu0.10B4O10 and BaBi1.60Eu0.40B4O10 (wt.%).
Author Contributions
Writing—original draft, A.P.S., Y.P.B., A.V.P. and A.A.Y.; Writing—review & editing, A.P.S., Y.P.B., S.K.F. and R.S.B.; Investigation, A.P.S., M.S.A., A.V.P., A.A.Y. and S.Y.J.; Project administration, A.P.S., Y.P.B. and R.S.B.; Data curation, A.P.S., R.S.B. and S.K.F.; Visualization, A.P.S. and A.A.Y.; Supervision, A.P.S. All authors have read and agreed to the published version of the manuscript.
Funding
This work was supported by the Ministry of Science and Higher Education of the Russian Federation within the scientific tasks of the Institute of Silicate chemistry (Russian Academy of Sciences) [project number 0081-2022-0002] (synthesis), and the Russian Science Foundation [grant number 22-13-00317] (data evaluation and generalization, XRD and photoluminescence experiments, investigation of glasses, Raman and Absorption spectroscopy).
Data Availability Statement
CCDC 2222018, 2222019 and 2222020 contain the crystallographic data for this paper. These data can be obtained free of charge via https://www.ccdc.cam.ac.uk/Community/Depositastructure/CSDCommunications/ (accessed on 25 November 2022).
Acknowledgments
The X-ray diffraction experiments were performed at The Centre for X-ray Diffraction Studies (Saint Petersburg State University). The Raman spectra and luminescence were collected at Center for Optical and Laser Materials Research, Research Park of Saint-Petersburg State University.
Conflicts of Interest
The authors declare no conflict of interest.
References
- Mondal, K.; Singh, D.K.; Manam, J. Spectroscopic behavior, thermal stability and temperature sensitivity of Ca2SiO4: Eu3+ red emitting phosphor for solid state lighting application. J. Alloys Compd. 2018, 761, 41–51. [Google Scholar] [CrossRef]
- Cao, R.; Ye, Y.; Peng, Q.; Zheng, G.; Ao, H.; Fu, J.; Guo, Y.; Guo, B. Synthesis and luminescence characteristics of novel red-emitting Ba2TiGe2O8: Mn4+ phosphor. Dye. Pigment. 2017, 146, 14–19. [Google Scholar] [CrossRef]
- Zhong, J.; Xu, M.; Chen, D.; Xiao, G.; Ji, Z. Novel red-emitting Sr2LaSbO6: Eu3+ phosphor with enhanced 5D0 → 7F4 transition for warm white light-emitting diodes. Dye. Pigment. 2017, 146, 272–278. [Google Scholar] [CrossRef]
- Hu, G.; Hu, X.; Chen, W.; Cheng, Y.; Liu, Z.; Zhang, Y.; Liang, X.; Xiang, W. Luminescence properties and thermal stability of red phosphor Mg2TiO4: Mn4+ additional Zn2+ sensitization for warm W-LEDs. Mater. Res. Bull. 2017, 95, 277–284. [Google Scholar] [CrossRef]
- Huang, X. Solid-state lighting: Red phosphor converts white LEDs. Nat. Photonics 2014, 8, 748. [Google Scholar] [CrossRef]
- Du, P.; Bharat, L.K.; Yu, J.S. Strong red emission in Eu3+/Bi3+ ions codoped CaWO4 phosphors for white light-emitting diode and field-emission display applications. J. Alloys Compd. 2015, 633, 37–41. [Google Scholar] [CrossRef]
- Zhu, H.; Lin, C.C.; Luo, W.; Shu, S.; Liu, Z.; Liu, Y.; Kong, J.; Ma, E.; Cao, Y.; Liu, R.-S.; et al. Highly efficient non-rare-earth red emitting phosphor for warm white light-emitting diodes. Nat. Commun. 2014, 5, 4312. [Google Scholar] [CrossRef]
- Barbier, J.; Cranswick, L.M.D. The Non-Centrosymmetric Borate Oxides, MBi2B2O7 (M = Ca, Sr). J. Solid State Chem. 2006, 179, 3958–3964. [Google Scholar] [CrossRef]
- Bubnova, R.S.; Shablinskii, A.P.; Volkov, S.N.; Filatov, S.K.; Krzhizhanovskaya, M.G.; Ugolkov, V.L. Crystal Structures and Thermal Expansion of Sr1−xBaxBi2B2O7 Solid Solutions. Glass Phys. Chem. 2016, 42, 337–438. [Google Scholar] [CrossRef]
- Volkov, S.; Bubnova, R.; Shorets, O.; Ugolkov, V.; Filatov, S. Crystal structure and strong uniaxial negative thermal expansion of CaBi2B2O7 borate. Inorg. Chem. Commun. 2020, 122, 108262. [Google Scholar] [CrossRef]
- Shablinskii, A.P.; Povolotskiy, A.V.; Kolesnikov, I.E.; Biryukov, Y.P.; Bubnova, R.S.; Avdontceva, M.S.; Demina, S.V.; Filatov, S.K. Novel red-emitting color-tunable phosphors BaBi2−xEuxB2O7 (x = 0–0.40): Study of the crystal structure and luminescence. J. Solid State Chem. 2022, 307, 122837. [Google Scholar] [CrossRef]
- Shablinskii, A.; Bubnova, R.; Kolesnikov, I.; Krzhizhanovskaya, M.; Povolotskiy, A.; Ugolkov, V.; Filatov, S. Novel Sr3Bi2(BO3)4: Eu3+ red phosphor: Synthesis, crystal structure, luminescent and thermal properties. Solid State Sci. 2017, 70, 93–100. [Google Scholar] [CrossRef]
- Shablinskii, A.; Kolesnikov, I.; Bubnova, R.; Povolotskiy, A.; Lähderanta, E.; Filatov, S. A novel thermally stable Ba3Bi2(BO3)4: Eu3+ red phosphor for solid state lighting application. J. Lumin. 2019, 216, 116714. [Google Scholar] [CrossRef]
- Shablinskii, A.P.; Povolotskiy, A.V.; Yuriev, A.A.; Bubnova, R.S.; Kolesnikov, I.E.; Filatov, S.K. Novel CaBi2B4O10: Eu3+ red phosphor: Synthesis, crystal structure, luminescence and thermal expansion. Solid State Sci. 2020, 106, 106280. [Google Scholar] [CrossRef]
- Tichy, L.; Ticha, H.; Herzigova, L.; Ozdanova, J. Some physical properties of (Bi2O3)x(BaO)0.5−x(B2O3)0.5 glasses. Mater. Chem. Phys. 2011, 126, 289–294. [Google Scholar] [CrossRef]
- Egorysheva, A.V.; Volodin, V.D.; Skorikov, V.M. Glass Formation in the Bi2O3–B2O3–BaO System. Inorg. Mater. 2008, 44, 1261–1265. [Google Scholar] [CrossRef]
- Egorysheva, A.V.; Volodin, V.D.; Milenov, T.; Rafailov, P.; Skorikov, V.M.; Dudkina, T.D. Glass Formation in the CaO–Bi2O3–B2O3 and SrO–Bi2O3–B2O3 Systems. Russ. J. Inorg. Chem. 2010, 55, 1810–1817. [Google Scholar] [CrossRef]
- Egorysheva, A.V.; Volodin, V.D.; Berezovskaya, I.V.; Zubar’, E.V.; Skorikov, V.M.; Milenov, T.; Rafailov, P. Effect of Eu2O3 Doping on the Crystallization Behavior of BaO–Bi2O3–B2O3 Glasses. Inorg. Mater. 2012, 48, 948–952. [Google Scholar] [CrossRef]
- Majhi, K.; Varma, K. Structural, dielectric and optical properties of transparent glasses and glass-ceramics of SrBi2B2O7. J. Non-Cryst. Solids 2008, 354, 4543–4549. [Google Scholar] [CrossRef]
- Shablinskii, A.P.; Drozdova, I.A.; Volkov, S.N.; Krzhizhanovskaya, M.G.; Bubnova, R.S. Production and study of glass ceramics in Sr1−xBaxBi2B2O7 system. Fiz. I Khimiya Stekla 2012, 38, 886–889. [Google Scholar]
- Singh, V.; Kushwaha, H.S.; Vaish, R. Photocatalytic study on SrBi2B2O7 (SrO–Bi2O3–B2O3) transparent glass ceramics. Mater. Res. Bull. 2018, 99, 453–459. [Google Scholar] [CrossRef]
- Shablinskii, A.P.; Povolotskii, A.V.; Drozdova, I.A.; Kolesnikov, I.E.; Bubnova, R.S. New luminescent BaBi2−xEuxB2O7 glassmaterials. Glass Phys. Chem. 2019, 45, 74–78. [Google Scholar] [CrossRef]
- Padmaja, G.; Devarajulu, G.; Raju, B.D.P.; Turpu, G.; Srishailam, K.; Reddy, B.V.; Kumar, G.P. Synthesis of Sr1−xBaxBi2B2O7 glass ceramics: A study for structure and characterization using experimental techniques and DFT method. J. Mol. Struct. 2020, 1220, 128660. [Google Scholar] [CrossRef]
- Cai, G.; Li, M.; Liu, J.; Jin, S.; Wang, W.; Zheng, F.; Chen, X. Crystal structure and Eu(3+)/Tb(3+) doped luminescent properties of a new borate Ba3BiB9O18. Mater. Res. Bull. 2009, 44, 2211–2216. [Google Scholar] [CrossRef]
- Petříček, V.; Dušek, M.; Palatinus, L. Crystallographic Computing System JANA2006: General feature. Z. Für Krist. Cryst. Mater. 2014, 229, 345–352. [Google Scholar] [CrossRef]
- Bubnova, R.; Krivovichev, S.; Filatov, S.; Egorysheva, A.; Kargin, Y. Preparation, crystal structure and thermal expansion of a new bismuth barium borate, BaBi2B4O10. J. Solid State Chem. 2007, 180, 596–603. [Google Scholar] [CrossRef]
- Burns, P.C.; Grice, J.D.; Hawthorne, F.C. Borate minerals I. Polyhedral clusters and fundamental building block. Can. Mineral. 1995, 33, 1131–1151. [Google Scholar]
- Hawthorne, F.C. Towards a structural classification of minerals: The viMivT2φ minerals. Am. Mineral. 1985, 70, 455–473. [Google Scholar]
- Schindler, M.; Hawthorne, F.; Baur, W.H. A crystal-chemical approach to the composition and occurrence of vanadium minerals. Can. Mineral. 2000, 38, 1443–1456. [Google Scholar] [CrossRef]
- Hawthorne, F.C.; Schindler, M. Understanding the weakly bonded constituents in oxusalt minerals. Z. Für Krist. 2008, 223, 41–68. [Google Scholar] [CrossRef]
- Hawthorne, F.C. Toward theoretical mineralogy: A bond-topological approach. Am. Mineral. 2015, 100, 696–713. [Google Scholar] [CrossRef]
- Brown, I.D.; Altermatt, D. Bond-valence parameters obtained from a systematic analysis of the Inorganic Crystal Structure Database. Acta Crystallogr. 1985, B41, 244–247. [Google Scholar] [CrossRef]
- Hawthorne, F.C.; Burns, P.C.; Grice, J.D. The crystal chemistry of boron. Rev. Mineral. Geochem. 1996, 33, 41–116. [Google Scholar] [CrossRef]
- Sueno, S.; Clark, J.R.; Papike, J.J.; Konnert, J.A. Crystal-structure refinement of cubic boracite. Am. Mineral. 1973, 58, 691–697. [Google Scholar]
- Shannon, R.D. Revised effective ionic radii and systematic studies of interatomic distances in halides and chalcogenides. Acta Crystallogr. 1976, A32, 751–767. [Google Scholar] [CrossRef]
- Denisov, V.N.; Ivlev, A.N.; Lipin, A.S.; Mavrin, B.N.; Orlov, V. Raman spectra and lattice dynamics of single-crystal α-Bi2O3. J. Phys. Condens. Matter 1997, 9, 4967–4978. [Google Scholar] [CrossRef]
- Dogra, M.; Singh, K.; Kaur, K.; Anand, V.; Kaur, P.; Singh, P.; Bajwa, B. Investigation of gamma ray shielding, structural and dissolution rate properties of Bi2O3–BaO–B2O3–Na2O glass system. Radiat. Phys. Chem. 2018, 144, 171–179. [Google Scholar] [CrossRef]
- Dexter, D.L. A Theory of Sensitized Luminescence in Solids. J. Chem. Phys. 1953, 21, 836–850. [Google Scholar] [CrossRef]
- Blasse, G. Luminescence of inorganic solids: From isolated centres to concentrated systems. Prog. Solid State Chem. 1988, 18, 79–171. [Google Scholar] [CrossRef]
- van Shaik, W.; van Heek, M.M.E.; Middel, W.; Blasse, G. Luminescence and energy migration in a one-dimensional Gd3+ compound: Ca4GdO(BO3)3. J. Lumin. 1995, 63, 103–115. [Google Scholar] [CrossRef]
- Blasse, G. Energy transfer in oxidic phosphors. Phys. Lett. A 1968, 28, 444–445. [Google Scholar] [CrossRef]
Disclaimer/Publisher’s Note: The statements, opinions and data contained in all publications are solely those of the individual author(s) and contributor(s) and not of MDPI and/or the editor(s). MDPI and/or the editor(s) disclaim responsibility for any injury to people or property resulting from any ideas, methods, instructions or products referred to in the content. |
© 2023 by the authors. Licensee MDPI, Basel, Switzerland. This article is an open access article distributed under the terms and conditions of the Creative Commons Attribution (CC BY) license (https://creativecommons.org/licenses/by/4.0/).