Article

MS-CANet: Multi-Scale Subtraction Network with Coordinate Attention for Retinal Vessel Segmentation

College of Computer Science and Engineering, Northwest Normal University, Lanzhou 730070, China
*
Author to whom correspondence should be addressed.
These authors contributed equally to this work.
Symmetry 2023, 15(4), 835; https://doi.org/10.3390/sym15040835
Submission received: 24 February 2023 / Revised: 23 March 2023 / Accepted: 25 March 2023 / Published: 30 March 2023
(This article belongs to the Section Computer)

Abstract

:
Retinal vessel segmentation is crucial in the diagnosis of certain ophthalmic and cardiovascular diseases. Although U-shaped networks have been widely used for retinal vessel segmentation, most of the improved methods have insufficient feature extraction capability and fuse different network layers using element or dimension summation, leading to redundant information and inaccurate retinal vessel localization with blurred vessel edges. The asymmetry of small blood vessels in fundus images also increases the difficulty of segmenting blood vessels. To overcome these challenges, we propose a novel multi-scale subtraction network (MS-CANet) with residual coordinate attention to segment the vessels in retinal vessel images. Our approach incorporates a residual coordinate attention module during the encoding phase, which captures long-range spatial dependencies while preserving precise position information. To obtain rich multi-scale information, we also include multi-scale subtraction units at different perceptual field levels. Moreover, we introduce a parallel channel attention module that enhances the contrast between vessel and background, thereby improving the detection of marginal vessels during the decoding phase. We validate our proposed model on three benchmark datasets, namely DRIVE, CHASE, and STARE. The results demonstrate that our method outperforms most advanced methods under different evaluation metrics.

1. Introduction

Retinal vessels are an essential observable structure in fundus images, and their width, tortuosity, direction, and branching ratio variations are crucial means of diagnosing various diseases [1]. For example, diabetic retinopathy is a microvascular complication caused by elevated blood glucose levels, which can cause retinal vessel swelling [2]. Therefore, retinal vessel segmentation plays a critical role in assisting medical diagnosis. With the ever-increasing number of medical images, manual segmentation by doctors has become time-consuming and laborious and is no longer suitable for modern medical disease screening and diagnosis [3]. Therefore, automatic image segmentation has become a hot research topic in medical image processing. Traditional automatic segmentation methods [4,5,6] cannot accurately segment objects with low contrast and small sizes.
In recent years, machine learning-based methods have rapidly developed and sur-passed traditional methods. Zhao et al. [7] combined the advantages of region-based HMRF and FCM clustering segmentation and proposed a fuzzy clustering image seg-mentation algorithm on the basis of a hidden Markov random field model and Voronoi surface subdivision. Houcemeddine et al. [8] explored the combination of local and global search algorithms in image segmentation by optimizing the MRF model using a mixed ACO-ICM algorithm. Vargas-Muñoz et al. [9] proposed that iterative forest generation (ISF) can generate improved sets of connected superpixels (supervoxels in 3D) through a series of image forest transformations. There are also some image segmentation methods [10,11,12] that have achieved good segmentation results.
With the continual development of deep learning technology, excellent performance has been achieved in the field of image segmentation. In particular, U-Net [13] extracts rich semantic information from the image with the encoder and achieves accurate segmentation with the decoder. To enhance the segmentation performance of U-Net, Zhang and Chung et al. [14] proposed a multi-label architecture that utilized a U-shaped network with residual connections and side outputs to capture multi-scale features. He et al. [15] incorporated local de-regression to obtain additional labels, further improving segmentation accuracy. In addition to the single-branch segmentation methods, dual-branch segmentation methods have also been explored, combining coarse and fine segmentation for better performance. For example, Wu et al. [16] proposed the MS-NFN network, which employs two branches with the same U-shaped structure to improve capillary segmentation. Wang et al. [17] introduced the CTF-Net, a two-branch neural network that generates a preliminary prediction map in one branch and enhances feature extraction capabilities in the other with a feature enhancement module. Multi-scale network frameworks have also gained popularity in recent years. Vessel-Net [18], a multi-scale network proposed by Wu et al., uses four supervised paths to extract semantic features under different scales. Feng et al. [19] introduced CcNet, a cross-connected convolutional neural network that also employs a multi-scale approach for image segmentation. RK A et al. [20] utilizes multi-level loss to integrate features from multiple scales and prediction maps from sub-networks, which improves the ability of the CNN to correlate features from different sensory fields. Other approaches that have been explored include multiscale pooling combined with channel and time attention, which was proposed by W Yu et al. [21]. L Wang et al. [22] proposed the MSAN, a multi-scale attention network that cascades multiple multi-scale attention blocks to balance model complexity and performance efficiently. Although CNNs combined with generative adversarial networks have achieved good results [23], the majority of current methods are still based on U-shaped networks.
At present, although U-shaped-network-based retinal vessel segmentation methods have yielded promising results, they still face several challenges: (1) their feature extraction capability needs improvement; (2) the segmentation of the tiny blood vessel endings continues to be a significant challenge in fundus images due to the asymmetry of capillaries; and (3) most networks use element or dimension summation to merge information among different levels during up-sampling, resulting in redundant information and reduced complementarity of information among different levels.
To address the aforementioned challenges, we propose a novel approach that incorporates a multi-scale subtraction unit to enhance the complementarity of feature maps among different layers by reducing their differences. Additionally, we introduce a residual coordinate attention module and a parallel channel attention module to improve the network’s feature extraction and image up-sampling capabilities. Our proposed method offers several contributions:
  • We propose a new multi-scale subtraction network for fundus retinal image segmentation. By deploying multi-scale subtraction units, complementary information from low-order to high-order among layers can be selectively obtained, thereby comprehensively enhancing the perception of vessels regions.
  • We add a residual coordinate attention module in the down-sampling stage of the network to improve the ability of the network to extract features. It reduces the loss of feature information due to pooling layers and captures long-range dependencies along one spatial direction while preserving precise location information along another spatial direction.
  • We also design a parallel channel attention module and add it to the up-sample output part. It can activate and restore vessels in retinal images, effectively highlighting the boundary information of vessel ends and small vessels.
The remaining sections of this paper are organized as follows. We first describe our proposed network in detail in Section 2. Section 3 introduces the datasets, experimental setting, and evaluation metrics. In Section 4, we discuss and compare experimental results from various aspects. Finally, we draw conclusions in Section 5.

2. Methods

In this section, we provide a comprehensive overview of our proposed network, which includes the composition of the BackBone network, a detailed description of the multi-scale subtraction unit and its deployment, and the design of the residual coordinate attention module and the parallel channel attention module.

2.1. The Network Structure of MS-CANet

Our proposed network, MS-CANet, as shown in Figure 1, consisted of three parts: the encoder part, the multi-scale subtraction part, and the decoder part. The encoder extracted semantic features at different levels of the image using 48 pixels of the original image as input. To better extract image features, we incorporated the Residual Coordinate Attention Module (RCA), which preserved the precise position information of the image and enhanced the representation of blood vessels. Four encoders extracted semantic information at different levels of the image, providing multiple inputs for the next part. The multi-scale subtraction part efficiently obtained complementary information among different levels through multi-level and multi-stage cascaded subtraction operations, enhancing the perception of the vessel region. In the decoder part, feature maps were progressively recovered by up-sampling, and each up-sampling step was fused with different levels of information from the multi-scale subtraction part. Finally, the Parallel Channel Attention Module (PCA) activated and restored the blood vessels in the retinal image, producing the segmentation results in an end-to-end manner.

2.2. Residual Coordinate Attention Module

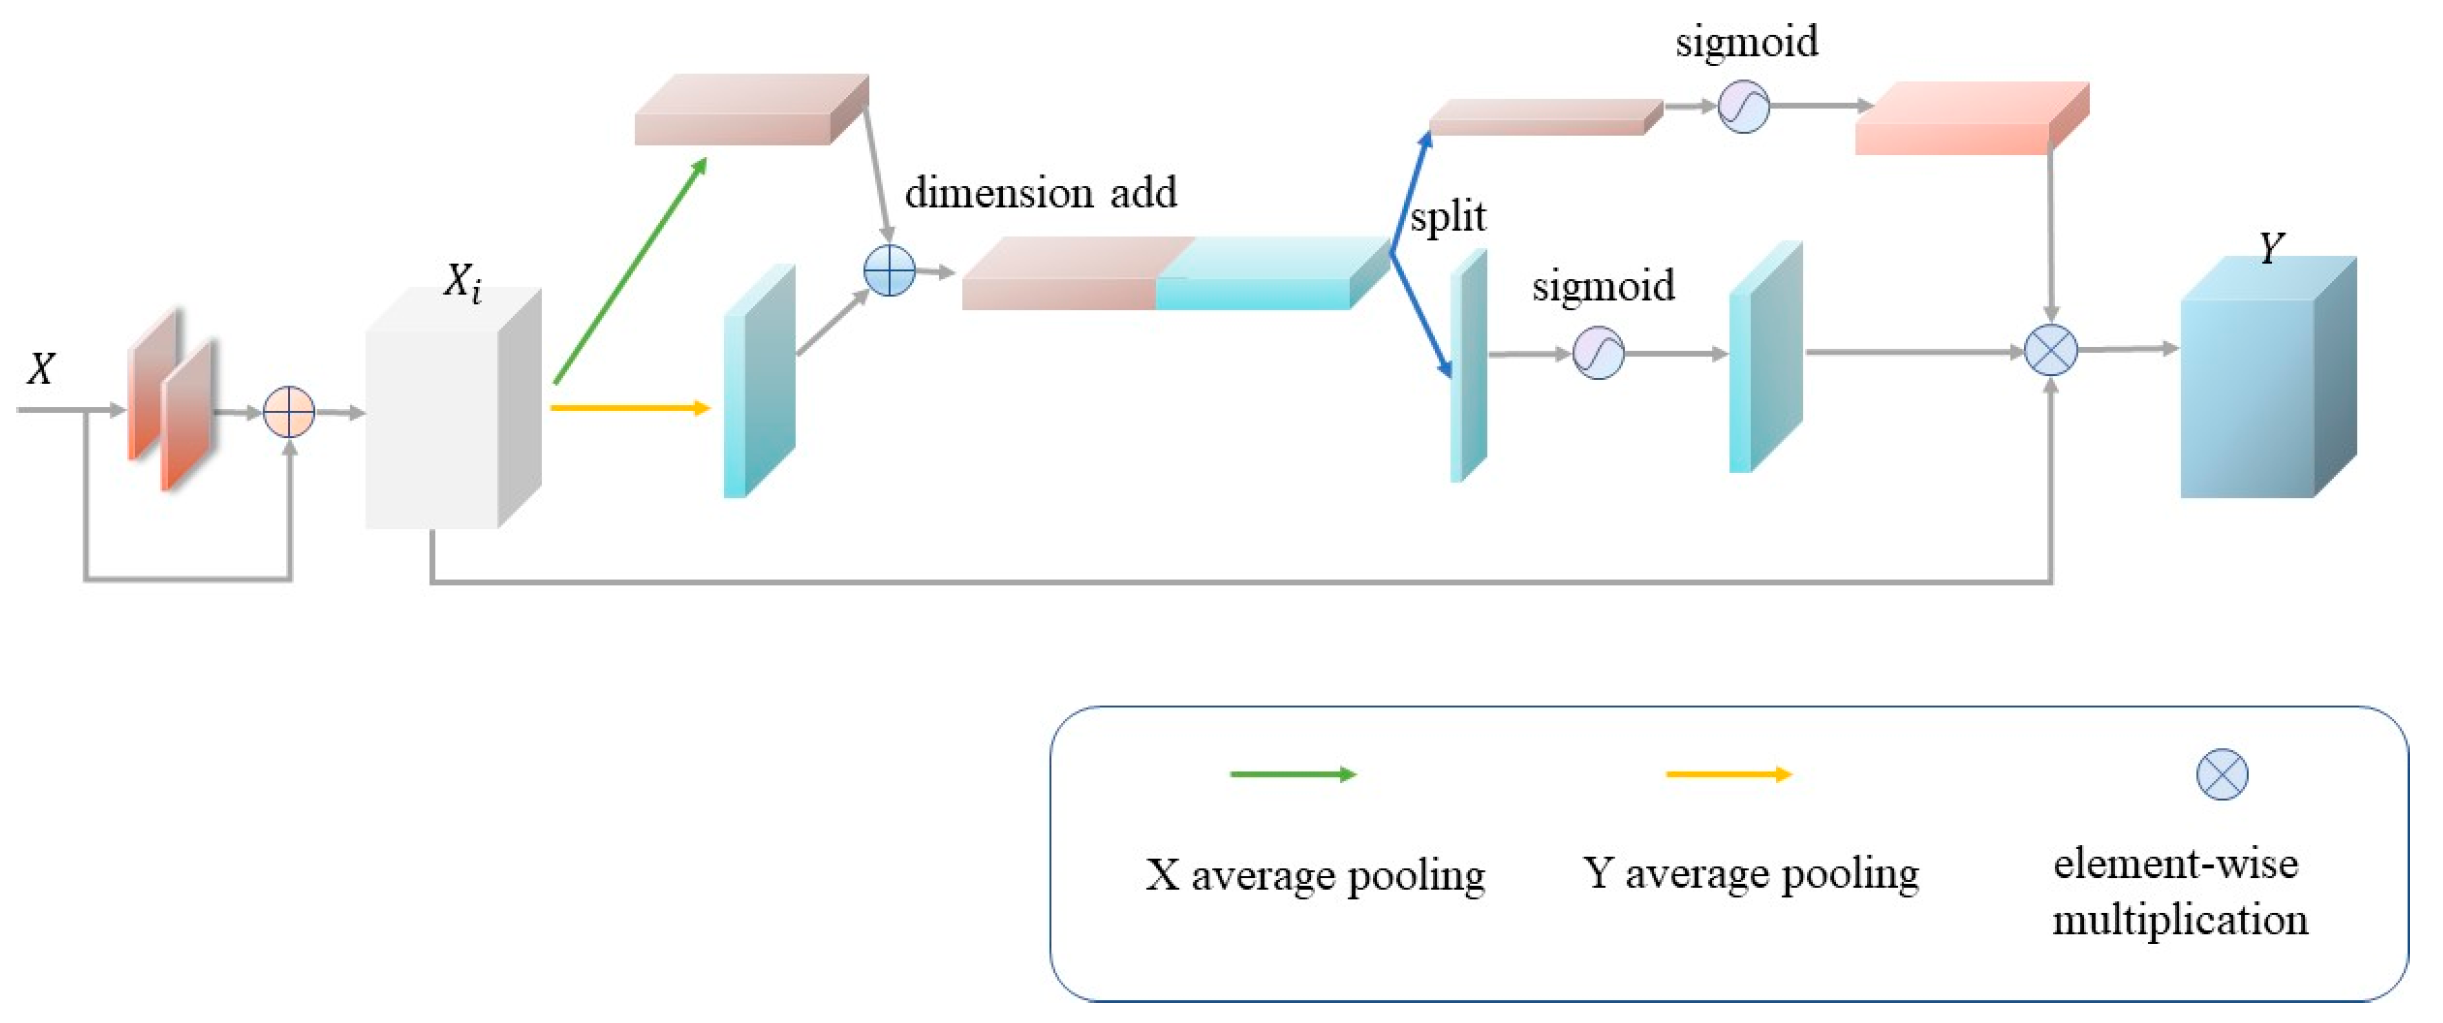
Location information is crucial for capturing structural features in vision tasks. However, conventional channel attention methods often use global pooling to encode spatial information, which compresses the global spatial information into the channel description, leading to the loss of location information [24]. In order to overcome this limitation, we designed the Residual Coordinate Attention (RCA) module shown in Figure 2. The RCA module aimed to encode channel relationships and long-range dependencies with precise location information, thereby enhancing the representation of vessel features in the network. The use of RCA encouraged the attention module to capture long-range interrelationships in space while retaining accurate location information.
Given an input X , two continuous 3 × 3 convolutions were used to encode and introduce residual connections to accelerate the learning of the network to obtain a feature map X i . Two spatially scoped pooling kernels were used to average pooling operations for each channel along horizontal and vertical coordinates, respectively, and such operations aggregated features along two spatial directions to obtain a pair of direction-aware feature maps z c h ( h ) and z c w ( w ) . This pair of feature maps was concatenated in the spatial dimension and encoded with a shared 1 × 1 convolution function F 1 to obtain a pair of intermediate feature maps f with horizontal and vertical spatial information. Then, f was split into two independent tensors f h and f w along the spatial dimension, and the 1 × 1 convolution functions F h and F w indifferent spatial directions were then used to transform these two tensors into an input X i that had the same number of channel tensors. Finally, these two tensors were applied to the original input X i to obtain the output Y . The procedure for calculating the residual coordinate attention module is as follows in Equations (1)–(3):
f = δ ( F 1 [ z c h ( h ) ,   z c w ( w ) ] )
g ( h , w ) = δ ( F ( h , w ) ( f ( h , w ) )
Y = X i   ×   g h   ×   g w
where ( h , w ) denotes h or w , [ z c h ( h ) ,   z c w ( w ) ] denotes the tandem operation in spatial dimensions, δ denotes the Sigmoid activation function, F 1 denotes the shared 1 × 1 convolutional transform function, and F h and F w denote the 1 × 1 convolutional transform functions in the vertical and horizontal spatial directions, respectively.

2.3. Multi-Scale Subtraction Units

To achieve better integration of complementary information from feature layers across multiple levels, we enhanced the original multi-scale subtraction unit [25], which captures only the complementary information between adjacent layers. Although the redundancy of information caused by addition operations was reduced, there still may have been some information redundancy. Therefore, we extended the adjacent levels to each level, enabling high-level features to obtain the complementary information of the lowest-level features. This allowed us to compute across multiple levels and obtain features with multiple receptive fields and different levels of complementarity, which provided richer information for the decoder. The multi-scale subtraction part is depicted in Figure 1, where each subtraction unit performed element-wise subtraction with features at different layers within the same level, ensuring that each layer had complementary information from the other layers.
Let Fa and Fb denote the feature maps activated by the RELU activation function in different layers, and the definition of the multi-scale subtraction unit is as follows in Equation (4):
s u _ u n i t = C o n v ( | F a F b | )

2.4. Parallel Channel Attention Module

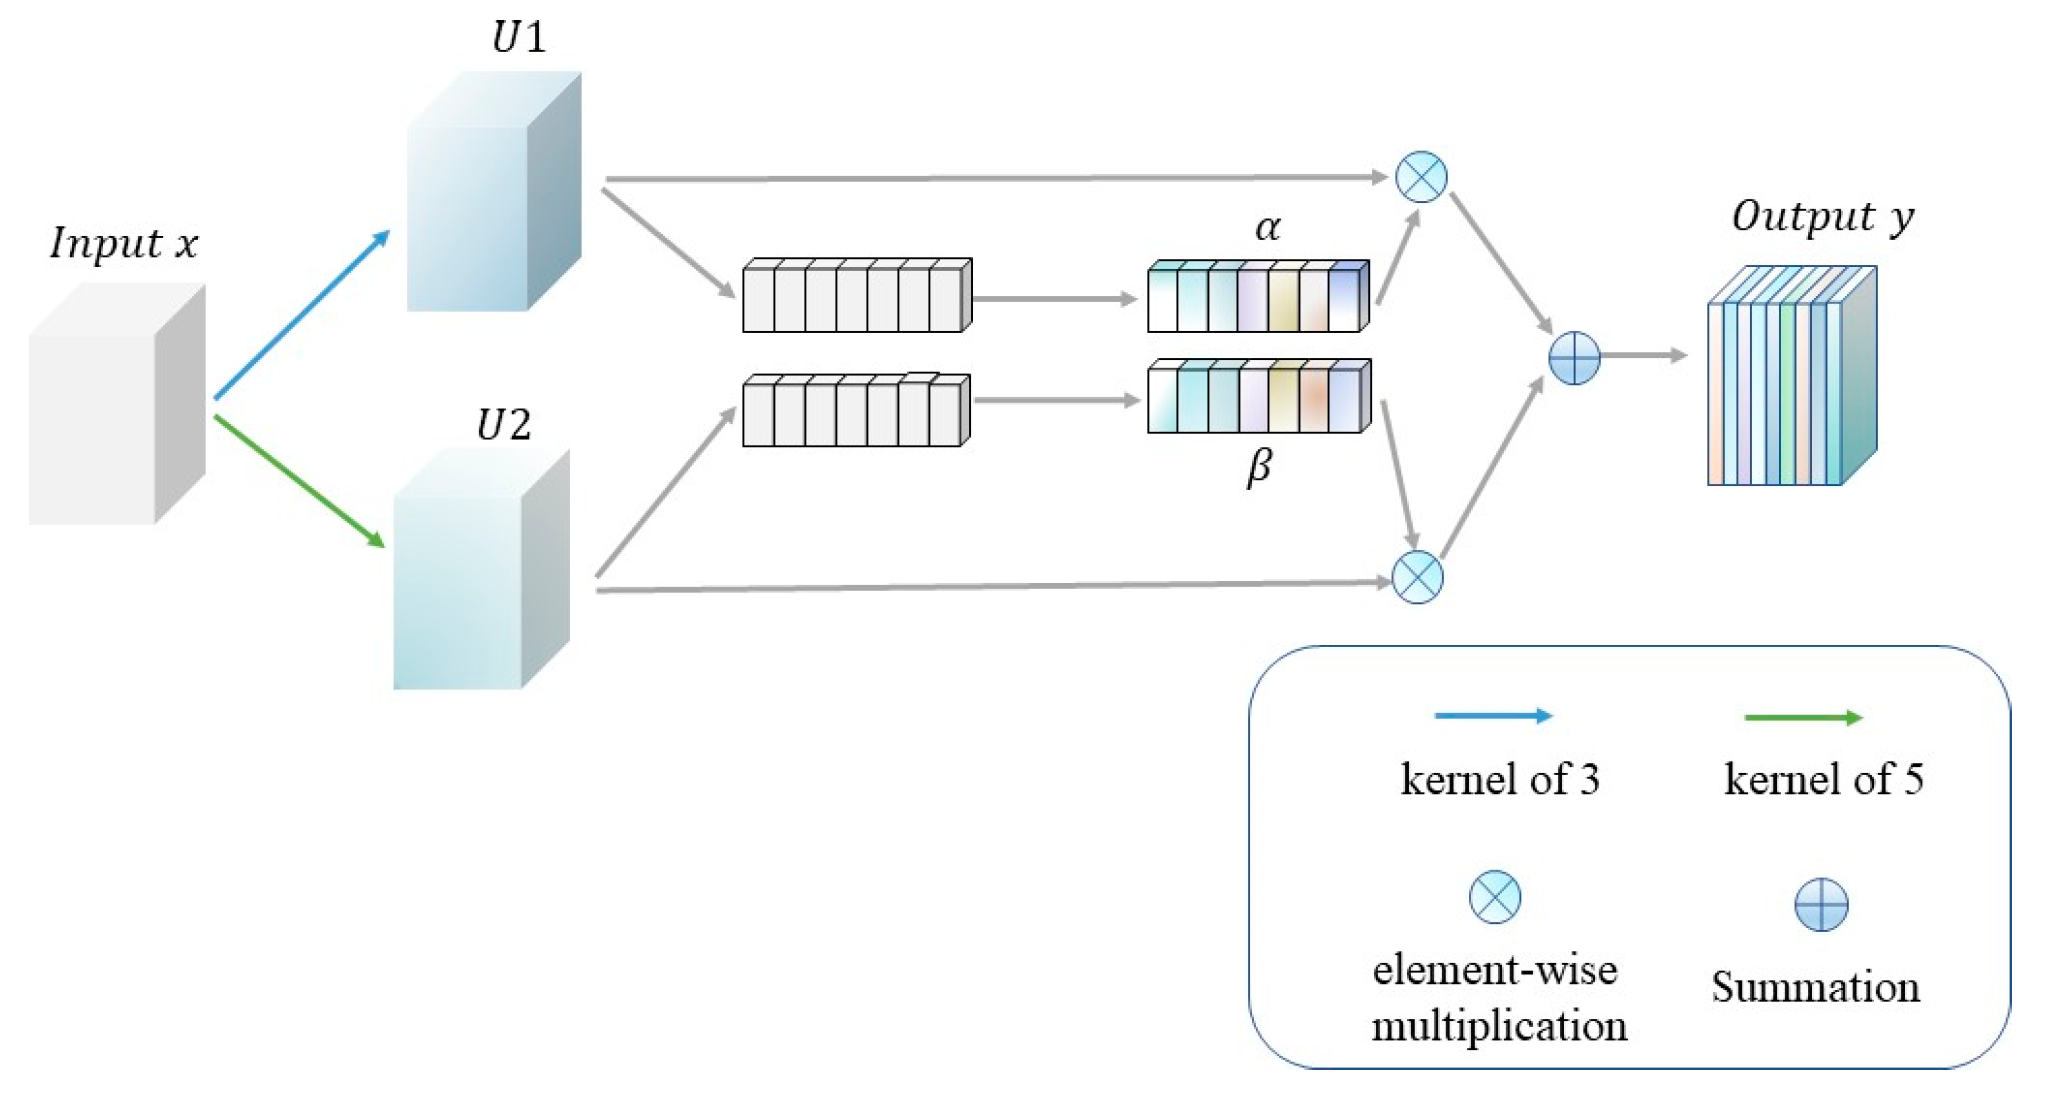
To activate and enhance the recovery of retinal vessels, we designed a parallel channel attention module at the end of the network, as shown in Figure 3. The input feature map x of size C × H × W was sent to the module and processed with 3 × 3 and 5 × 5 convolution kernels to generate feature maps U 1 and U 2 , respectively, under different receptive fields. The same operation was performed on the parallel branches: the global information on each channel of the feature map was obtained through the global average pooling and the sigmoid activation function, and the attention weight coefficients α and β of each channel were generated. The attention weight coefficient was applied to the original input feature map to obtain the channel-weighted attention map. After completing the channel weighting of the feature map, the attention maps obtained by the two branches were added element by element to obtain the output of the final module. The calculation formula of the parallel channel attention module is defined as follows in Equation (5):
y = U 1   ·   α + U 2   ·   β
where U 1 and U 2 are the feature maps generated by convolution kernels of 3 and 5, respectively, and α and β are the attention weight coefficients.

3. Datasets and Evaluation Metrics

3.1. Datasets

Our method was validated on three retinal vessel standard datasets, including DRIVE [26], CHASE [27], and STARE [28]. The DRIVE dataset consists of 40 retinal images, 7 of which show signs of mild early diabetic retinopathy. The size of each image is 565 × 584 pixels, and it was divided 50/50 into training set and test set. The CHASE dataset is a lightweight image dataset for retinal vessel segmentation. It contains 28 retinal images, and each image corresponds to 2 retinal vessel segmentation images. The size of each image is 999 × 960 pixels. Twenty images were used for training, and the remaining images were used for testing and evaluation.
The STARE dataset consists of 20 images. The size of each image is 700 × 605 pixels. We used the leave-one-out method for training and testing on this dataset.

3.2. Implementation Details

Our experiment used the deep learning framework PyTorch, the operating system was the Linux operating system, the server used for training was Quardro RTX 6000, and the memory size of the GPU was 24G. During training, random slices were used as the input of the network, and the size of the slices was 48 × 48 pixels. To expand the data, we rotated and panned each image and expanded the number of slices per image to 10,480. The iteration period of the model training was 100, the batch size was 256, and the initial learning rate was set to 0.001. For the regulation of the learning rate, we used a stepwise decay method, where the decay factor was 0.01, and the weight decay was 0.0005. Using the Adam optimizer, the momentum size was 10−8. We used the cross-entropy loss function to make the training better.

3.3. Evaluation Metrics

To evaluate the performance of the proposed method, we used a confusion matrix to calculate evaluation indicators such as Sensitivity, Specificity, Accuracy, and F-measure. Each evaluation metric is defined by the following:
A c c u r a c y = T P + T N T P + F N + T N + F P
S e n s i t i v i t y = T P T P + F N
S p e c i f i c i t y = T N T N + F P
P r e c i s i o n = T P T P + F P
F - m e a s u r e = 2 × P r e c i s i o n × S e n s i t i v i t y P r e c i s i o n + S e n s i t i v i t y
where T P is the number of correctly marked vessels pixels, T N is the number of correctly marked background pixels, F P is the number of background pixels that were incorrectly marked as vessels pixels, and F N is the number of vessels pixels that were incorrectly marked as background pixels.

4. Experiment and Result Analysis

4.1. Structure Ablation

To verify the effectiveness of our proposed residual coordinate attention module (RCA) and parallel channel attention module (PCA), we conducted relevant experiments on the DRIVE and CHASE datasets. Table 1 and Table 2 show the structure ablation experiments on the DRIVE and CHASE datasets, respectively. The BackBone network is a network with a multi-scale subtraction part. On this basis, BackBone/RCA means adding the RCA module to the BackBone. BackBone/PCA means adding the PCA module to the BackBone. BackBone/RCA/PCA means adding both RCA and PCA modules.
Table 1 shows that the model with the addition of the RCA module and the PCA module had higher accuracy, sensitivity, and F-measure than the backbone model. It can be seen that the introduction of these two modules allowed the network to have a better learning capability. The RCA module captured the long-range spatial dependencies with precise location information when the network down-sampled to extract features, and it enhanced the expression ability of vessel features in the network. The PCA module increased the disparity between vessels and background, and it had better activation in the decoding stage and recovery of marginal vessels.
As can be seen from Table 2, the networks with the RCA module and the PCA module added, respectively, improved in each performance metric compared with the BackBone, especially the F1-measure, which improved by 1.17% and 1.13%, respectively. Adding both modules to the BackBone (i.e., BackBone/RCA/PCA) resulted in a larger improvement in each performance metric compared with the BackBone. The experiments show that although the accuracy and specificity of BackBone/RCA/PCA were slightly lower than BackBone/RCA, the sensitivity, F1-measure, and ROC were the highest among the four models.
To verify the effectiveness of our added modules, we compared the ROC and PR curves of these four models on the DRIVE and CHASE datasets. Table 3 shows the comparison results. The ROC and PR of the network with the addition of the RCA module and the PCA module were improved. This is due to the addition of coordinate attention and parallel channel attention, better extraction of location information during feature extraction, and better activation and restoration of vessels in the up-sampling stage. This demonstrates the effectiveness of these two modules. After adding both the RCA module and the PCA module to the network, the model (BackBone/RCA/PCA) had the best performance; the ROC and PR were 0.9903 and 0.9441, respectively, which were 0.17% and 0.68% higher than the BackBone network, respectively, also proving that after the two modules were combined, the performance of the BackBone network was improved. On the CHASE dataset, the ROC and PR of the best model (BackBone/RCA/PCA) reached 0.9897 and 0.8977, respectively. Relative to the backbone network, ROC and PR increased by 0.23% and 0.85%, respectively. With the addition of the RCA module and the PCA module, the performance of the model was improved relative to the backbone network, and finally, the model with the two modules added achieved the best performance.
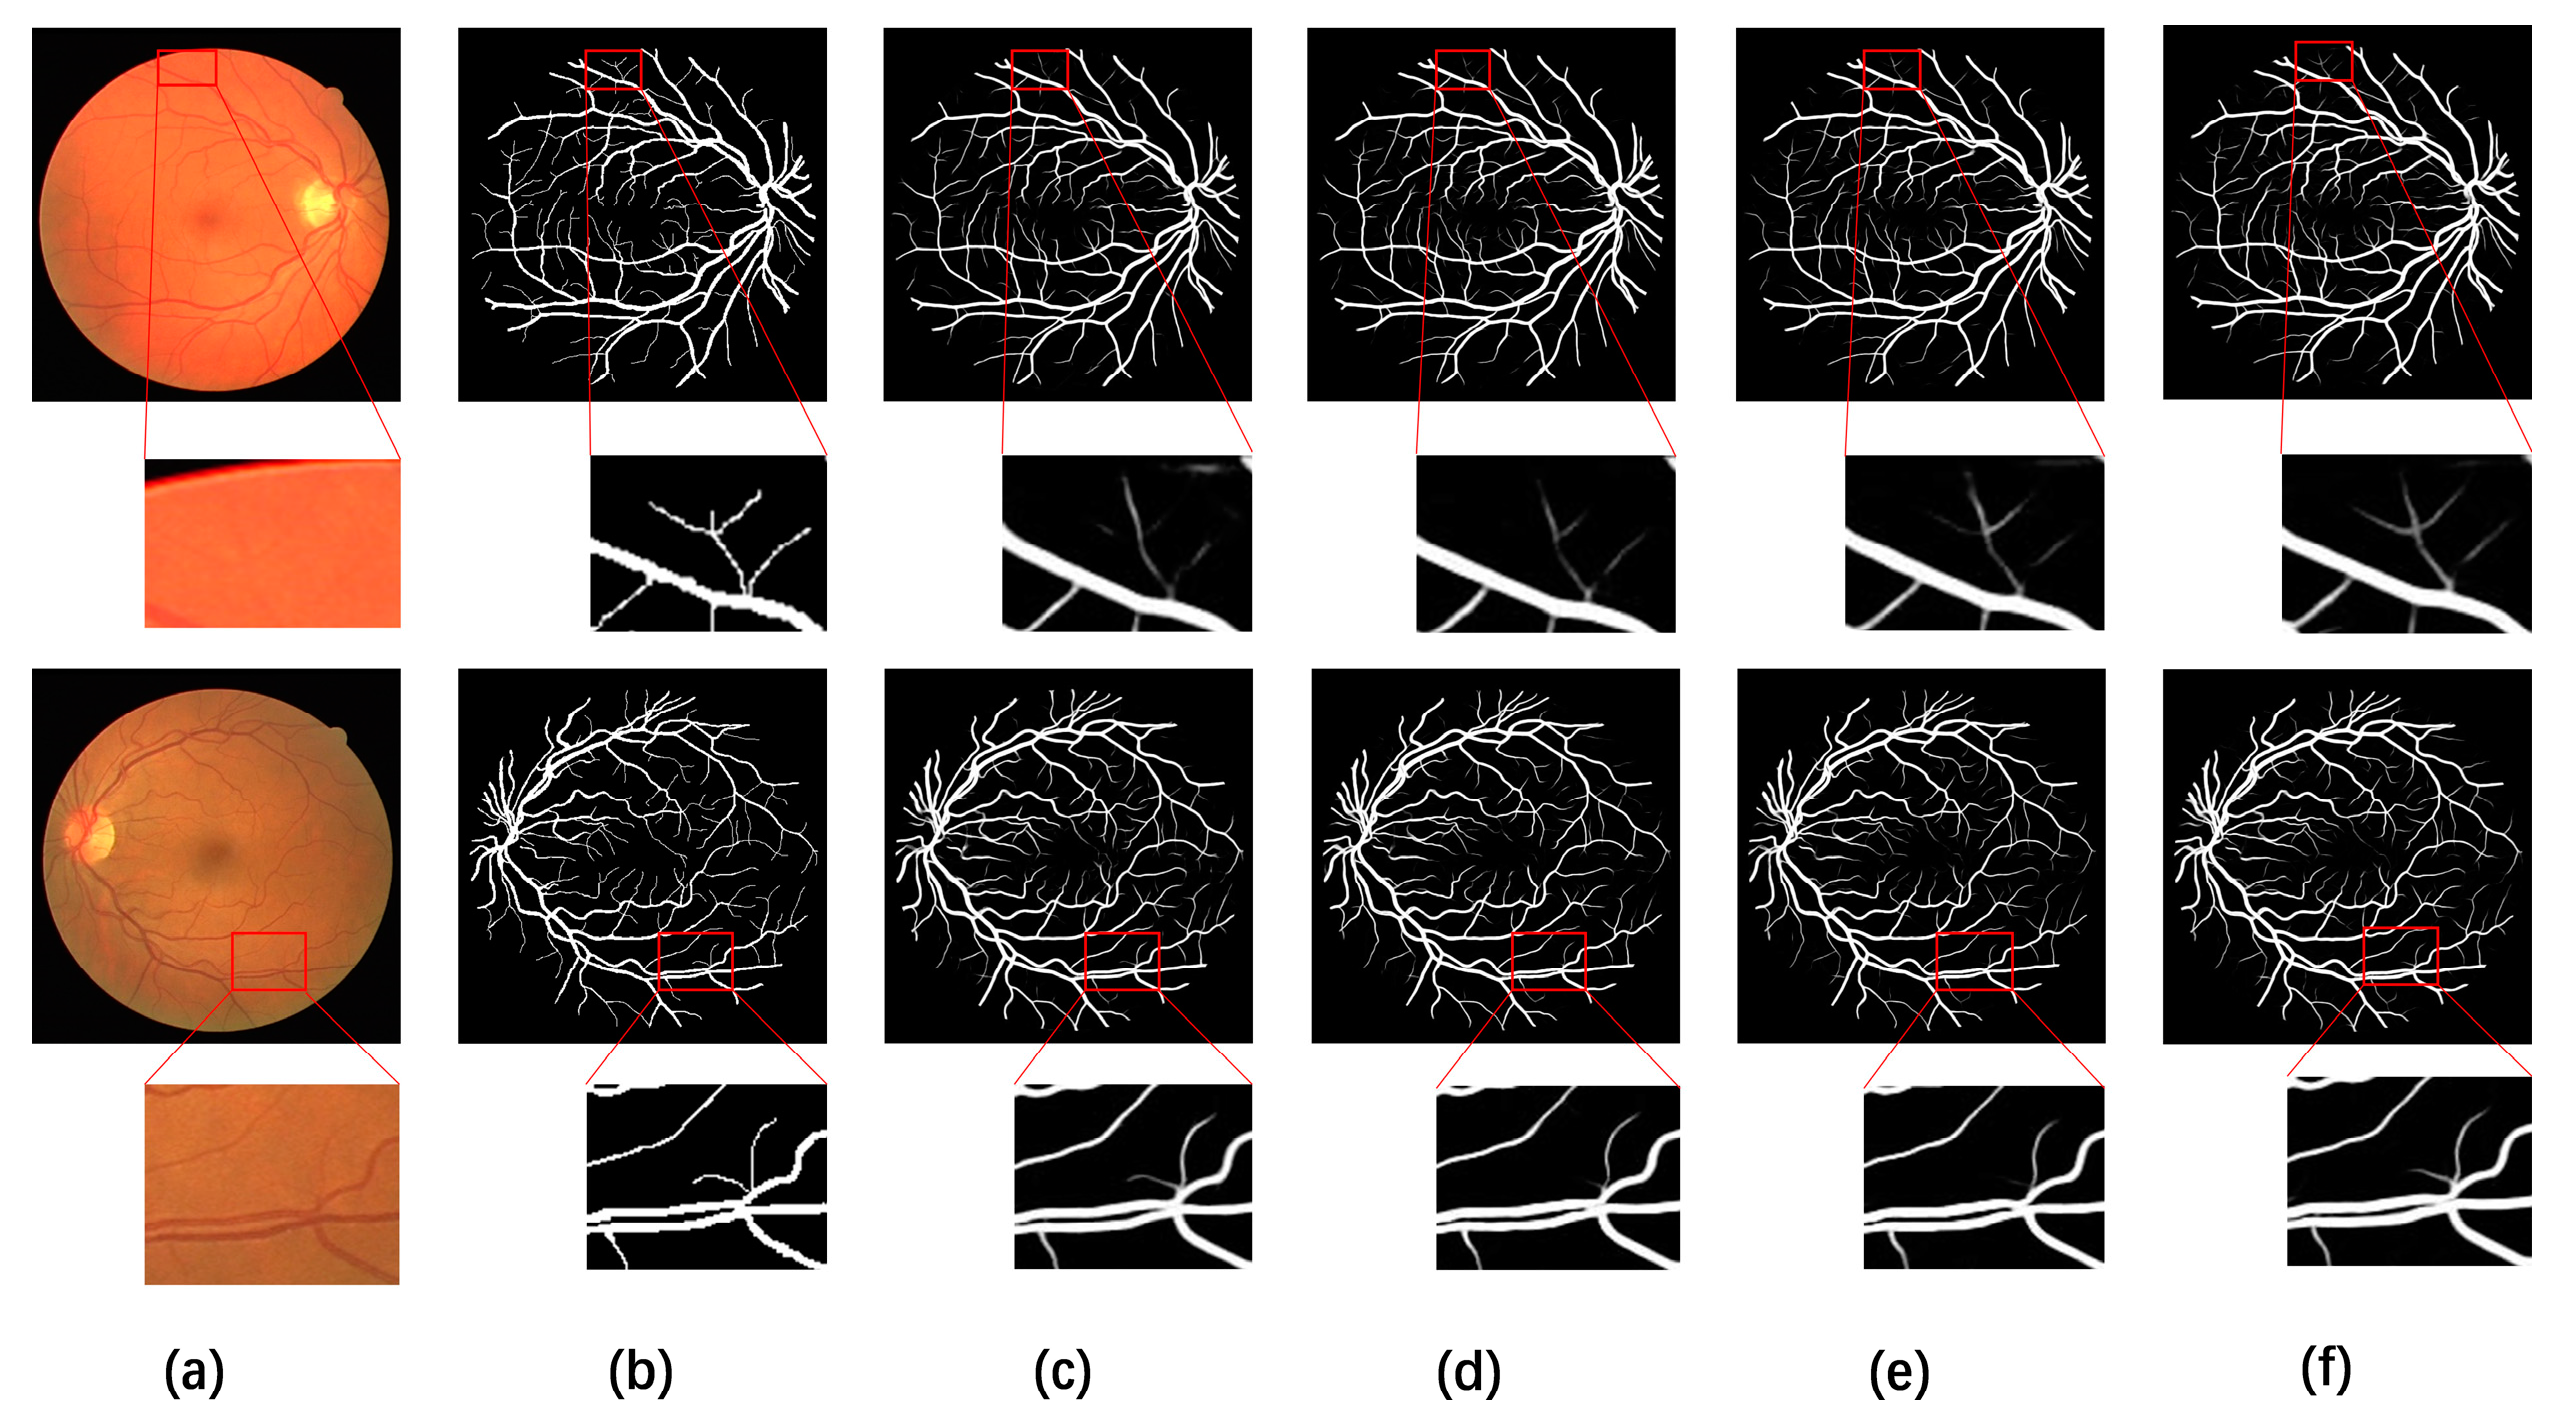
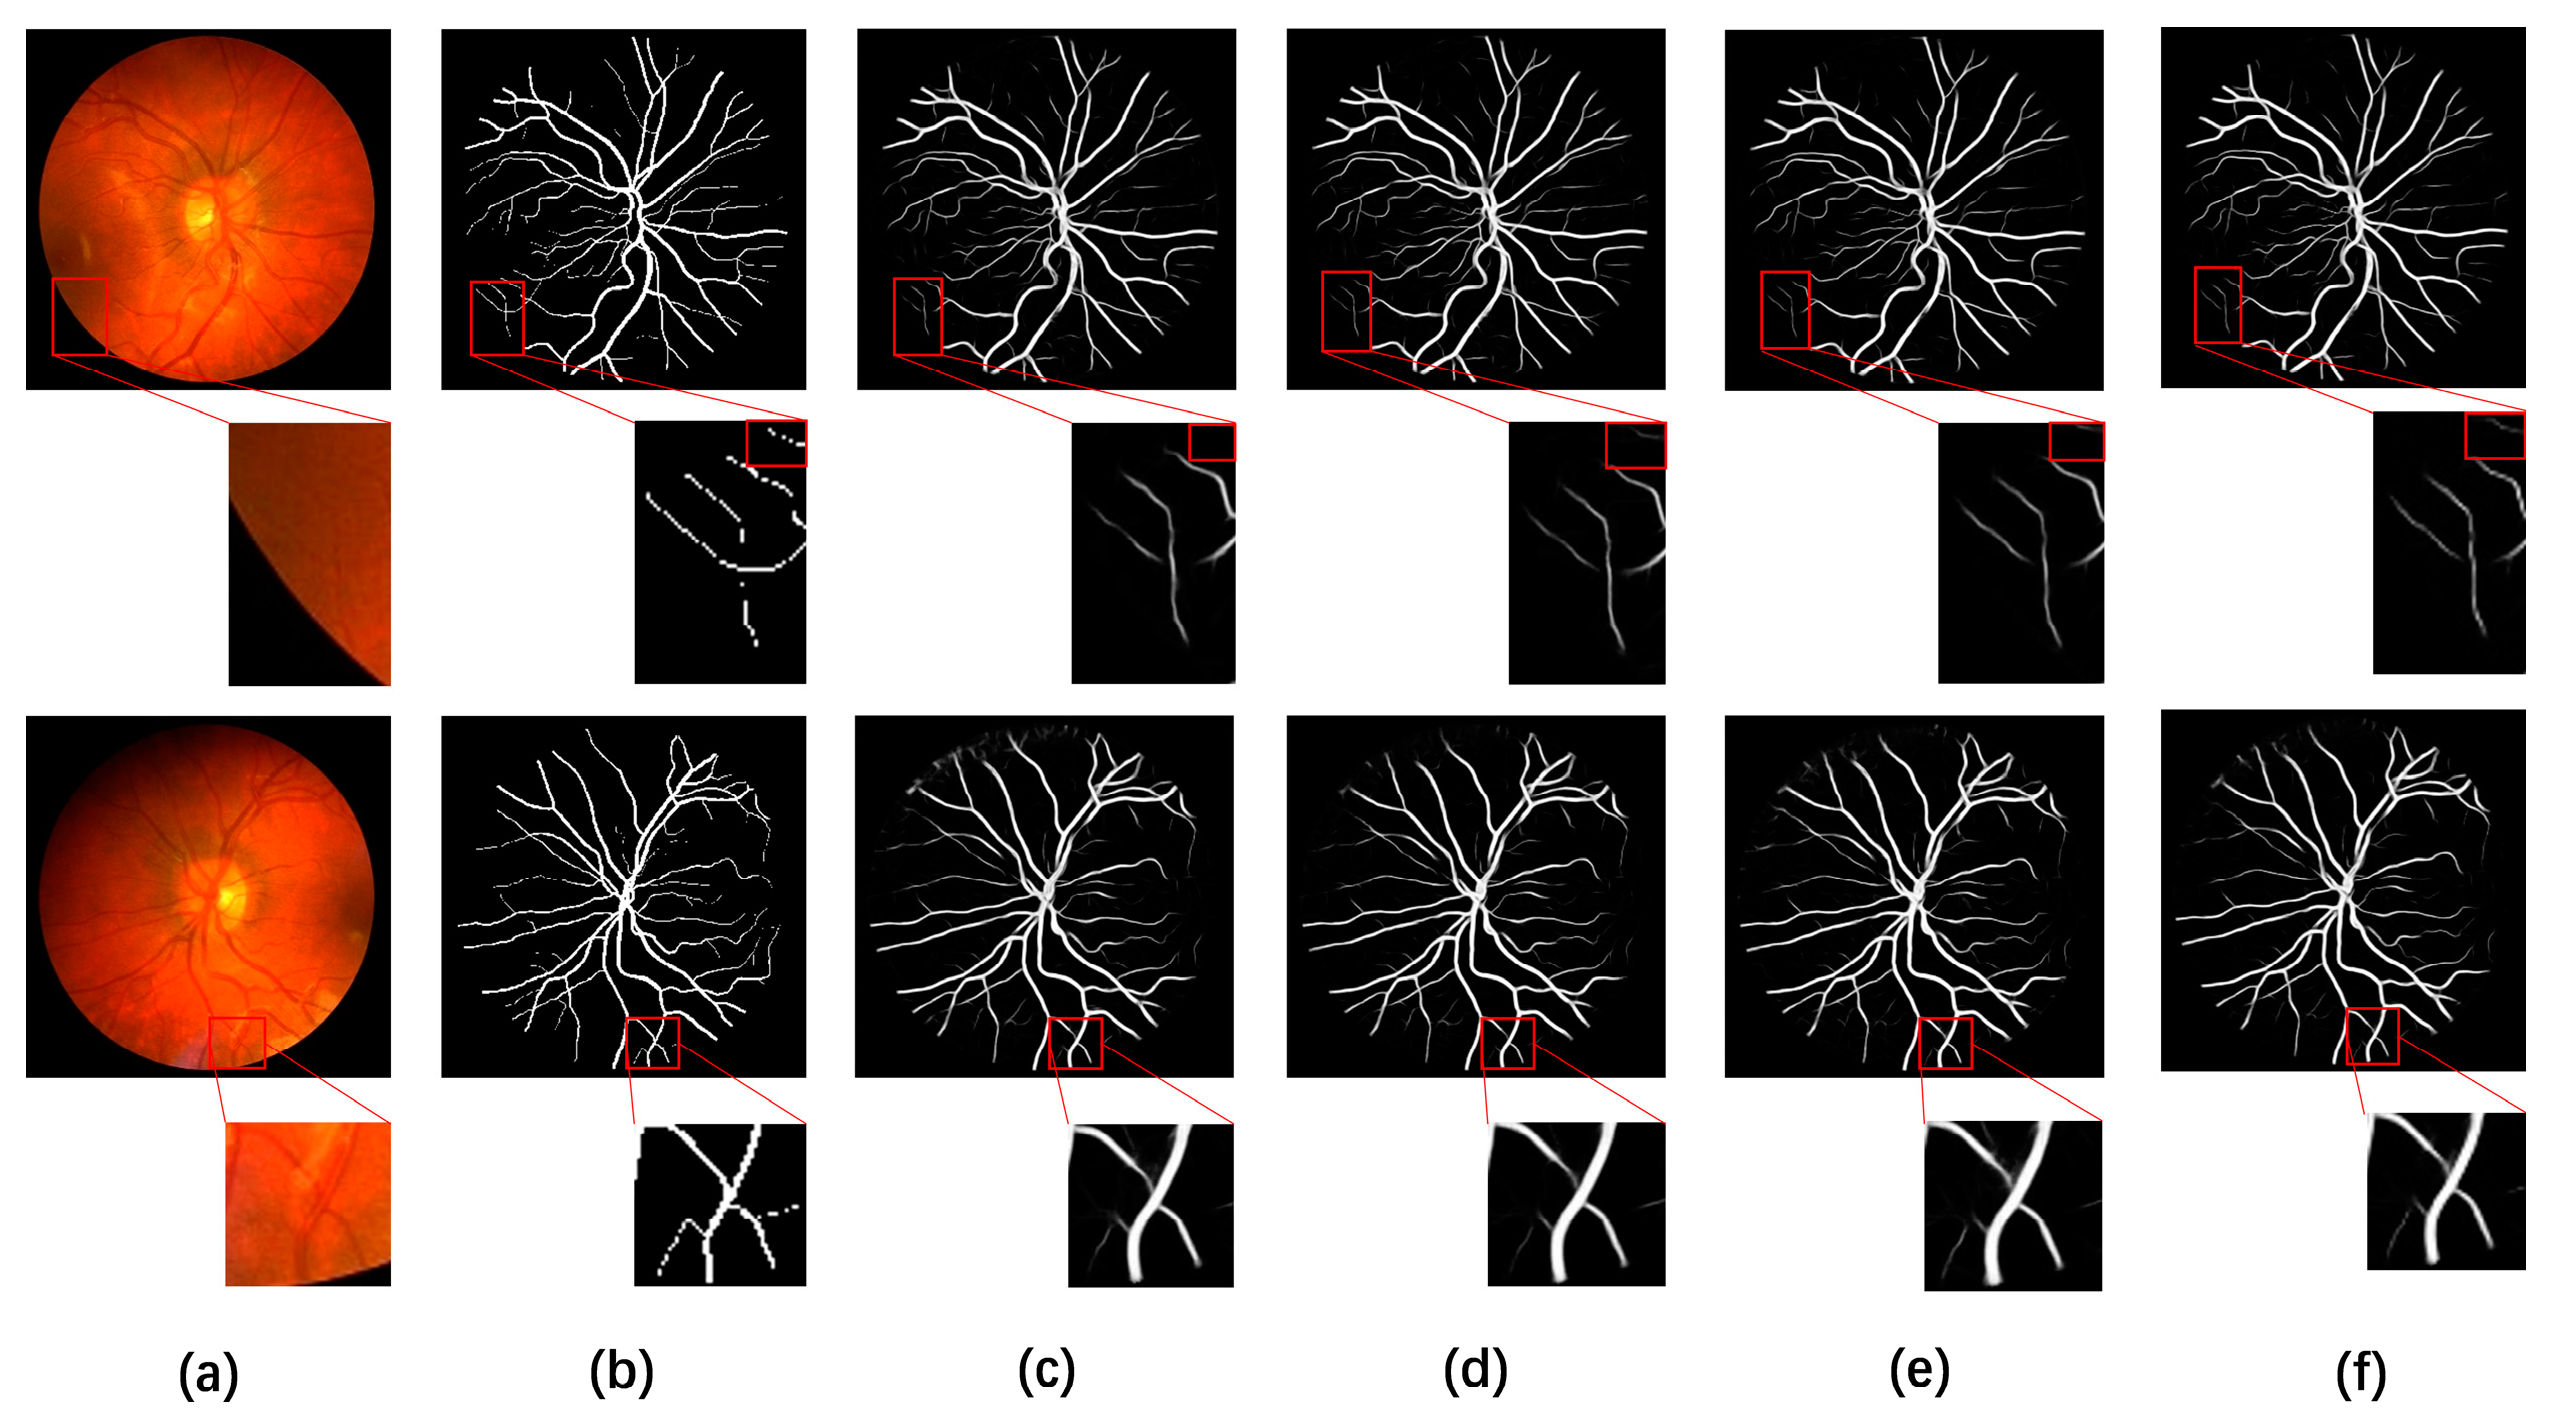
To more intuitively feel the effectiveness of the module in the ablation experiment, we show the visualization results of vessel segmentation on fundus retinal images on DRIVE and CHASE datasets in Figure 4 and Figure 5. From the segmentation results, it can be seen that for different models, it was easy to segment the thicker veins and the slightly thinner arteries in the center of the retina. It was difficult to accurately segment the surrounding tiny vessels; the model needs to have stronger learning ability and feature extraction ability, which is also an important evaluation point for evaluating the effectiveness of segmentation. To highlight the segmentation effect, we show the segmentation results of tiny vessels with red boxes. It can be seen from the segmentation results that the BackBone network could segment the trunk part of the vessels well, but the segmentation effect of the tiny vessels was poor. The network with RCA and PCA modules added, respectively, had a certain degree of improvement in the segmentation of tiny vessels, but there were still some problems, such as edge blurring. Finally, the network with the two modules added could better segment the tiny vessels and contained less noise, which indicates that our method was effective for the segmentation of tiny vessels.

4.2. Attention Module Ablation

The parallel channel attention module (PCA) is designed to better segment retinal vessels and improve the segmentation ability. To verify the effectiveness of the PCA module and verify its better performance compared with other attention modules, we designed a set of ablation experiments. BackBone/RCA was used as the baseline for ablation experiments, and we changed only the attention module of the last layer of up-sampling to verify the effectiveness of the PCA module proposed in this paper. We chose three classical attention modules and PCA modules for experimental comparison. Among them, the first was the efficient channel attention (ECA) of the ECA-Net [29] network, which is usually used for object detection and instance segmentation tasks. This module adopts a local cross-channel interaction strategy without dimensionality reduction. The second was the Convolutional Block Attention Module [30] (CBAM), which performs global average and global maximum mixed pools simultaneously in space and channel, which can obtain more effective information. The last one was the squeeze-and-excitation (SE) block in SENet [31], which improved the performance of model classification by modeling the interdependencies among feature channels.
Table 4 and Table 5 show the experimental results of adding the ECA module, CBAM module, SE module, and our PCA module to the baseline. The experimental results show that the ECA, CBAM, and SE modules improved the performance of the model to a certain extent, but it can be seen from the F-measure evaluation indicator that the overall segmentation result after adding the PCA module was higher than the other three attention modules. Compared with the three modules, the PCA module performed the best because PCA pays great attention to different receptive fields and fuses the features under different receptive fields to maximize activation and restore the representation of vessels.
We also used ROC and PR curves to evaluate the performance of these different attention modules. The final results show that adding the PCA module at the last layer of the network performed better than adding the other three attention modules.

4.3. Model Parameter Quantity and Computation Time Analysis

We compared the number of model parameters and computation time with the classic U-Net model in the field of medical image segmentation. Our model had a total parameter size of 23.99 MB, and it required 4.70 s, 14.35 s, and 6.11 s to segment a complete image on the three standard datasets, DRIVE, CHASE, and STARE, respectively. It required 4 s for the U-Net model to segment a complete image on the DRIVE dataset, and the resulting F-measure was 0.8147. Our model required 0.7 s more than U-Net to segment an image on the DRIVE dataset, but our F-measure reached 0.8389, an improvement of 2.42% compared with U-Net, which is quite a large segmentation accuracy improvement.

4.4. Comparisons with Other Methods

To demonstrate the effectiveness of our proposed vessel segmentation method, we used some segmentation methods from recent years to conduct experiments on these three datasets and compare them with our method. Evaluation metrics included accuracy, sensitivity, specificity, and F1-measure. Table 6 and Table 7 show the retinal vessel segmentation results on the DRIVE and CHASE datasets. Table 8 shows the retinal vessel segmentation results on the STARE dataset. Finally, in Table 9, we show the results of training and testing on the STARE dataset using the leave-one-out method.
As can be seen in Table 6, our method achieved good results in all metrics except for the specificity, which was not as high as D-Net. Due to the non-uniform background illumination of the sample images in the CHASE dataset, it was difficult to distinguish vessels from the wider arterial vessels, which requires a model with strong feature extraction capability. In Table 8, compared with the classical UNet++, our model improved on F-measure by 0.32%, accuracy by 0.22%, sensitivity by 1.22%, and specificity by 0.56%. Our method improved on all metrics. As seen in Table 9, we achieved an F-measure of 85.00%, a 1.07% improvement over UNet++ and a 0.25% improvement over R2U-Net. Our method had the highest F-measure and Accuracy.

4.5. Visual Comparison with Different Methods

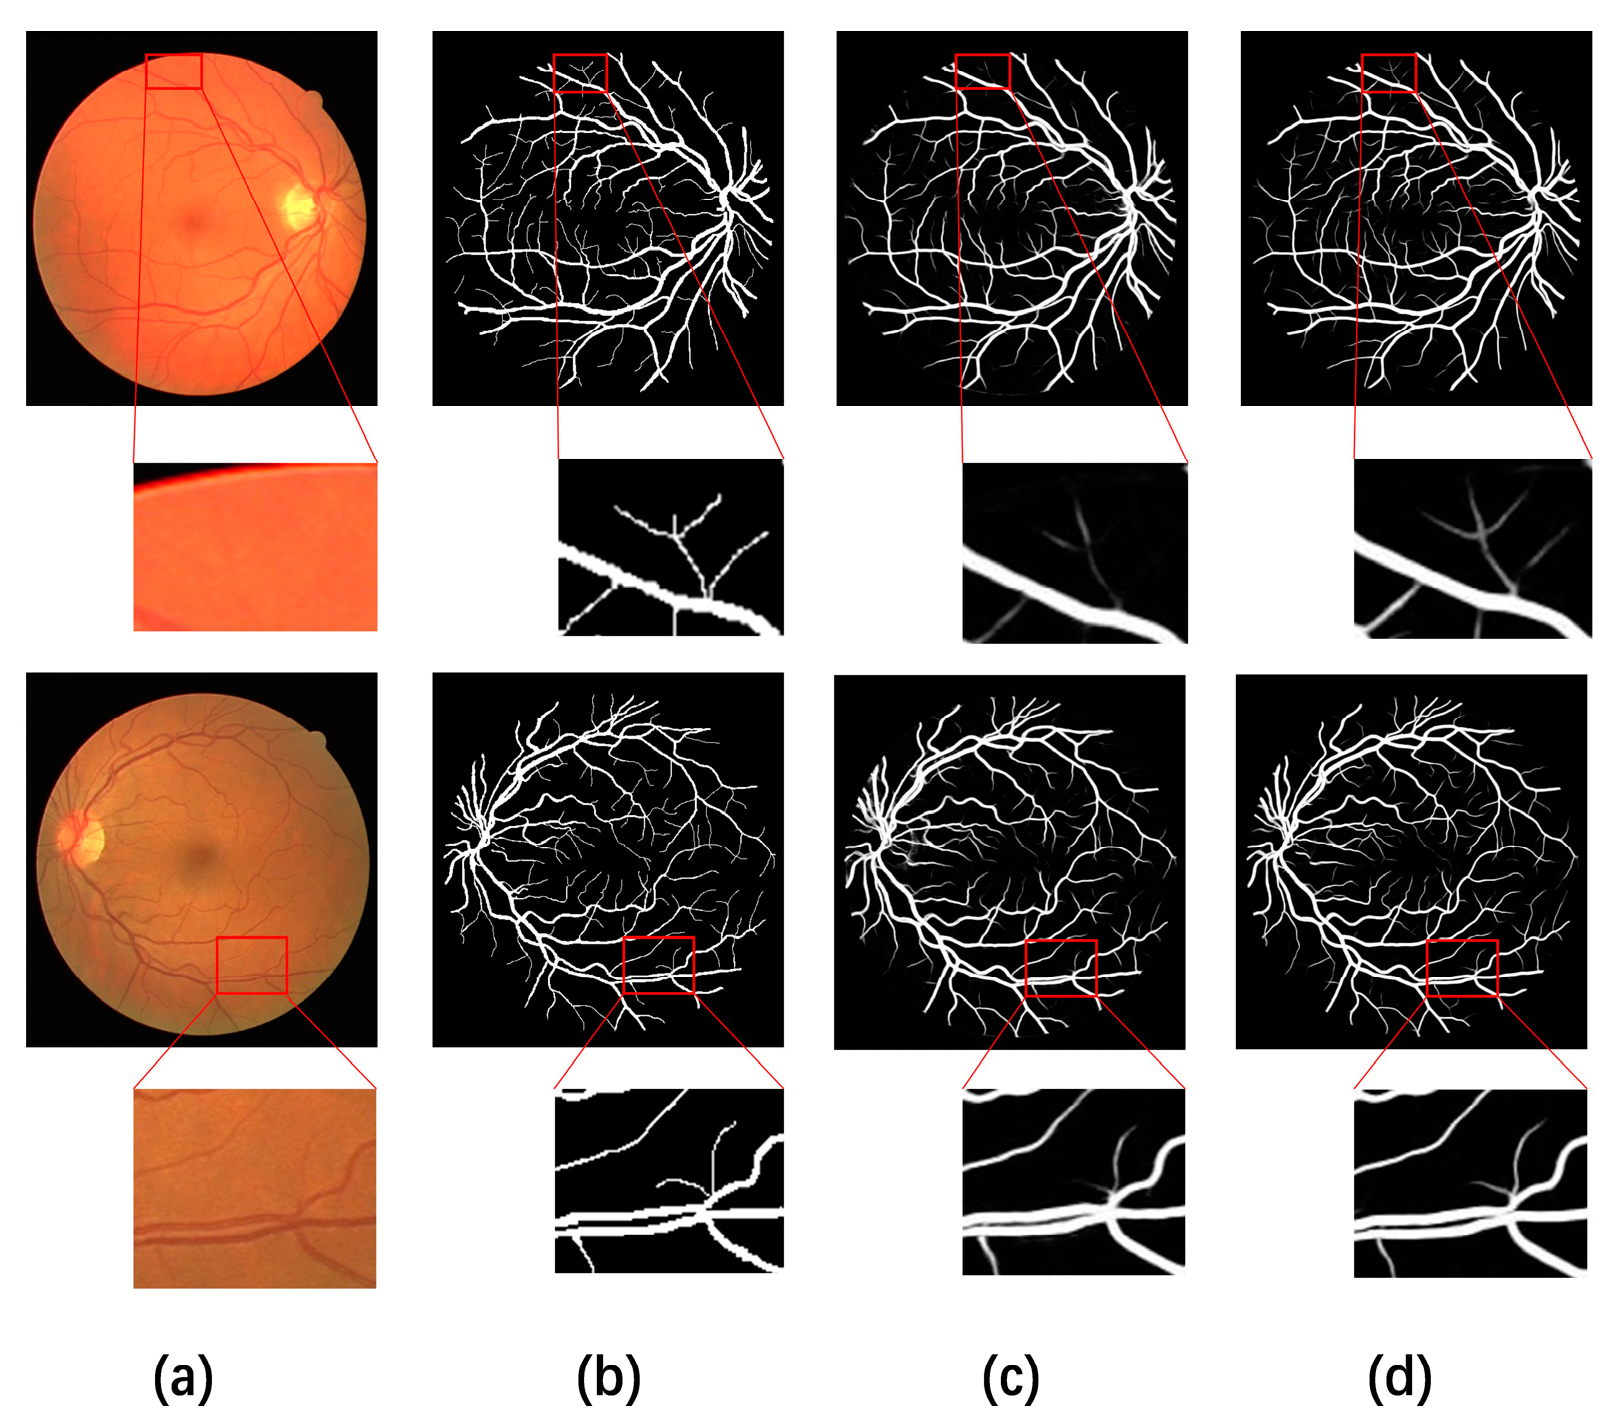
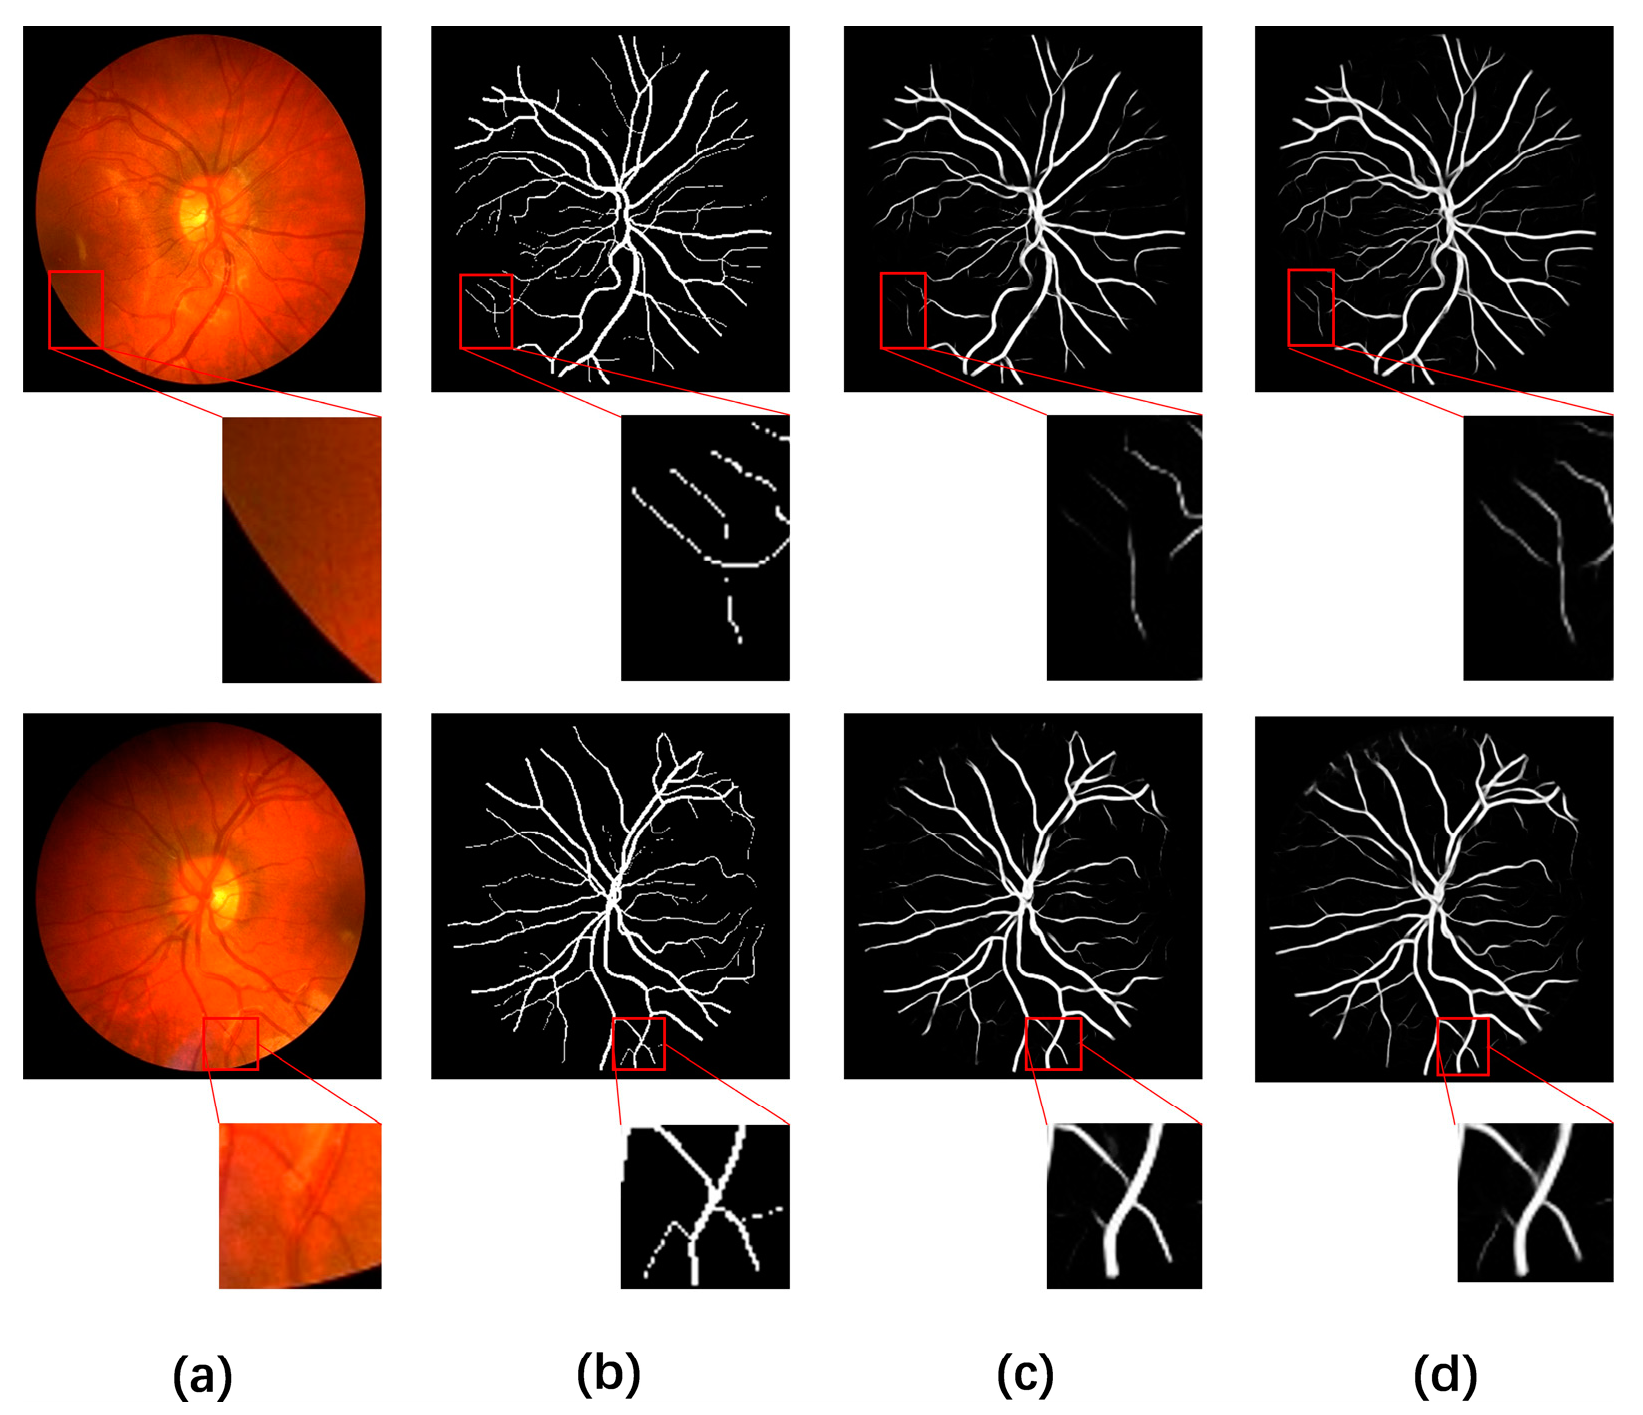
We compared MS-CANet with the U-Net and UNet++. Figure 6 and Figure 7 show the visualization results for the DRIVE dataset and the CHASE dataset, respectively. From the segmentation results in Figure 6, it can be seen that the retinal vessels segmented by U-Net had a large number of unsegmented edges relative to the ground truth, unclear edge segmentation, and blurred boundaries, among other problems. It can also be seen in Figure 7 that our proposed method had a clearer and more accurate segmentation of the retinal vessel endings than UNet++.
Our proposed method used a residual coordinate attention module for down-sampling, which preserved accurate location information while establishing long-range dependencies, and it better extracted the information of marginal tiny vessels. The parallel channel attention in up-sampling enabled the network to distinguish foreground and background regions well, resulting in more accurate segmentation results and containing less noise, especially in the vessel regions in the red box in the figure.

4.6. Robustness Testing

The acquisition methods for retinal images are different, and the three datasets used in the experiments were obtained using different methods. Therefore, there are often differences in illumination, noise, and other factors in clinical retinal images. To verify the generalization ability of MS-CANet on different datasets, we designed a multi-dataset cross-testing experiment. Cross-testing refers to training the model on one dataset and testing it on another. Table 10 displays the results of cross-testing on multiple datasets, with the vertical header indicating the dataset used for training and the horizontal header indicating the dataset used for testing.
From the results in Table 10, it can be seen that the F-measure of the model trained on the DRIVE dataset decreased by 29.01% and 5.63%, and the accuracy decreased by 1.68% and 0.36% when tested on the CHASE and STARE datasets, respectively. When the model trained on CHASE was tested on the other two data sets, F-measure decreased by 13.22% and 2.19%, and accuracy decreased by 1.34% and 0.66%, respectively. When the model trained on STARE was tested on the other two datasets, the F-measure decreased by 4.65% and 19.79%, and the accuracy decreased by 0.71% and 1.24%, respectively. From the results of the cross-test, the model trained on the DRIVE dataset had a larger drop in metric value during the cross-test, and fewer general features were extracted on the DRIVE dataset because the images are smaller and the differences between images are smaller. The models trained on the CHASE and STARE datasets had strong generalization ability because the CHASE dataset contains more feature information and the differences between images are larger. The overall difference between the STARE dataset images is relatively small, and a large amount of useful feature information can be extracted, but the difference in the lesion area is large.

5. Conclusions and Future Work

Retinal vessel segmentation is of great significance for the diagnosis and prediction of various ophthalmic diseases. We proposed the MS-CANet network to segment images of fundus retinal vessels. We designed a multi-scale subtraction unit to eliminate the redundancy of information between different levels. The long-range dependencies of spatial orientation were captured by adding the residual coordinate attention module while ensuring accurate location information. The parallel channel attention module we designed can effectively promote the recovery of tiny vessels at the edge during the up-sampling process, increase the difference between vessels and the background, and make the network more sensitive to the vessels. Finally, we validated our method on three standard retinal datasets.
Although our method achieved good performance, there are still some problems that need to be solved. We employed supervised learning, which requires a large number of labeled datasets, but large medically labeled datasets are expensive and not easy to obtain. In addition, we validated our network only on the retinal vessel segmentation task, which has some limitations. This is also a focus of our future work, applying our method to multiple medical image segmentation tasks.

Author Contributions

Data curation, J.C., H.Q., Z.Z. and M.W.; writing—original draft, W.Y.; writing—review and editing, Y.J. and W.Y. All authors have read and agreed to the published version of the manuscript.

Funding

This work was supported in part by the National Natural Science Foundation of China (61962054), in part by the National Natural Science Foundation of China (61163036), in part by the 2016 Gansu Provincial Science and Technology Plan Funded by the Natural Science Foundation of China (1606RJZA047), in part by the 2012 Gansu Provincial University Fundamental Research Fund for Special Research Funds; Gansu Province Postgraduate Supervisor Program in Colleges and Universities (1201-16), in part by the Northwest Normal University’s Third Phase of Knowledge and Innovation Engineering Research Backbone Project (nwnu-kjcxgc-03-67), and in part by the Cultivation plan of major Scientific Research Projects of Northwest Normal University (NWNU-LKZD2021-06).

Institutional Review Board Statement

Not applicable.

Informed Consent Statement

Not applicable.

Data Availability Statement

We used three publicly available retinal image datasets to evaluate the segmentation network proposed in this paper, namely the DRIVE dataset. (https://cecas.clemson.edu/~ahoover/stare/ accessed on 24 February 2021); the CHASE DB1 dataset. (https://blogs.kingston.ac.uk/retinal/chasedb1/ accessed on 24 February 2021); and the STARE dataset. (https://cvit.iiit.ac.in/projects/mip/drishti-gs/mip-dataset2/Home.php accessed on 24 February 2021).

Conflicts of Interest

The authors declare that they have no competing interest.

References

  1. Fong, D.S.; Aiello, L.; Gardner, T.W.; King, G.L.; Blankenship, G.; Cavallerano, J.D.; Ferris, F.L., III; Klein, R. Retinopathy in diabetes. Diabetes Care 2004, 27 (Suppl. S1), s84–s87. [Google Scholar] [CrossRef] [Green Version]
  2. Smart, T.J.; Richards, C.J.; Bhatnagar, R.; Pavesio, C.; Agrawal, R.; Jones, P.H. A study of red blood cell deformability in diabetic retinopathy using optical tweezers. Optical trapping and optical micromanipulation XII. Int. Soc. Opt. Photonics 2015, 9548, 954825. [Google Scholar]
  3. Yang, T.; Wu, T.; Li, L.; Zhu, C. SUD-GAN: Deep convolution generative adversarial network combined with short connection and dense block for retinal vessel segmentation. Digit. Imaging 2020, 33, 946–957. [Google Scholar] [CrossRef]
  4. Bankhead, P.; Scholfield, C.N.; McGeown, J.G.; Curtis, T.M. Fast retinal vessel detection and measurement using wavelets and edge location refinement. PLoS ONE 2012, 7, e32435. [Google Scholar] [CrossRef] [Green Version]
  5. Ricci, E.; Perfetti, R. Retinal blood vessel segmentation using line operators and support vector classification. IEEE Trans. Med. Imaging 2007, 26, 1357–1365. [Google Scholar] [CrossRef]
  6. Zhang, B.; Zhang, L.; Zhang, L.; Karray, F. Retinal vessel extraction by matched filter with first-order derivative of gaussian. Comput. Biol. Med. 2010, 40, 438–445. [Google Scholar] [CrossRef] [Green Version]
  7. Zhao, Q.H.; Li, X.L.; Li, Y.; Zhao, X.M. A fuzzy clustering image segmentation algorithm based on hidden Markov random field models and Voronoi tessellation. Pattern Recognit. Lett. 2017, 85, 49–55. [Google Scholar] [CrossRef]
  8. Filali, H.; Kalti, K. Image segmentation using MRF model optimized by a hybrid ACO-ICM algorithm. Soft Comput. 2021, 25, 10181–10204. [Google Scholar] [CrossRef]
  9. Vargas-Muñoz, J.E.; Chowdhury, A.S.; Alexandre, E.B.; Galvão, F.L.; Miranda PA, V.; Falcão, A.X. An iterative spanning forest framework for superpixel segmentation. IEEE Trans. Image Process. 2019, 28, 3477–3489. [Google Scholar] [CrossRef] [Green Version]
  10. Panagiotakis, C.; Papadakis, H.; Grinias, E.; Komodakis, N.; Fragopoulou, P.; Tziritas, G. Interactive image segmentation based on synthetic graph coordinates. Pattern Recognit. 2013, 46, 2940–2952. [Google Scholar] [CrossRef]
  11. Kucybała, I.; Tabor, Z.; Ciuk, S.; Chrzan, R.; Urbanik, A.; Wojciechowski, W. A fast graph-based algorithm for automated segmentation of subcutaneous and visceral adipose tissue in 3D abdominal computed tomography images. Biocybern. Biomed. Eng. 2020, 40, 729–739. [Google Scholar] [CrossRef]
  12. Trombini, M.; Solarna, D.; Moser, G.; Dellepiane, S. A goal-driven unsupervised image segmentation method combining graph-based processing and Markov random fields. Pattern Recognit. 2023, 134, 109082. [Google Scholar] [CrossRef]
  13. Ronneberger, O.; Fischer, P.; Brox, T. U-net: Convolutional networks for biomedical image segmentation. In Proceedings of the International Conference on Medical Image Computing and Computer-Assisted Intervention, Munich, Germany, 5–9 October 2015; Springer: Cham, Switzerland, 2015; pp. 234–241. [Google Scholar]
  14. Zhang, Y.; Chung, A.C.S. Deep supervision with additional labels for retinal vessel segmentation task. In Proceedings of the Medical Image Computing and Computer Assisted Intervention (MICCAI) 2018, Granada, Spain, 16–20 September 2018; Springer: Berlin/Heidelberg, Germany, 2018; pp. 83–91. [Google Scholar]
  15. He, Q.; Zou, B.; Zhu, C.; Liu, X.; Fu, H.; Wang, L. Multi-Label Classification Scheme Based on Local Regression for Retinal Vessel Segmentation. In Proceedings of the 2018 25th IEEE International Conference on Image Processing (ICIP) 2018, Athens, Greece, 7–10 October 2018; pp. 2765–2769. [Google Scholar] [CrossRef]
  16. Wu, Y.; Xia, Y.; Song, Y.; Zhang, Y.; Cai, W. Multiscale Network Followed Network Model for Retinal Vessel Segmentation. In Medical Image Computing and Computer Assisted Intervention (MICCAI) 2018; Springer: Cham, Switzerland, 2018; Volume 11071. [Google Scholar] [CrossRef]
  17. Wang, K.; Zhang, X.; Huang, S.; Wang, Q.; Chen, F. CTF-Net: Retinal Vessel Segmentation via Deep Coarse-To-Fine Supervision Network. In Proceedings of the 2020 IEEE 17th International Symposium on Biomedical Imaging (ISBI), Iowa City, IA, USA, 3–7 April 2020; pp. 1237–1241. [Google Scholar] [CrossRef]
  18. Wu, Y.; Xia, Y.; Song, Y.; Zhang, D.; Liu, D.; Zhang, C.; Cai, W. Vessel-Net: Retinal Vessel Segmentation Under Multi-path Supervision. In International Conference on Medical Image Computing and Computer-Assisted Intervention; Springer: Cham, Switzerland, 2019. [Google Scholar]
  19. Feng, S.; Zhuo, Z.; Pan, D.; Tian, Q. CcNet: A Cross-connected Convolutional Network for Segmenting Retinal Vessels Using Multi-scale Features. Neurocomputing 2019, 392, 268–276. [Google Scholar] [CrossRef]
  20. Karthik, R.; Menaka, R.; Hariharan, M.; Won, D. Ischemic lesion segmentation using ensemble of multi-scale region aligned CNN. Comput. Methods Programs Biomed. 2021, 200, 105831. [Google Scholar] [CrossRef]
  21. Yu, W.; Pi, D.; Xie, L.; Luo, Y. Multiscale Attentional Residual Neural Network Framework for Remaining Useful Life Prediction of Bearings. Measurement 2021, 177, 109310. [Google Scholar] [CrossRef]
  22. Wang, L.; Shen, J.; Tang, E.; Zheng, S.; Xu, L. Multi-scale attention network for image super-resolution. J. Vis. Commun. Image Represent. 2021, 80, 103300. [Google Scholar] [CrossRef]
  23. Kar, M.K.; Neog, D.R.; Nath, M.K. Retinal Vessel Segmentation Using Multi-Scale Residual Convolutional Neural Network (MSR-Net) Combined with Generative Adversarial Networks. Circuits Syst. Signal. Process. 2023, 42, 1206–1235. [Google Scholar] [CrossRef]
  24. Hou, Q.; Zhou, D.; Feng, J. Coordinate Attention for Efficient Mobile Network Design. In Proceedings of the IEEE/CVF Conference on Computer Vision and Pattern Recognition, Nashville, TN, USA, 20–25 June 2021. [Google Scholar]
  25. Zhao, X.; Zhang, L.; Lu, H. Automatic Polyp Segmentation via Multi-scale Subtraction Network. In Medical Image Computing and Computer Assisted Intervention (MICCAI) 2021; Springer: Cham, Switzerland, 2021. [Google Scholar] [CrossRef]
  26. Staal, J.; Abràmoff, M.D.; Niemeijer, M.; Viergever, M.A.; Ginneken, B. Ridge-based vessel segmentation in color images of theretina. IEEE Trans. Med. Imaging 2004, 23, 501–509. [Google Scholar] [CrossRef]
  27. Owen, C.G.; Rudnicka, A.R.; Mullen, R.; Barman, S.A.; Monekosso, D.; Whincup, P.H.; Ng, J.; Paterson, C. Measuring retinal vessel tortuosity in 10-year-old children: Validation of the computer-assisted image analysis of the retina (CAIAR) program. Investig. Ophthalmol. Vis. Sci. 2009, 50, 2004–2010. [Google Scholar] [CrossRef] [Green Version]
  28. Hoover, A.D.; Kouznetsova, V.; Goldbaum, M. Locating blood vessels in retinal images by piecewise threshold probing of a matched filter response. IEEE Trans. Med. Imaging 2000, 19, 203–210. [Google Scholar] [CrossRef] [Green Version]
  29. Wang, Q.; Wu, B.; Zhu, P.; Li, P.; Zuo, W.; Hu, Q. ECA-Net: Efficient Channel Attention for Deep Convolutional Neural Networks. In Proceedings of the IEEE/CVF Conference on Computer Vision and Pattern Recognition (CVPR), Seattle, WA, USA, 14–19 June 2020. [Google Scholar]
  30. Woo, S.; Park, J.; Lee, J.Y.; Kweon, I.S. CBAM: Convolutional Block Attention Module. ECCV 2018. Lecture Notes in Computer Science; Ferrari, V., Hebert, M., Sminchisescu, C., Weiss, Y., Eds.; Springer: Cham, Switzerland, 2018; Volume 11211. [Google Scholar] [CrossRef] [Green Version]
  31. Hu, J.; Shen, L.; Sun, G. Squeeze-and-Excitation Networks. In Proceedings of the IEEE Conference on Computer Vision and Pattern Recognition (CVPR), Salt Lake City, UT, USA, 18–23 June 2018; pp. 7132–7141. [Google Scholar]
  32. Zhou, Z.; Siddiquee, M.M.R.; Tajbakhsh, N.; Liang, J. Unet++: Redesigning skip connections to exploit multi-scale features in image segmentation. IEEE Trans. Med. Imaging 2019, 39, 1856–1867. [Google Scholar] [CrossRef] [Green Version]
  33. Alom, M.Z.; Hasan, M.; Yakopcic, C.; Taha, T.M.; Asari, V.K. Recurrent residual convolutional neural network based on u-net(r2u-net) for medical image segmentation. arXiv 2018, arXiv:1802.06955. [Google Scholar]
  34. Mou, L.; Zhao, Y.; Chen, L.; Cheng, J.; Gu, Z.; Hao, H.; Qi, H.; Zheng, Y.; Frangi, A.; Liu, J. CS-Net: Channel and spatial attention network for curvilinear structure segmentation. In International Conference on Medical Image Computing and Computer-Assisted Intervention; Springer: Cham, Switzerland, 2019; pp. 721–730. [Google Scholar]
  35. Jiang, Y.; Tan, N.; Peng, T.; Zhang, H. Retinal vessels segmentation based on dilated multi-scale convolutional neural network. IEEE Access 2019, 7, 76342–76352. [Google Scholar] [CrossRef]
  36. Lv, Y.; Ma, H.; Li, J.; Liu, S. Attention Guided U-Net With Atrous Convolution for Accurate Retinal Vessels Segmentation. IEEE Access 2020, 8, 32826–32839. [Google Scholar] [CrossRef]
  37. Khan, T.M.; Alhussein, M.; Aurangzeb, K.; Arsalan, M.; Naqvi, S.S.; Nawaz, S.J. Residual Connection-Based Encoder Decoder Network (RCED-Net) for Retinal Vessel Segmentation. IEEE Access 2020, 8, 131257–131272. [Google Scholar] [CrossRef]
  38. Jiang, Y.; Yao, H.; Wu, C.; Liu, W. A Multi-Scale Residual Attention Network for Retinal Vessel Segmentation. Symmetry 2020, 13, 24. [Google Scholar] [CrossRef]
  39. Jiang, Y.; Wu, C.; Wang, G.; Yao, H.X.; Liu, W.H. MFI-Net: A multi-resolution fusion input network for retinal vessel segmentation. PLoS ONE 2021, 16, e0253056. [Google Scholar] [CrossRef]
  40. Arsalan, M.; Haider, A.; Lee, Y.W.; Park, K.R. Detecting retinal vasculature as a key biomarker for deep Learning-based intelligent screening and analysis of diabetic and hypertensive retinopathy. Expert Syst. Appl. 2022, 200, 117009. [Google Scholar] [CrossRef]
  41. Jin, Q.; Meng, Z.; Pham, T.D.; Chen, Q.; Wei, L.; Su, R. DUNet: A deformable network for retinal vessel segmentation. Knowl-Edge-Based Syst. 2019, 178, 149–162. [Google Scholar] [CrossRef] [Green Version]
  42. Laibacher, T.; Weyde, T.; Jalali, S. M2u-net: Effective and efficient retinal vessel segmentation for real world applications. In Proceedings of the IEEE/CVF Conference on Computer Vision and Pattern Recognition Workshops, Virtual Conference, 19–25 June 2019. [Google Scholar]
Figure 1. The structure of MS-CANet.
Symmetry 15 00835 g001
Figure 2. The structure of the residual coordinate attention module.
Symmetry 15 00835 g002
Figure 3. The structure of the residual coordinate attention module.
Symmetry 15 00835 g003
Figure 4. Visualization of ablation experiment on the DRIVE dataset. (a) Original image, (b) Ground Truth, (c) BackBone, (d) BackBone/RCA, (e) BackBone/PCA, and (f) BackBone/RCA/PCA.
Symmetry 15 00835 g004
Figure 5. Visualization of ablation experiment on the CHASE dataset. (a) Original image, (b) Ground Truth, (c) BackBone, (d) BackBone/RCA, (e) BackBone/PCA, and (f) BackBone/RCA/PCA.
Symmetry 15 00835 g005
Figure 6. Visual comparison of segmentation results on the DRIVE dataset. (a) Original Image, (b) Ground Truth, (c) U-Net, and (d) Ours.
Symmetry 15 00835 g006
Figure 7. Visual comparison of segmentation results on the CHASE dataset. (a) Original Image, (b) Ground Truth, (c) U-Net++, and (d) Ours.
Symmetry 15 00835 g007
Table 1. Comparisons of structure ablation experiments on the DRIVE dataset.
MethodAccuracySensitivitySpecificityF-Measure
BackBone0.97010.81840.98740.8288
BackBone/RCA0.97060.84790.98460.8352
BackBone/PCA0.97100.83650.98640.8355
BackBone/RCA/PCA0.97090.84320.98320.8389
Table 2. Comparisons of structure ablation experiments on the CHASE dataset.
MethodAccuracySensitivitySpecificityF-Measure
BackBone0.97680.80030.98770.8015
BackBone/RCA0.97720.81480.98850.8132
BackBone/PCA0.97690.81630.98880.8128
BackBone/RCA/PCA0.97820.83060.98660.8171
Table 3. Comparisons of ROC and PR curves for structure ablation experiments on DRIVE and CHASE datasets.
MethodDRIVECHASE
ROCPRROCPR
BackBone0.98860.93730.98740.8892
BackBone/RCA0.98850.93830.98800.8927
BackBone/PCA0.98910.94050.98760.8895
BackBone/RCA/PCA0.99030.94410.98970.8977
Table 4. Experimental results of different attention modules on the DRIVE dataset.
MethodAccuracySensitivitySpecificityF-MeasureROCPR
Baseline/ECA0.96970.86130.98210.83350.98830.9367
Baseline/CBAM0.96900.79120.98920.81940.98810.9347
Baseline/SE0.97130.83030.98730.83560.98950.9418
Baseline/PCA0.97090.84320.98320.83890.99030.9441
Table 5. Experimental results of different attention modules on the CHASE dataset.
MethodAccuracySensitivitySpecificityF-MeasureROCPR
Baseline/ECA0.97490.77180.98860.79530.98860.8726
Baseline/CBAM0.97120.60760.99570.72720.98850.8209
Baseline/SE0.97510.80960.98620.80380.98860.8819
Baseline/PCA0.97820.83060.98660.81710.98970.8977
Table 6. Comparison of proposed methods with other methods in the DRIVE database.
MethodYearF-MeasureAccuracySensitivitySpecificity
UNet++ [32]20180.83020.97010.81200.9861
R2U-Net [33]20180.81710.95560.77920.9813
CSNet [34]2019-0.96320.81700.9854
Vessel-Net [18]2019-0.95780.80380.9802
D-Net [35]20190.82460.97090.78390.9890
CTF-Net [17]20200.82410.95670.78490.9813
AA-UNet [36]20200.82160.9558--
RCED-Net [37]2021-0.96490.82520.9787
MRA-UNet [38]20210.82930.96980.83530.9828
MFI-Net [39]20210.83180.97080.83250.9838
PLRS-Net [40]2022-0.96820.82690.9817
Ours20220.83890.97090.84320.9832
Table 7. Comparison of proposed methods with other methods in the CHASE database.
MethodYearF-MeasureAccuracySensitivitySpecificity
UNet++ [32]20180.81390.97600.81840.9810
R2U-Net [33]20180.79280.96340.77560.9820
Vessel-Net [18]2019-0.96610.81320.9814
D-Net [35]20190.80620.97210.78390.9894
D-UNet [41]20190.78830.9610--
M2UNet [42]2019-0.9703--
AA-UNet [36]20200.78920.9608--
RCED-Net [37]2021-0.97720.84400.8440
MRA-UNet [38]20210.81270.97580.83240.9854
MFI-Net [39]20210.81500.97620.83090.9860
PLRS-Net [40]2022-0.97310.83010.9893
Ours20220.81710.97820.83060.9866
Table 8. Comparison of proposed methods with other methods in the STARE database.
MethodYearF-MeasureAccuracySensitivitySpecificity
UNet++ [32]20180.83930.97530.86460.9843
R2U-Net [33]20180.84750.97120.82980.9862
CSNet [34]2019-0.97520.88160.9840
D-UNet [41]20190.81430.9641--
AA-UNet [36]20200.81420.9640--
RCED-Net [37]2021-0.96590.83970.9792
MRA-UNet [38]20210.84220.97630.84220.9873
MFI-Net [39]20210.84830.97660.86190.9859
PLRS-Net [40]2022-0.97150.86350.9803
Ours20220.85000.97720.86450.9863
Table 9. Results of the leave-one-out method in the STARE database.
ImageAccuracySensitivitySpecificityF-MeasureROCPR
10.97710.82340.98810.82780.98830.9096
20.97990.87930.98630.84010.99390.9320
30.98030.87540.98700.84220.99350.9308
40.96510.81690.97980.80880.98690.8965
50.97450.90120.98000.83150.99290.9273
60.97900.90640.98540.87410.99470.9483
70.97910.84520.98990.85810.99350.9404
80.98430.89680.99180.90010.99700.9695
90.97650.84070.98840.85210.99310.9365
100.98060.87610.98860.86570.99510.9467
110.98160.94250.98490.88820.99670.9645
120.97960.89760.98760.88690.99550.9607
130.97900.89480.98740.88550.99500.9600
140.97760.87170.98760.87070.99380.9459
150.96500.84040.97910.83070.98590.9136
160.97610.87010.98650.86710.99340.9466
170.98500.86230.99150.85370.99300.9311
180.98380.80870.99170.81190.99250.8990
190.97010.81290.98130.78430.98750.8651
200.97130.82840.98370.82190.98910.9078
Average0.97720.86450.98630.85000.99250.9315
Table 10. Cross-test results.
F-Measure Accuracy
DRIVECHASESTAREDRIVECHASESTARE
DRIVE0.83890.54820.78260.97090.95410.9673
CHASE0.68490.81710.79520.96480.97820.9716
STARE0.80350.65210.85000.97010.96480.9772
Disclaimer/Publisher’s Note: The statements, opinions and data contained in all publications are solely those of the individual author(s) and contributor(s) and not of MDPI and/or the editor(s). MDPI and/or the editor(s) disclaim responsibility for any injury to people or property resulting from any ideas, methods, instructions or products referred to in the content.