Article

Guided Wave-Based Damage Detection of Square Steel Tubes Utilizing Structure Symmetry

1
Key Lab of Smart Prevention and Mitigation of Civil Engineering Disasters of the Ministry of Industry and Information Technology, Harbin Institute of Technology, Harbin 150090, China
2
Key Lab of Structures Dynamic Behavior and Control of the Ministry of Education, Harbin Institute of Technology, Harbin 150090, China
3
School of Civil Engineering, Harbin Institute of Technology, Harbin 150090, China
*
Author to whom correspondence should be addressed.
Symmetry 2023, 15(4), 805; https://doi.org/10.3390/sym15040805
Submission received: 7 February 2023 / Revised: 12 March 2023 / Accepted: 24 March 2023 / Published: 26 March 2023
(This article belongs to the Special Issue Symmetry in Structural Health Monitoring II)

Abstract

:
Square steel tube, which is widely used in civil engineering, can suffer from a wide variety of damages and aging defects, thus its nondestructive testing (NDT) has attracted wide attention. This work proposes an ultrasonic guided wave (UGW)-based damage detection method for square steel tubes using structure symmetry. Firstly, the dispersion characteristics of square steel tubes are obtained using the semi-analytical finite element (SAFE) method, after which the optimal guided wave modes for damage located on the long and short edges of the steel tube are selected by modal analysis. Then, using the symmetry of the square steel tube’s section, the symmetric layout scheme of the transmitters and the receivers is designed; on this basis, a signal processing strategy for damage detection is proposed by subtracting the receiving signals obtained from symmetric positions. Finally, the effectiveness of the proposed damage detection method is verified by numerical simulations and laboratory experiments. The results show that the proposed method has good inspection accuracy for crack and hole damages on both the long and short edges of square steel tube because the dispersion effect and clutters can be reduced utilizing structure symmetry. It is worth mentioning that the inspection effect for corner holes can be enhanced by modifying the position of the receivers.

1. Introduction

Square steel tube is a kind of hollow steel member with superior bearing capacity [1]. It has been widely used in buildings and machines in civil engineering, such as in the steel square column shown in Figure 1. However, in practical engineering, as a kind of steel structure, cracks, corrosion, holes, and other damages will inevitably occur in square steel tube. Furthermore, these structural members are often used in hidden areas, and thus the damage is hard to notice via visual or traditional inspection methods. Therefore, it is of great significance to inspect square steel tube regularly using an appropriate damage detection method to ensure the safety performance of a structure.
Ultrasonic guided wave (UGW) is a kind of ultrasonic wave that can propagate in structural members with finite boundaries, such as thin plates [2,3,4,5,6,7,8,9], tubes [10,11,12,13,14,15,16], bars [17], other member types [18,19,20]. When encountering small defects or damages in structures, wave scattering and reflection will occur. Therefore, analyzing the characteristics of the received waves can identify the minor defects or damages present in the structure. In the early research stage, Rose et al. [21,22] deeply investigated the propagation of guided waves in plates, round rods, tubes, composite materials and multi-layer media, which laid a solid theoretical foundation for the application of UGW in NDT. In recent years, scholars have made many advances in the field of damage detection based on UGW, especially for structures with complex geometry. Geetha et al. [23] conducted an experimental study on the interaction of UGWs with delamination in the web–flange interface of a co-cured, co-bonded composite T-joint. Serey et al. [24] developed a methodology for the selective generation of modes in the harmonic regime for rectangular bars. Zhang et al. [25] presented the excitation and propagation of guided waves in arbitrary cross-section structures by coupling the normal mode expansion (NME) method with the SAFE method, and then the well-established method was used to develop a double mode inspection strategy for multi-damage identification. Tu et al. [26] investigated the feasibility and effectiveness of the guided wave-based technique for the damage assessment of a welded I-beam under various environments using the PCA and ICA methods. With regard to the damage detection of square steel tubes using UGWs, Wan [1] investigated frequency dispersion characteristics and selected the appropriate guided wave mode to inspect through-hole and slot damages.
Although guided wave detection technology can detect at a wider range and longer distance than traditional methods, there are still some limitations in actual engineering applications due to the influence of structural shapes and boundaries. For example, when the guided wave propagates in the structure of angle steel, I-beam steel, square steel tube and other irregular cross-sections, the propagation paths become more complex when coupled with the multi-mode property of the guided wave, which produces a lot of clutter in the received signals. This leads to a reduction in the accuracy of structural defect identification and location. At present, to achieve optimal excitation and a reception effect of guided waves, researchers mainly adopt a circumferential full-distribution layout of piezoelectric transducers [1,27] or design active transducer networks, but this is hard to apply in actual engineering due to the requirement for a large number of piezoelectric transducers.
In some cases, the utilization of structural symmetry can help solve many potential problems in damage identification [28,29,30]. Similarly, in order to reduce the influence of dispersion, this paper proposes a guided wave-based damage detection method of square steel tubes using structure symmetry. When a unilateral part of the square steel tube is damaged, the symmetric position can be considered as a reference. By means of subtraction calculation or correlation analysis between the receiving signals from a sensor in a symmetrical position, the influence of clutter in the signal can be reduced, and the damage location and degree can be obtained more easily. Its advantages are mainly reflected in the following aspects, which is of great significance for the development of damage detection in steel components: (1) The method is applied to the component with a symmetrical cross-section, which has less influence on the boundary conditions; (2) Symmetry detection may require fewer sensors, because the inspection process can be achieved by arranging an exciter and a receiver, respectively, in the region to be detected and its symmetrical position. (3) The detection efficiency of the method is improved, because it does not need the undamaged signal as a reference, and each detection area only needs to be operated once. (4) The damage location calculation process is relatively simple and does not require complex data processing, which reduces the calculation cost.
The framework of this paper is as follows: in Section 2, the process of the damage identification method using structural symmetry is proposed; then, the feasibility of the proposed method is verified by numerical simulation and experiments in Section 3 and Section 4; finally, conclusions are drawn in Section 5.

2. Propagation Characteristics and Symmetry Analysis of Guided Waves in Square Steel Tube

2.1. Dispersion Characteristics Analysis Based on SAFE Method

For structures with a regular cross-section, such as flat plates, circular rods, and circular tubes, dispersion curves are usually obtained by solving the frequency characteristic equation. However, it is very difficult to establish an analytical dispersion equation for complex waveguide sections. With regard to this problem, the SAFE method was employed [31,32,33] to calculate the guided wave characteristics of the complex waveguide section by section discretization and simulating waveguide vibration using simple harmonics. In this paper, the SAFE method is used to derive the dispersion curves of the square steel tube.
According to the Hamiltonian principle, system energy can be expressed by a discrete finite element, and then the general homogeneous wave equation of a square steel tube section can be obtained:
[ K 1 + i ξ K 2 + ξ 2 K 3 ω 2 M ] N U = 0
where K1, K2 and K3 are the different stiffness matrices, M is the mass matrix, the subscript N is the number of degrees of freedom, and U is the nodal displacement vector. In the above equation, there are two unknown variables: wave number ξ and circular frequency ω. With a given circular frequency, the real solution ξRe of finite wave numbers can be obtained by solving the eigenvalues of the equation. Equation (1) can be rewritten as:
[ A ξ B ] 2 N Q = 0
where,
A = [ 0 K 1 ω 2 M K 1 ω 2 M K 2 ] , B = [ K 1 ω 2 M 0 0 K 3 ] , Q = [   U ^ ξ U ^ ]
Then, the phase velocity and group velocity of the mth mode can be further obtained by using the following equations:
c p = ω ξ Re
c g = ω ξ = U ^ L T ( K ^ 2 + 2 ξ K 3 ) U ^ R 2 ω U ^ L T M U ^ R
In this paper, a square steel tube with a cross-section of 50 mm in length, 100 mm in width and 4 mm in wall thickness is utilized to demonstrate the proposed method. The density, elastic modulus, and Poisson’s ratio are 7850 kg/m3, 205 GPa, and 0.28, respectively. The cross-section of the square steel tube is discretized into 426 triangular elements and 324 nodes, as shown in Figure 2.
Based on the above SAFE method, the dispersion curves of the guided wave propagating in the square steel tube at a frequency ranging from 0 to 100 kHz are obtained, as shown in Figure 3. It can be seen that dense multi modes exist at the same frequency, and as a consequence, different modes of guided waves will overlap and interfere with each other in the process of propagating along the structure. In the following damage detection procedure, the lower order mode would be selected preferentially to ensure that the following requirements are satisfied: (1) sufficient energy is concentrated in the damage detection area; (2) the group velocity changes slowly; (3) the guided waves can spread stably in the square steel tube.
Taking the frequency of 60 kHz as an example, the wave structures of the 1st, 2nd, 5th and 6th modes obtained from 38 corresponding modes are shown in Figure 4. For the square steel tube, the damages occur mainly on two surfaces, which consist of the long edge and short edge, respectively. It can be seen from Figure 4 that for the 1st and 2nd modes, the modal vibration is mainly distributed on the long edge, whereas for the 5th and 6th modes, the modal vibration is concentrated on the short edge. Therefore, these four modes are selected as the expected modes for inspecting the damages in long and short edges, respectively.
According to the existing research [26,34], the generation of guided wave mode is related to excitation in that the desired mode can be excited effectively if the position and direction of excitation signals are the same as the direction of desired mode. Therefore, the midpoint of the long edge and the midpart of the short edge are selected as the best excitation points to conduct guided wave excitation in the vertical direction perpendicular to the detected area.

2.2. Symmetry Analysis for Guided Waves in Square Steel Tube

Assuming waves propagate in x-direction and the cross-section of a square tube is y-z plane, the NME method [22,25] is adopted. The main advantage of the NME method is that the parameters, which affect the amplitudes of the excitation of certain modes, can be solved directly and expressed in terms of the physical properties of the modes and the sources that produce them. In this way, the structural surface stress field can be written as:
T = T ( x , y , z , t ) = n α n ( x ) T n ( y , z ) e j ω t
where T and Tn(y, z) denote the actual stress field and the stress field of the nth mode, and αn(x) is the combination coefficient for the nth mode which depends on the specific excitation situation.
Accordingly, if only unilateral excitation is carried out, as shown in Figure 5, the received signals can be expressed in the following forms:
S 1 A = S 1 A ( x , y , z , t ) = n α n A ( x ) S n ( y 1 , z 1 ) e j ω t
S 2 A = S 2 A ( x , y , z , t ) = n α n A ( x ) S n ( y 2 , z 2 ) e j ω t
where S denotes the received guided wave signal, and the superscript 1, 2 refer to the receiving piezoelectric wafers on A, B side, and 1A, 2A represent that the excitation position is on the surface A and the receiving sensors are 1, 2, respectively.
If a defect occurs on surface A, then the received signals on each side can be obtained:
S 1 totA = n [ α n A ( x ) + α n A d ( x ) ] S n ( y 1 , z 1 ) e j ω t
S 2 totA = n [ α n A ( x ) + α n A d ( x ) ] S n ( y 2 , z 2 ) e j ω t
where the superscript Ad denotes the defect that occurs on surface A.
By subtracting the above two equations, we can obtain the different signal:
Δ S totA = n [ α n A ( x ) + α n A d ( x ) ] [ S n ( y 1 , z 1 ) S n ( y 2 , z 2 ) ] e j ω t
It can be obviously seen from Equations (9)–(11) that the received signals under a unilateral excitation condition contain the initial signal and the defect reflected signal; therefore, the damage features might be covered and difficult to extract due to the influence of the dispersion phenomenon and boundary reflections. Thus, a symmetric excitation scheme is designed, as shown in Figure 6, and then the symmetric received signals can be obtained:
S 1 s = S 2 s = S 1 A + S 2 A = n α n A ( x ) [ S n ( y 1 , z 1 ) + S n ( y 2 , z 2 ) ] e j ω t
where the superscript s denotes symmetric excitation.
Similarly, if a defect occurs on surface A, then the received signals on each side under symmetric excitation can be obtained as follows:
S 1 tots = S 1 s + S 1 A d = S 1 s + n α n A d ( x ) S n ( y 1 , z 1 ) e j ω t
S 2 tots = S 2 s + S 2 A d = S 2 s + n α n A d ( x ) S n ( y 2 , z 2 ) e j ω t
By subtracting the above two equations, we can obtain the different signal:
Δ S tots = n α n A d ( x ) [ S n ( y 1 , z 1 ) S n ( y 2 , z 2 ) ] e j ω t
Compared with Equation (11), we found that the latter strategy helped eliminate the influence of the initial signals and retained the damage features only. In this manner, the frequency dispersion and boundary limit can be reduced to a low level, thus the symmetric excitation scheme and the following signal processing operation are appropriate for the damage detection of the square steel tube, and also for structures with symmetric sections.

2.3. The Procedure of the Damage Detection Method

The main principle of the proposed damage detection method is differing the response wave signal received at the symmetric position to reduce the impact of clutter, so as to extract the damage information in the signal more directly and accurately. The main steps can be described as follows:
Step 1: Analyze the dispersion characteristics of square steel tube members based on the SAFE method and select the ideal mode according to the analysis results.
Step 2: Design the symmetrical excitation and reception layout according to the tested section so that the UGW signal propagation paths in the component are symmetrical about the central axis of the section.
Step 3: Judge whether the signals received on the two symmetric UGW signal propagation paths are the same. If so, it is proved that there is no damage on the propagation path of the UGW signal; if not, it means that there is damage on one of the propagation paths of the UGW signal. For further judging of the propagation path containing damage, the second symmetric path needs to be considered.
Step 4: If damage is found, calculate the difference between the signals received on the two paths, and then analyze the correlation between the difference signal and the initial signal. The propagation path of the initial signal with high correlation with the difference signal can be judged as damaged.
Step 5: According to the difference signal, the distance from the end to the damage position can be calculated from the group velocity and the estimated time of arrival (ToA) of waves as
d = 1 2 C g m ( T E T D )
where d refers to the distance between the defect and the receiving sensor, C g m is the group velocity of mth mode, TD is ToA of the initial wave, and TE is ToA of the damage reflected wave.

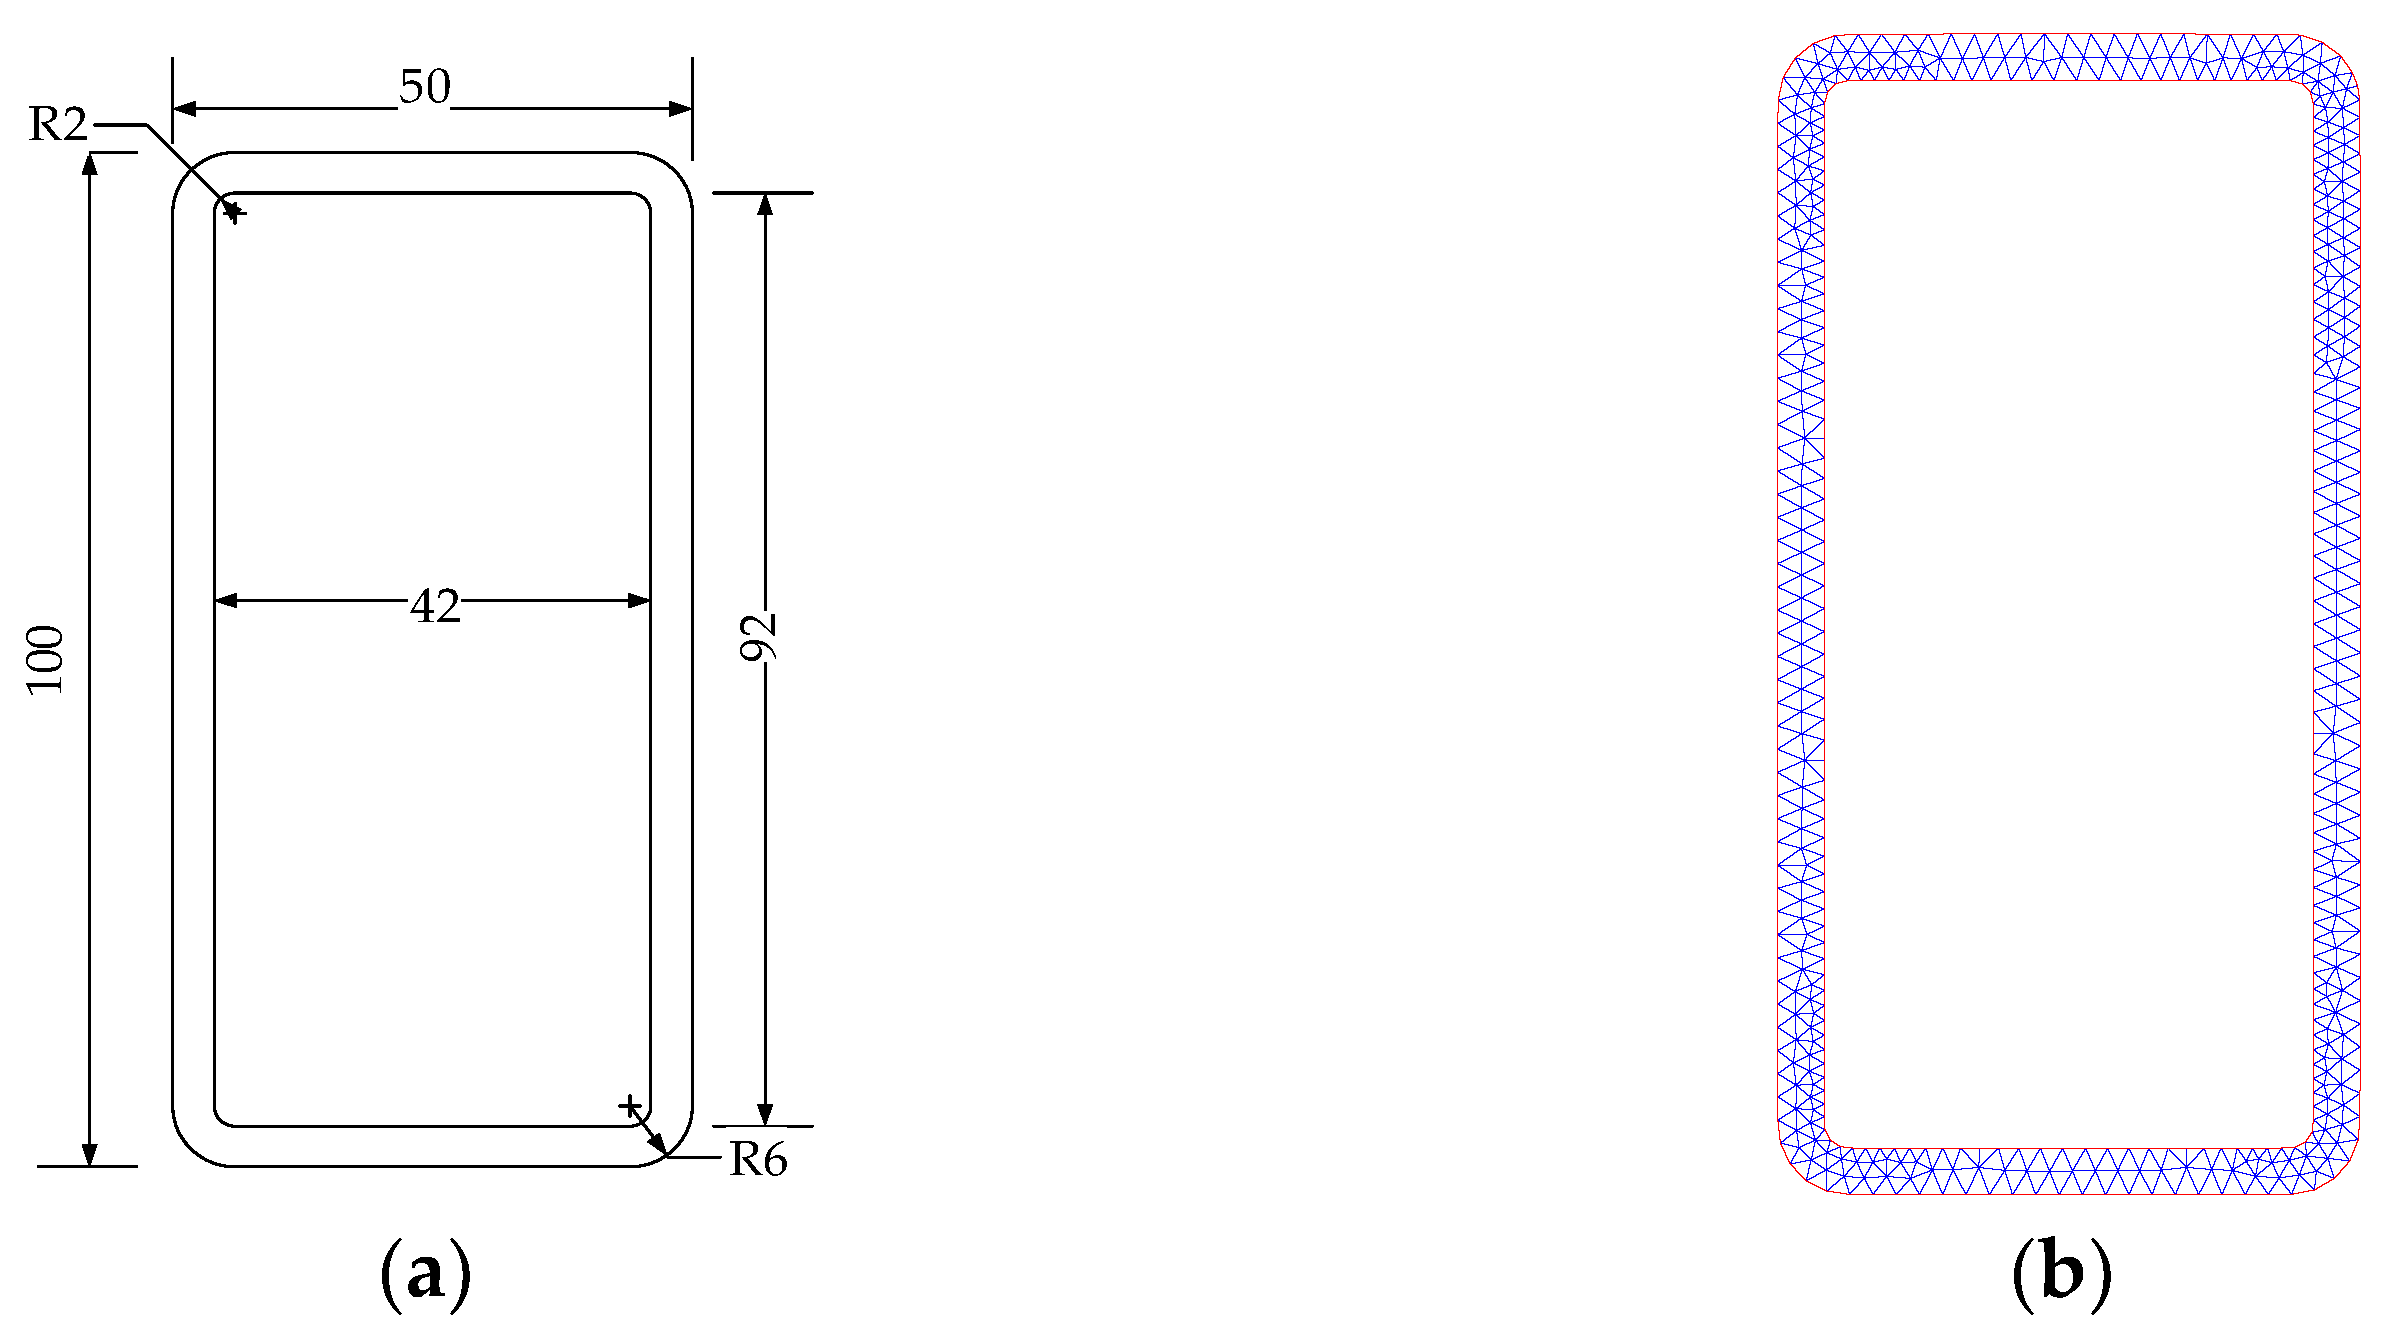
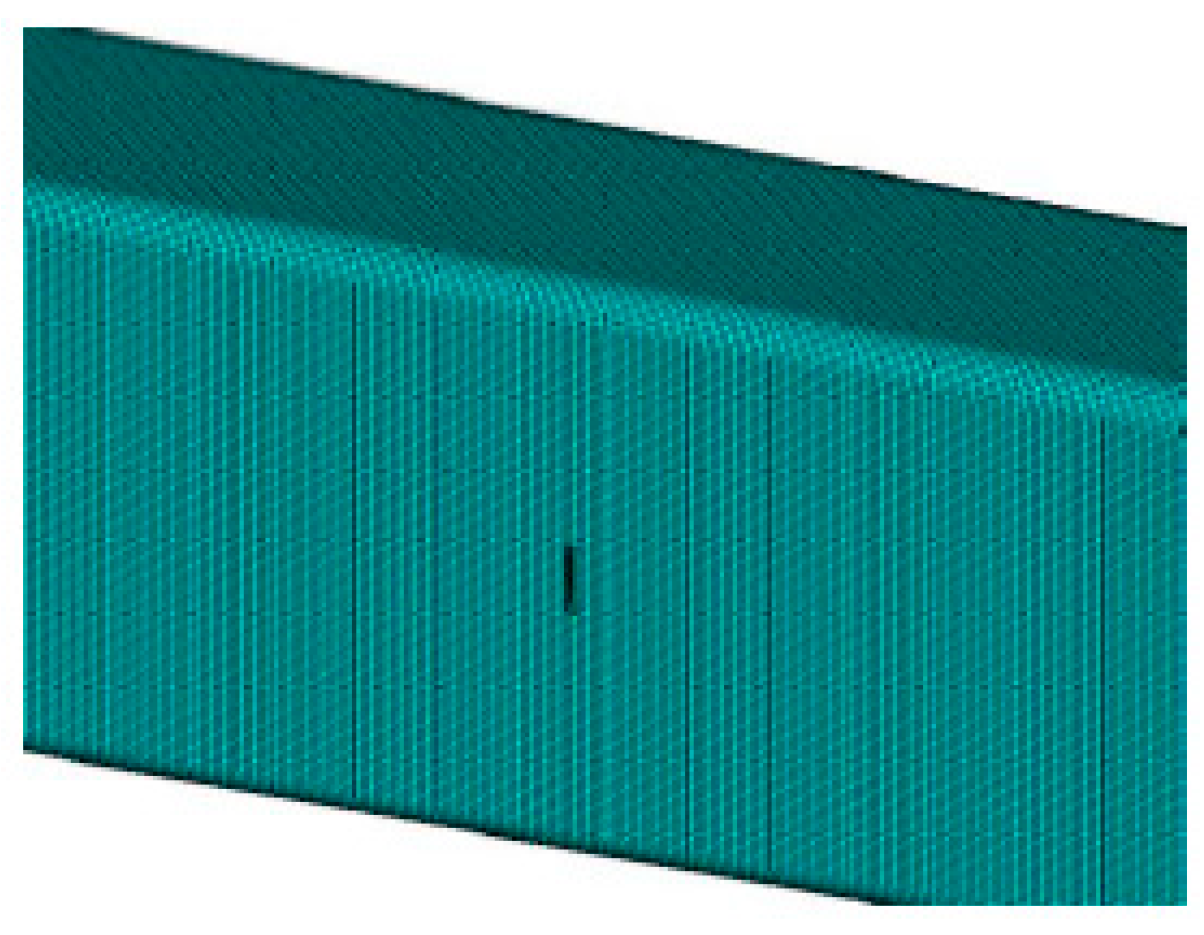
3. Numerical Simulation

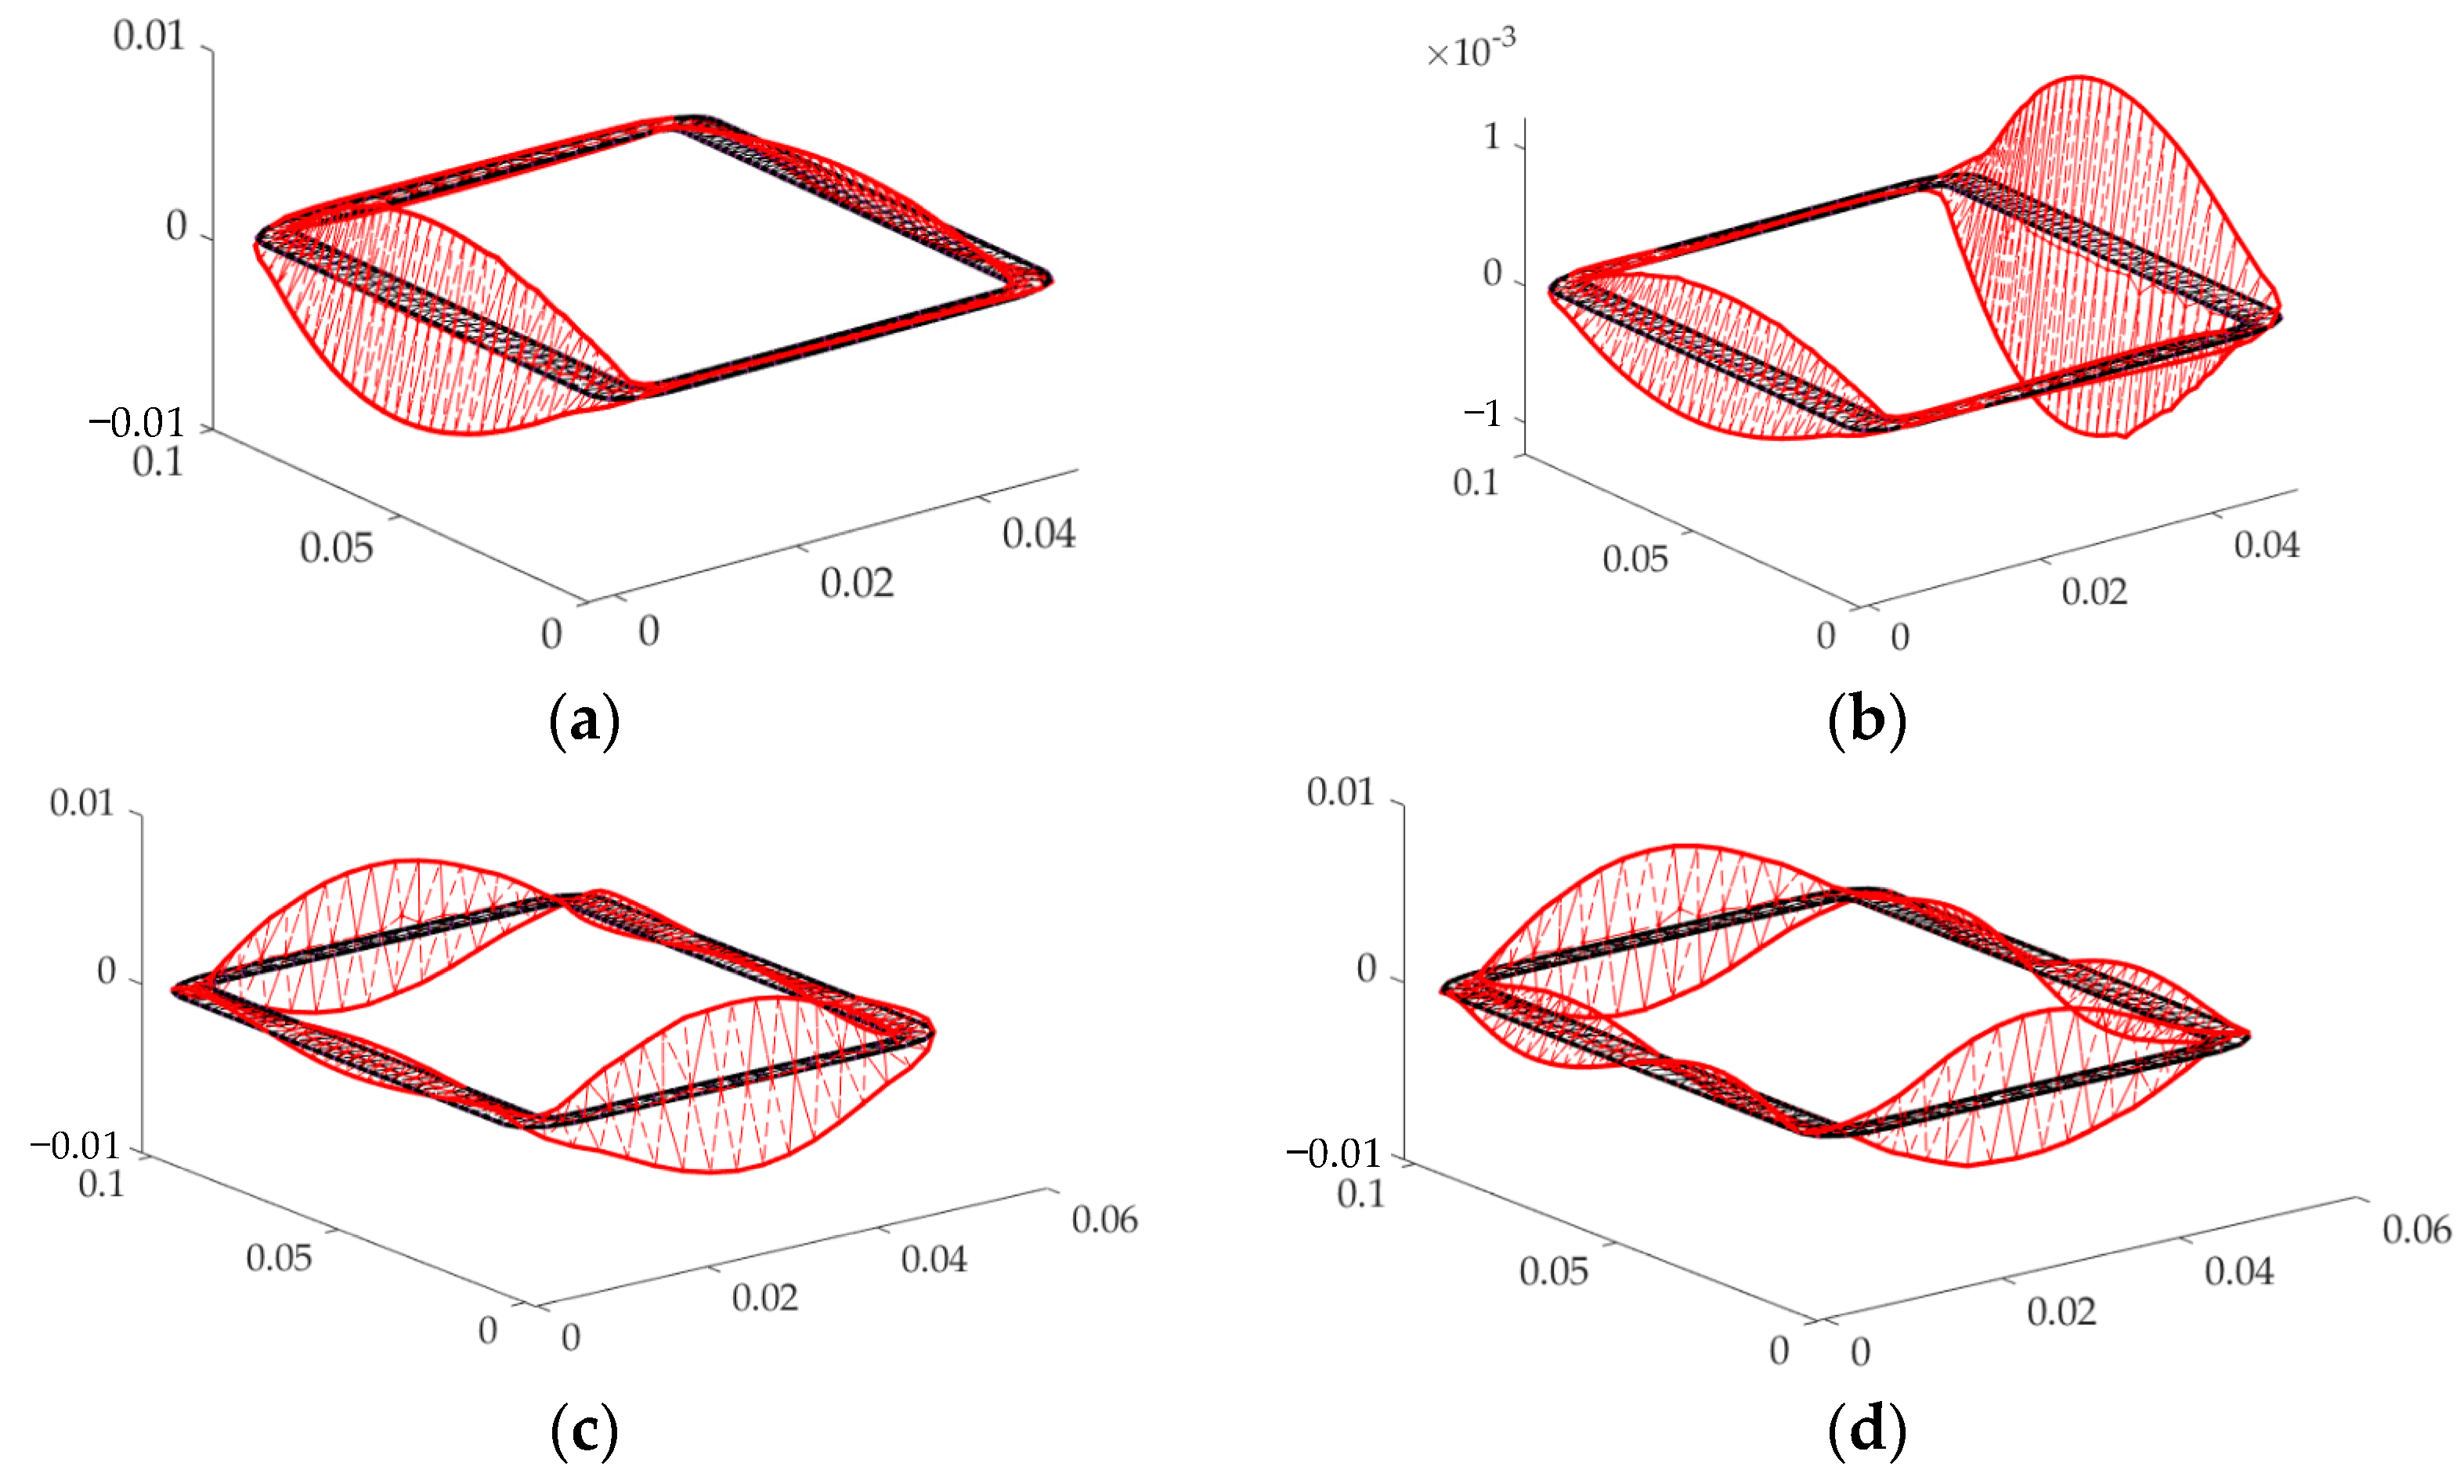
3.1. Propagation Characteristic of Guided Waves in Square Steel Tube

To verify the above analysis and the designed transducers layout scheme, UGW propagation in a square steel tube was simulated by ANSYS. SOLID185 was selected to simulate the square steel tube, and SOLID5 was selected as the piezoelectric wafer, which were applied for excitation and reception. The tube length was 2 m, and the mesh size was set as 2 mm, which was determined according to the wavelength. The finite element model is shown in Figure 7.
According to the section symmetry of square steel tubes and the proposed damage detection method in the previous section, two long strips of excitation sensors with the size of 40 mm × 5 mm × 1 mm were arranged symmetrically in the middle of two long edges, at the leftmost end of the square steel tube. In another simulation case, similarly, two long strips of excitation sensors with the size of 20 mm × 5 mm × 1 mm were symmetrically arranged in the middle of two short edges, at the leftmost end of the square steel tube. The receiving sensor with a size of 2 mm × 2 mm × 1 mm was arranged 2 mm after each excitation sensor along the longitudinal direction, as shown in Figure 8.
In this study, a five-cycle sinusoidal signal with a Hanning window was used for excitation, which is shown in Figure 9, and its expression is:
u ( t ) = A ( 1 c o s 2 π f c t n ) s i n ( 2 π f c t )
where A is the intensity factor; fc is the excitation frequency of the signal; and n is the period number of the signal.
Based on the above preparation, the excitation sensors are applied with the five-cycle sinusoidal signal of 60 kHz frequency. A fixed boundary condition was applied to the cross-section of both ends to simulate the actual operating status. Taking the long edge as an example, the excitation sensors on both long edges were excited. The wave field can be obtained, as shown in Figure 10.
The figure shows that, due to the limitation of the corner boundary, the guided wave energy is almost concentrated on the surface where the excitation actuator locates and propagates along the longitudinal direction of the square steel tube. The signal time history is further shown in Figure 11. When the excitation sensors on both sides are excited at the same time, it can be found that the signals collected by the receiving sensors on symmetric position are basically the same. Furthermore, two-dimensional fast Fourier transform (2D-FFT) was employed to identify the wave number. A group of data acquisition arrays with 200 data acquisition nodes were arranged at a distance of 0.5–1.5 m from the excitation sensor in order to collect the data for 2D-FFT. The simulation results are compared with the frequency wave number dispersion curve calculated by the SAFE method, as shown in Figure 12. Figure 12a,b show the 2D-FFT results of received signals in the long and short edge areas, respectively. It can be seen that the identified wave number results are consistent with the dispersion curve, and the first, second, fifth and sixth modes are mainly excited, which is consistent with the designed excitation scheme, although some high-order modes are also mildly excited.
The above figure shows that, due to the limitation of the corner boundary, the guided wave energy is almost concentrated on the surface where the excitation actuator locates and propagates along the longitudinal direction of the square steel tube. The signal time history is further shown in Figure 11.

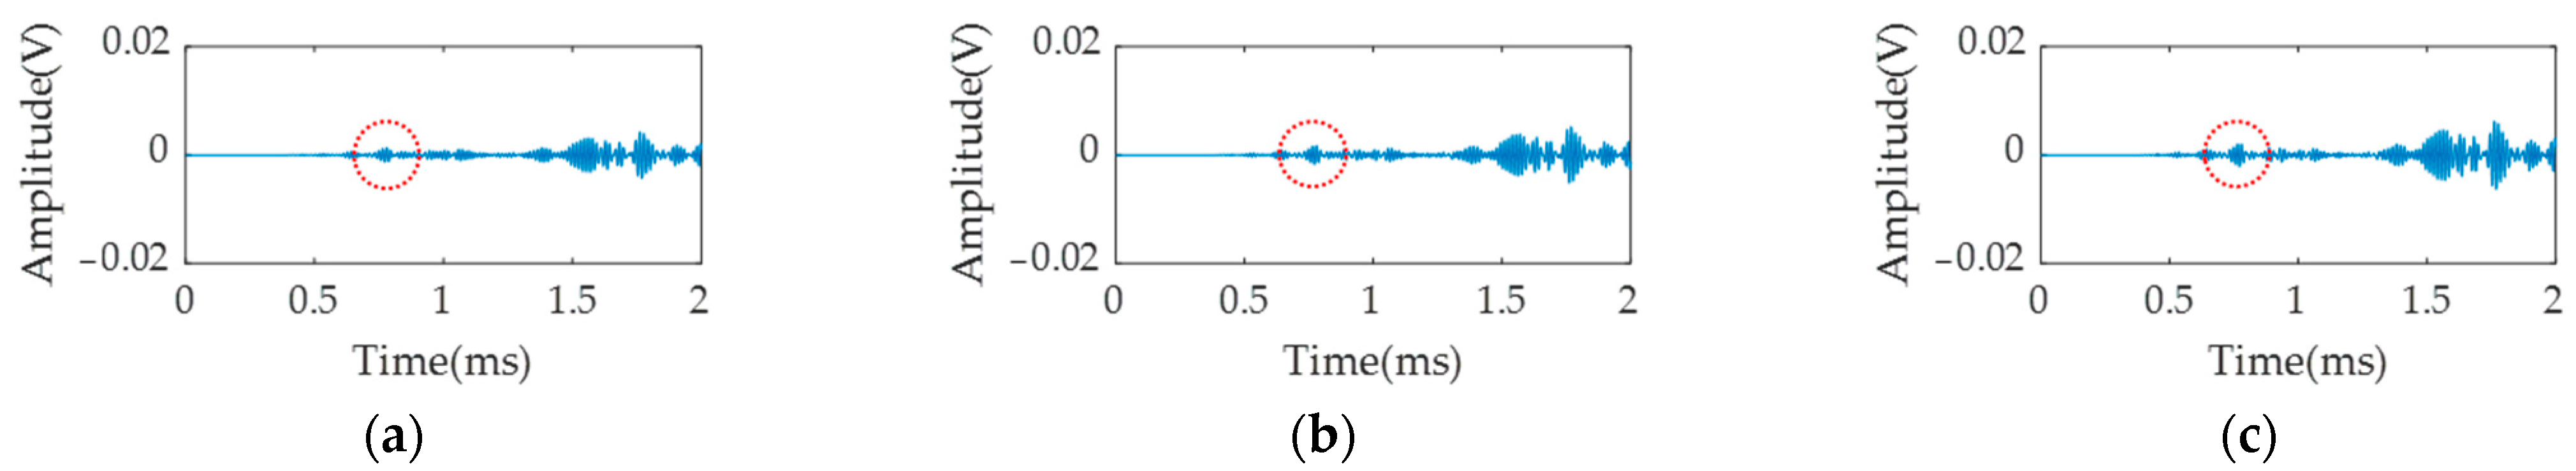
3.2. Damage Detection

Due to the existence of the rounded corner of the square steel tube, the guided wave will constantly reflect, refract and disperse at the rounded corner. In addition, because of the multi modes of the guided wave, there will be a lot of clutter in the received signals, which makes the extraction of damage features more difficult. According to the proposed method, most of the clutter can be removed by differentiating the received signal. In order to verify the effectiveness of the damage identification method based on cross-section symmetry, FE simulation was carried out in this section. Crack damage was simulated in the middle of the square steel tube model by element deletion, as shown in Figure 13. Using the excitation signal in Figure 9, the propagation of guided waves in the steel tube with the damage hole is shown in Figure 14.
It can be seen that echoes were generated when the guided wave interacted with the damage hole. In other words, the defects on the square steel tube will affect the propagation and the energy distribution of the guided wave. The guided wave signals of the receiving sensors received at the symmetrical position were further collected with 2 cm, 3 cm and 4 cm cracks in length (each crack is 2 mm deep and 2 mm wide) and the difference signals were generated as shown in Figure 15. This indicates that the difference signal can clearly identify the damage wave packet while the clutters in initial signals are eliminated, and the damage wave packet will grow as the crack length increases.

4. Experimental Investigations

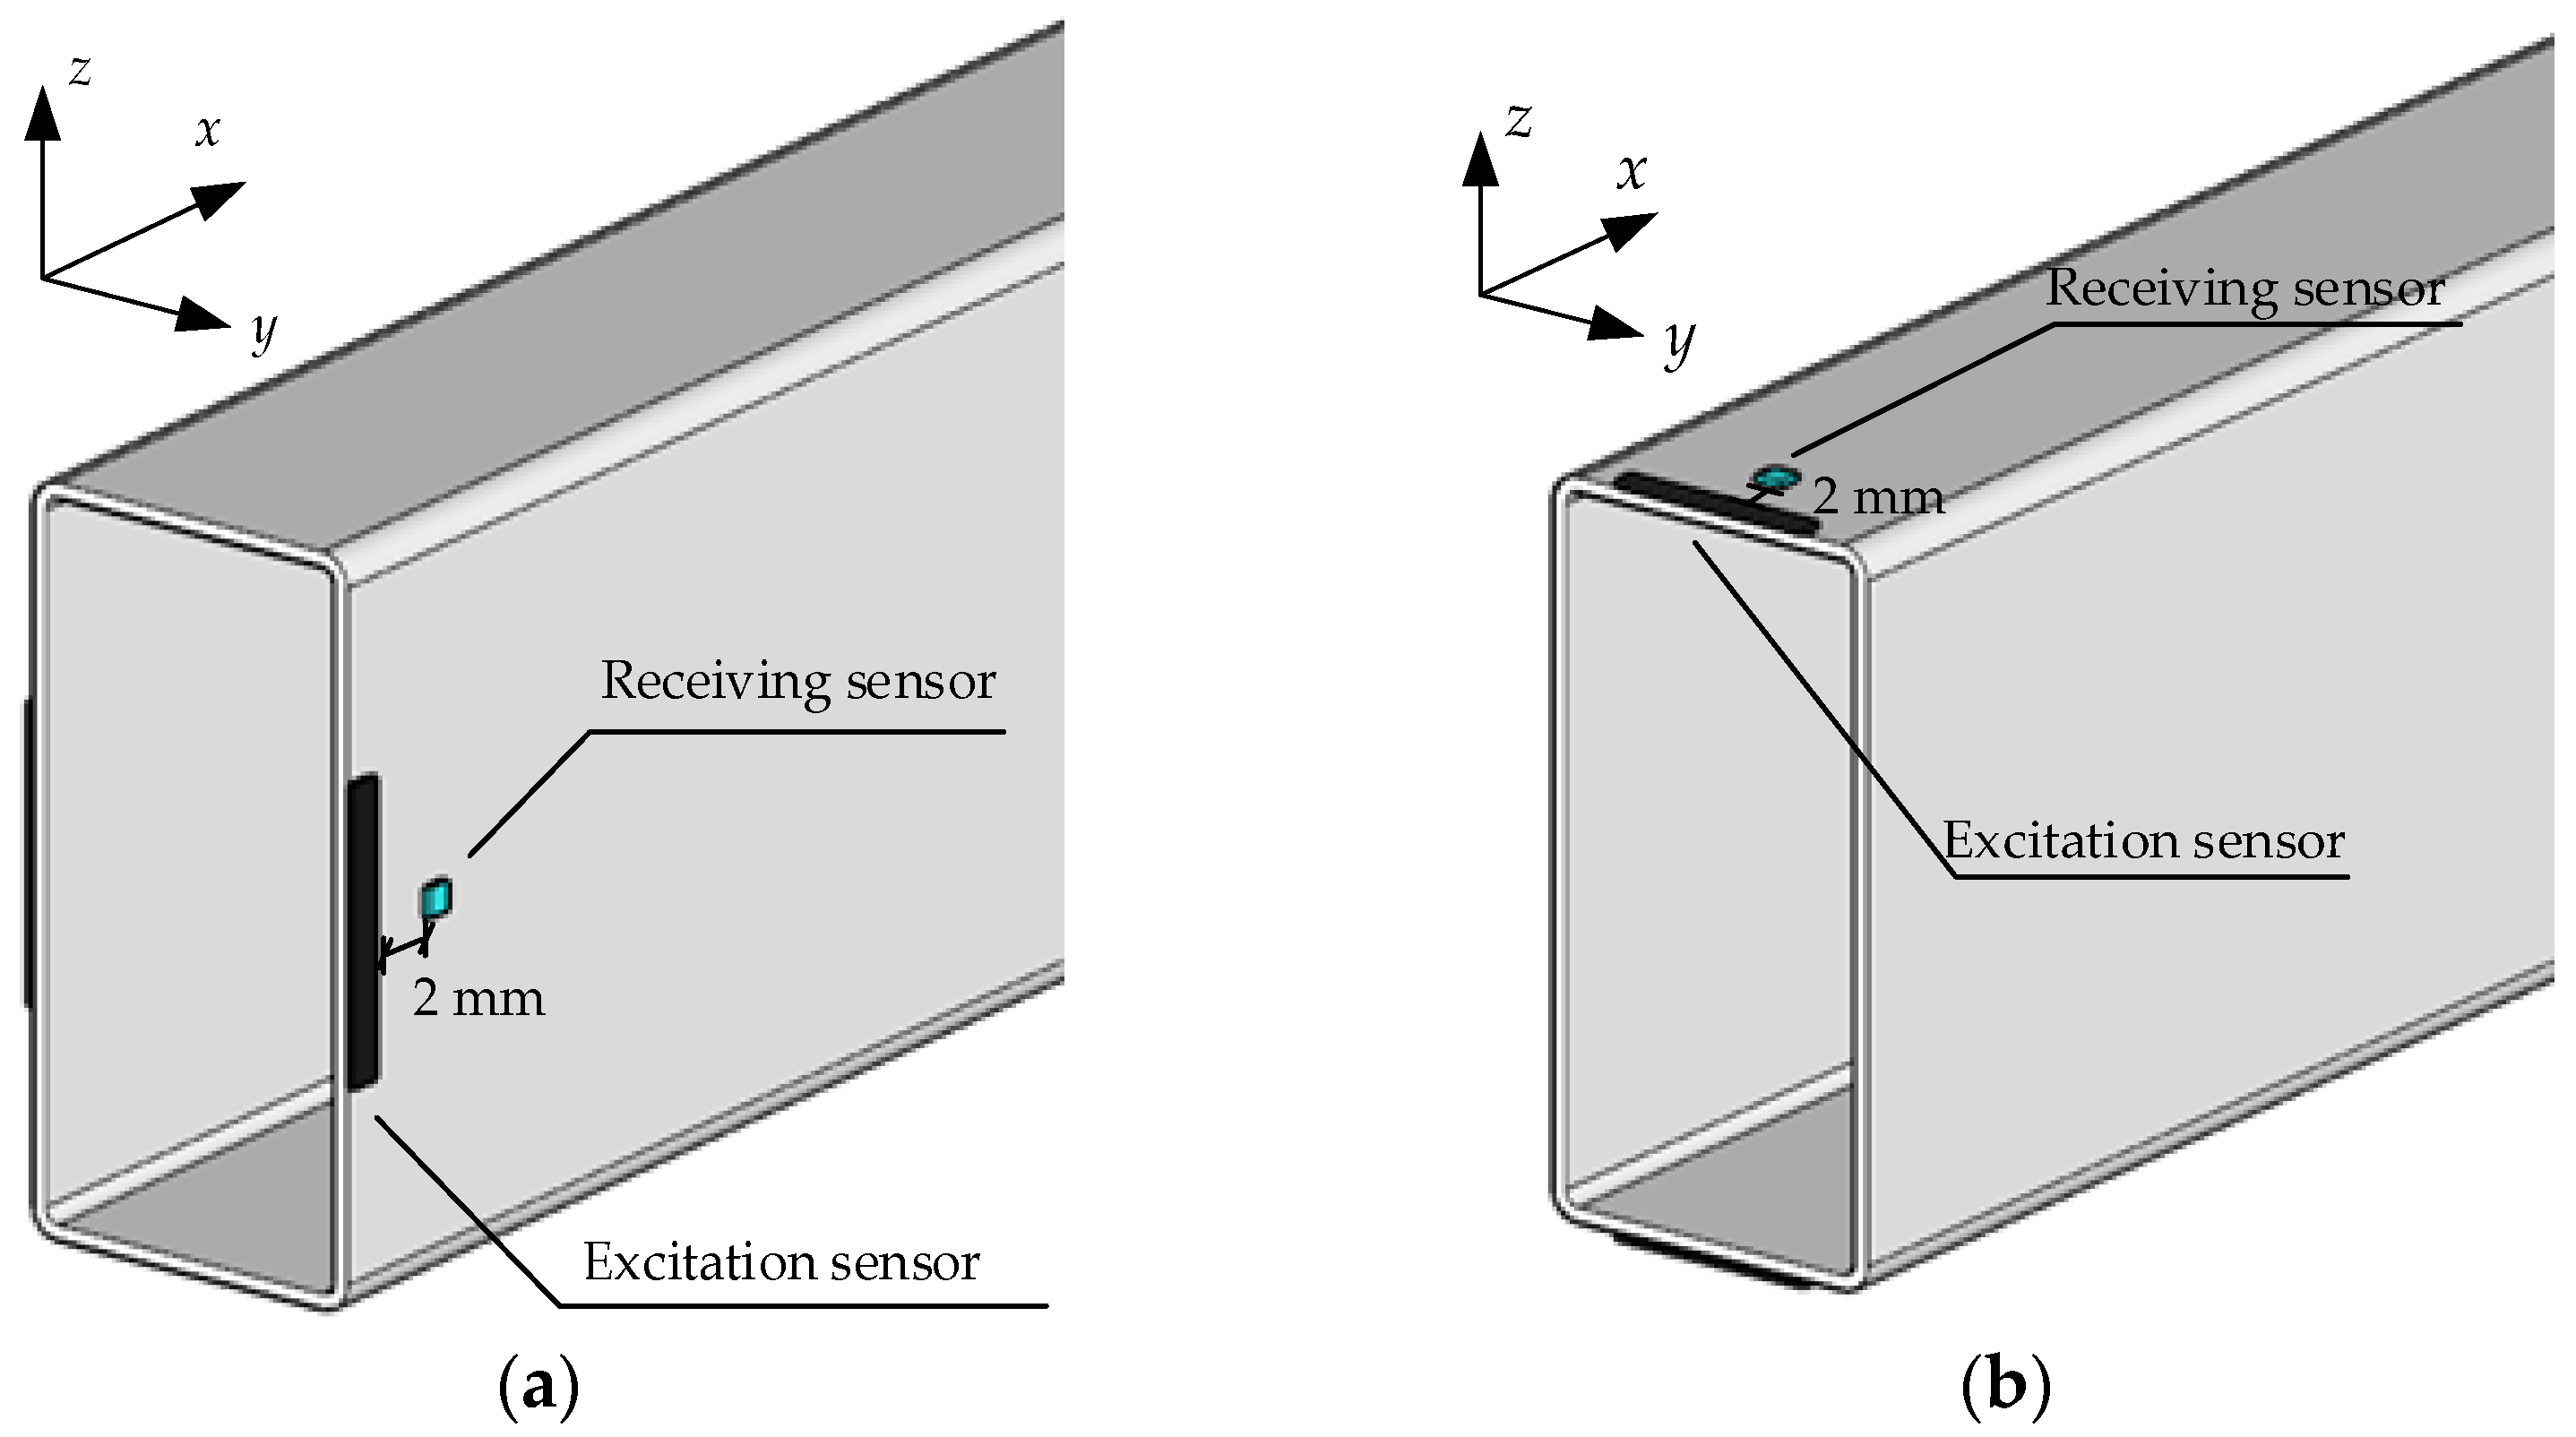
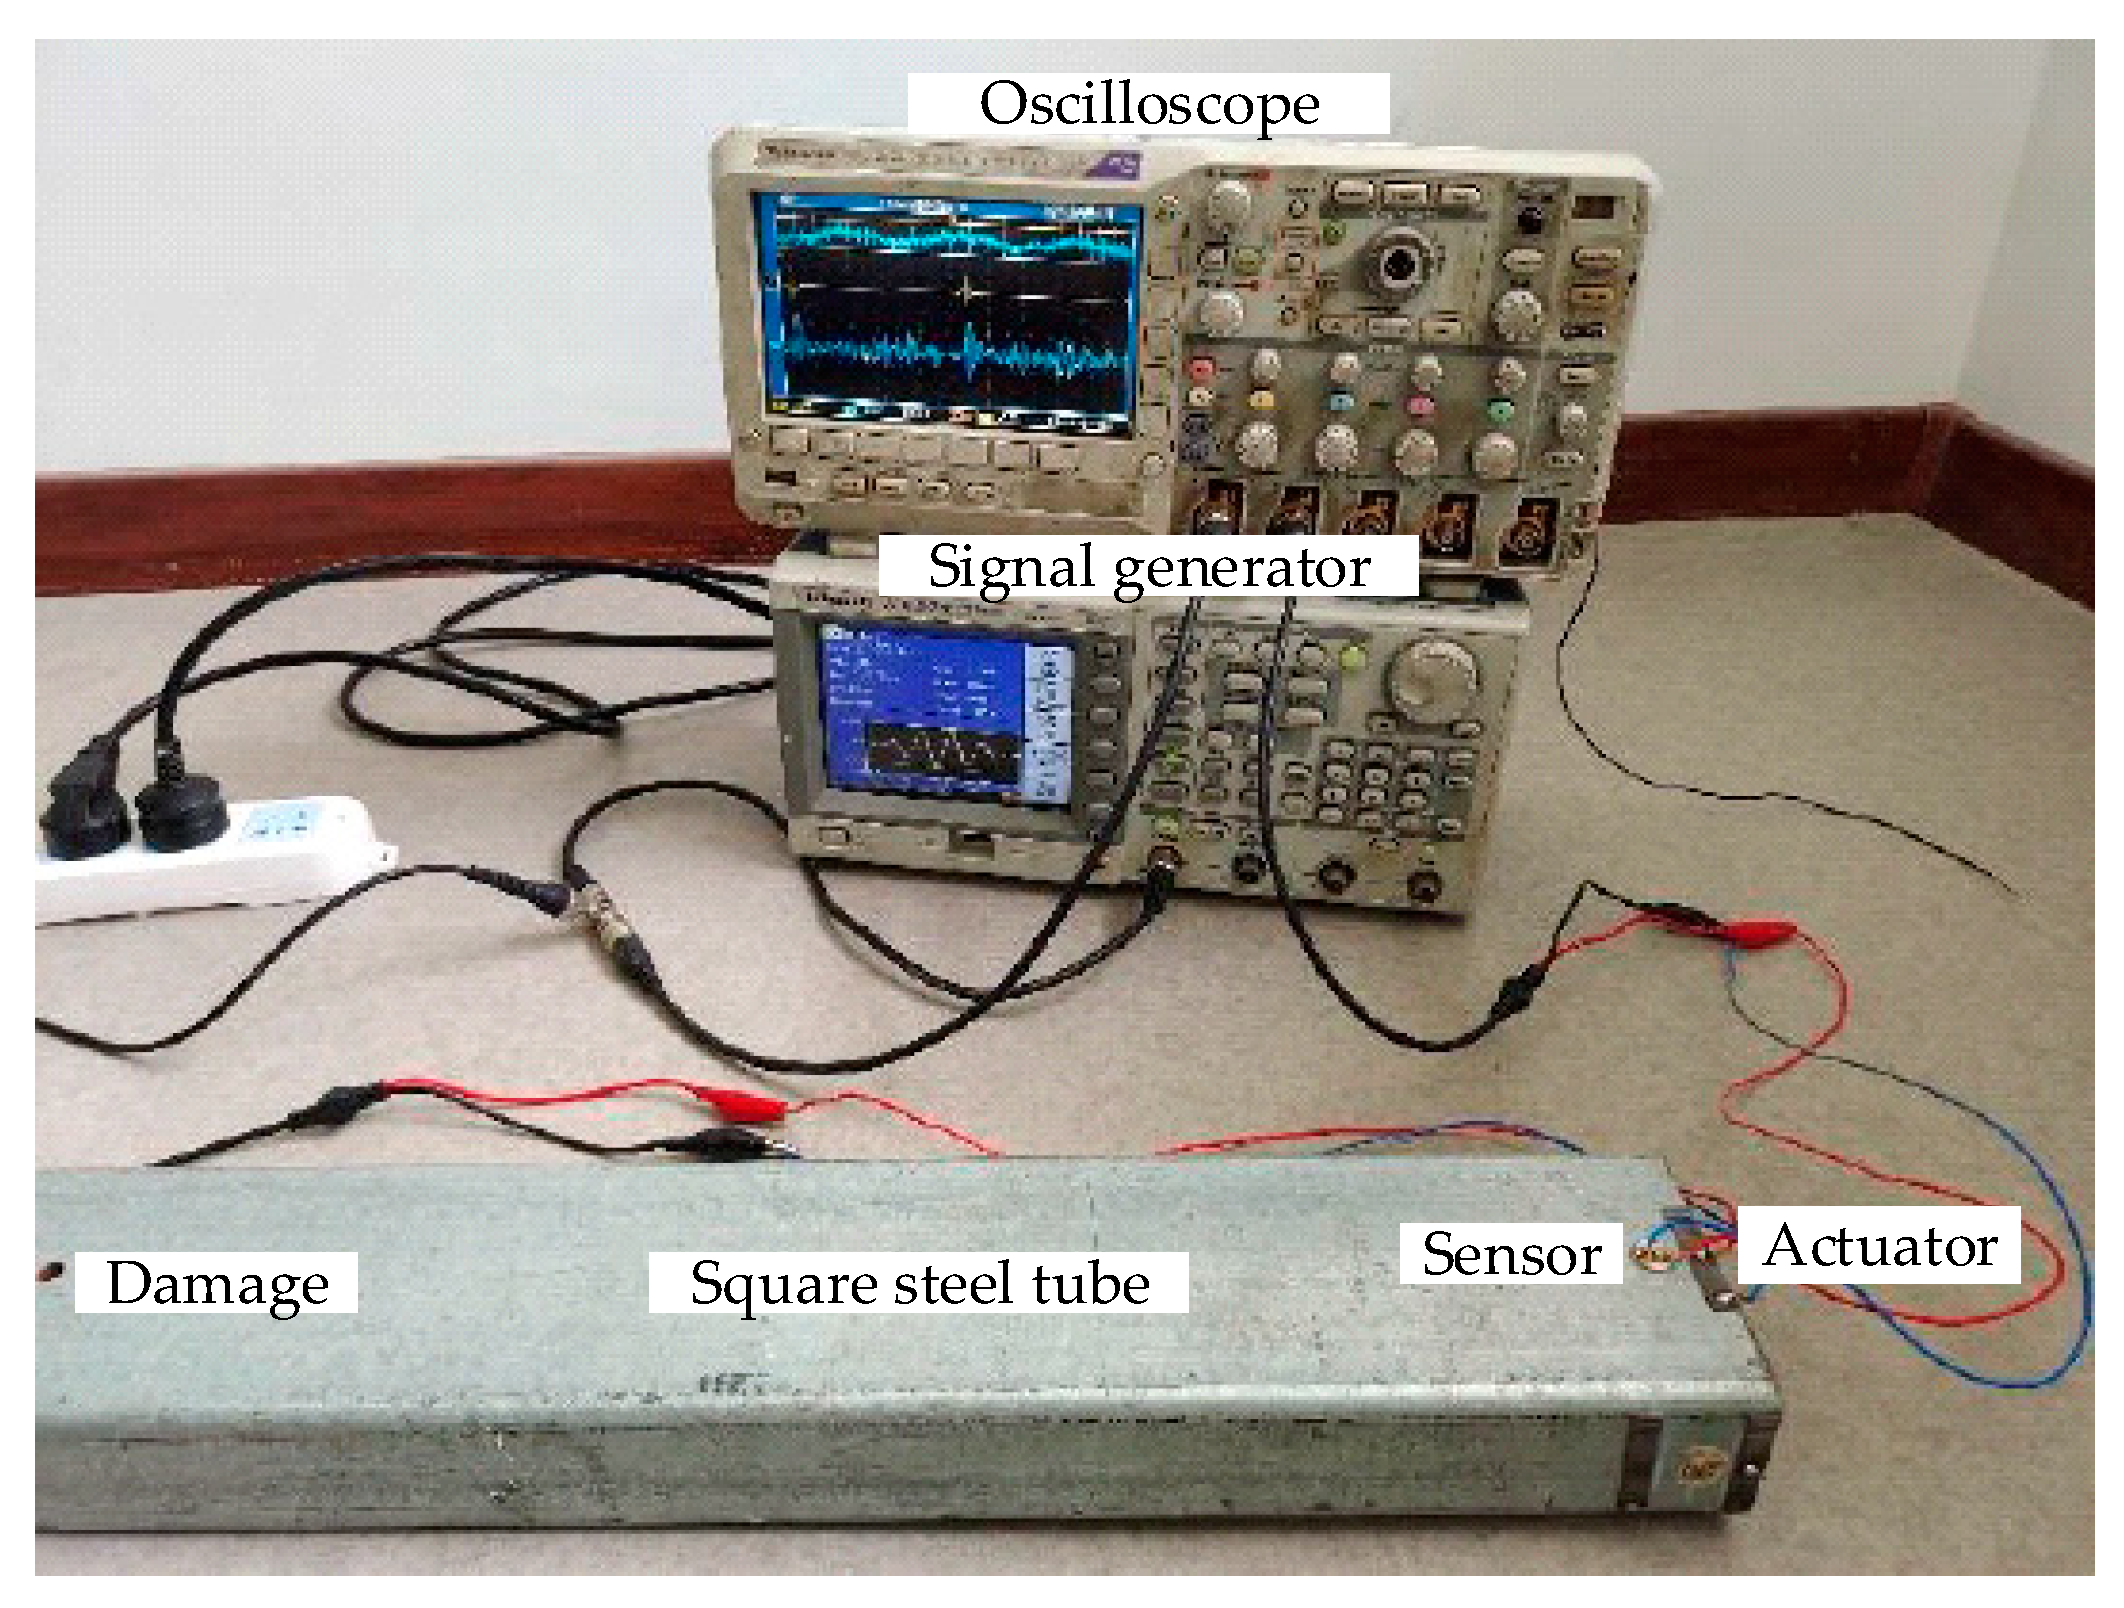
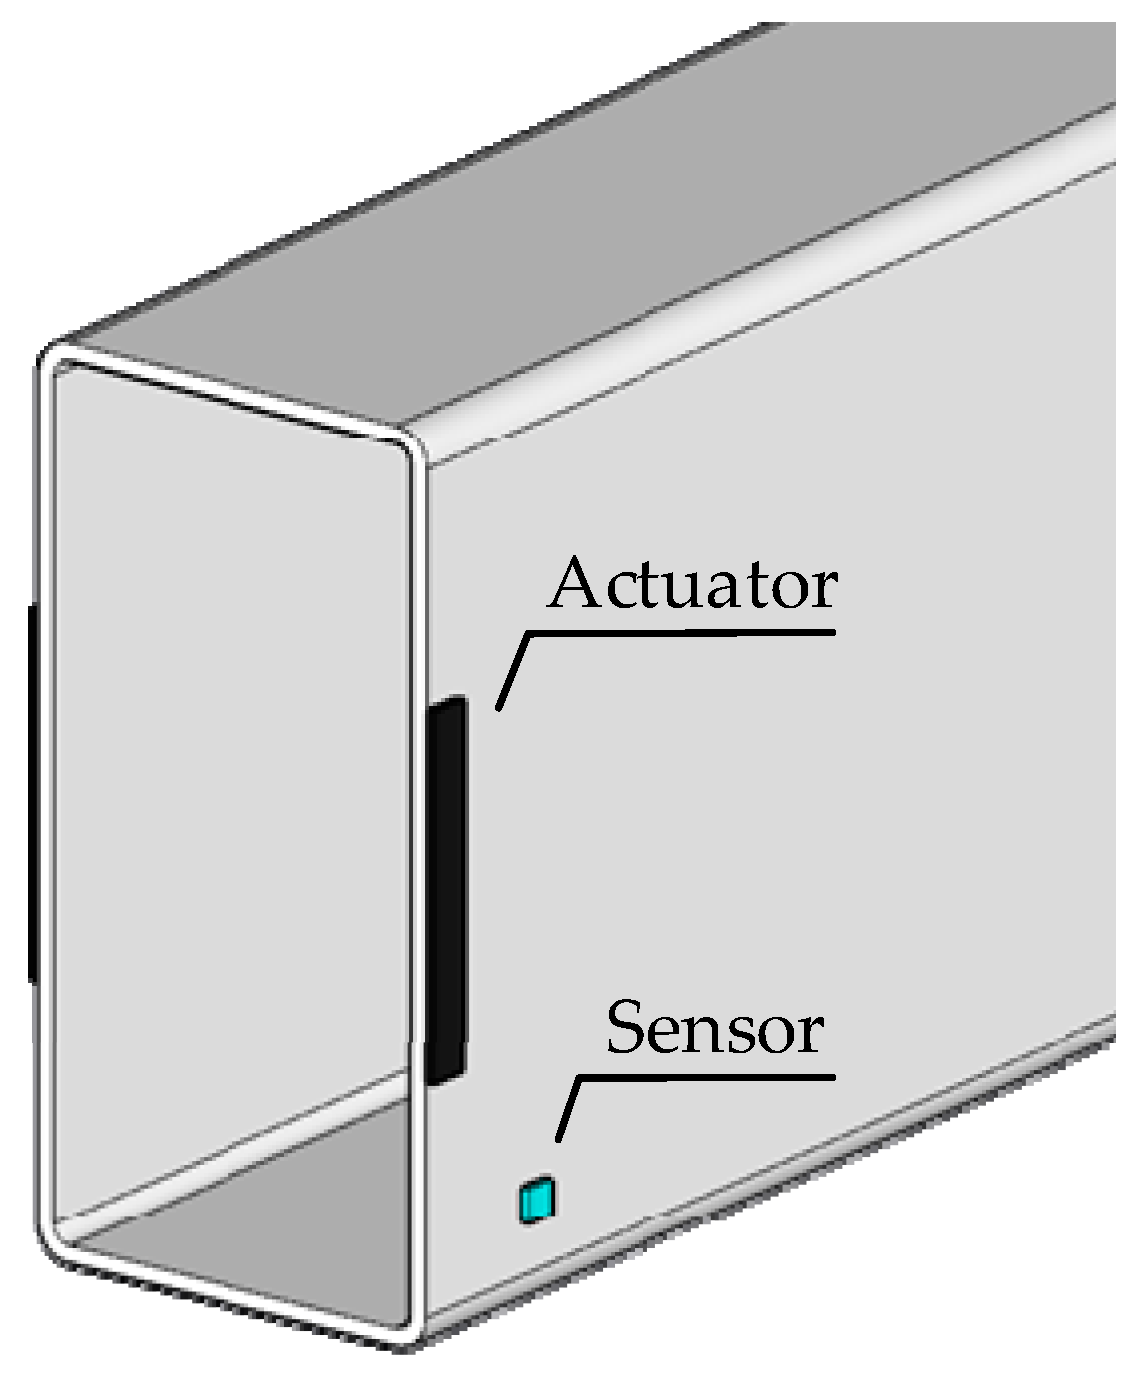
4.1. Experimental Setup

A galvanized square steel tube with the same section size and the same position of actuators and sensors as the simulation case in Section 3.1 was used for laboratory experiments to verify the effectiveness of the proposed damage identification method. The test system was mainly composed of a signal generator, amplifier, oscilloscope, and computer, as shown in Figure 16 and Figure 17.
At the start of the experiment, it is important to collect the signal from the undamaged steel stube, which can be used as a reference for the following tests for damage cases. The original and the difference signals from the short edge of a 2 m long steel tube were chosen and are displayed in Figure 18, respectively. From the figure, we can verify that the signals at symmetrical positions have similar trends, whereas the echo signal may have some difference due to experimental and structural manufacturing errors. Consequently, the signal may appear as a change in the middle part if a defect occurs.
In practical structures, the common damages in square steel tubes are cracks, corrosion, and holes, etc. Therefore, rectangular cracks and round holes with different positions and degrees were artificially created on the square steel tube. The crack damage cases were designed as shown in Figure 19 and Table 1, and the hole damage cases were designed as shown in Figure 20 and Table 2. There was only one instance of damage on one steel tube, in other words, the damage setting in each case was independent.

4.2. Inspection of Different Shape Damage

For the crack damage detection on one side of the long edge area, the five-cycle sinusoidal signal of 60 kHz was applied to the actuator in the long edge region symmetrically, and the guided wave signals received from the upper and lower sensors were subtracted. The difference signal with different crack lengths can be obtained as shown in Figure 21.
Similarly, for the crack damage detection on one side of the short edge area, a five-cycle sinusoidal signal of 60 kHz was applied to the actuator in the short edge region, symmetrically. The difference signals of the guided wave received by the upper and lower sensors with different crack lengths are shown in Figure 22.
It can be seen that the difference signal for the long edge and the short edge inspection mainly consists of three parts: (1) the micro wave packet at the starting point caused by the electromagnetic interference generated by the amplifier used in the test, which does not affect the damage identification results; (2) the wave packet in the middle caused by the crack, which can be used to verify the effectiveness of the proposed damage identification method; (3) the remaining wave packet at the end point is generated on account of the end echo, which will be reduced when damage occurs. It can be seen that the method can identify cracks with different sizes on the long edge and short edge of square steel tubes.
Different from the difference signal with cracks on the long edge, the damage wave packet induced by the 4 cm crack on the short edge also had a large clutter behind it. This is mainly because this crack is close to the corner side, so interference clutter appears in the differential signal due to the interference of the edge fillet.
At the same time, round hole damage at different positions can be identified. The damage difference signals of sensors symmetrically arranged on the long edge and short edge were obtained through tests, as shown in Figure 23 and Figure 24.
The figures above indicate that the difference signal obtained from hole damage is basically the same as the crack damage waveform except for a significant difference in amplitude, whereas the wave packet in the middle is caused by damage. It further shows that the middle hole and offset hole damage in the short edge area can be accurately identified, and the amplitude of the damage wave packet is significantly higher than that of the same damage in the long edge area. This is due to the better constraint effect at the rounded corners of the short edge area, so that the energy of the guided wave is mainly concentrated in the region where the actuator excitation point is located. Thus, compared with the long edge, the damage in the short edge area under the same conditions is easier to identify.
Furthermore, for corner hole damage, there is no obvious wave packet at the damaged location in the long edge region, and the amplitude of the damage wave packet in the short edge difference signal is close to the clutter, so it is not as easy to identify corner hole damage from this differential signal using the current test scheme.

4.3. Damage Localization

According to the dispersion curve given in Figure 3, the wave velocities of the first and fifth modes at 60 kHz are 2488.1 m/s and 2384.5 m/s, respectively. According to Equation (16) and the time interval between the damage wave packet and the end of the square steel tube identified in Figure 21 and Figure 22, the damage location can be calculated, as shown in Table 3. These results indicate that the damage can be localized, and the localization errors in the short edge area are less than those of the long edge area.
Similarly, the hole location can be calculated according to the time interval between the damage wave packet and the end of the square steel tube identified in Figure 23 and Figure 24, as shown in Table 4. Results indicate that the middle hole can be localized well, followed by the offset hole, but the results for the corner hole are the worst.

4.4. Further Discussion on Corner Damage and Multiple Damages

In order to improve the identification effect of the corner hole, the layout of sensors was modified. To be more specific, the sensors were arranged near the corner to enhance the receiving effect for the corner hole damage signal. The modified layout diagram of the sensor is shown in Figure 25.
The length of the square steel tube used in the test was 2 m, and the corner hole with a diameter of 6 mm was arranged at the long edge, 1.5 m away from the sensor. The signal obtained by a symmetrical sensor was analyzed by subtraction, and the difference signal is shown in Figure 26. It can be seen in Figure 26 that there is an obvious damage wave packet in the difference signal, which proves that a modified sensor layout strategy can improve the identification effect of the corner hole.
In order to further explore the inspection effect when multiple corner hole damages exist at the same time, 6 mm and 8 mm corner hole damages were set at the positions 1 m and 1.5 m longitudinally away from the sensor in the long edge area. The differential signal of the symmetrical receiving sensor obtained from the modified sensor layout scheme is shown in Figure 27. The result in the figure shows that this method can also identify corner hole damage at multiple locations.

5. Conclusions

In this paper, a damage detection method for square steel tubes using UGWs based on structure symmetry was proposed, and its effectiveness was verified through numerical simulation and laboratory experiments. The main conclusions that were drawn are as follows:
  • The SAFE method was used to solve the dispersion characteristics of the square steel tube, and the first, second, fifth and sixth order modes were selected as the desired modes for inspecting the damage status of long and short edges. Through finite element simulation and NME analysis, it was verified that by using structure symmetry, the influence of the dispersion effect and boundary limit can be reduced effectively, and thus clutter can be eliminated.
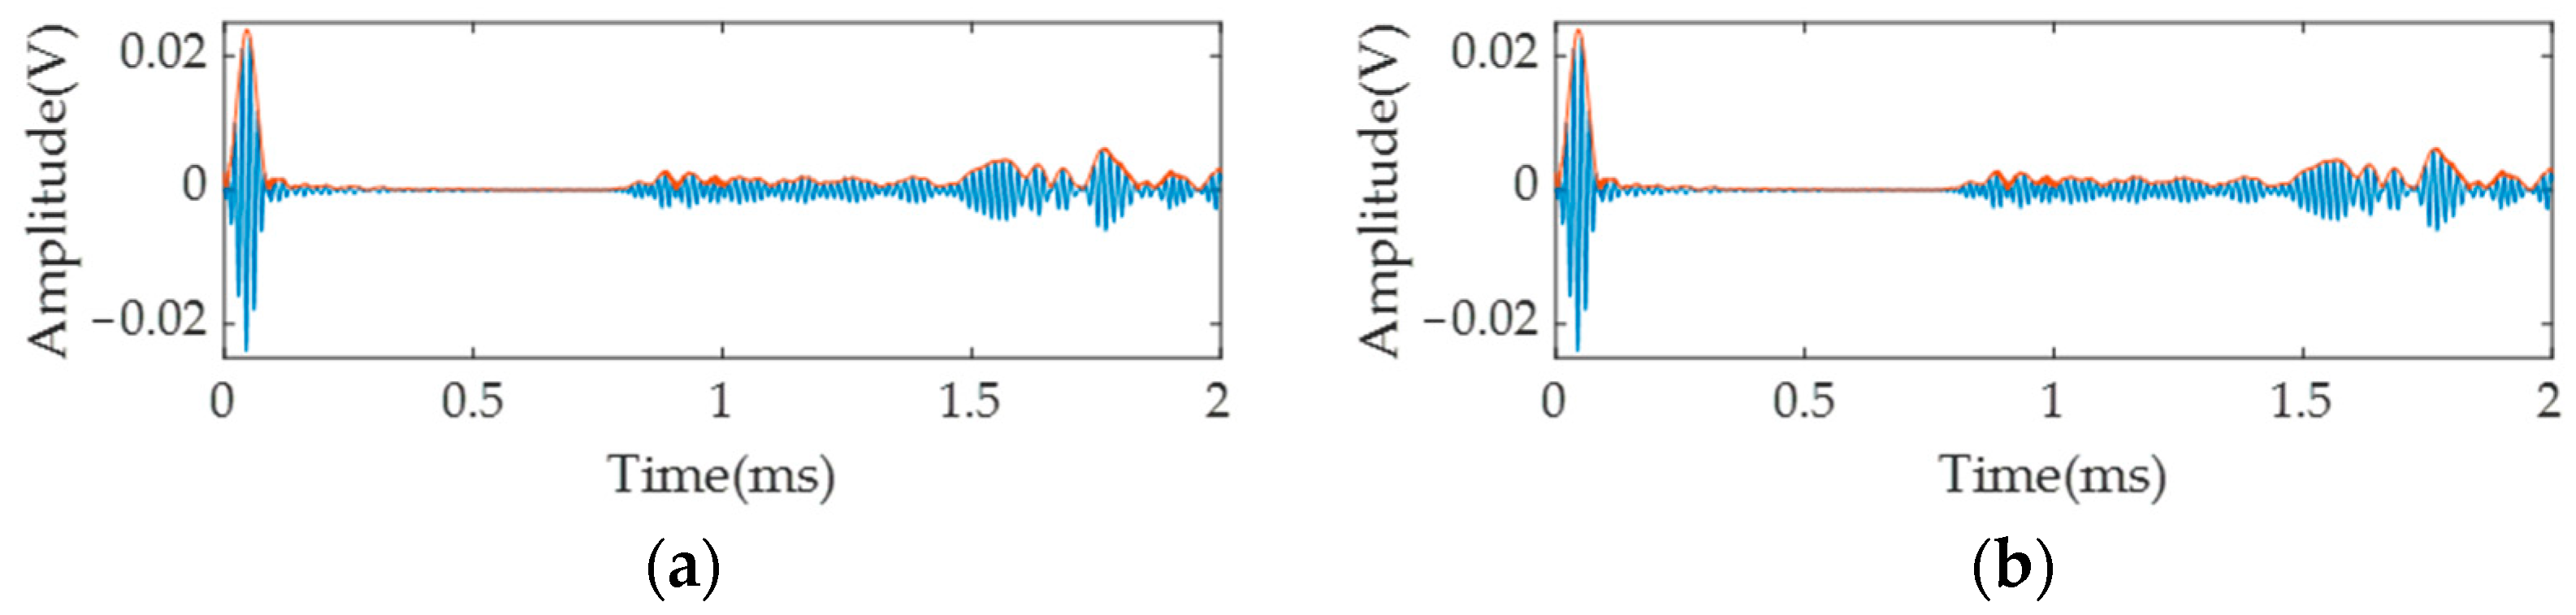
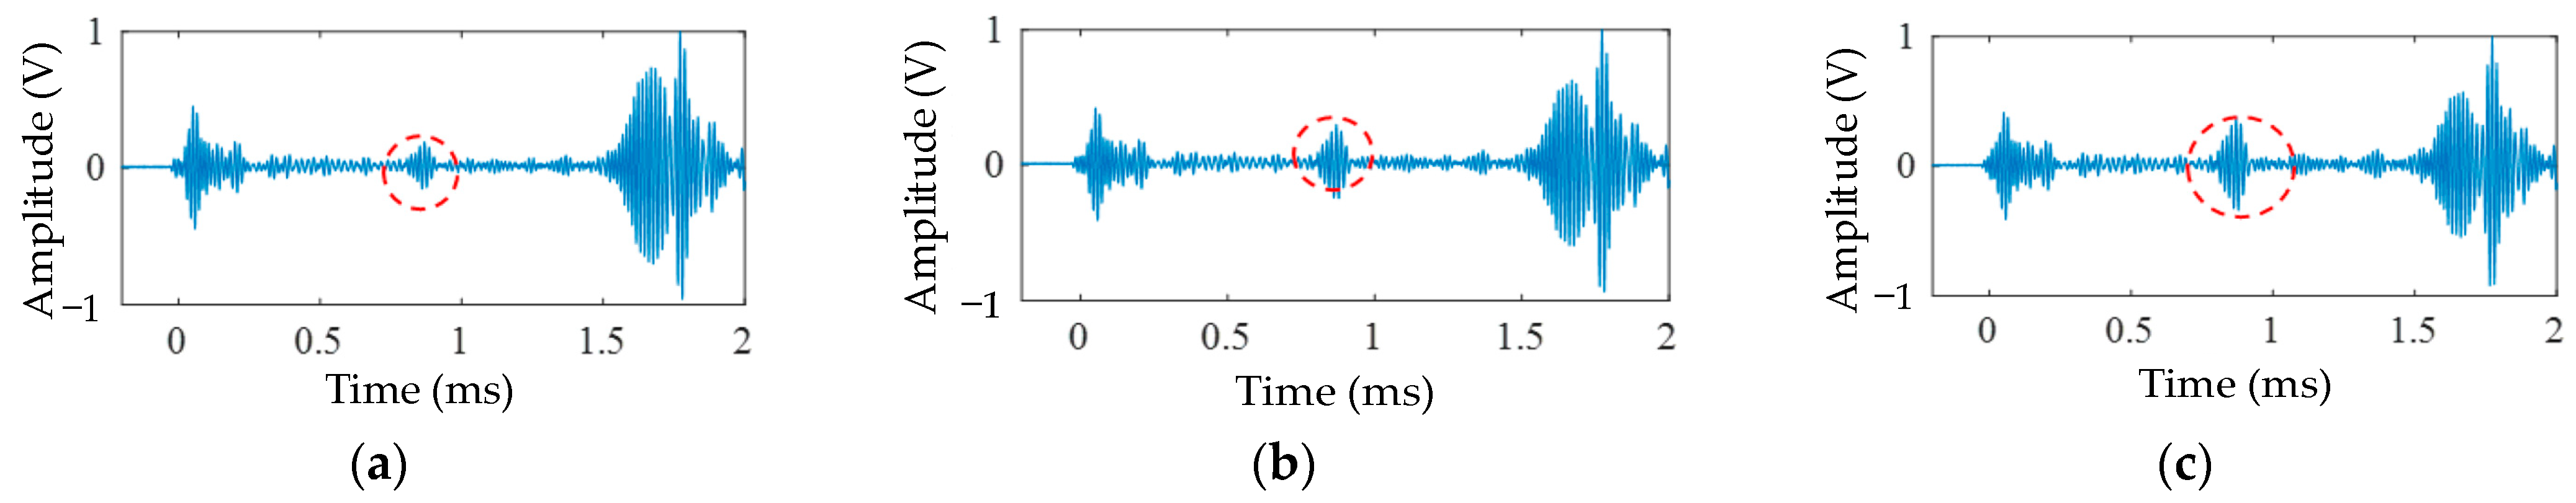
  • The method to identify the damage of square steel tube based on section symmetry was proposed and verified by numerical simulation and laboratory experiments. The test results show that for cracks of different sizes and middle and offset hole damage in long and short edges, the symmetrical damage difference signals will appear as obvious damage wave packets at the damage locations.
  • Damage location can be determined by the group wave velocity of desired modes and the appearance time of the damage wave packet. The calculation results show that the identification errors of crack, middle hole and offset hole damage are no more than 9.11%, indicating high positioning accuracy.
  • For corner hole damage, the initial scheme had a poor identification effect, but it can be improved by changing the position of the receiving piezoelectric plate. However, for multi damages, the proposed method still has a good identification effect.

Author Contributions

Investigation, software, formal analysis, writing—original draft, T.Y.; conceptualization, supervision, writing—review & editing, funding acquisition, W.Z.; investigation, L.Y. All authors have read and agreed to the published version of the manuscript.

Funding

This research was funded by the National Science Foundation of China, grant number 51978217.

Institutional Review Board Statement

Not applicable.

Informed Consent Statement

Not applicable.

Data Availability Statement

Data available from the corresponding author upon reasonable request.

Conflicts of Interest

The authors declare no conflict of interest.

References

  1. Wan, X.; Liu, M.R.; Zhang, X.H.; Fan, H.W.; Tse, P.W.; Dong, M.; Wang, X.; Wei, H.H.; Xu, C.H.; Ma, H.W. The Use of Ultrasonic Guided Waves for the Inspection of Square Tube Structures: Dispersion Analysis and Numerical and Experimental Studies. Struct. Health Monit. 2021, 20, 58–73. [Google Scholar] [CrossRef]
  2. He, J.Z.; Yuan, F.G. Damage Identification for Composite Structures Using a Cross-Correlation Reverse-Time Migration Technique. Struct. Health Monit.-Int. J. 2015, 14, 558–570. [Google Scholar] [CrossRef]
  3. He, J.Z.; Leckey, C.A.C.; Leser, P.E.; Leser, W.P. Multi-Mode Reverse Time Migration Damage Imaging Using Ultrasonic Guided Waves. Ultrasonics 2019, 94, 319–331. [Google Scholar] [CrossRef] [PubMed]
  4. He, J.Z.; Rocha, D.C.; Sava, P. Guided Wave Tomography Based on Least-Squares Reverse-Time Migration. Struct. Health Monit.-Int. J. 2019, 19, 1237–1249. [Google Scholar] [CrossRef]
  5. Zhou, W.S.; Li, H.; Yuan, F.G. Fundamental Understanding of Wave Generation and Reception Using d36 Type Piezoelectric Transducers. Ultrasonics 2015, 57, 135–143. [Google Scholar] [CrossRef]
  6. Golub, M.V.; Doroshenko, O.V.; Arsenov, M.A.; Bareiko, I.A.; Eremin, A.A. Identification of Material Properties of Elastic Plate Using Guided Waves Based on the Matrix Pencil Method and Laser Doppler Vibrometry. Symmetry 2022, 14, 1077. [Google Scholar] [CrossRef]
  7. Yaylaci, M. Simulate of Edge and an Internal Crack Problem and Estimation of Stress Intensity Factor Through Finite Element Method. Adv. Nano Res. 2022, 12, 405–414. [Google Scholar]
  8. Vinh, P.V.; Avcar, M.; Belarbi, M.O.; Tounsi, A.; Huy, L.Q. A New Higher-Order Mixed Four-Node Quadrilateral Finite Element for Static Bending Analysis of Functionally Graded Plates. Structures 2023, 47, 1595–1612. [Google Scholar] [CrossRef]
  9. Sobhani, E. Improvement of Vibrational Characteristics of Multipurpose Structures (Plate and Shells) Used in Aerospace Components by Deploying Graphene Oxide Powders (GOPs) in a Matrix as a Nano-Reinforcement: A Comprehensive Study. Eng. Anal. Bound. Elem. 2023, 146, 598–635. [Google Scholar] [CrossRef]
  10. Abouelregal, A.E.; Ersoy, H.; Civalek, O. Solution of Moore–Gibson–Thompson Equation of an Unbounded Medium with a Cylindrical Hole. Mathematics 2021, 9, 1536. [Google Scholar] [CrossRef]
  11. Miao, H.C.; Huan, Q.; Wang, Q.Z.; Li, F.X. Excitation and Reception of Single Torsional Wave T(0,1) Mode in Pipes Using Face-Shear d24 Piezoelectric Ring Array. Smart Mater. Struct. 2017, 26, 025021. [Google Scholar] [CrossRef]
  12. Zhang, H.; Du, Y.H.; Tang, J.H.; Kang, G.Z.; Miao, H.C. Circumferential SH Wave Piezoelectric Transducer System for Monitoring Corrosion-Like Defect in Large-Diameter Pipes. Sensors 2020, 20, 460. [Google Scholar] [CrossRef] [PubMed] [Green Version]
  13. Dabak, A. Data-Driven Semi-Supervised and Supervised Learning Algorithms for Health Monitoring of Pipes. Mech. Syst. Signal Process. 2019, 131, 524–537. [Google Scholar]
  14. Yeung, C.; Ng, C.T. Time-Domain Spectral Finite Element Method for Analysis of Torsional Guided Waves Scattering and Mode Conversion by Cracks in Pipes. Mech. Syst. Signal Process. 2019, 128, 305–317. [Google Scholar] [CrossRef]
  15. Wang, Z.; Wang, S.; Wang, Q.; Zhao, W.; Huang, S.L. Development of a Helical Lamb Wave Electromagnetic Acoustic Transducer for Pipeline Inspection. IEEE Sens. J. 2020, 20, 9715–9723. [Google Scholar] [CrossRef]
  16. Guan, R.Q.; Lu, Y.; Wang, K.; Su, Z.Q. Fatigue Crack Detection in Pipes with Multiple Mode Nonlinear Guided Waves. Struct. Health Monit.-Int. J. 2019, 18, 180–192. [Google Scholar] [CrossRef]
  17. El Najjar, J.; Mustapha, S. Condition Assessment of Timber Utility Poles Using Ultrasonic Guided Waves. Constr. Build. Mater. 2020, 272, 121902. [Google Scholar] [CrossRef]
  18. Majhi, S.; Mukherjee, A.; George, N.V.; Uy, B. Corrosion Detection in Steel Bar: A Time-Frequency Approach. NDT E Int. 2019, 107, 102150. [Google Scholar] [CrossRef]
  19. Sun, K.; Meng, G.; Li, F.; Ye, L.; Lu, Y. Damage Identification in Thick Steel Beam Based on Guided Ultrasonic Waves. J. Intell. Mater. Syst. Struct. 2010, 21, 225–232. [Google Scholar] [CrossRef]
  20. Song, G.; Li, H.; Gajic, B.; Zhou, W.; Chen, P.; Gu, H. Wind Turbine Blade Health Monitoring with Piezoceramic-Based Wireless Sensor Network. Int. J. Smart Nano Mater. 2013, 4, 150–166. [Google Scholar] [CrossRef]
  21. Rose, J.L.; Ditri, J.J.; Pilarski, A.; Rajana, K.; Carr, F. A Guided Wave Inspection Technique for Nuclear Steam Generator Tubing. NDT E Int. 1994, 27, 307–310. [Google Scholar] [CrossRef]
  22. Shin, H.J.; Rose, J.L. Guided Waves by Axisymmetric and Non-Axisymmetric Surface Loading on Hollow Cylinders. Ultrasonics 1999, 37, 355–363. [Google Scholar] [CrossRef] [PubMed]
  23. Geetha, G.K.; Gopalakrishnan, S.; Hanagud, S. Laser Doppler Imaging of Delamination in a Composite T-Joint with Remotely Located Ultrasonic Actuators. Compos. Struct. 2016, 147, 197–210. [Google Scholar] [CrossRef]
  24. Serey, V.; Quaegebeur, N.; Renier, M.; Micheau, P.; Masson, P.; Castaings, M. Selective Generation of Ultrasonic Guided Waves for Damage Detection in Rectangular Bars. Struct. Health Monit.-Int. J. 2020, 20, 1156–1168. [Google Scholar] [CrossRef]
  25. Zhang, J.Q.; Wu, Z.J.; Yang, Z.Y.; Liu, K.H.; Zhou, K.; Zheng, Y.B. Excitation of Guided Wave Modes in Arbitrary Cross-Section Structures by Applied Surface Tractions. Smart Mater. Struct. 2020, 29, 065010. [Google Scholar] [CrossRef]
  26. Tu, J.Q.; Tang, Z.F.; Yun, C.B.; Wu, J.; Xu, X. Guided Wave-Based Damage Assessment on Welded Steel I-Beam Under Ambient Temperature Variations. Struct. Control Health Monit. 2021, 28, e2696. [Google Scholar] [CrossRef]
  27. Ditri, J.J.; Rose, J.L. Excitation of Guided Elastic Wave Modes in Hollow Cylinders by Applied Surface Tractions. J. Appl. Phys. 1992, 72, 2589–2597. [Google Scholar] [CrossRef]
  28. Drygala, I.J.; Dulinska, J.M. Full-Scale Experimental and Numerical Investigations on the Modal Parameters of a Single-Span Steel-Frame Footbridge. Symmetry 2019, 11, 404. [Google Scholar] [CrossRef] [Green Version]
  29. Yang, Y.; Yang, L.; Yao, G. Post-Processing of High Formwork Monitoring Data Based on the Back Propagation Neural Networks Model and the Autoregressive-Moving-Average Model. Symmetry 2021, 13, 1543. [Google Scholar] [CrossRef]
  30. Yao, G.; Sun, Y.J.; Wong, M.P.; Lv, X.N. A Real-Time Detection Method for Concrete Surface Cracks Based on Improved YOLOv4. Symmetry 2021, 13, 1716. [Google Scholar] [CrossRef]
  31. Hayashi, T.; Rose, J.L. Guided Wave Simulation and Visualization by A Semi-Analytical Finite Element Method. Mater. Eval. 2003, 61, 75–79. [Google Scholar]
  32. Hayashi, T.; Kawashima, K.; Sun, Z.Q.; Rose, J.L. Analysis of Flexural Mode Focusing by a Semi-Analytical Finite Element Method. J. Acoust. Soc. Am. 2003, 113, 1241–1248. [Google Scholar] [CrossRef] [PubMed] [Green Version]
  33. Hayashi, T.; Song, W.J.; Rose, J.L. Guided Wave Dispersion Curves for a Bar with an Arbitrary Cross-Section, a Rod and Rail Example. Ultrasonics 2004, 41, 175–183. [Google Scholar] [CrossRef] [PubMed]
  34. Xie, J.; Ding, W.; Zou, W.; Wang, T.; Yang, J. Defect Detection inside a Rail Head by Ultrasonic Guided Waves. Symmetry 2022, 14, 2566. [Google Scholar] [CrossRef]
Figure 1. Typical square steel tube structure in civil engineering.
Symmetry 15 00805 g001
Figure 2. Cross-section and mesh generation of square steel tube: (a) cross-section (unit: mm); (b) mesh generation.
Symmetry 15 00805 g002
Figure 3. Dispersion curves of square steel tube: (a) phase velocity; (b) group velocity.
Symmetry 15 00805 g003
Figure 4. Wave structure for various points of the section: (a) the first mode; (b) the second mode; (c) the fifth mode; (d) the sixth mode.
Symmetry 15 00805 g004
Figure 5. The propagation path of UGWs under unilateral excitation: (a) without damage; (b) with damage.
Symmetry 15 00805 g005
Figure 6. The propagation path of UGWs under symmetric excitation: (a) without damage; (b) with damage.
Symmetry 15 00805 g006
Figure 7. Finite element model of square steel tube: (a) square steel tube model; (b) cross-section meshing.
Symmetry 15 00805 g007
Figure 8. Sensor layout diagram: (a) the long edge; (b) the short edge.
Symmetry 15 00805 g008
Figure 9. Typical five-cycle excitation signal.
Symmetry 15 00805 g009
Figure 10. Displacement field of guided wave in long edge: (a) 60 μs; (b) 200 μs; (c) 400 μs; (d) 600 μs.
Symmetry 15 00805 g010
Figure 11. Signal received from the symmetrically arranged receiving sensor under symmetric excitation: (a) received signal on one side; (b) received signal of the symmetrical position.
Symmetry 15 00805 g011
Figure 12. 2D-FFT identification result: (a) long edge; (b) short edge.
Symmetry 15 00805 g012
Figure 13. Hole damage in square steel tube model.
Symmetry 15 00805 g013
Figure 14. Guided wave propagation in damaged square steel tube: (a) 240 ms; (b) 440 ms; (c) 600 ms.
Symmetry 15 00805 g014
Figure 15. Difference signals in the simulation: (a) 2 cm crack; (b) 3 cm crack; (c) 4 cm crack.
Symmetry 15 00805 g015
Figure 16. Experimental system diagram.
Symmetry 15 00805 g016
Figure 17. Experimental setup.
Symmetry 15 00805 g017
Figure 18. Undamaged signals from short edge: (a) signal at one path; (b) symmetrical position signal; (c) difference signal.
Symmetry 15 00805 g018
Figure 19. Schematic diagram of crack.
Symmetry 15 00805 g019
Figure 20. Schematic diagram of round hole position: (a) middle hole; (b) offset hole; (c) corner hole.
Symmetry 15 00805 g020
Figure 21. Crack damage identification for long edge: (a) 2 cm; (b) 3 cm; (c) 4 cm.
Symmetry 15 00805 g021
Figure 22. Crack damage identification for short edge: (a) 2 cm; (b) 3 cm; (c) 4 cm.
Symmetry 15 00805 g022
Figure 23. Hole damage identification on long edge: (a) middle hole; (b) offset hole; (c) corner hole.
Symmetry 15 00805 g023
Figure 24. Hole damage identification on short edge: (a) middle hole; (b) offset hole; (c) corner hole.
Symmetry 15 00805 g024
Figure 25. Modified sensor layout diagram.
Symmetry 15 00805 g025
Figure 26. Corner hole damage identification (in the long edge).
Symmetry 15 00805 g026
Figure 27. Multiple corner holes damage identification (on the long edge).
Symmetry 15 00805 g027
Table 1. Damage cases (crack damage).
Case No.Crack Length (cm)PositionTube Length (m)Defect Location (m)
12Long edge21
2Short edge21
33Long edge21
4Short edge21
54Long edge21
6Short edge21
Table 2. Damage cases (hole damage).
Case No.Damage LocationPositionTube Length (m)Defect Location (m)
7Middle holeLong edge31.5
8Short edge32
9Offset holeLong edge21.5
10Short edge21
11Corner holeLong edge21.5
12Short edge21
Table 3. Damage location results (crack damage).
Case No.Time
Difference (s)
Tube Length (m)Identified Defect
Location (m)
Actual Defect
Location (m)
Inspection
Error
186821.0918.98%
284321.01511.51%
386921.09119.11%
484421.01611.63%
586821.0918.98%
684421.01611.63%
Table 4. Damage location results (hole damage).
Case No.Time
Difference (s)
Tube Length (m)Identified Defect
Location (m)
Actual Defect
Location (m)
Inspection
Error
7123231.5431.52.84%
8164231.96821.62%
9125821.5751.55.00%
1083721.00810.79%
11138321.7311.515.37%
1297421.171117.13%
Disclaimer/Publisher’s Note: The statements, opinions and data contained in all publications are solely those of the individual author(s) and contributor(s) and not of MDPI and/or the editor(s). MDPI and/or the editor(s) disclaim responsibility for any injury to people or property resulting from any ideas, methods, instructions or products referred to in the content.

