Article

Carrier-Envelope Phase-Controlled Residual Current in Semiconductors

1
Department of Applied Physics, Nanjing University of Science and Technology, Nanjing 210094, China
2
State Key Laboratory of Molecular Reaction Dynamics, Dalian Institute of Chemical Physics, Chinese Academy of Sciences, Dalian 116023, China
*
Authors to whom correspondence should be addressed.
Symmetry 2023, 15(4), 784; https://doi.org/10.3390/sym15040784
Submission received: 23 February 2023 / Revised: 19 March 2023 / Accepted: 21 March 2023 / Published: 23 March 2023
(This article belongs to the Special Issue Symmetry in Strong-Field Physics)

Abstract

:
With the purpose of achieving current control by using intense laser field manipulation, we investigate the effect of carrier-envelope phase (CEP) on residual current in SiO2 crystals. By solving semiconductor Bloch equations, we found that the CEP can strongly influence the carrier population of the conduction band, which means that it can act as a simple, but useful, tool to control residual current. That is, the resultant asymmetric distribution in the first Brillouin zone gave rise to non-zero residual current. Additionally, we further consider the two-color laser scheme to achieve better control of residual current, showing that asymmetric two-color laser fields can induce the maximum residual current.

1. Introduction

Since the early studies of Zener [1] and Keldysh [2], the interaction between intense laser field and crystalline solids has become a hotspot of optics, many-body physics, and materials science. In the past two decades, intense field interactions driven by few-cycle light pulses [3] have allowed the electronic responses of crystalline solids to be controlled and measured within an optical cycle, i.e., a notably short timescale [4,5]. These non-perturbative nonlinear optical effects, such as above-threshold ionization [6] and high-order harmonic generation [7,8,9,10], spawn extreme ultraviolet (XUV) light pulses lasting less than 1 fs [11]. The advances in the nonperturbative or extreme nonlinear regime provide a broad range of possibilities for researchers to conduct all-optical strong-field and sub-cycle probes of electronic structures and dynamics in complex materials, such as the reconstruction of band structure [12] and berry curvature [13], and picometre-scale imaging of valence electrons [14]. Recently, the study of extreme photonics has advanced to the area of two-dimensional materials [15,16,17,18,19,20,21,22], topological materials [23,24], strongly correlated systems [25,26], liquids [27,28], and clusters [29,30]. Benefiting from these ultrashort-time-resolution tools, new methods can be expanded to obtain better electrical signal control in dielectrics, of course by means of oscillating laser field manipulation [31]. One of the most common ways of manipulating laser fields is the regulation of the carrier-envelope phase (CEP) [32,33], on which the sub-cycle light-induced processes depend in non-resonant circumstances.
In the meantime, the CEP controllability is still applicable in resonant circumstances [34]. It is usually studied in the context of carrier-wave Rabi flopping (CWRF) [35,36,37], where the motion of charge carriers within bands has been neglected in earlier studies [36]. Later, in Michael S. Wismer’s work [35], the carriers’ intraband motion was involved in the model, because its effect on dynamic processes is quite strong in intense laser fields. On the basis of these studies, a new possibility that we can control electric currents in a short timescale in semiconductors shows up: CEP modulation. Moreover, taking advantage of the CEP stabilization and measurement technology [32,38], there are relevant experiments that can study the relationship between CEP and the optical properties of semiconductors, which offer a solid foundation for these theories. Thus, we focus on the electric signal, i.e., the light-induced residual current in semiconductors, which has been proven to be sensitive to the driving laser’s CEP and intensity [35].
Here, the light-induced residual current is investigated theoretically by solving two-band semiconductor Bloch equations (SBEs) [16,39,40]. Due to a certain accuracy demand on SBE calculation [41], the band structure we used and the respective k-dependent dipole moments of our target semiconductor, the α-quartz SiO2 crystal, were calculated by using the Vienna ab initio simulation package (VASP) [42]. As a widespread type of insulator, α-quartz SiO2 has been usually studied in pioneering studies [41,43,44]. In this paper, we primarily use CEP modulation to control the residual current of α-quartz SiO2 after intense femtosecond laser irradiation. We estimate the residual current by the k-dependent charge population distribution of the conduction band [9], with full consideration of both carriers’ interband transition and intraband motion. We show the residual current’s CEP sensitivity and then demonstrate that the asymmetric distribution of the charge population results in considerable residual current. In addition, the effect of the dephasing time T2 is also taken into account. In the final part, we show the optimal result of residual current by using asymmetric two-color laser pulses. The paper is organized as follows. Section 2 contains the theoretical model pertinent to this work. The band structure and dipole moment of the α-quartz SiO2 are also shown in this section. In Section 3, the data calculated from SBEs and the analysis of the results are presented. Section 4 concludes the paper and provides an outlook.

2. Theoretical Model

As we mentioned above, in this work, the theoretical model is based on the solutions of two-band SBEs [45,46,47,48,49,50,51]. Hereafter, the atomic units are used by convention, unless indicated otherwise. The laser polarization orientation is set along the Γ–M direction of the reciprocal lattice of the α-quartz SiO2 crystal. The two-band SBEs that describe the coupled interband and intraband dynamics of the SiO2 crystal along the Γ–M direction read:
i t p k = ε c k ε v k i T 2 p k f k c f k v d k E t + i e E ( t ) k p k ,
t f k c ( v ) = 2 Im d k E t p k * + e E ( t ) k f k c ( v ) .
where f k c and f k v are the populations of the lowest conduction band and the highest valence band, respectively, and their band structures are displayed in Figure 1a. The initial hypothesis is that the electrons are filled into the valence band. p k is the microscopic interband polarization between the conduction band and the valence band. T 2 is the dephasing time and E ( t ) is the laser field. ε c k and ε v k are the k-dependent energy bands of the lowest conduction band and the highest valence band, respectively, calculated using VASP software and fitted with the function ε n k = i = 0 α n ( i ) cos ( i k a ) , in which a is the lattice constant along the Γ–M direction that is set as 7.917 a.u. d k is the dipole moment, as shown in Figure 1b. The expression of the dipole moment is:
d ( k ) = i ϕ c ( k ) p ^ ϕ v ( k ) ε c k ε v ( k ) ,
where ϕ i ( k ) is the normalized wave function of each k point in a given band i. As both the interband transition and the intraband motion of carriers are considered in our model, here, we show the macroscopic interband polarization P(t) and the intraband electric current J t :
i P t = B Z d k p k t + c . c . d k ,
J t = λ B Z e v i ( k ) f k i ( t ) d k .
where v i ( k ) is the group velocity generated from the derivative of the bands and i is the band index.
Because v i k = 1 k E i ( k ) , the group velocity in band i is only decided by the band structure. The residual current density, expressed as
J t m a x = 2 e 2 π 3 i B Z d 3 k n i k , t m a x e ^ v i k ,
is directly relevant to n i ( k , t max ) , the carrier population of band i. As a result, we substitute the residual current density with the residual population, which is more straightforward and easier to solve physical quantity to present the temporal evolution of electronic excitation in our simulations. By solving the length–gauge optical Bloch equations [10,47], we obtain the derivative of the system’s density matrix ρ i j :
t ρ i j = δ i j 1 T 2 + i ( E i E j ) ρ i j + 1 F ( t ) ( e k ρ i j i d ^ , ρ ^ i j ) .
where ρ ( k , t ) is a density matrix, the diagonal elements of which are dimensionless probabilities to find a carrier with crystal momentum k in band i, i.e., the carrier population of band i: n i k , t = ρ i i ( k , t ) . If we set the time as , then n i k , = ρ i i ( k , ) is the residual carrier population in band i. In the next part, we will use it to discuss the CEP controllability of the residual electric current.

3. Results

Figure 2 shows the electric field profile and the vector potential of a representative infrared driving laser with a CEP of φ C E P = 0 . The laser field is expressed as:
E t = E f t t 0 cos ω t t 0 + ϕ ,
where E is the peak intensity and f t t 0 is the laser envelope. ϕ represents the CEP and t 0 is the center of the laser field. The full width at half maximum (FWHM) of the driving laser is 6 fs, the wavelength is 800 nm, and the peak intensity values are 1.0 × 10¹² W/cm2, 3.0 × 10¹² W/cm2, and 5.0 × 10¹² W/cm2. The peak intensity of the laser field shown in Figure 2 is 5 × 10¹² W/cm2 (about 0.012 a.u.). Among these intensity values, even the maximum value did not reach the damage threshold of SiO2 under such a short pulse.
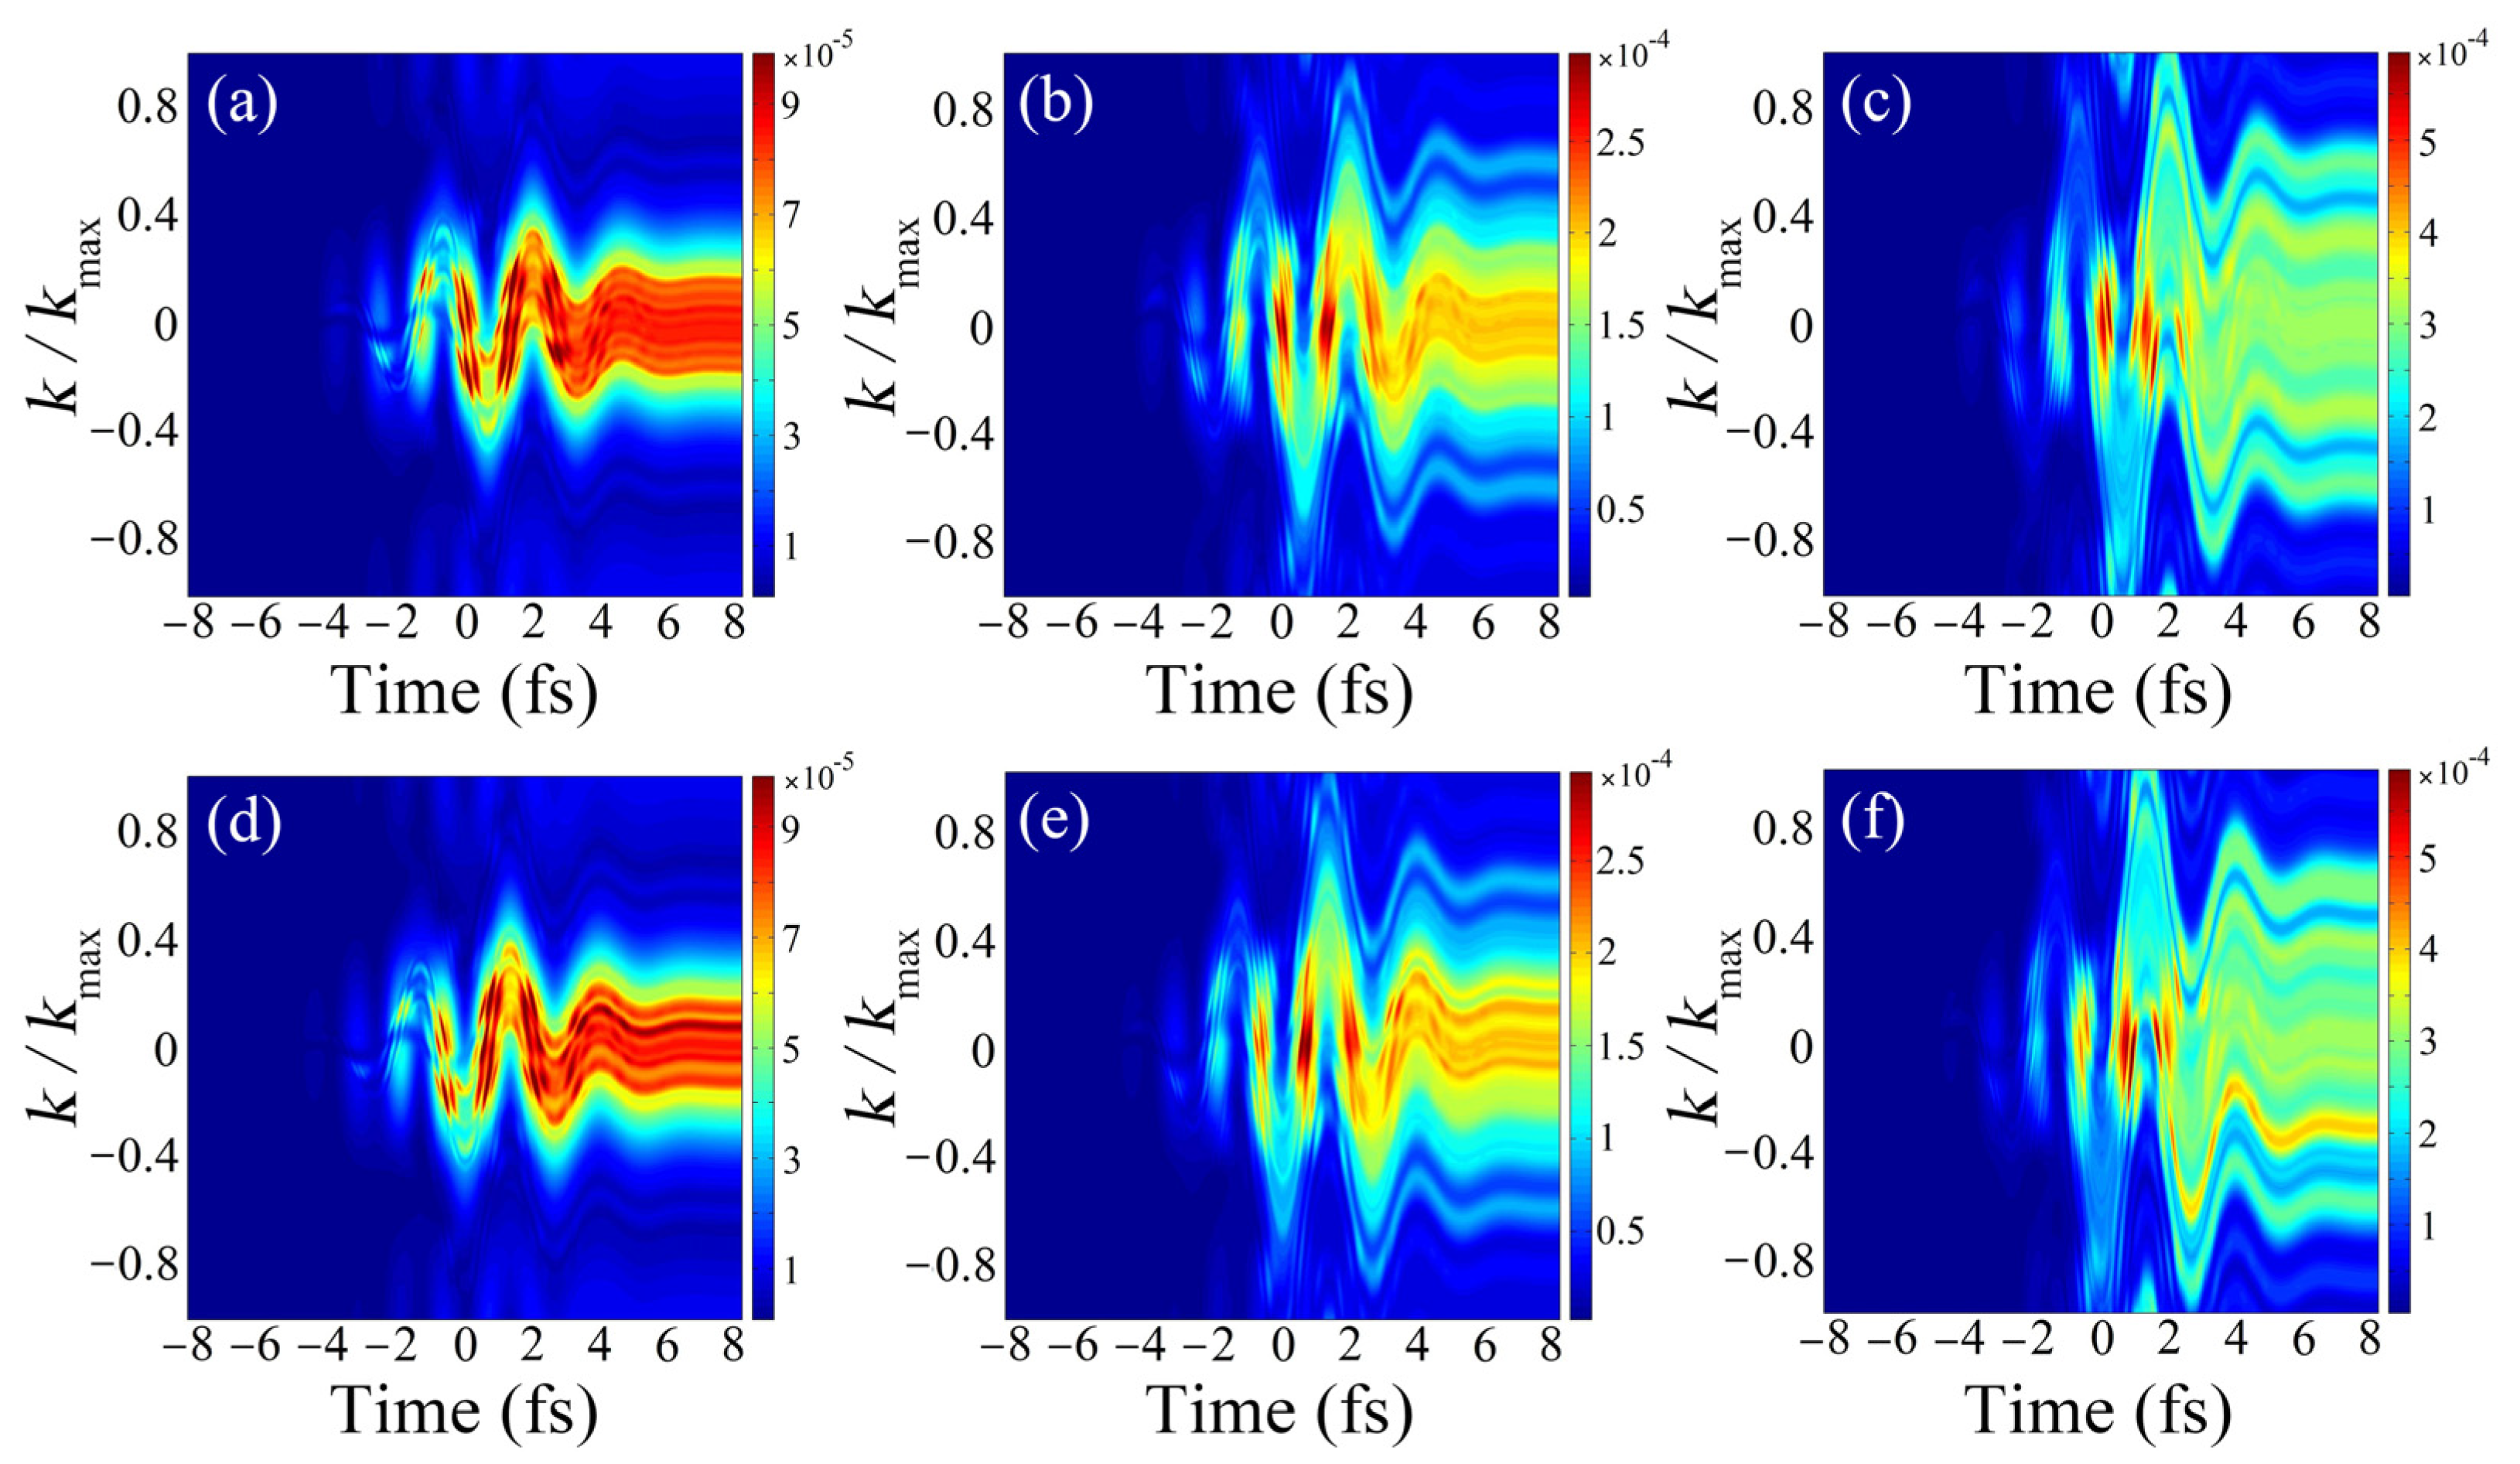
First, we stand on the angle of the population’s temporal evolution of the conduction band. Given that the CEP-sensitive light-induced processes are in sub-cycles, we start with the T2 = 2.7 fs dephasing time, i.e., the dephasing time is half of the optical cycle of the fundamental laser field. According to [31], when solids are excited by short and strong laser pulses, a resonant process named kicked anharmonic Rabi oscillation (KARO) occurs twice per optical cycle, causing strongly anharmonic (non-sinusoidal in time) Rabi oscillations. The repeating kicks excite the population oscillations in the conduction band during times when electrons transit from the valence band to the conduction band through the energy gap region near the Γ point. As a consequence, so as to capture a full image of each kick process, we use the T2 = 2.7 fs case for comparison, which is displayed in Figure 3. As we can see, the population in the conduction band oscillates following the laser field. Electron–hole wave packets, originating from the electron’s KARO process, excited by different half-cycles interfering with each other. It is distinct that, with the increment of the laser intensity, the temporal k-dependent current distribution, as well as the residual distribution of the carrier population, are more widely expanded in the first Brillouin zone. More importantly, the asymmetric distribution emerges in the antisymmetric pulse ( φ C E P = π / 2 ) case. In panel (d), the peak residual population emerges in the k > 0 region. In panels (e) and (f), it emerges in the k < 0 region. These findings demonstrate the generation of non-zero residual current by the effect of one kick.
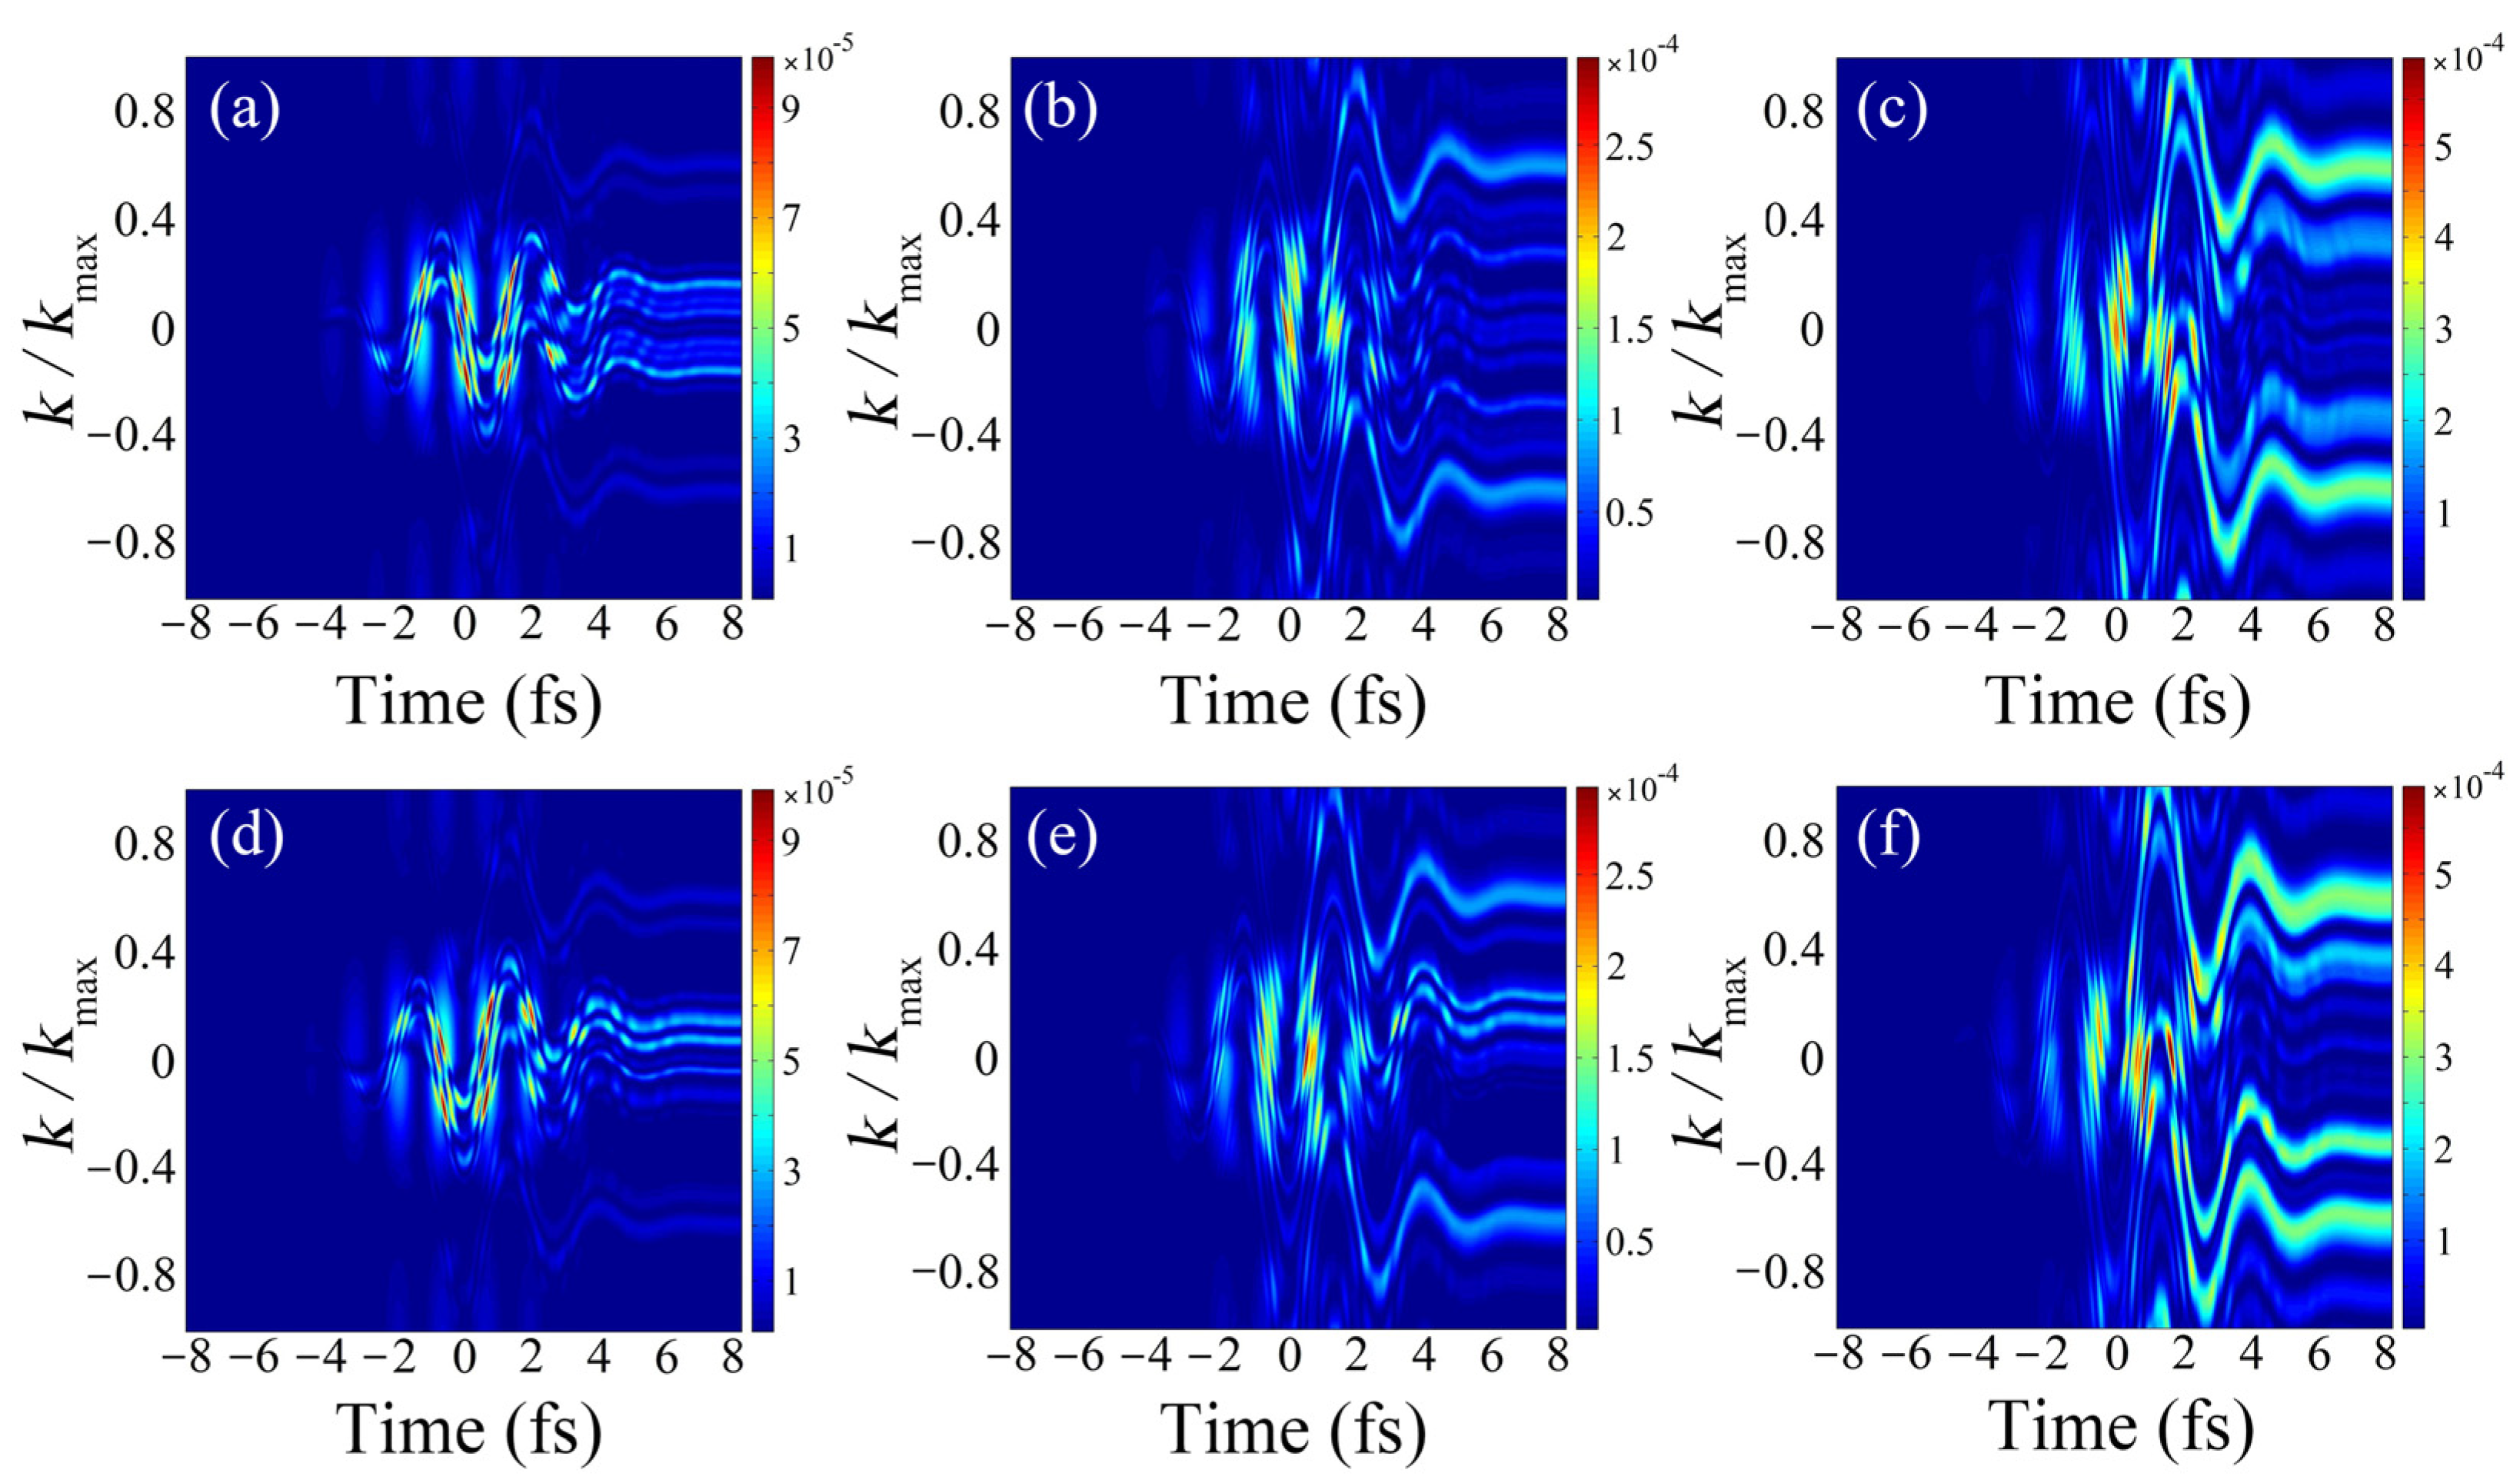
We next analyze the T2 = case and compare it with the T2 = 2.7 fs case. The dephasing time represents the time of the coupling process between different electronic states. The longer the dephasing time, the more slowly the off-diagonal elements of the electronic reduce density matrix decay, which implies a longer coupling process. In Figure 4 for T2 = , we can see the same oscillation phenomenon as that in the T2 = 2.7 fs case. Apparently, the propagation process causes a decrement in the population intensity, but the decrement is no more than one magnitude. Nevertheless, under these low-population-intensity circumstances, the structure of the population distribution became clearer while we set the color bars comparable in Figure 4. According to the expansion distribution with laser intensity’s increment, the symmetric and asymmetric distributions in different CEP cases are still visible. From the clearer population distribution structure, the asymmetric current population distribution in ±k still causes non-zero residual current. Note that, by comparing these two dephasing time cases, the difference between the maximum and the minimum residual population values in each case decreases with the increment in the dephasing time. Here, we can draw the same conclusion as that in [31]: the dephasing tends to reduce the magnitude of the residual current.
Based on the result that the asymmetric laser pulse can induce a non-zero residual current, now we go deep into the residual current’s CEP sensibility by continuously changing φ C E P . Figure 5 reveals the law that the conduction band’s residual population changes with the variation in CEP. For highly symmetric φ C E P cases, such as φ C E P = 0 , π and 2 π , the k-resolved population distribution is also symmetric. On the contrary, for highly asymmetric φ C E P cases, such as φ C E P = π / 2 , 3 π / 2 , the k-resolved population distribution reaches the most asymmetric case; that is to say, the residual current reaches the culmination. Thus, the asymmetric pulses rearrange the residual distribution of carriers in the conduction band. We defined a ratio to represent the symmetry of the residual current population: A = J + J J + + J , where J + = 0 k m a x j k d k and J = k m a x 0 j k d k , where j ( k ) is the residual current at k in the Brillouin zone. As seen from the lower panels in Figure 5, ratio A changes its sign following a sinusoidal function curve, and the modulation of the ratio values as a function of CEP clearly becomes weaker with an increase in the laser intensity. The higher the laser intensity is, the more dominant the residual current in large k regions; therefore, the more symmetric the residual current population will be. When the laser intensity increases to 5.0 × 10¹² W/cm2, ratio A is close to zero, with its variation trend being opposite to that of other lower laser intensities, and the residual current in Figure 5c is mainly distributed at k = ±0.58kmax, which matches the position of the minimum of the transition dipole moment; therefore, the excited carrier can travel across the boundaries of the Brillouin zone, which makes the dynamical Bloch oscillation become possible. Here, please note that A = 0.5 means a completely asymmetric residual current population.
Particularly for the laser intensity of 5.0 × 10¹² W/cm2, we optimized the residual current by using a two-color laser field, which is expressed as
E t = E 1 f 1 t t 0 cos ω 1 t t 0 + ϕ 1 + E 2 f 2 t t 0 cos ω 2 t t 0 + ϕ 2 .
Here, we chose the first color laser with the FWHM of 6 fs, peak intensity I1 = 5.0 × 10¹² W/cm2), and CEP ϕ 1 = 0 , and the weaker second color laser with the FWHM of 6 fs, peak intensity I2 = 1.0 × 10¹¹ W/cm2, and CEP ϕ 2 = π / 2 . ϕ 2 can be also considered as the relative phase between the first color laser and the second color laser. The wavelength of the first color laser is 800 nm, and the wavelengths of the second color laser in Figure 6a–c are 400 nm, 200 nm, and 100 nm, respectively. Clearly, with the decrement of the wavelength of the second color laser, the symmetry ratio A increases. In these two-color laser fields, the main part of the carrier population is settled on one side of the first Brillouin zone. This means that at least an essential rearrangement of the residual carrier exists in every case. In panels (a) and (b), even though an obvious rearrangement has already been realized, there still exists a proportion of carriers spreading to the other side. The case of panel (c) is a significant rearrangement of the residual population on the conduction band in the first Brillouin zone: when ϕ 2 = π / 2 and ϕ 2 = 3 π / 2 (the asymmetric cases), the absolute values of ratio A approach 0.5, and the residual carriers are mostly distributed at one side of the first Brillouin zone.

4. Conclusions

In summary, we investigated the CEP sensitivity of the residual current on the lowest conduction band. It was proven that, in the asymmetric laser field case, i.e., φ C E P = π / 2 , 3 π / 2 in the single-color laser field, or when the phase difference between two-color lasers is π / 2 , resonances emerging from interfering kicks manifest themselves in the highly asymmetric carrier population in the first Brillouin zone, which induces the non-zero residual current in the lowest conduction band. Altogether, this offers us a new kind of tool that belongs to simple laser manipulation in order to control the residual current. Remarkably, the residual current can be detected through accompanying terahertz radiation [31] in experiments, so we expect that a skillful control of the residual current can be accomplished by ultrafast intense laser technology. At the same time, the technology of controlling residual current also provides a new possibility that enables the probe of the CEP of few-cycle laser pulses.

Author Contributions

Conceptualization, R.L. and C.Y.; methodology, C.Y.; software, C.Y. and T.W.; validation, C.Y. and R.L.; formal analysis, T.W. and Z.W.; investigation, C.Y.; resources, R.L.; data curation, T.W. and C.Y.; writing—original draft preparation, T.W., X.Z., and G.Y.; writing—review and editing, T.W., C.Y. and R.L.; visualization, G.Y. and Z.W.; supervision, R.L.; project administration, R.L.; funding acquisition, C.Y. and R.L. All authors have read and agreed to the published version of the manuscript.

Funding

This research was supported by the National Key Research and Development Program of China (No. 2022YFA1604301), NSF of China Grant (No. 12174195, 11974185, 11834004, and 11704187), Fundamental Research Funds for the Central Universities (No. 30920021153) and the Project funded by China Postdoctoral Science Foundation (Grant No. 2019M661841).

Data Availability Statement

Not applicable.

Conflicts of Interest

The authors declare no conflict of interest. The funders had no role in the design of the study; in the collection, analyses, or interpretation of data; in the writing of the manuscript; or in the decision to publish the results.

References

  1. Zener, C. A Theory of the Electrical Breakdown of Solid Dielectrics. Proc. R. Soc. Lond. A 1934, 145, 523–529. [Google Scholar] [CrossRef] [Green Version]
  2. Keldysh, L.V. Behavior of Non-Metallic Crystals in Strong Electric Fields. Sov. Phys. JETP 1958, 6, 763–770. [Google Scholar]
  3. Brabec, T.; Krausz, F. Intense Few-Cycle Laser Fields: Frontiers of Nonlinear Optics. Rev. Mod. Phys. 2000, 72, 545–591. [Google Scholar] [CrossRef]
  4. Ghimire, S.; DiChiara, A.D.; Sistrunk, E.; Agostini, P.; DiMauro, L.F.; Reis, D.A. Observation of High-Order Harmonic Generation in a Bulk Crystal. Nat. Phys. 2011, 7, 138–141. [Google Scholar] [CrossRef]
  5. Schultze, M.; Ramasesha, K.; Pemmaraju, C.D.; Sato, S.A.; Whitmore, D.; Gandman, A.; Prell, J.S.; Borja, L.J.; Prendergast, D.; Yabana, K.; et al. Attosecond Band-Gap Dynamics in Silicon. Science 2014, 346, 1348–1352. [Google Scholar] [CrossRef]
  6. Agostini, P.; Fabre, F.; Mainfray, G.; Petite, G.; Rahman, N.K. Free-Free Transitions Following Six-Photon Ionization of Xenon Atoms. Phys. Rev. Lett. 1979, 42, 1127–1130. [Google Scholar] [CrossRef]
  7. Vampa, G.; Hammond, T.J.; Thiré, N.; Schmidt, B.E.; Légaré, F.; McDonald, C.R.; Brabec, T.; Corkum, P.B. Linking High Harmonics from Gases and Solids. Nature 2015, 522, 462–464. [Google Scholar] [CrossRef]
  8. Hohenleutner, M.; Langer, F.; Schubert, O.; Knorr, M.; Huttner, U.; Koch, S.W.; Kira, M.; Huber, R. Real-Time Observation of Interfering Crystal Electrons in High-Harmonic Generation. Nature 2015, 523, 572–575. [Google Scholar] [CrossRef] [Green Version]
  9. Luu, T.T.; Garg, M.; Kruchinin, S.Y.; Moulet, A.; Hassan, M.T.; Goulielmakis, E. Extreme Ultraviolet High-Harmonic Spectroscopy of Solids. Nature 2015, 521, 498–502. [Google Scholar] [CrossRef]
  10. Schubert, O.; Hohenleutner, M.; Langer, F.; Urbanek, B.; Lange, C.; Huttner, U.; Golde, D.; Meier, T.; Kira, M.; Koch, S.W.; et al. Sub-Cycle Control of Terahertz High-Harmonic Generation by Dynamical Bloch Oscillations. Nat. Photonics 2014, 8, 119–123. [Google Scholar] [CrossRef] [Green Version]
  11. Hentschel, M.; Kienberger, R.; Spielmann, C.; Reider, G.A.; Milosevic, N.; Brabec, T.; Corkum, P.; Heinzmann, U.; Drescher, M.; Krausz, F. Attosecond Metrology. Nature 2001, 414, 509–513. [Google Scholar] [CrossRef] [PubMed]
  12. Vampa, G.; Hammond, T.J.; Thiré, N.; Schmidt, B.E.; Légaré, F.; McDonald, C.R.; Brabec, T.; Klug, D.D.; Corkum, P.B. All-Optical Reconstruction of Crystal Band Structure. Phys. Rev. Lett. 2015, 115, 193603. [Google Scholar] [CrossRef] [PubMed] [Green Version]
  13. Luu, T.T.; Wörner, H.J. Measurement of the Berry Curvature of Solids Using High-Harmonic Spectroscopy. Nat. Commun. 2018, 9, 916. [Google Scholar] [CrossRef] [PubMed] [Green Version]
  14. Lakhotia, H.; Kim, H.Y.; Zhan, M.; Hu, S.; Meng, S.; Goulielmakis, E. Laser Picoscopy of Valence Electrons in Solids. Nature 2020, 583, 55–59. [Google Scholar] [CrossRef] [PubMed]
  15. Liu, H.; Li, Y.; You, Y.S.; Ghimire, S.; Heinz, T.F.; Reis, D.A. High-Harmonic Generation from an Atomically Thin Semiconductor. Nat. Phys. 2017, 13, 262–265. [Google Scholar] [CrossRef]
  16. Yoshikawa, N.; Tamaya, T.; Tanaka, K. High-Harmonic Generation in Graphene Enhanced by Elliptically Polarized Light Excitation. Science 2017, 356, 736–738. [Google Scholar] [CrossRef]
  17. Yu, C.; Jiang, S.; Wu, T.; Yuan, G.; Wang, Z.; Jin, C.; Lu, R. Two-Dimensional Imaging of Energy Bands from Crystal Orientation Dependent Higher-Order Harmonic Spectra in h—BN. Phys. Rev. B 2018, 98, 085439. [Google Scholar] [CrossRef]
  18. Tancogne-Dejean, N.; Rubio, A. Atomic-like High-Harmonic Generation from Two-Dimensional Materials. Sci. Adv. 2018, 4, eaao5207. [Google Scholar] [CrossRef] [Green Version]
  19. Yu, C.; Jiang, S.; Wu, T.; Yuan, G.; Peng, Y.; Jin, C.; Lu, R. Higher Harmonic Generation from Bilayer Nanostructures Assisted by Electron Backscattering. Phys. Rev. B 2020, 102, 241407. [Google Scholar] [CrossRef]
  20. Kobayashi, Y.; Heide, C.; Kelardeh, H.K.; Johnson, A.; Liu, F.; Heinz, T.F.; Reis, D.A.; Ghimire, S. Polarization Flipping of Even-Order Harmonics in Monolayer Transition-Metal Dichalcogenides. Ultrafast Sci. 2021, 2021, 1–9. [Google Scholar] [CrossRef]
  21. Yao, H.-D.; Cui, B.; Ma, S.-Q.; Yu, C.; Lu, R.-F. Enhancing high harmonic generation in bilayer MoS2 by interlayer atomic dislocation. Acta Phys. Sin. 2021, 70, 134207. [Google Scholar] [CrossRef]
  22. Wu, T.; Yuan, G.; Zhang, X.; Wang, Z.; Yi, Z.; Yu, C.; Lu, R. Effect of Stacking Configuration on High Harmonic Generation from Bilayer Hexagonal Boron Nitride. Opt. Express 2023, 31, 9817–9826. [Google Scholar] [CrossRef]
  23. Bai, Y.; Fei, F.; Wang, S.; Li, N.; Li, X.; Song, F.; Li, R.; Xu, Z.; Liu, P. High-Harmonic Generation from Topological Surface States. Nat. Phys. 2021, 17, 311–315. [Google Scholar] [CrossRef]
  24. Qian, C.; Yu, C.; Jiang, S.; Zhang, T.; Gao, J.; Shi, S.; Pi, H.; Weng, H.; Lu, R. Role of Shift Vector in High-Harmonic Generation from Noncentrosymmetric Topological Insulators under Strong Laser Fields. Phys. Rev. X 2022, 12, 021030. [Google Scholar] [CrossRef]
  25. Hansen, T.; Jensen, S.V.B.; Madsen, L.B. Correlation Effects in High-Order Harmonic Generation from Finite Systems. Phys. Rev. A 2022, 105, 053118. [Google Scholar] [CrossRef]
  26. Shao, C.; Lu, H.; Zhang, X.; Yu, C.; Tohyama, T.; Lu, R. High-Harmonic Generation Approaching the Quantum Critical Point of Strongly Correlated Systems. Phys. Rev. Lett. 2022, 128, 047401. [Google Scholar] [CrossRef]
  27. Luu, T.T.; Yin, Z.; Jain, A.; Gaumnitz, T.; Pertot, Y.; Ma, J.; Wörner, H.J. Extreme–Ultraviolet High–Harmonic Generation in Liquids. Nat. Commun. 2018, 9, 3723. [Google Scholar] [CrossRef] [Green Version]
  28. Zeng, A.; Bian, X. Impact of Statistical Fluctuations on High Harmonic Generation in Liquids. Phys. Rev. Lett. 2020, 124, 203901. [Google Scholar] [CrossRef]
  29. Peng, Y.; Wu, T.; Yuan, G.; Chi, L.; Jiang, S.; Dorfman, K.; Yu, C.; Lu, R. Solid State–like High Harmonic Generation from Cluster Molecules with Rotational Periodicities. Sci. Adv. 2023, 9, eadd6810. [Google Scholar] [CrossRef]
  30. Neufeld, O.; Nourbakhsh, Z.; Tancogne-Dejean, N.; Rubio, A. Ab Initio Cluster Approach for High Harmonic Generation in Liquids. J. Chem. Theory Comput. 2022, 18, 4117–4126. [Google Scholar] [CrossRef]
  31. Schultze, M.; Bothschafter, E.M.; Sommer, A.; Holzner, S.; Schweinberger, W.; Fiess, M.; Hofstetter, M.; Kienberger, R.; Apalkov, V.; Yakovlev, V.S.; et al. Controlling Dielectrics with the Electric Field of Light. Nature 2013, 493, 75–78. [Google Scholar] [CrossRef] [PubMed]
  32. Jones, D.J.; Diddams, S.A.; Ranka, J.K.; Stentz, A.; Windeler, R.S.; Hall, J.L.; Cundiff, S.T. Carrier-Envelope Phase Control of Femtosecond Mode-Locked Lasers and Direct Optical Frequency Synthesis. Science 2000, 288, 635–639. [Google Scholar] [CrossRef] [Green Version]
  33. Krausz, F.; Stockman, M.I. Attosecond Metrology: From Electron Capture to Future Signal Processing. Nat. Photonics 2014, 8, 205–213. [Google Scholar] [CrossRef]
  34. Hughes, S. Breakdown of the Area Theorem: Carrier-Wave Rabi Flopping of Femtosecond Optical Pulses. Phys. Rev. Lett. 1998, 81, 3363. [Google Scholar] [CrossRef]
  35. Wismer, M.S.; Kruchinin, S.Y.; Ciappina, M.; Stockman, M.I.; Yakovlev, V.S. Strong-Field Resonant Dynamics in Semiconductors. Phys. Rev. Lett. 2016, 116, 197401. [Google Scholar] [CrossRef] [PubMed] [Green Version]
  36. Mücke, O.D.; Tritschler, T.; Wegener, M.; Morgner, U.; Kärtner, F.X. Signatures of Carrier-Wave Rabi Flopping in GaAs. Phys. Rev. Lett. 2001, 87, 057401. [Google Scholar] [CrossRef] [Green Version]
  37. Cundiff, S.T.; Knorr, A.; Feldmann, J.; Koch, S.W.; Göbel, E.O.; Nickel, H. Rabi Flopping in Semiconductors. Phys. Rev. Lett. 1994, 73, 1178–1181. [Google Scholar] [CrossRef]
  38. Mücke, O.D.; Tritschler, T.; Wegener, M.; Morgner, U.; Kärtner, F.X.; Khitrova, G.; Gibbs, H.M. Carrier-Wave Rabi Flopping: Role of the Carrier-Envelope Phase. Opt. Lett. 2004, 29, 2160–2162. [Google Scholar] [CrossRef] [Green Version]
  39. McDonald, C.R.; Vampa, G.; Corkum, P.B.; Brabec, T. Interband Bloch Oscillation Mechanism for High-Harmonic Generation in Semiconductor Crystals. Phys. Rev. A 2015, 92, 033845. [Google Scholar] [CrossRef] [Green Version]
  40. Xiang, Y.; Niu, Y.; Gong, S. Control of the High-Order Harmonics Cutoff through the Combination of a Chirped Laser and Static Electric Field. Phys. Rev. A 2009, 79, 053419. [Google Scholar] [CrossRef] [Green Version]
  41. Yu, C.; Zhang, X.; Jiang, S.; Cao, X.; Yuan, G.; Wu, T.; Bai, L.; Lu, R. Dependence of High-Order-Harmonic Generation on Dipole Moment in SiO2 Crystals. Phys. Rev. A 2016, 94, 013846. [Google Scholar] [CrossRef]
  42. Kresse, G.; Furthmüller, J. Efficient Iterative Schemes for Ab Initio Total-Energy Calculations Using a Plane-Wave Basis Set. Phys. Rev. B 1996, 54, 11169–11186. [Google Scholar] [CrossRef] [PubMed]
  43. Schiffrin, A.; Paasch-Colberg, T.; Karpowicz, N.; Apalkov, V.; Gerster, D.; Mühlbrandt, S.; Korbman, M.; Reichert, J.; Schultze, M.; Holzner, S.; et al. Optical-Field-Induced Current in Dielectrics. Nature 2013, 493, 70–74. [Google Scholar] [CrossRef]
  44. Jiang, S.; Yu, C.; Yuan, G.; Wu, T.; Wang, Z.; Lu, R. Quantum-Trajectory Analysis for Charge Transfer in Solid Materials Induced by Strong Laser Fields. J. Phys. Condens. Matter 2017, 29, 275702. [Google Scholar] [CrossRef] [PubMed] [Green Version]
  45. Yu, C.; Jiang, S.; Lu, R. High Order Harmonic Generation in Solids: A Review on Recent Numerical Methods. Adv. Phys. X 2019, 4, 1562982. [Google Scholar] [CrossRef]
  46. Golde, D.; Meier, T.; Koch, S.W. Microscopic Analysis of Extreme Nonlinear Optics in Semiconductor Nanostructures. J. Opt. Soc. Am. B 2006, 23, 2559–2565. [Google Scholar] [CrossRef]
  47. Golde, D.; Meier, T.; Koch, S.W. High Harmonics Generated in Semiconductor Nanostructures by the Coupled Dynamics of Optical Inter- and Intraband Excitations. Phys. Rev. B 2008, 77, 075330. [Google Scholar] [CrossRef]
  48. Golde, D.; Kira, M.; Meier, T.; Koch, S.W. Microscopic Theory of the Extremely Nonlinear Terahertz Response of Semiconductors. Phys. Stat. Sol. 2011, 248, 863–866. [Google Scholar] [CrossRef]
  49. Földi, P.; Benedict, M.G.; Yakovlev, V.S. The Effect of Dynamical Bloch Oscillations on Optical-Field-Induced Current in a Wide-Gap Dielectric. New J. Phys. 2013, 15, 063019. [Google Scholar] [CrossRef]
  50. Jiang, S.; Wei, H.; Chen, J.; Yu, C.; Lu, R.; Lin, C.D. Effect of Transition Dipole Phase on High-Order-Harmonic Generation in Solid Materials. Phys. Rev. A 2017, 96, 053850. [Google Scholar] [CrossRef] [Green Version]
  51. Jiang, S.; Chen, J.; Wei, H.; Yu, C.; Lu, R.; Lin, C.D. Role of the Transition Dipole Amplitude and Phase on the Generation of Odd and Even High-Order Harmonics in Crystals. Phys. Rev. Lett. 2018, 120, 253201. [Google Scholar] [CrossRef] [PubMed] [Green Version]
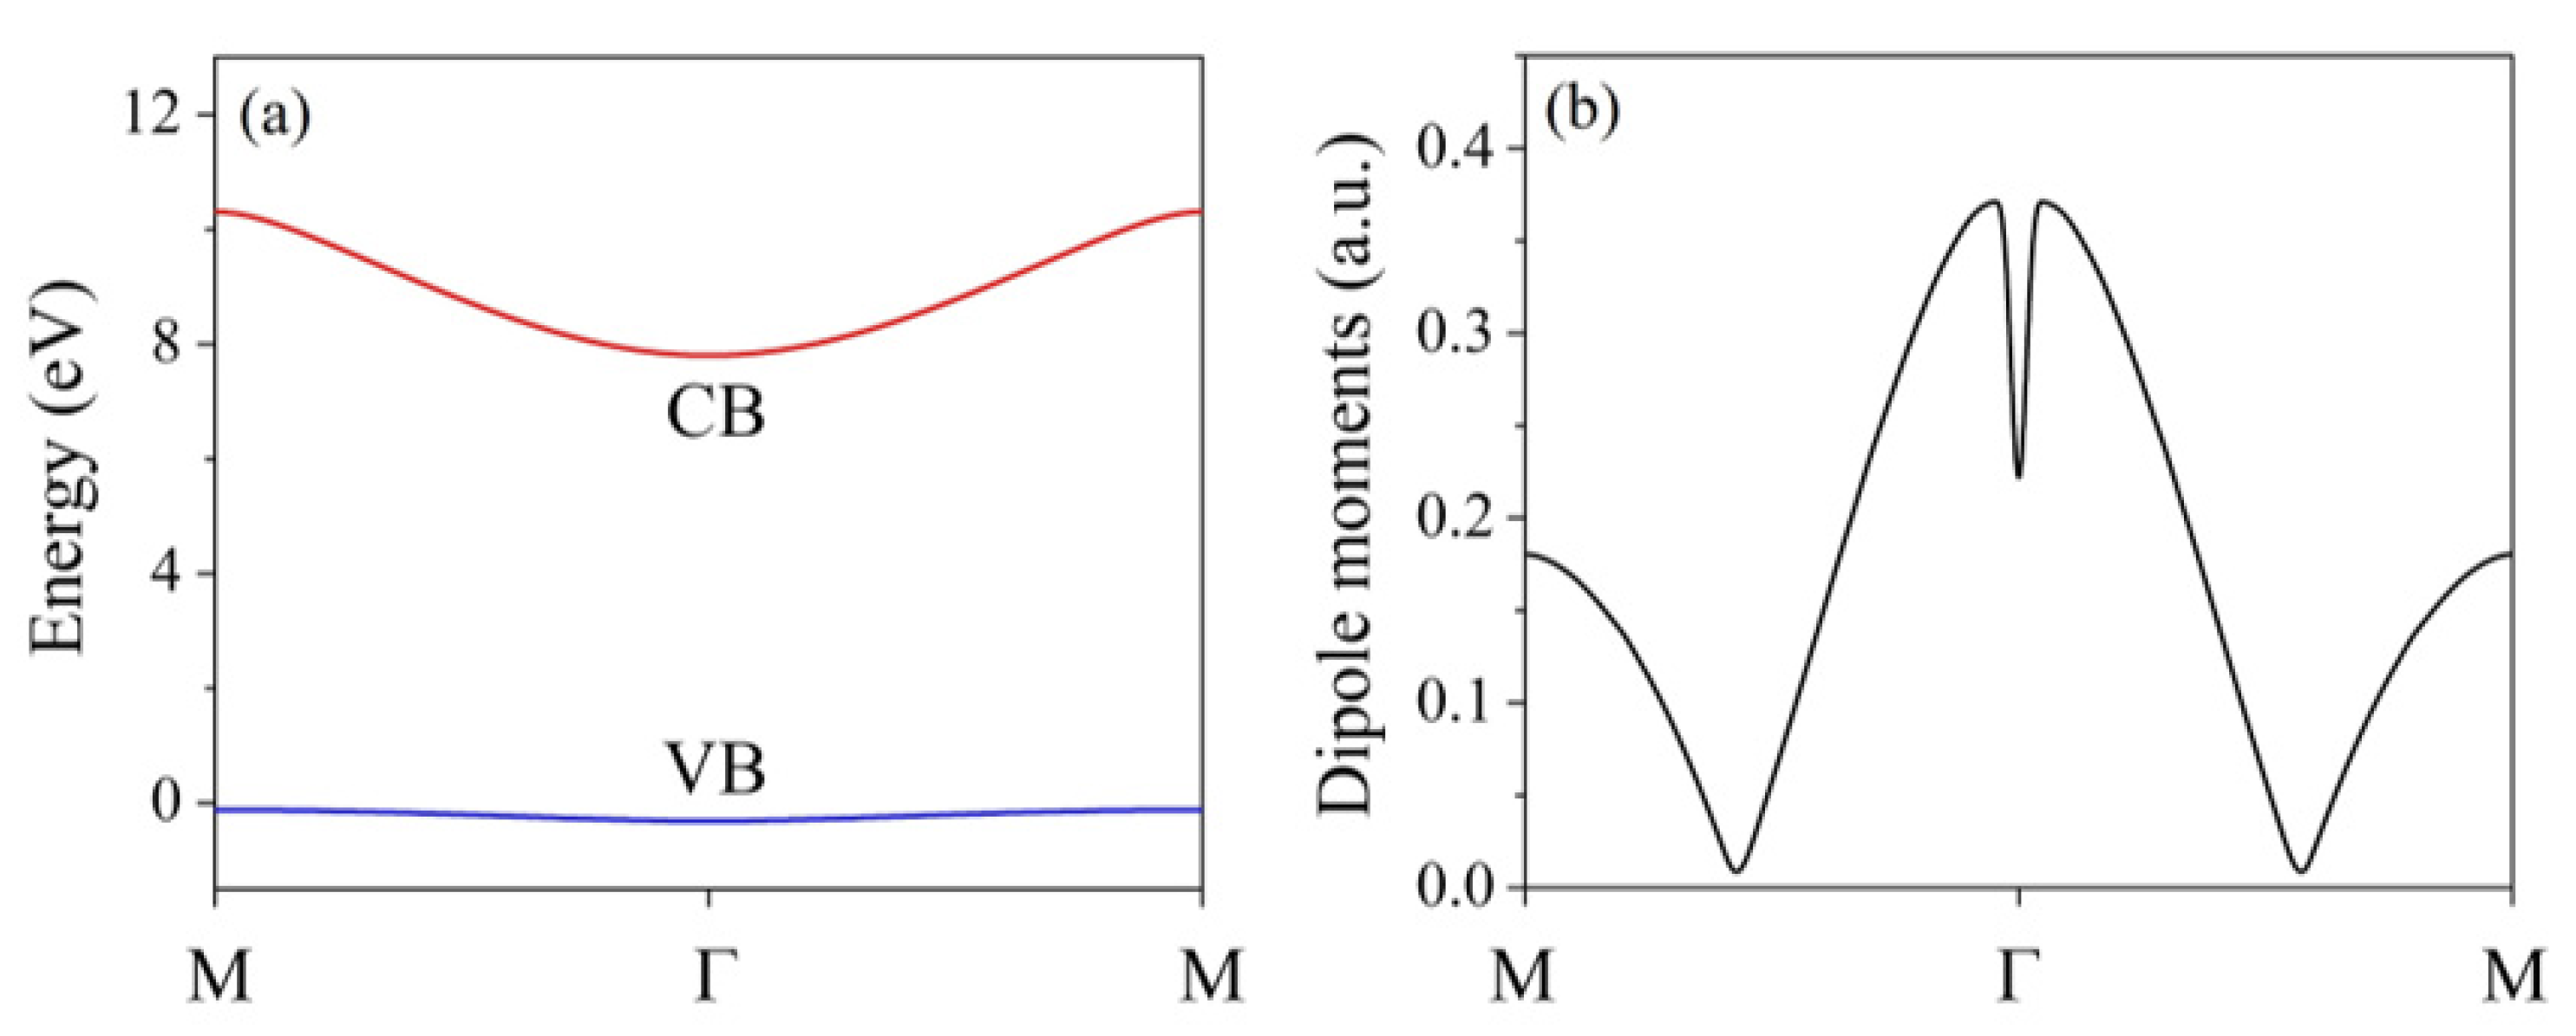
Figure 1. (a) The lowest conduction band and the highest valence band of the α-quartz SiO2 crystal along the Γ–M direction of the reciprocal lattice. The blue line represents the valence band and the red line represents the conduction band. (b) The modulus of the k-dependent dipole moments along the Γ–M direction.
Symmetry 15 00784 g001
Figure 2. The electric field profile and the vector potential of the driving laser. The value of the vector potential is divided by 10 and the CEP is set as 0. The peak intensity of the laser field is 5 × 10¹² W/cm2 (about 0.012 a.u.). The corresponding vector potential is about 0.21 a.u.
Symmetry 15 00784 g002
Figure 3. Temporal evolution of current population in the lowest conduction band nc (k, t). In all panels, the dephasing time T2 is set as 2.7 fs. The laser intensity is 1.0 × 10¹² W/cm2 in panels (a,d), 3.0 × 10¹² W/cm2 in panels (b,e), and 5.0 × 10¹² W/cm2 in panels (c,f). The CEP of the laser pulse is φ C E P = 0 in panels (ac) and φ C E P = π/2 in panels (df).
Symmetry 15 00784 g003
Figure 4. The temporal evolution of the current population in the lowest conduction band nc (k, t). In all panels, the dephasing time T2 is set as . The laser intensity is 1.0 × 10¹² W/cm2 in panels (a,d), 3.0 × 10¹² W/cm2 in panels (b,e), and 5.0 × 10¹² W/cm2 in panels (c,f). The CEP of the laser pulse is φ C E P = 0 in panels (ac) and φ C E P = π/2 in panels (df).
Symmetry 15 00784 g004
Figure 5. The CEP-dependent residual population of the lowest conduction band for T2 = and the laser intensity (a) 1.0 × 10¹² W/cm2, (b) 3.0 × 10¹² W/cm2, and (c) 5.0 × 10¹² W/cm2.
Symmetry 15 00784 g005
Figure 6. CEP ϕ 2 -dependent residual population of the lowest conduction band in two-color laser fields for dephasing time T2 = , intensity of the first color field I1 = 5.0 × 10¹² W/cm2, intensity of the second color field I2 = 1.0 × 10¹¹ W/cm2, and wavelength of the fundamental field λ1 = 800 nm. The wavelengths of the second color laser are (a) λ2 = 400 nm, (b) λ2 =200 nm, and (c) λ2 = 100 nm. The CEP of the first color laser is set to zero ( ϕ 1 = 0 ).
Symmetry 15 00784 g006
Disclaimer/Publisher’s Note: The statements, opinions and data contained in all publications are solely those of the individual author(s) and contributor(s) and not of MDPI and/or the editor(s). MDPI and/or the editor(s) disclaim responsibility for any injury to people or property resulting from any ideas, methods, instructions or products referred to in the content.