Article

A Fast Circle Detection Algorithm Based on Circular Arc Feature Screening

School of Physics and Electronics, Central South University, Lushan South Road, Changsha 410083, China
*
Author to whom correspondence should be addressed.
Symmetry 2023, 15(3), 734; https://doi.org/10.3390/sym15030734
Submission received: 20 February 2023 / Revised: 9 March 2023 / Accepted: 13 March 2023 / Published: 15 March 2023

Abstract

:
Circle detection is a crucial problem in computer vision and pattern recognition. In this paper, we propose a fast circle detection algorithm based on circular arc feature screening. In order to solve the invalid sampling and time consumption of the traditional circle detection algorithms, we improve the fuzzy inference edge detection algorithm by adding main contour edge screening, edge refinement, and arc-like determination to enhance edge positioning accuracy and remove unnecessary contour edges. Then, we strengthen the arc features with step-wise sampling on two feature matrices and set auxiliary points for defective circles. Finally, we built a square verification support region to further find the true circle with the complete circle and defective circle constraints. Extensive experiments were conducted on complex images, including defective, blurred-edge, and interfering images from four diverse datasets (three publicly available and one we built). The experimental results show that our method can remove up to 89.03% of invalid edge points by arc feature filtering and is superior to RHT, RCD, Jiang, Wang, and CACD in terms of speed, accuracy, and robustness.

1. Introduction

Circle detection is a fundamental feature extraction task in pattern recognition, which is crucial for computer vision and shape analysis. With the production digitization and automation requirements, circle detection has been widely used in PCB hole detection [1], spacecraft [2,3], ball detection [4], remote sensing localization [5], cell analysis [6], and cannon hole detection [7].
The circle Hough transform (CHT) [8,9] is the most classical circle detection method, which maps any three points to a three-dimensional parameter by traversing all of the edge points to determine the true circle, which leads to serious time consumption. To avoid traversing all points, Xu et al. [10] proposed the random Hough transform (RHT), which randomly samples three different points to calculate circle parameters and votes on the linked list of parameters [11]. However, random sampling generates invalid accumulation. Chen et al. proposed the random circle detection (RCD) algorithm [12]. This method samples one more point than RHT to verify candidate circles which reduces invalid accumulation. Although RCD improves computational efficiency, the probability of four randomly sampled points on the same circle is low. In order to improve the sampling efficiency, Jiang et al. [13] used probabilistic sampling and defined feature points to quickly exclude a large number of false circles. However, the method is based on the assumption of complete circles, and once the circle is obscured, the efficiency decreases rapidly. Wang et al. [14] proposed an improved sampling strategy, which samples one point and obtains the other two points by searching in horizontal and vertical directions, respectively. Although robust to noise, the time consumed rises sharply in complex environments. Jiang et al. [15] proposed a method based on difference region sampling, if the candidate circle is judged to be a false circle, and its number of points reaches a certain threshold, the next sampling is from its difference region. This method improves the sampling efficiency but degrades rapidly when there are many non-circular contours around the false circle.
The large number of iterations and traversal calculations is the main drawback of RHT-based and RCD-based methods. To solve this problem, another approach is to use the geometric properties of circles. These methods generally connect edge points into curves and then estimate the circle parameters using curve information such as least-squares circle fitting, perpendicular bisector or inscribed triangles.
Yao et al. proposed the curvature-assisted Hough transform for circle detection (CACD) algorithm [16], which adaptively estimates the radius of curvature to eliminate non-circular contours, but the calculation of curvature requires high accuracy for edge detection, pseudo-edges or intersecting edge curves can lead to erroneous results. Lu et al. [17] used criteria such as area constraints and gradient polarity to determine whether a curve is a candidate circle, and then obtained the true circle by clustering. However, this method often fails to identify defective circles. Le et al. [18] clustered the set of line segments based on the mean shift [19], and then obtained the circle parameters by least-squares fitting. Although this method can effectively handle occluded circles, redundant calculations lead to longer detection times. Zhao et al. [20] proposed a circle detection algorithm using inscribed triangles to estimate the circle parameters. In addition, a linear error compensation algorithm replaced least-squares fitting, which significantly improves the detection accuracy. Liu et al. [21] proposed a contour refinement and corner point detection algorithm to increase the arc segmentation accuracy but is very dependent on the edge extraction. The performance is often poor for images with edge curves crossing each other or interrupted edges. To address these problems, Ou et al. [22] proposed a circle detection algorithm based on information compression, which compresses the points on the arc with the same geometric properties into a single point and uses points instead of curves to fit the circle parameters, but the method is time-consuming. We summarize the previous work in Table 1.
In order to enhance the sampling efficiency, decrease the space consumption of verification, and ensure better performance for defective circles, this paper proposes a fast circle detection algorithm based on circular arc feature screening. First, we improve the fuzzy inference edge detection algorithm by adding multi-directional gradient input, main contour edge screening, edge refinement, and arc-like determination to remove unnecessary contour edges. Then, we sample using two feature matrices by steps and perform auxiliary point finding for defective circles. Finally, we build a square verification support region to validate the complete and defective circles respectively to obtain the true circle. The experimental results show that the algorithm is fast, accurate, and robust.
The main contributions of this paper are as follows:
  • An improved fuzzy inference edge detection algorithm that removes unnecessary contour edges by adding multi-directional gradient input, main contour edge screening, edge refinement, and arc-like determination;
  • A random sampling method based on arc features reinforcement with step-wise sampling on two feature matrices and an assisted point-finding method for defective circles;
  • A verification method with a square verification support region and the complete circle and defective circle constraints.
The rest of the paper is organized as follows: Section 2 presents our circle detection principle, Section 3 presents the experimental results and a comparative analysis, Section 4 concludes this paper.

2. Principles of Circle Detection

Our proposed circle detection algorithm consists of four stages: image preprocessing, sample point selection, candidate circle validation, and finding the true circle. An explanation of important symbols can be found in the Appendix A.

2.1. Image Preprocessing

2.1.1. Fuzzy Inference Edge Detection

The fuzzy inference edge detection was proposed by [23], with strong edge detection capability and robustness. This algorithm consists of the following three main processes:
(1)
Fuzzification: it extracts relevant features of the image (gradient, pixel difference, etc.) as inputs to the fuzzy system, selects a suitable input affiliation function, and maps the exact values to the affiliation degrees of the corresponding input fuzzy subsets. Based on the gradient variation of the pixel points, we generally construct a 0-mean affiliation function for Gaussian distribution.
A i n G , σ , k = e G k 2 2 σ
where σ is the standard deviation and k is the mean value. Changes in the σ value can adjust the performance of edge detection.
(2)
Fuzzy inference: the fuzzy rules are formulated empirically, and the inference method is used to map the affiliation degrees to the set of inference results on the value domain of the output variables. Fuzzification uses the Min-Max fuzzy operator, which translates the “If-Then” rules into a mapping from the input variables to the output variables, similar to Li et al. [24].
M y = max l = 1 u min A i n 1 G 1 , , A i n l G v , M y
where A i n l ( G n ) is the affiliation of the input variable, M ( y ) is the output value after fuzzing, u is the total number of rules and v is the number of input variables.
This is an affiliation function of the output fuzzy set. The output variables M ( y ) mapped are used as inputs. The triangle function is generally chosen to separate the edge to obtain robust edge information.
A o u t y , a , b , c = 0 , y a y a b a , a y b c y c b , b y c 0 , c y
where a and c are the footpoints of the triangle function and c is the vertex, changing the parameters can adjust the performance of the edge detector.
(3)
Defuzzification: using the defuzzification method, the total output is obtained from the set of inference results obtained by fuzzy inference, and then the defuzzified value is compared with the set threshold to obtain the edge image.
V = i = 1 u ω i A o u t i i = 1 u ω i = ω 1 A o u t 1 + ω 2 A o u t 2 + + ω u A o u t u ω 1 + ω 2 + + ω u
where V is the total output, ω i is the weight, which is determined by the center of gravity of the area covered by the affiliation function of the output fuzzy set.

2.1.2. Edge Extraction

To improve the localization accuracy of target edges, we extend the gradients in two directions of the traditional method in Section 2.1.1, horizontal and vertical, to four directions along horizontal, vertical, 45 , and 135 as input variables in the SOBEL operator. By extending the number of input variables of the fuzzy system, more image information is carried and the effect of noise is further reduced.
H x = 1 2 1 0 0 0 1 2 1 , H y = 1 0 1 2 0 2 1 0 1
H p = 2 1 0 1 0 1 0 1 2 , H q = 0 1 2 1 0 1 2 1 0
G X = H X I x , y
where H x , H y , H p and H q are the four first difference operators along the horizontal, vertical, 45 , and 135 , respectively. G X is the input variable of the fuzzy system and I ( x , y ) is the original grayscale image. G X is obtained by convolving the difference operator with I ( x , y ) .

2.1.3. Main Contour Edge Screening

After edge extraction in fuzzy systems, directly setting a fixed threshold for binarization is likely to lose edge information or retain invalid interference leading to misjudgment, so we use the adaptive thresholding method:
t h r e s h = max ( 1 β ) U + β p max , p l o c a l
N x , y = 1 U x , y t h r e s h 0 o t h e r s
where U is the grayscale classification of the deblurred image by OTSU [25], p m a x is the local mean maximum value, p l o c a l is the local mean value, β ( 0 , 1 ) is the adaptive weight value, and β takes a larger value when the grayscale difference between the main contour edge and the interference edge is large; conversely, β takes a smaller value. N ( x , y ) is the value of the edge point taken at ( x , y ) on the image. When U ( x , y ) is greater than t h r e s h , it is recorded as 1 and marked as an edge point; otherwise, it is recorded as 0 and marked as a non-edge point. Considering that the main contour edge gray mean is generally larger than other interference curves, we take the maximum of the global threshold and local mean.

2.1.4. Contour Refinement

One-pixel-wide contour curves can accurately describe circular contours, while multi-pixel-wide curves lead to computational redundancy and may result in duplicate detection. We extract the refined curves using the method of [21], and remove the point P from the contour curves when it satisfies any of the following conditions:
N ( 1 ) N ( 3 ) + N ( 3 ) N ( 5 ) + N ( 5 ) N ( 7 ) + N ( 7 ) N ( 1 ) = true & N ( P ) = 2
( N ( 1 ) + N ( 5 ) ) ( N ( 3 ) + N ( 7 ) ) = true & N ( P ) > 2
N ( 1 ) N ( 4 ) N ( 6 ) + N ( 3 ) N ( 6 ) N ( 8 ) + N ( 2 ) N ( 5 ) N ( 8 ) N ( 2 ) N ( 4 ) N ( 7 ) = true
N c ( P ) > 2
We define the logic value of contour curve pixels as 1 (true) and background pixels as 0 (false). N ( P ) is the number of non-zero pixel points in the eight fields of P, and N c ( P ) is the number of non-zero pixel points in N ( 2 ) , N ( 4 ) , N ( 6 ) , and N ( 8 ) , as shown in Figure 1.

2.1.5. Arc-like Determination

Regardless of the image resolution, contour curves smaller than 30 pixels are deleted to expedite the subsequent process, similar to Jia et al. [26]. Although some interfering pixels and tiny unnecessary contours are removed, non-circular contour curves still exist, which affect the circle detection efficiency.
To solve this problem, we perform arc-like determination of the contour curves. Set the length of arc points set as L, the first coordinate of the point set is A ( x 1 , y 1 ) , the L/4th coordinate is B ( x 2 , y 2 ) , the L/2nd coordinate is C ( x 3 , y 3 ) , and the 3L/4th coordinate is D ( x 4 , y 4 ) . The horizontal and vertical coordinates of the four points A, B, C and D should satisfy the following relationship:
R = L 2 π P L i = 2 R sin α i 2 45 α i 90 x i x j 2 + y i y j 2 = P L i 2 , | i j | = 1
where P L i is the length of the line segment connecting the two points in the sequence on the circle and α i is the central angle between the two points in the sequence.
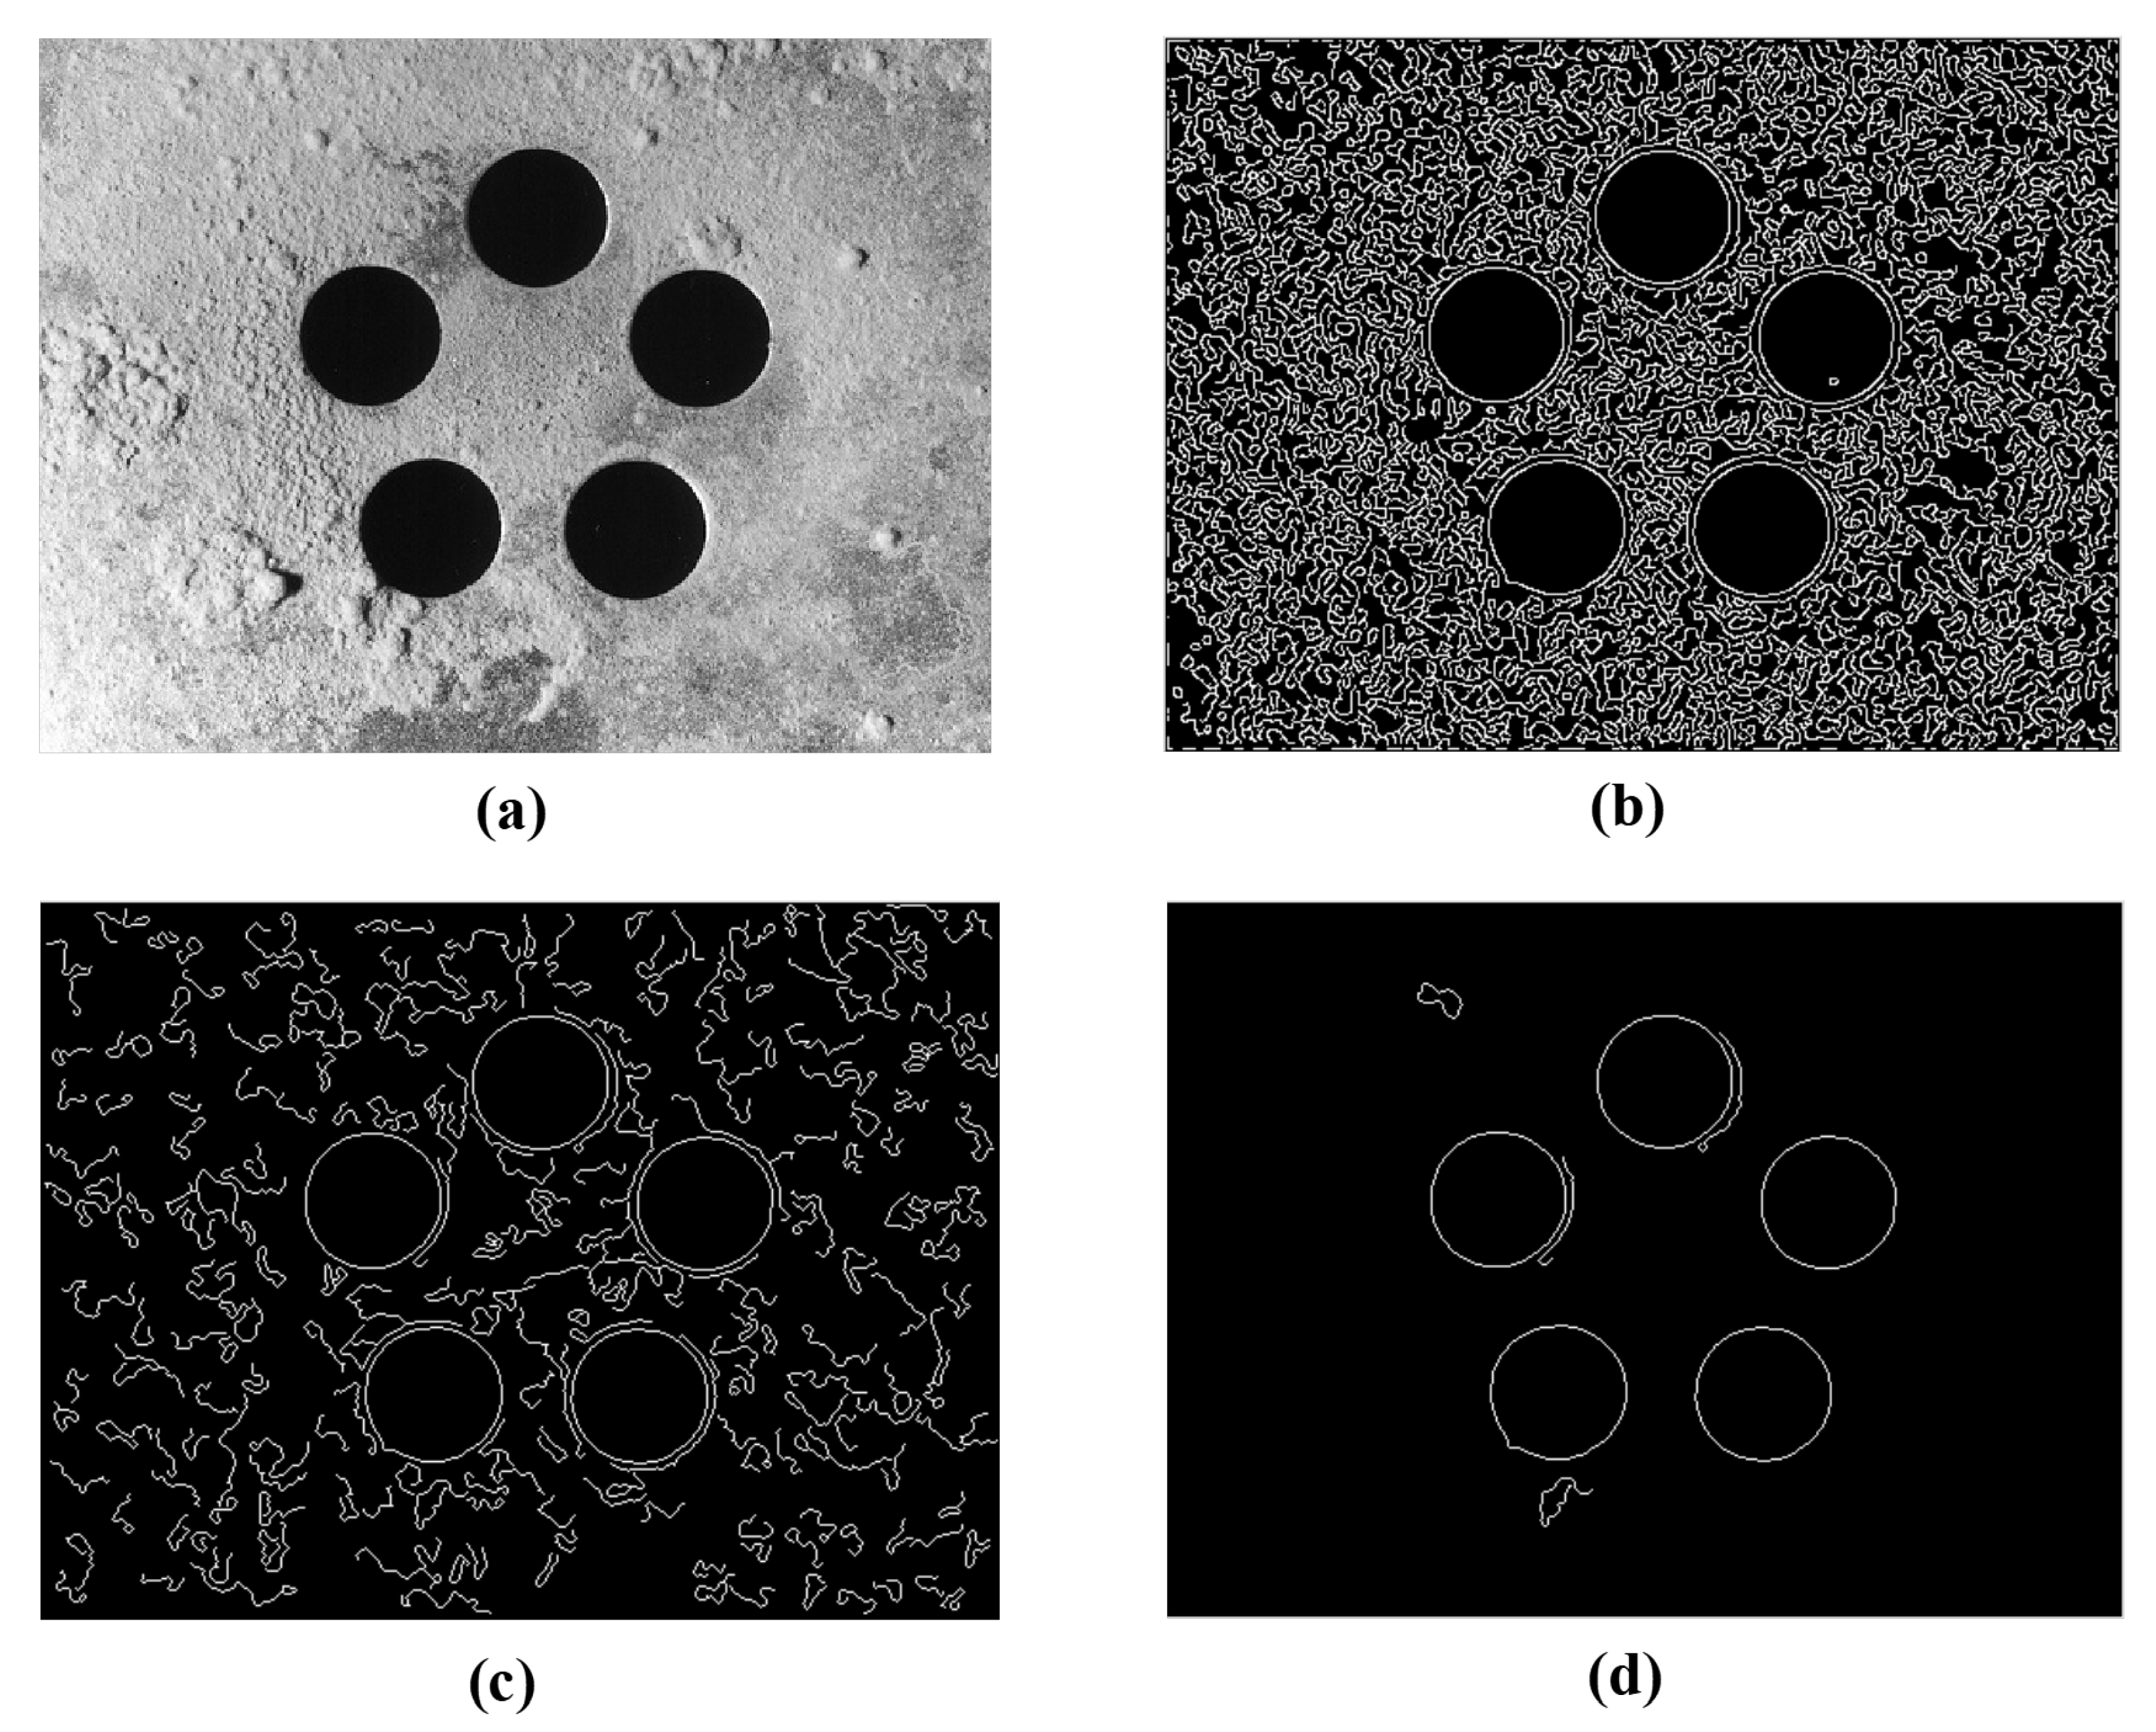
Figure 2a is an original grayscale image with multi circles and an unsmooth background, making the measurement of circles difficult. From Figure 2b, we can see that although the original fuzzy inference edge detection algorithm detects the edges of the circle well but accompanied by a large number of unimportant details and interference curves, Figure 2c shows that some interference and unnecessary contours are removed after the main contour edge screening and contour refinement, and as Figure 2d shows, our algorithm removes a large number of non-circular contour curves, which well-retains the circular information and facilitates subsequent circle detection. We validated the method in four datasets and recorded the results in Table 2.
From Table 2, the number of edge points refers to the average number of edge points obtained by the original fuzzy inference edge detection algorithm. The number of screened edge points refers to the average number of edge points retained after screening by our algorithm. The screening retention rate refers to the ratio of the number of edge points retained after screening to the total number of edge points. The number of edge points on the circle refers to the average number of edge points belonging to the circle in the images. The circle content rate refers to the percentage of edge points that lie on the circle. The circle retention rate represents the degree to which the edge points on the circle are retained after screening by our algorithm. A retention rate of 100% means that no circle information is lost.
Table 2 shows the performance of our algorithm on four datasets. For other methods, circle detection is performed directly on the set of edge points that have not been filtered for circle information. The non-circular contours interference and invalid edge points can significantly slow down the detection efficiency. From the table, we can see that the circle content rate is as low as 3.51% and as high as only 24.34% in the four datasets. Our algorithm can effectively remove a large number of unimportant details and interference, and our screening retention rate can be as low as 10.97%, and the corresponding circle retention rate is 100%, which means that, at most, 89.03% of invalid edge points can be removed. Even in the traffic dataset, which is affected by light and weather changes, the circle retention rate is as high as 97.54%. In addition, although there is a large amount of invalid information in the interference dataset, our algorithm runs better on this dataset than the other three datasets, mainly because many of the interference curves have messy trends and are removed when they do not satisfy the arc-like determination condition.

2.2. Sampling Points Selection

2.2.1. Gradient Estimation and Edge Classification

We use the gradient operators with symmetry axes of 45 and 135 respectively to perform the convolution calculation and normalization with the images, and obtain the feature matrices for two directions along 45 and 135 , and mark the matrix information smaller than the gray value of 0.5 as 0.
S 1 = 0 0 1 0 1 0 1 0 0 , S 2 = 1 0 0 0 1 0 0 0 1
G 1 = I ( x , y ) S 1 , G 2 = I ( x , y ) S 2
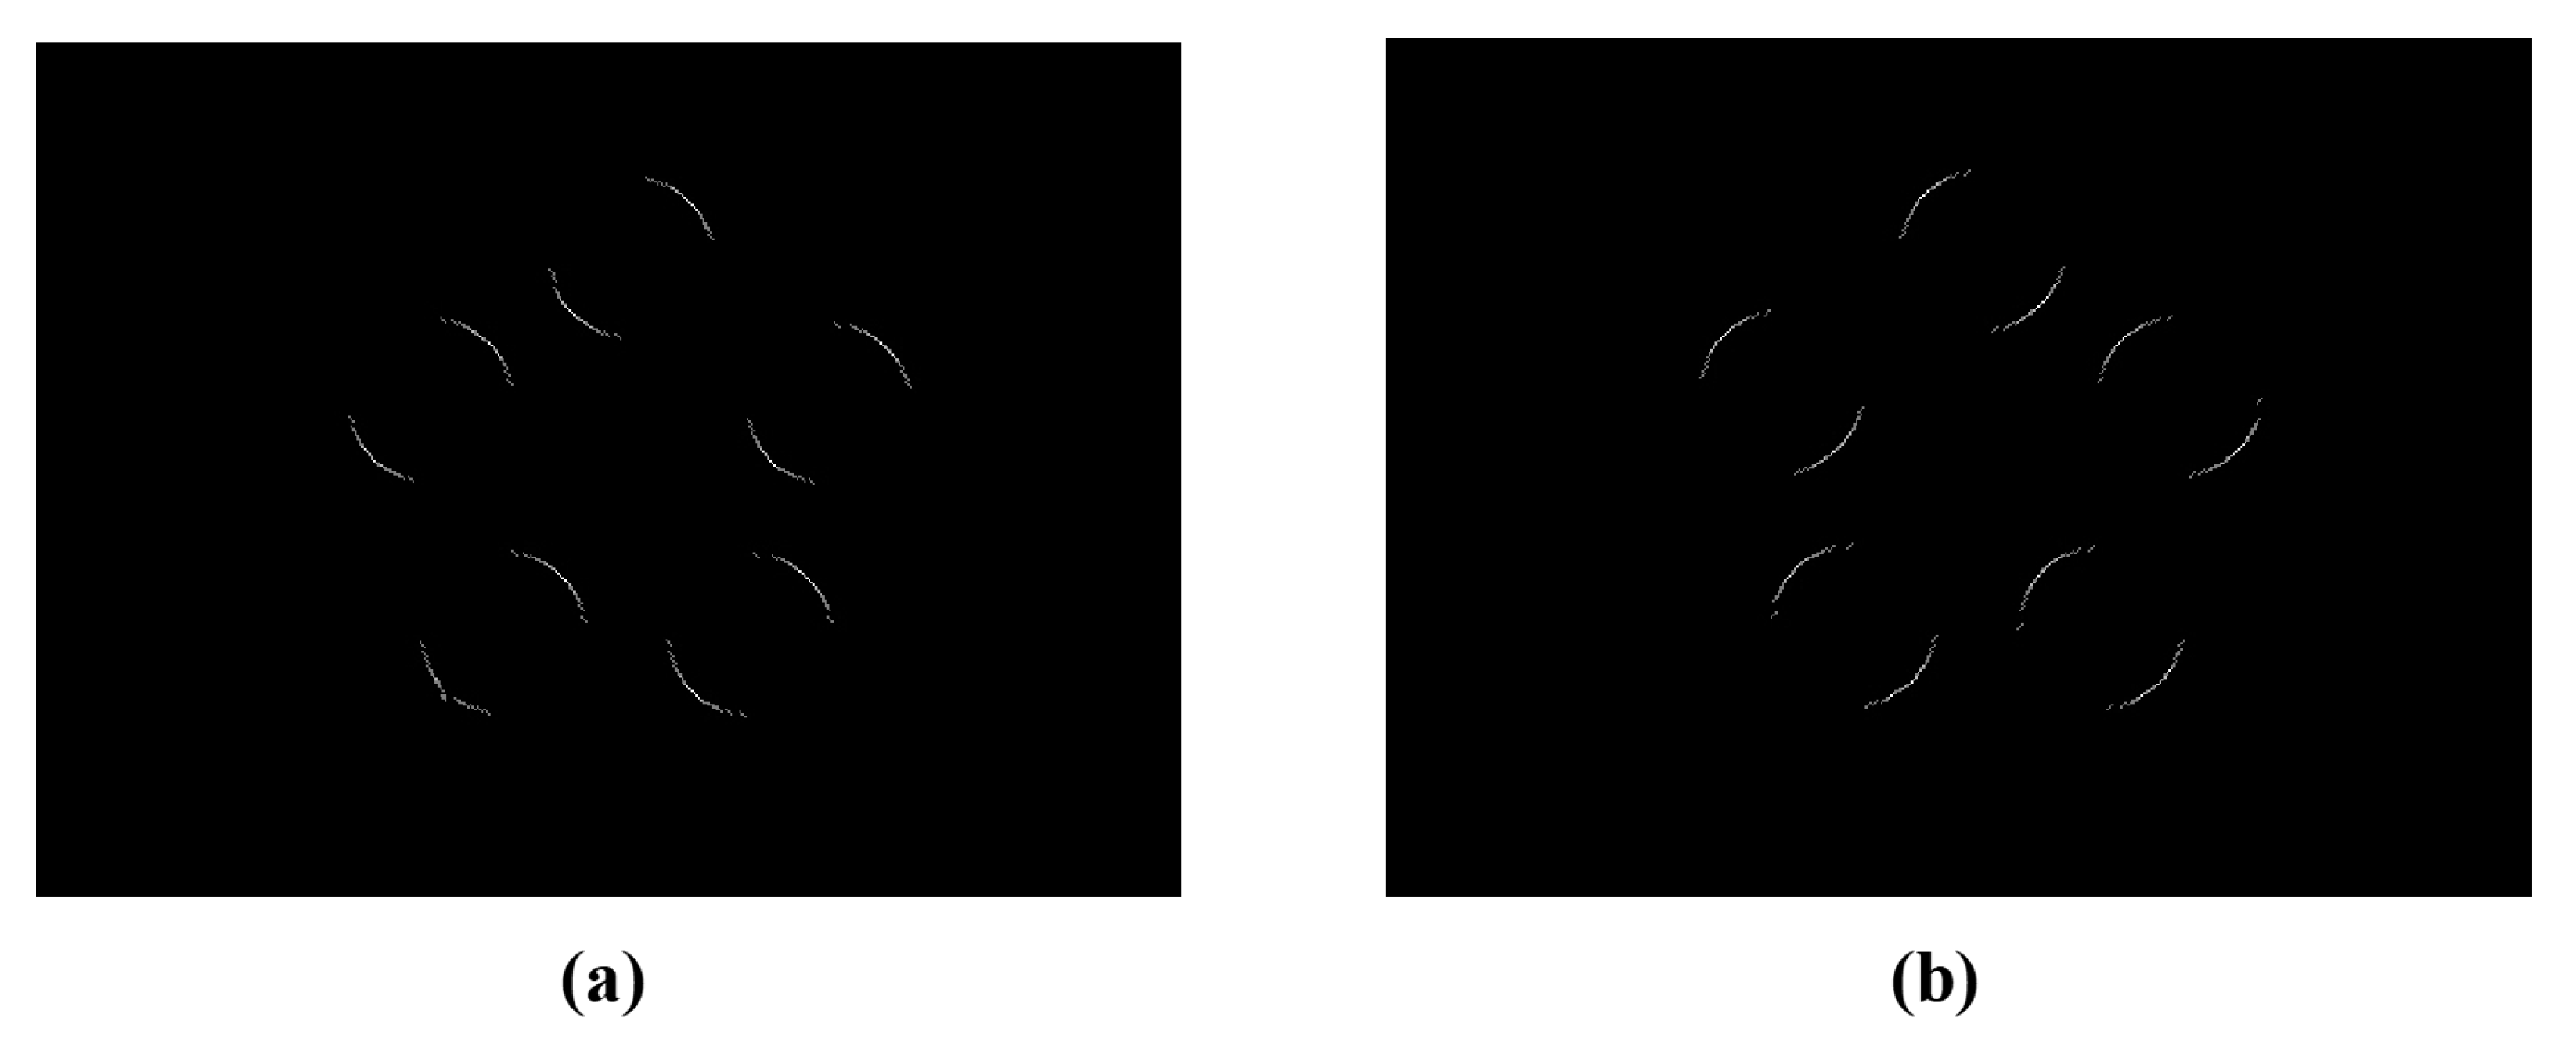
where I ( x , y ) is the grayscale image matrix, S 1 and S 2 are 3 × 3 matrices for two directions along 45 and 135 , respectively. Figure 3 shows the image effects of the feature matrices along two directions of 45 and 135 .

2.2.2. Sampling Strategy

To improve the sampling efficiency, instead of randomly sampling the entire edge image, we sample by steps on two feature matrices obtained in Section 2.2.1.
To further improve the probability of finding a circle, we sample randomly the first point P 1 on the feature matrix G 1 , and search the horizontal and vertical directions of the point P 1 on the feature matrix G 2 to obtain the other two points P 2 and P 3 , respectively. It can avoid repeated sampling on the same directional arc of the first point sampled and greatly reduce invalid sampling, especially for multi-circle images.
For different cases of defective circles, sampling strategies are further discussed. When only one point is searched in the feature matrix G 2 , the sampling strategies are divided into the following two categories:
(1) Auxiliary Point Finding in 45 Direction
If only the point in the vertical direction is searched in the feature matrix G 2 as the second point P 2 , take the midpoint of the first point and the second point and generate a line along 45 direction of the point. When the Euclidean distance from the edge point to the line is less than m a x ( 0.5 , m i n ( 5 , r / 30 ) ) , we consider the third sampling point exists.
(2) Auxiliary Point Finding in 135 Direction
If only the point in the horizontal direction is searched in the feature matrix G 2 as the second point P 2 , take the midpoint of the first point and the second point and generate a line along 135 direction of the point. When the Euclidean distance from the edge point to the line is less than m a x ( 0.5 , m i n ( 5 , r / 30 ) ) , we consider the third sampling point exists.
F ( i ) = 1 , P 3 ( i ) 0 , o t h e r s
D I R ( i ) = h o r i z o n t a l , x i 1 = x i 2 a n d F ( i ) = 1 v e r t i c a l , y i 1 = y i 2 a n d F ( i ) = 1
m a r k i = 1 , D I R i = h o r i z o n t a l a n d x i 3 y i 3 + y i 1 y i 2 2 x i 1 2 < m a x d i s t D I R i = v e r t i c a l a n d x i 3 + y i 3 x i 1 + y i 2 2 y i 1 2 < m a x d i s t 0 , o t h e r s
P 1 i , P 2 i , P 3 i · m a r k i U s a m p l e
m a x d i s t = max ( 0.5 , min ( 5 , r / 30 ) )
Three points that are not co-linear can determine a circle, and the three sampled points obtained are connected in turn to form a right triangle. According to the geometric properties of the circle, the hypotenuse of the inscribed right triangle passes through the center of the circle and its length is the length of the diameter of the circle, so the circle parameters [ a , b , r ] can be obtained according to the sampling points.
a = x 1 + x 2 2
b = y 1 + y 3 2
r = x j a 2 + y j b 2 , for any j = 1 , 2 , 3
We perform a preliminary verification of the circle parameters obtained by sampling, and we consider it a false check when any of the following conditions is satisfied, otherwise, it is considered as a candidate circle:
a r < 1 a + r > m
b r < 1 b + r > n
r < 10 r > max ( m , n )
where m is the number of rows of the image and n is the number of columns of the image.

2.3. Candidate Circle Validation

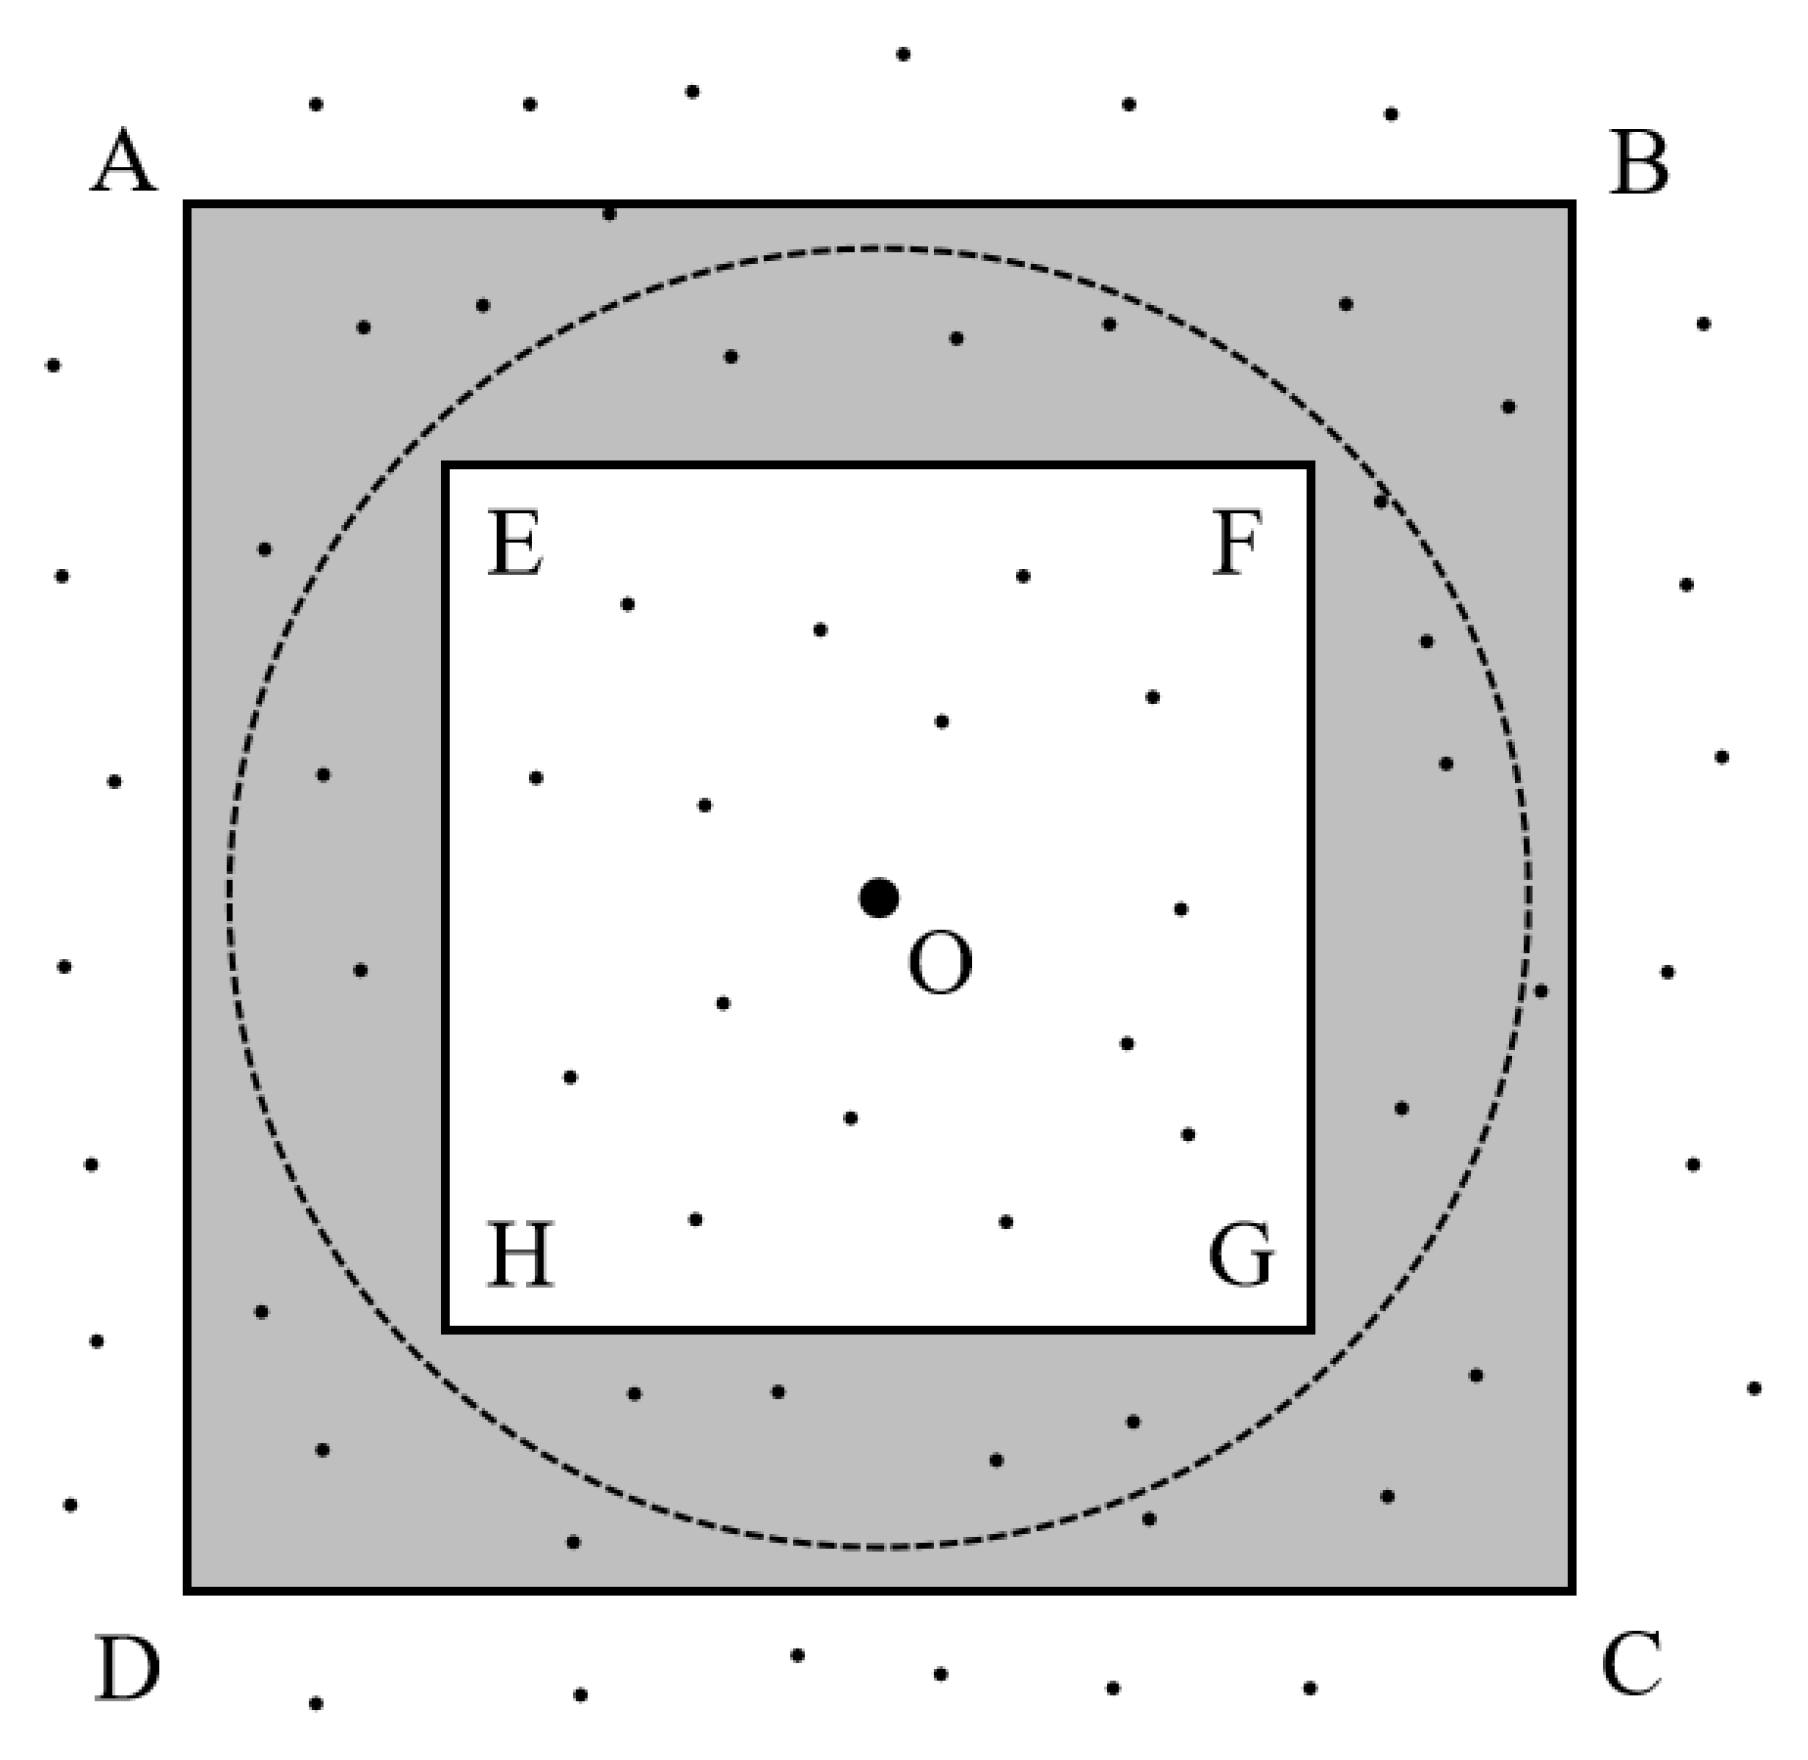
In order to reduce the number of iterations required to verify the edge points on non-candidate circles and improve the verification accuracy, we divide the edge point region and build the square verification support region of the candidate circle:
L A B C D = 2 r + d f L E F G H = 2 r d f d f = max ( 3 , r o u n d ( r / 50 ) ) a r e a V c = S A B C D S E F G H
where L A B C D and L E F G H are the approximate external and internal tangent square edge lengths of the candidate circle O, respectively, d f is the error-tolerant distance retained by the external internal tangent square different from the standard, and a r e a ( V c ) is the square verification region of the candidate circle.
We verify the edge points of the constructed region of Figure 4 using the following conditions:
P x , P y a r e a V c
D i s t i = P x a 2 + P y b 2 r
S i z e ( D i s t ) 0.8 2 π r
C i r c l e p o i n t s = D i s t i < min ( 1 , r / 40 )
where D i s t i is the difference between the distance from the edge point in the verification region to the center of the candidate circle and the radius of the candidate circle. When D i s t i is less than m i n ( 1 , r / 40 ) , we consider the edge point as the point of the candidate circle.

2.4. Finding the True Circle

Based on the type of circles divided into two categories: complete circles and defective circles, we further discuss determining whether a candidate circle is a true circle.
(1)
Complete Circle Judgment
If the number of edge points of the verification region satisfies C i r c l e p o i n t s S i z e ( D i s t ) 0.8 , we consider it a complete circle.
(2)
Defective Circle Judgment
If the number of edge points of the verification region satisfies 0.6 < C i r c l e p o i n t s S i z e ( D i s t ) < 0.8 , we consider it as a defective circle and perform defective circle judgment. First, we calculate the gradient azimuth of the edge points and the azimuth of any point ( x i , y i ) on the circle with ( a , b ) as the center. Then, points that do not satisfy | θ 1 θ 2 | < ε θ will be excluded. When the points satisfy, we consider the defective circle as a true circle.
I C i r c l e p o i n t s x = ( N ( 2 ) + w N ( 3 ) + N ( 4 ) ) ( N ( 8 ) + w N ( 7 ) + N ( 6 ) ) I C i r c l e p o i n t s y = ( N ( 4 ) + w N ( 5 ) + N ( 6 ) ) ( N ( 2 ) + w N ( 1 ) + N ( 8 ) )
θ 1 = arctan I C i r c l e p o i n t s y / I C i r c l e p o i n t s x
θ 2 = arctan y i b x i a
C ( i ) = 1 , θ 1 θ 2 < ε θ 0 , o t h e r s ε θ = min 2 , max 2 , C i r c l e p o i n t s · 1.8 π R P o i n t n u m = C ( i )
where θ 1 is the gradient azimuth of the point, θ 2 is the azimuth of any point ( x i , y i ) on the circle with ( a , b ) as the center, and ε θ is the minimum error angle.
Similar to [21,22], we consider two circles to be the same when the overlap rate is greater than 0.8, and retain the circle whose number of the edge points is closer to the circumference of the true circle as better sampling results.
R a t i o C i , C j = a r e a C i a r e a C j a r e a C i a r e a C j
where R a t i o C i , R a t i o C j refer to the area of circles C i , C j respectively, and R a t i o C i , C j refers to the overlap ratio of the two circles.
After finding the true circle, the points that have been marked as true circles are deleted to avoid repeating sampling verification. To avoid traversing the entire image to determine the marked edge points, we define a deletion marker region:
L o u t = 2 r L i n = 2 r a r e a V d = S o u t S i n P x , P y a r e a V d
where a r e a ( V d ) is the region of marked points removed. The detection accuracy and time efficiency have improved, using the method with time complexity O ( n ) .

3. Experiments and Results Analysis

In this section, we compared the algorithm proposed in this paper with five other algorithms. The first is the RHT algorithm proposed by Xu et al. [10]. The second is the RCD algorithm proposed by Chen et al. [12]. The third is a difference region sampling algorithm proposed by Jiang [15]. The fourth is an improved sampling algorithm proposed by Wang [14]. The fifth is the CACD algorithm proposed by Yao et al. [16] and the code is from the authors’ open source sharing [28]. Finally, there is our algorithm. In order to unify the standard, all experiments were run in MATLAB R2021a on the same desktop with an Intel Core i5-9400 2.9 GHz desktop with 8 G RAM. We used the following four metrics to evaluate the above methods: P r e c i s i o n , R e c a l l , F m e a s u r e , and T i m e .
P r e c i s i o n = T P T P + F P
R e c a l l = T P T P + F N
F m e a s u r e = 2 × P r e c i s i o n × R e c a l l P r e c i s i o n + R e c a l l
The experiments refer to the validation method in the literature [20,21,22], where T P is the number of correct identifications, F P is the number of false identifications, and F N is the number of the basic facts missed. T i m e refers to the average time from inputting the image to outputting all of the found circles in each dataset.
The test images in this paper are mainly from our dataset and three public datasets available on the internet:
Interference Dataset. This complex dataset is from the internet, consisting of 16 images from different scenes. The large amount of invalid interference consisting of unimportant details and interference curves makes it impossible for general circle detection algorithms to extract the edges of the circle well. Moreover, compared with some common datasets, the interference dataset contains more circles in each image, making the measurement of circles very difficult.
GH dataset. This complex dataset is from [27] and consists of 257 gray images of different realistic scenes. Circles in different scenarios make detection compatibility a challenge. Difficulties, such as blurred edges, occlusions, and large variations in radius inconvenience the measurements.
Mini Dataset. For this dataset [27], eight common images have been used over the years to test circular algorithms: ball (231 × 232), cake (231 × 231), coin (256 × 256), quintuplet (239 × 237), insulators (204 × 150), plate (400 × 390), stability ball (236 × 236 pixels) and watch (236 × 272). Most methods have been tested with this dataset, so performance comparisons will be more convincing. Low resolution, blurred edges, and occlusion are the main challenges of this dataset.
Traffic Dataset. This complex dataset is from [27] and the internet. Compared with the GH dataset, the traffic dataset contains many colorful images and involves more cluttered backgrounds. Realistic scenes and sign information inside the signs test the practicality of circle algorithms. Factors such as lighting, weather changes, and the angle of outdoor cameras make detection difficult.

3.1. Fuzzy Test

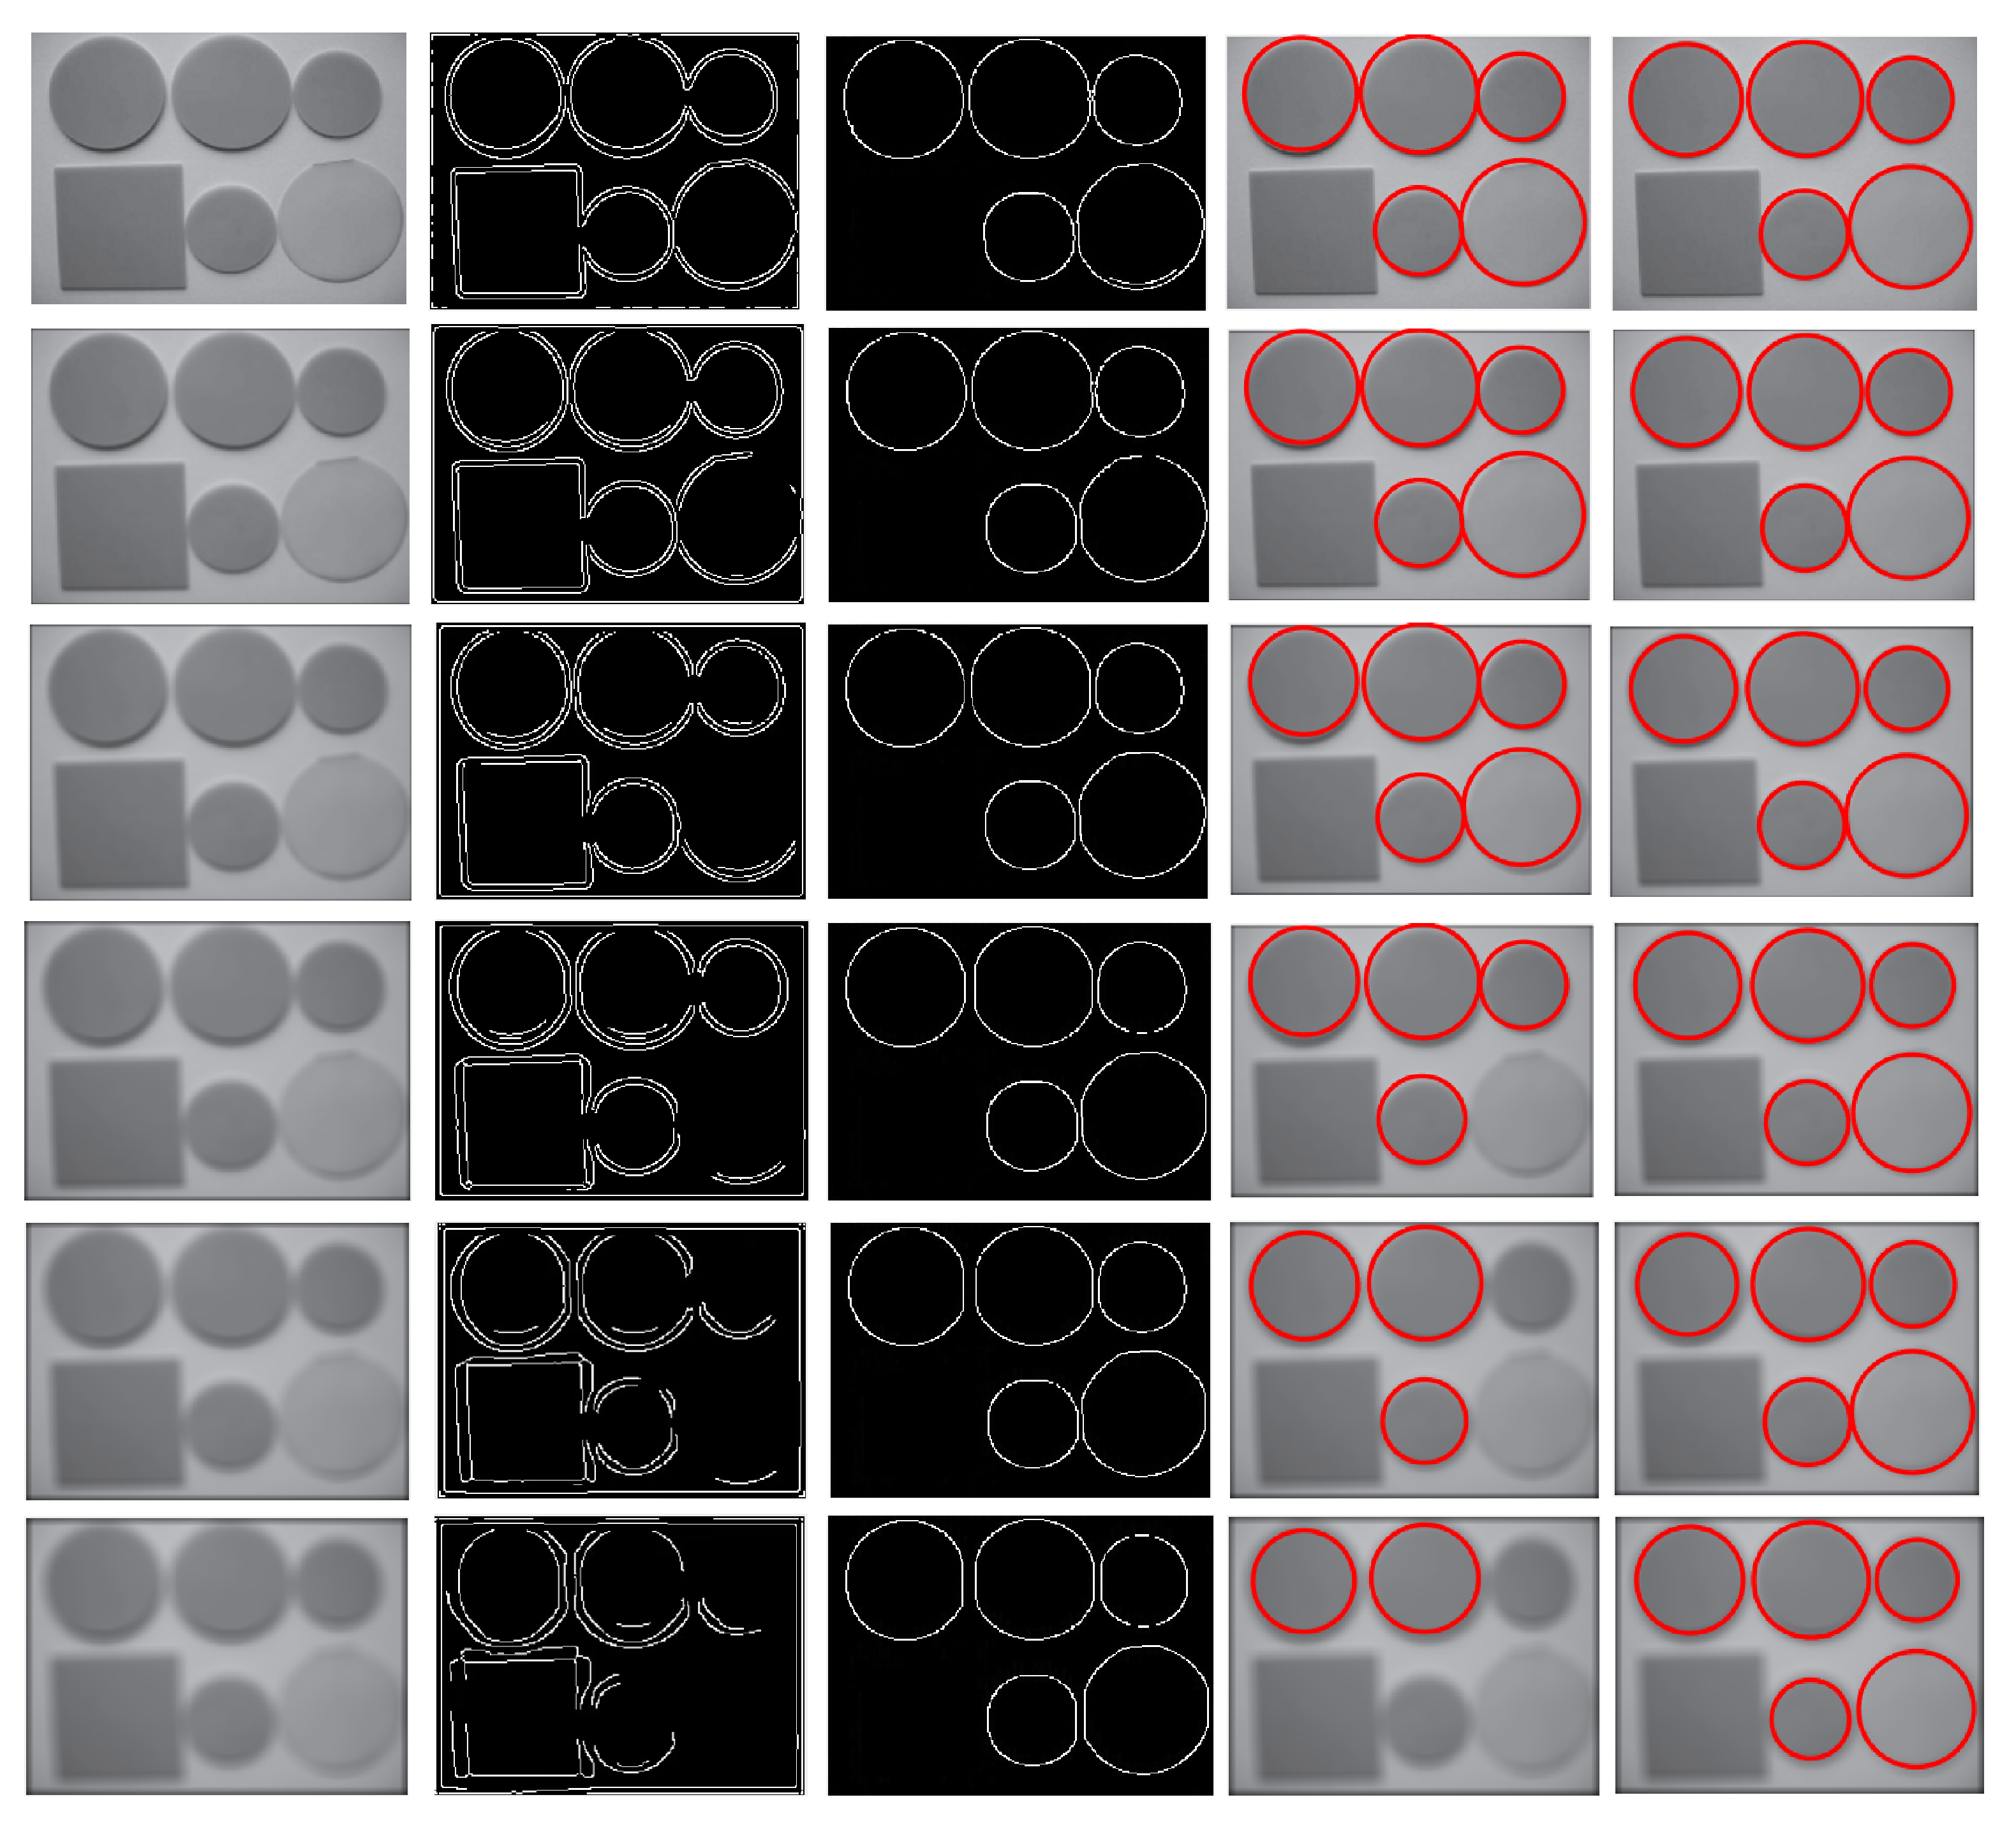
To test the performance of our improved fuzzy inference algorithm at different fuzziness levels, we compared it with the original fuzzy inference edge detection algorithm, with code from the authors’ open source share [29]. The size of the filter window affects the blurring degree of the picture, and the larger the size, the more obvious the blurring degree. We added Gaussian filters with 3 × 3, 5 × 5, 7 × 7, 9 × 9, and 11 × 11 window sizes to the pictures respectively to test their robustness. The experimental results are shown in Figure 5.
Figure 5 shows the detection capability of our algorithm for Gaussian-filtered images, where the first image in each row represents Gaussian-filtered images with different window sizes, the second image is the result extracted by the original fuzzy inference edge detection algorithm, the third image is the result extracted by our improved fuzzy inference algorithm, the fourth image is the circle detection result extracted by the original fuzzy inference edge detection algorithm, and the fifth image is the result of our circle detection.
It can be seen that the original image has some shadow contours in Figure 5, and the original fuzzy inference edge detection algorithm has a false detection of pseudo-circular edges, which leads to the deviation of circle detection. Moreover, as the filter window size increases, the blurring becomes more and more serious. A large number of edges have been distorted and lost since the picture is with a Gaussian filter of 7 × 7 window size, leading to the missed detection results.
In contrast, our improved algorithm improves the edge localization accuracy by multi-directional gradient input and main contour edge screening, reduces the influence of pseudo-arc edges, and enables the contour curve to maintain a relatively complete and stable trend under different Gaussian filters, then eliminates the curves with near straight line and obscure circular arc features by arc-like determination, which effectively reduces the detection error. In addition, as the blurring of the images deepens, our algorithm still maintains a good performance without any missed and false detection, showing high anti-interference and strong robustness.

3.2. Performance Comparison

3.2.1. Interference Dataset and GH Dataset

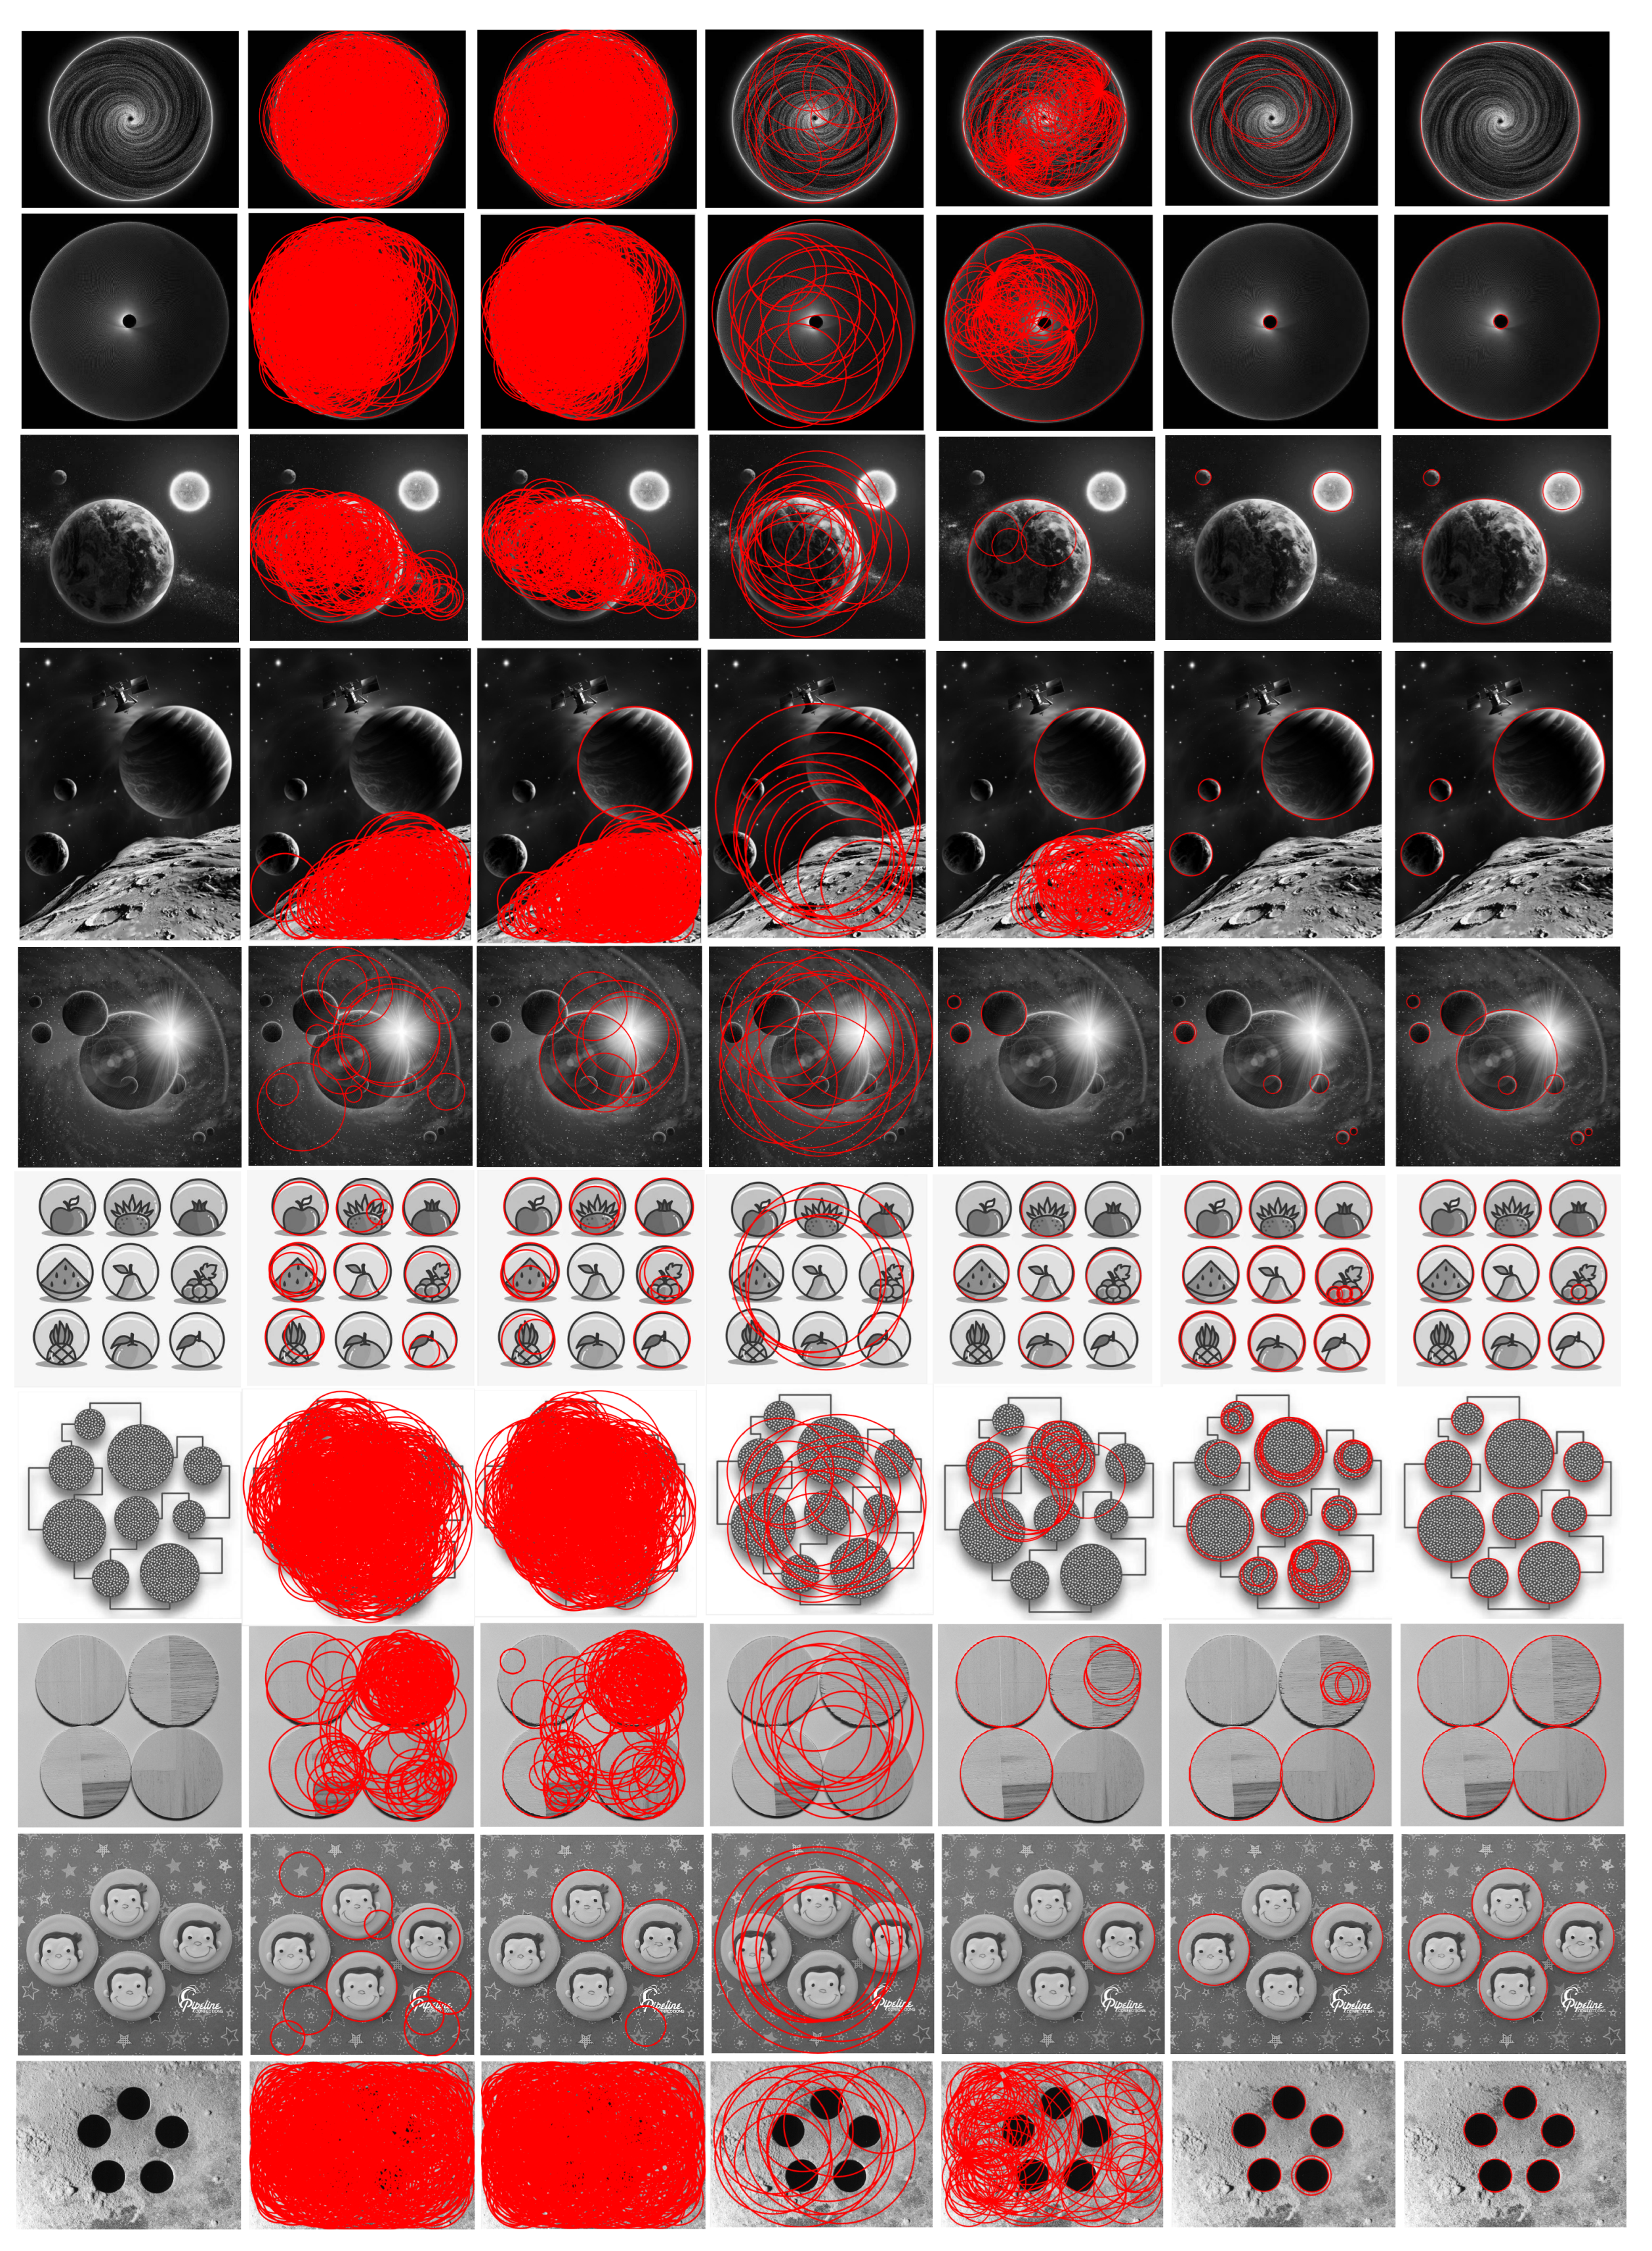
Figure 6 shows the run results of the six algorithms, and Table 3 and Table 4 summarize the run results of the six algorithms on two datasets, Interference, and GH, respectively.
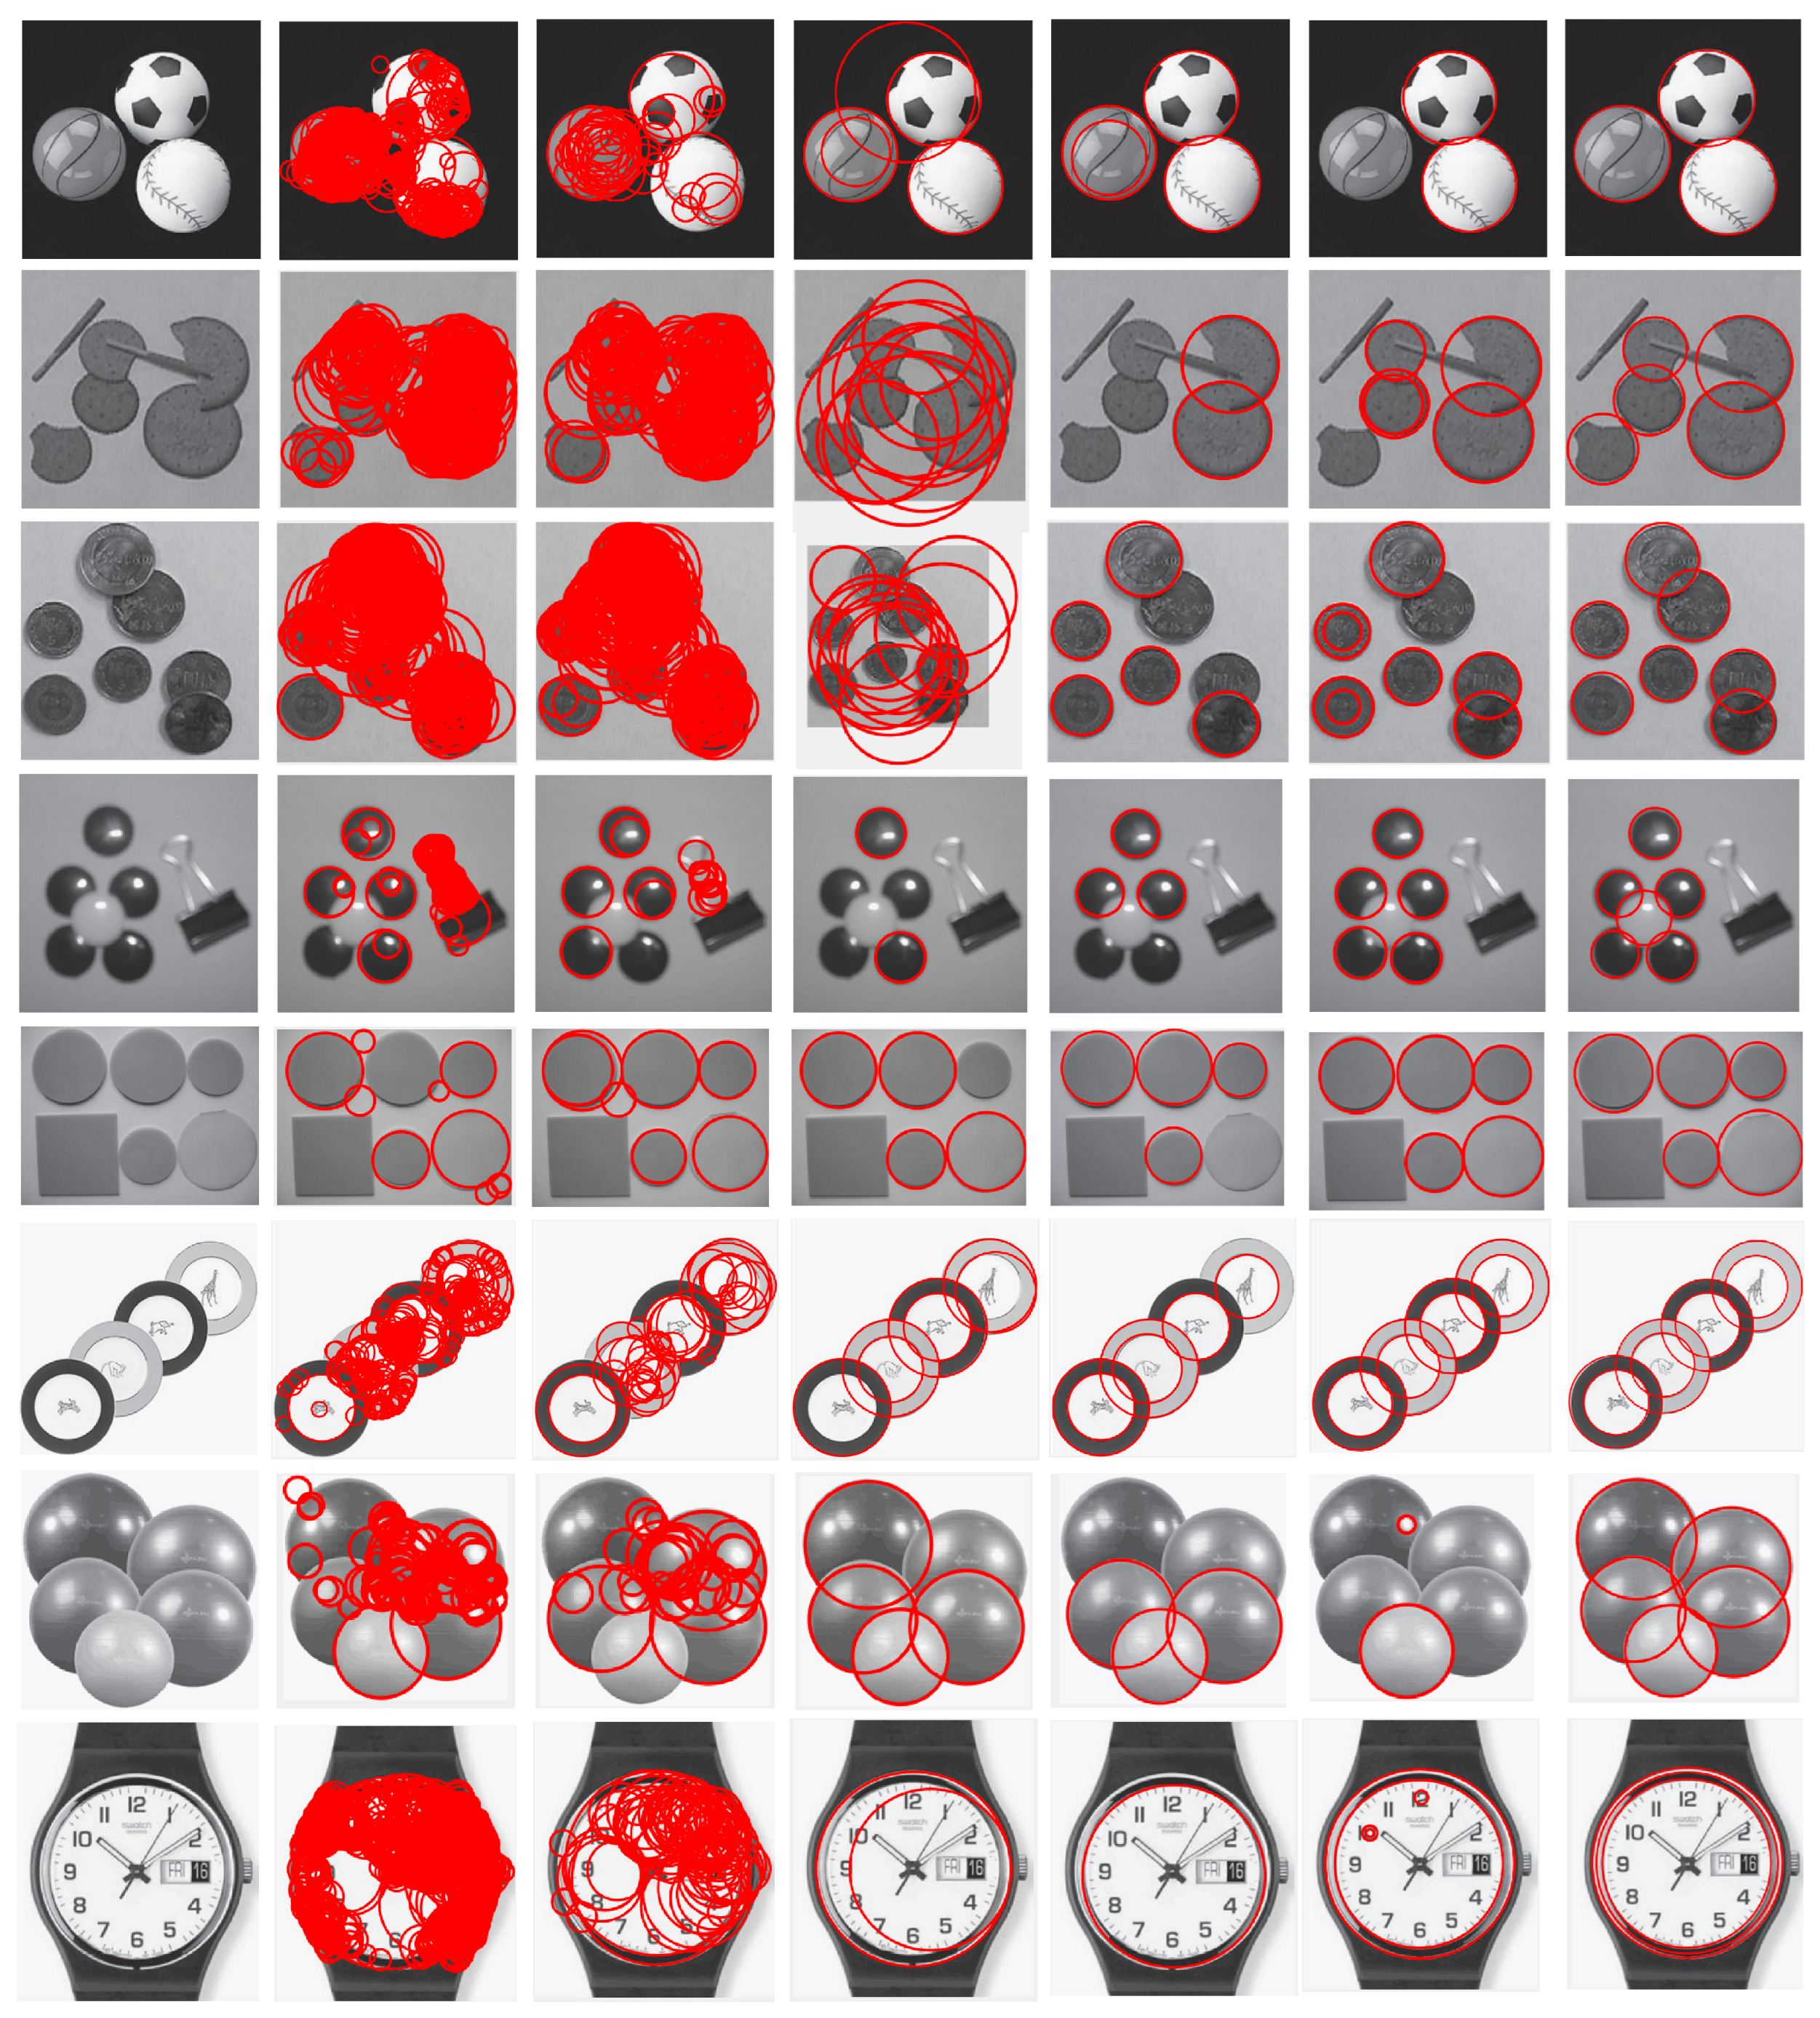
As can be seen from the chart, the RHT algorithm has a large amount of false and missed detection, while RCD has a higher recall in the GH dataset due to sampling one more point for verification. Jiang’s method is improved but performs poorly in the interference dataset, mainly because of a large number of non-circular contours around the false circle, which leads to misjudgment of sampling from the differential region. Wang’s algorithm improved compared to Jiang’s in both datasets but false detection still exists in images with complex textures. The CACD algorithm has a substantial improvement in both datasets, but the running time becomes longer in images with larger sizes, and there are missed and wrong detections (similar to the first, seventh and eighth pictures in Figure 6), which is because the interference curves make circle fitting and the radius of curvature estimation tough. Our algorithm removes many cluttered texture edges and retains more complete arc edges before detection, and builds a validation support region to exclude a large number of edge points on non-candidate circles, which improves precision and recall, speeds up the runtime, and performs better in both the interference dataset and GH dataset.

3.2.2. Mini Dataset

From the data in Figure 7 and Table 5, it can be seen that RHT shows low precision and high recall in the mini dataset. RCD is similar to RHT, but the time has reduced. However, the iterative nature of the RHT and RCD makes the performance poor on all four metrics. Jiang is significantly optimized compared to RCD in terms of precision, but the time has increased instead, mainly because complex textures require a lot of iterative operation by difference region sampling, which slows down the speed. Wang has a higher precision but performs poorly on defective circles and concentric circles (similar to the second, fourth, and seventh pictures in Figure 7). This is because it only searches sampling points in horizontal and vertical directions. CACD performs better, but curvature estimation is difficult in blurred-edge images, which leads to missed detection (such as the 2nd and 7th pictures in Figure 7). Our algorithm improves the edge localization accuracy by fuzzy inference before detection and performs verification determination for defective circles, which not only improves the detection speed but also reduces the influence of image blurring degrees and defective circles on the results.

3.2.3. Traffic Dataset

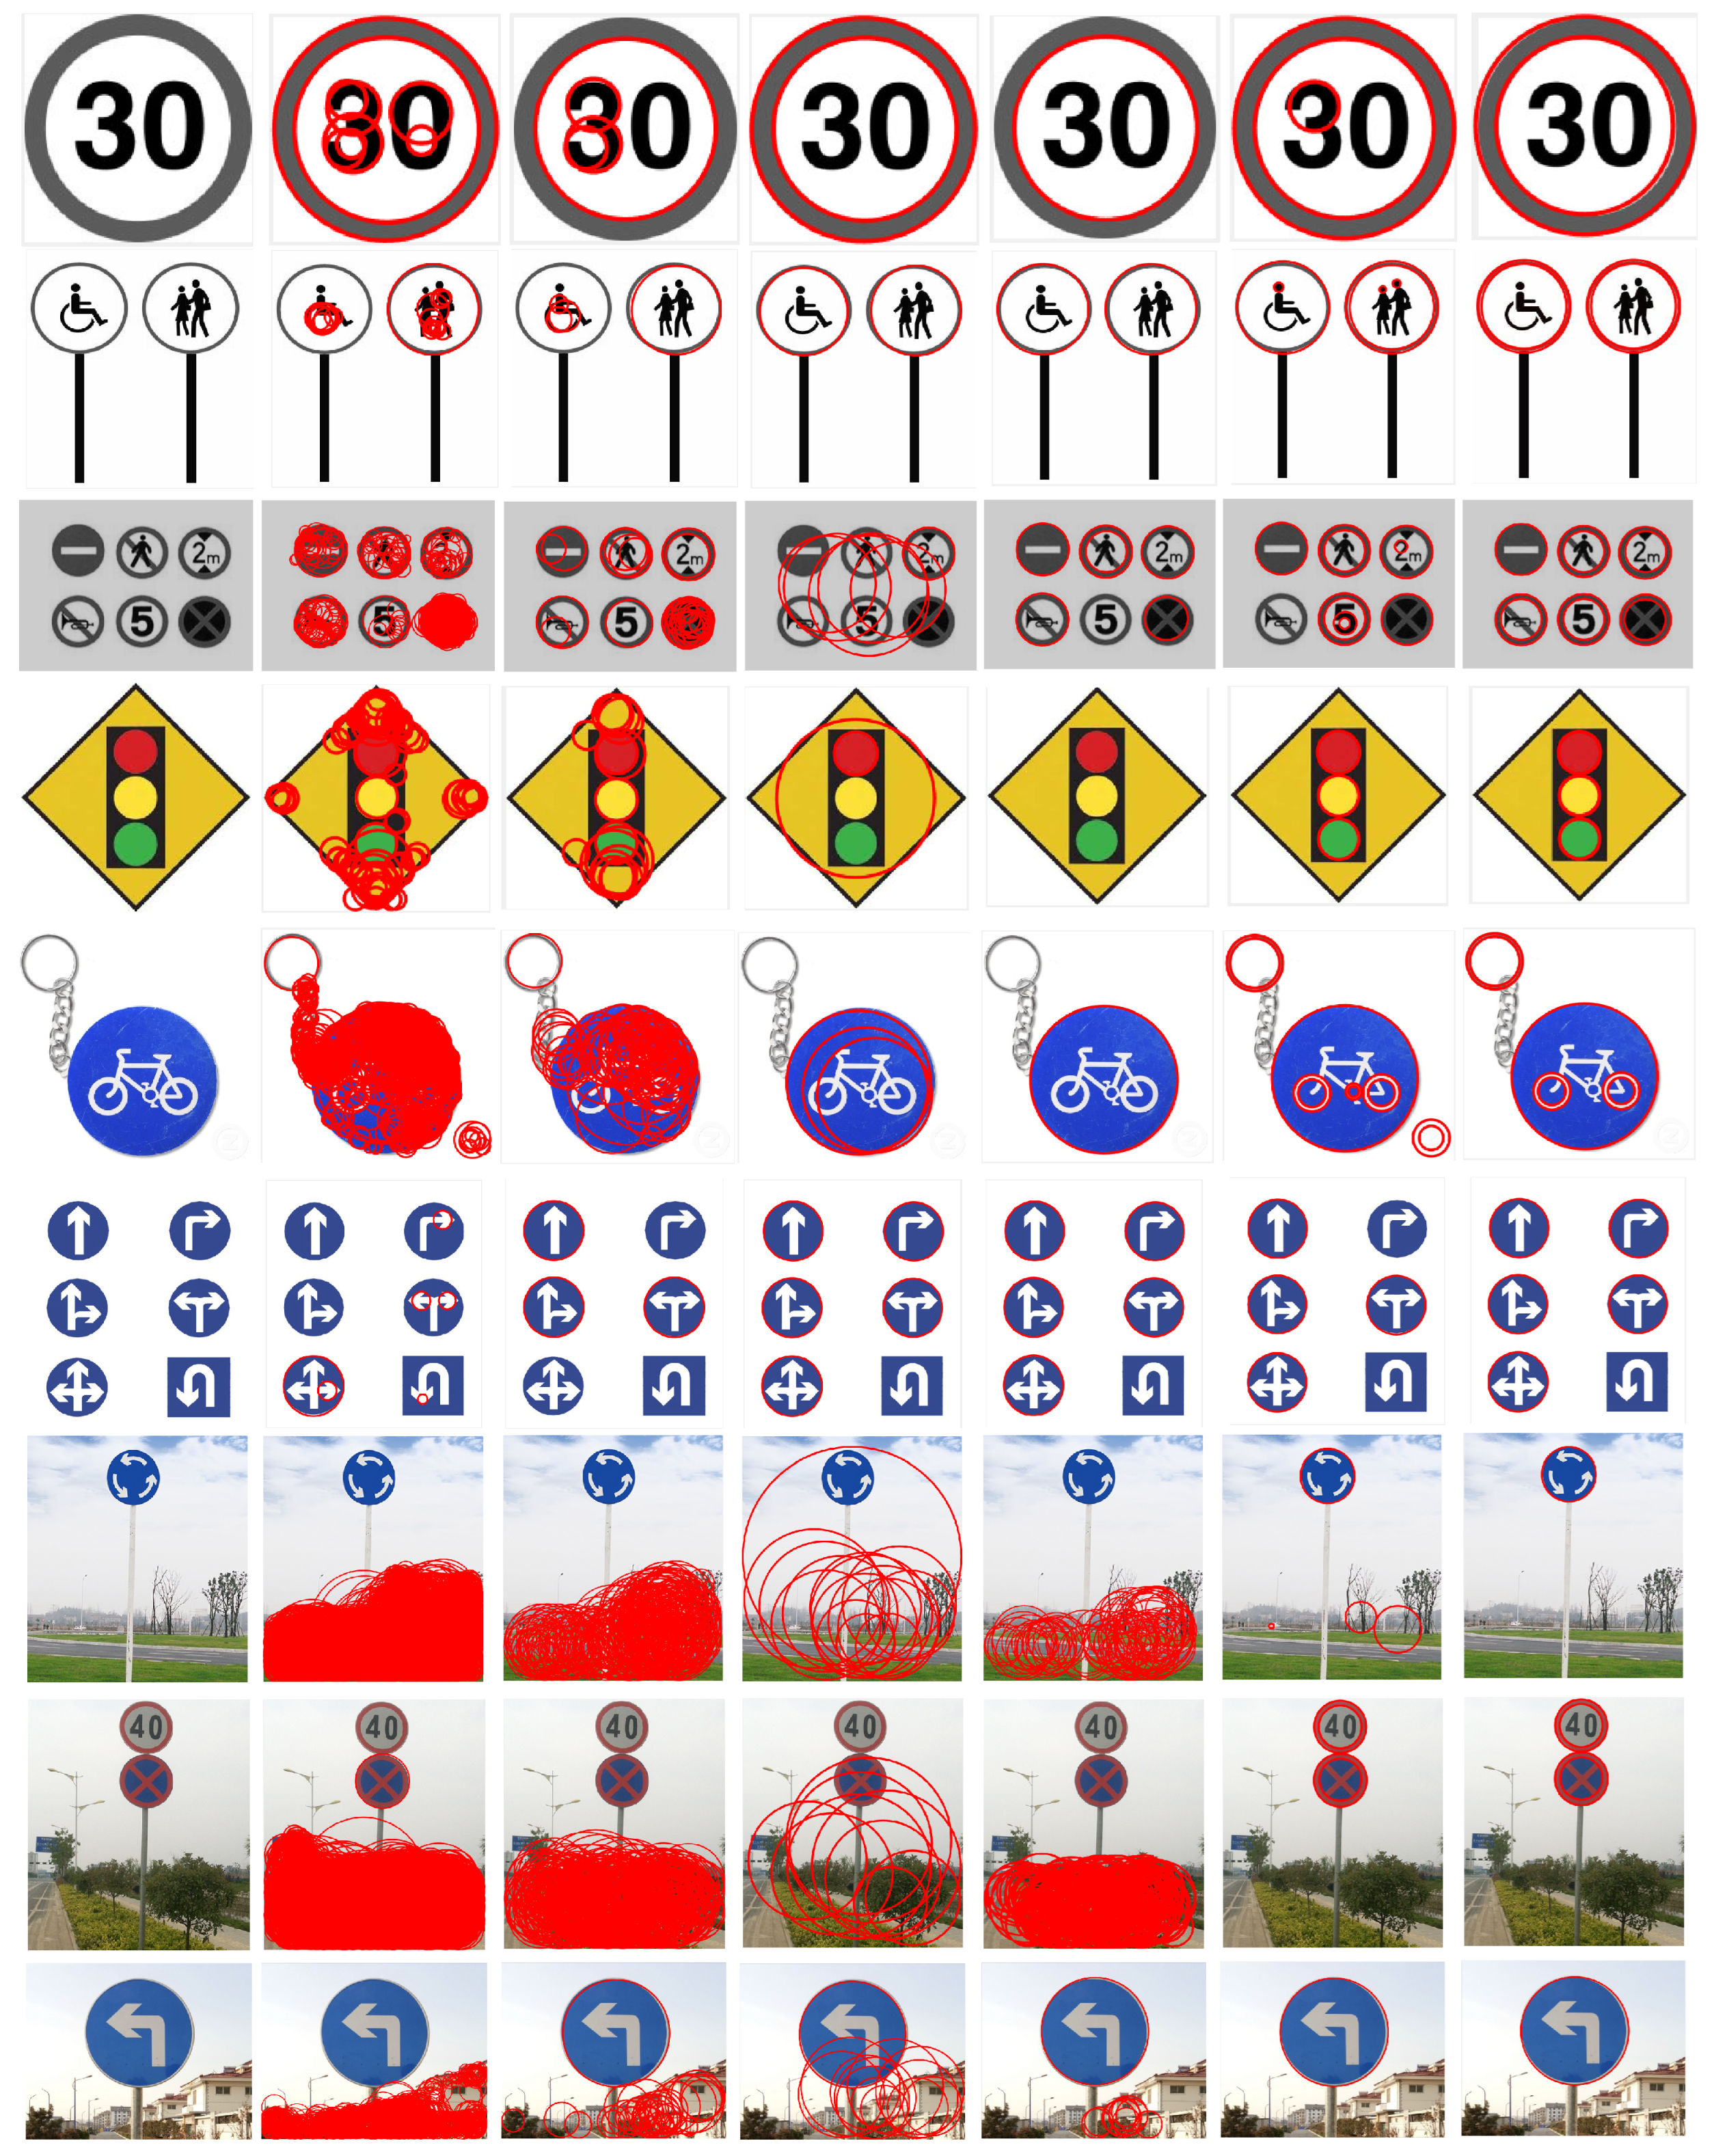
The data from Figure 8 and Table 6 show that RHT has a high false detection rate. However, both the precision and recall of RCD have been improved. Jiang’s algorithm has improved on precision and recall, especially for images with simple backgrounds, but the sharp increase in points in the difference evidence collection area leads to a drastic increase in runtime on real and multi-circle images and a high false detection rate. Wang’s algorithm runs significantly faster than Jiang’s but still performs poorly on complex background images taken in real life. This is because the algorithm easily detects a large number of false circles that cannot be eliminated in complex images with a large number of dense interference points. CACD has a high recall, but unnecessary features are incorrectly identified. Moreover, the runtime increases substantially as the image size becomes larger, which reflects the disadvantage of the HT-class circle detection methods: only circles with a small range of radii could be detected in a limited time. Our algorithm removes a large number of the interfering non-circular contour curves and samples with arc features to improve the detection speed and precision, but there are partial misses on the small circles (such as the second and fifth pictures in Figure 8) because the edge points in this part are denser and our algorithm omits the set of points that are too close to the first point in the sampling phase.

3.3. Discussion

As can be seen from Table 3, Table 4, Table 5 and Table 6, our proposed method has some advantages over other methods. Compared with the above methods, our method removes many cluttered texture edges before detection to improve the detection speed. Specifically, the circular contour screening stage removes 89.03% of invalid edge points at most, which effectively reduces the computational effort of sampling. Compared with CACD, our method does not iterate a large number of radius layers, which speeds up to four times at least and keeps the detection time stable at large-size images. Our method improves Wang’s method by about 40% in terms of accuracy and recall, this is because Wang performs poorly on images, such as defective circles and concentric circles for sampling in both horizontal and vertical directions, moreover, the performance degrades rapidly in complex images with cluttered textures. In addition, the performance of our algorithms differs in tests on the four datasets. The recall of datasets Interference and GH is lower than datasets Mini and Traffic, which is because datasets Interference and GH contain many images with a lot of interfering invalid information and complex scenes, which bring difficulties to the screening of circular features. The runtime of the mini dataset is the shortest among the four datasets because the number of edge points contained in the image is the least.

4. Conclusions

In this paper, we propose a fast circle detection algorithm based on circular arc feature screening and analyze its performance. First, we improve the original fuzzy inference detection algorithm by adding main contour edge screening, edge refinement, and arc-like determination, which removes unnecessary contour edges and reduces the computational workload. Then, we sample step-by-step with the arc features on two feature matrices and set auxiliary points to find defective circles, which greatly decreases the number of invalid edge points sampled and improves the sampling efficiency. Finally, we built a square verification support domain to verify complete and defective circles, respectively, to further find the true circle.
In the experimental analysis section, we compared the fuzzy experiments with the original fuzzy inference edge detection algorithm, and the experimental results show that our algorithm still guarantees good performance under different Gaussian filtering. In addition, we compared it with five methods on four datasets. The results show that our algorithm had an average performance in terms of recall due to the circular contour screening phase. In order to speed up the subsequent process, we directly removed contour curves smaller than 30 pixels and skipped the set of points that were too close to the first point in the sampling phase, so that sometimes circles with smaller radii were not fully detected. The circular contour screening phase removes a large number of interfering non-circular contour curves and the sampling phase based on arc features reinforcement also effectively improves the detection speed, making our method the best in terms of precision, F-measure, and time. In general, our method is more suitable for cases with less rigorous accuracy requirements and slightly larger circle radii. In the future, we will continue to improve the circular contour screening phase and the arc feature-based sampling phase to improve the detection of small radius circles.

Author Contributions

Conceptualization, X.L.; methodology, X.L.; software, X.L. and Y.O.; validation, X.L. and Y.O.; formal analysis, X.L., Y.L. and Y.O.; investigation, X.L.; resources, X.L., Y.L. and Y.O.; data curation, X.L., H.D., Y.L. and Y.O.; writing—original draft preparation, X.L., H.D., Y.L. and Y.O.; writing—review and editing, X.L., H.D., Y.L., Y.O. and F.Z.; visualization, X.L., H.D., Y.L., Y.O. and F.Z.; supervision, X.L., H.D., Y.L., Y.O. and F.Z. All authors have read and agreed to the published version of the manuscript.

Funding

This research received no external funding.

Institutional Review Board Statement

Not applicable.

Informed Consent Statement

Not applicable.

Data Availability Statement

Not applicable.

Acknowledgments

We are grateful to the High Performance Computing Center of Central South University for the assistance with the computations.

Conflicts of Interest

The authors declare no conflict of interest.

Appendix A

The appendix is an explanation of important symbols in the main text.
Table A1. Explanation of symbols.
SymbolMeaning
A i n G , σ , k Input affiliation function
M y The output value after fuzzing
A o u t y , a , b , c Output the trigonometric affiliation function of the fuzzy set
F i Marking of defective circles
D I R i The direction of the second sample point
m a r k i Marking of third sample point
U s a m p l e Set of coordinates of sampling points
max d i s t Maximum error tolerant distance from the third sampling point to the auxiliary line
[ a , b , r ] circle parameters
S i z e D i s t Number of edge points in the verification region
C i r c l e p o i n t s Set of edge points that meet the distance threshold
I C i r c l e p o i n t s x Gradient of candidate points in the horizontal direction
I C i r c l e p o i n t s y Gradient of candidate points in the vertical direction
θ 1 The gradient azimuth of the point
θ 2 The azimuth of any point ( x i , y i ) on the circle with ( a , b ) as the center
ε θ The minimum error angle
C i Marking of the difference between θ 1 and θ 2 less than ε θ
P o i n t n u m Number of C ( i )

References

  1. Yu, L.; Zhang, D.; Peng, N.; Liang, X. Research on the application of binary-like coding and Hough circle detection technology in PCB traceability system. J. Ambient. Intell. Humaniz. Comput. 2021, 1–11. [Google Scholar] [CrossRef]
  2. Xue, P.; Jiang, Y.; Wang, H.; He, H. Accurate Detection Method of Aviation Bearing Based on Local Characteristics. Symmetry 2019, 11, 1069. [Google Scholar] [CrossRef] [Green Version]
  3. Zhou, L.; Li, L. Research on improved hough algorithm and its application in lunar crater. J. Intell. Fuzzy Syst. 2021, 41, 4469–4477. [Google Scholar] [CrossRef]
  4. Ibrahim, B.; Kiryati, N. Detecting Cocircular Subsets of a Spherical Set of Points. J. Imaging 2022, 8, 184. [Google Scholar] [CrossRef] [PubMed]
  5. Mekhalfi, M.L.; Nicolò, C.; Bazi, Y.; Al Rahhal, M.M.; Alsharif, N.A.; Al Maghayreh, E. Contrasting yolov5, transformer, and efficientdet detectors for crop circle detection in desert. IEEE Geosci. Remote Sens. Lett. 2021, 19, 1–5. [Google Scholar] [CrossRef]
  6. Nguyen, E.H.; Yang, H.; Deng, R.; Lu, Y.; Zhu, Z.; Roland, J.T.; Lu, L.; Landman, B.A.; Fogo, A.B.; Huo, Y. Circle Representation for Medical Object Detection. IEEE Trans. Med. Imaging 2021, 41, 746–754. [Google Scholar] [CrossRef]
  7. Zhang, Z.; Deng, H.; Liu, Y.; Xu, Q.; Liu, G. A Semi-Supervised Semantic Segmentation Method for Blast-Hole Detection. Symmetry 2022, 14, 653. [Google Scholar] [CrossRef]
  8. Duda, R.O.; Hart, P.E. Use of the Hough transformation to detect lines and curves in pictures. Commun. ACM 1972, 15, 11–15. [Google Scholar] [CrossRef]
  9. Ballard, D.H. Generalizing the Hough transform to detect arbitrary shapes. Pattern Recognit. 1981, 13, 111–122. [Google Scholar] [CrossRef] [Green Version]
  10. Xu, L.; Oja, E.; Kultanen, P. A new curve detection method: Randomized Hough transform (RHT). Pattern Recognit. Lett. 1990, 11, 331–338. [Google Scholar] [CrossRef]
  11. Jiang, L. A fast and accurate circle detection algorithm based on random sampling. Future Gener. Comput. Syst. 2021, 123, 245–256. [Google Scholar] [CrossRef]
  12. Chen, T.C.; Chung, K.L. An efficient randomized algorithm for detecting circles. Comput. Vis. Image Underst. 2001, 83, 172–191. [Google Scholar] [CrossRef] [Green Version]
  13. Jiang, L. Efficient randomized Hough transform for circle detection using novel probability sampling and feature points. Optik 2012, 123, 1834–1840. [Google Scholar] [CrossRef]
  14. Wang, G. A sub-pixel circle detection algorithm combined with improved RHT and fitting. Multimed. Tools Appl. 2020, 79, 29825–29843. [Google Scholar] [CrossRef]
  15. Jiang, L.; Wang, Z.; Ye, Y.; Jiang, J. Fast circle detection algorithm based on sampling from difference area. Optik 2018, 158, 424–433. [Google Scholar] [CrossRef]
  16. Yao, Z.; Yi, W. Curvature aided Hough transform for circle detection. Expert Syst. Appl. 2016, 51, 26–33. [Google Scholar] [CrossRef]
  17. Lu, C.; Xia, S.; Huang, W.; Shao, M.; Fu, Y. Circle detection by arc-support line segments. In Proceedings of the 2017 IEEE International Conference on Image Processing (ICIP), Beijing, China, 17–20 September 2017; pp. 76–80. [Google Scholar]
  18. Le, T.; Duan, Y. Circle detection on images by line segment and circle completeness. In Proceedings of the 2016 IEEE International Conference on Image Processing (ICIP), Phoenix, AZ, USA, 25–28 September 2016; pp. 3648–3652. [Google Scholar]
  19. Von Gioi, R.G.; Jakubowicz, J.; Morel, J.M.; Randall, G. LSD: A fast line segment detector with a false detection control. IEEE Trans. Pattern Anal. Mach. Intell. 2008, 32, 722–732. [Google Scholar] [CrossRef]
  20. Zhao, M.; Jia, X.; Yan, D.M. An occlusion-resistant circle detector using inscribed triangles. Pattern Recognit. 2021, 109, 107588. [Google Scholar] [CrossRef]
  21. Liu, Y.; Deng, H.; Zhang, Z.; Xu, Q. A Fast Circle Detector with Efficient Arc Extraction. Symmetry 2022, 14, 734. [Google Scholar] [CrossRef]
  22. Ou, Y.; Deng, H.; Liu, Y.; Zhang, Z.; Ruan, X.; Xu, Q.; Peng, C. A Fast Circle Detection Algorithm Based on Information Compression. Sensors 2022, 22, 7267. [Google Scholar] [CrossRef] [PubMed]
  23. Hu, L.; Cheng, H.; Ming, Z. A high performance edge detector based on fuzzy inference rules. Inf. Sci. 2007, 177, 4768–4784. [Google Scholar] [CrossRef]
  24. Li, W.; Zhang, L.; Chen, X.; Wu, C.; Cui, Z.; Niu, C. Predicting the evolution of sheet metal surface scratching by the technique of artificial intelligence. Int. J. Adv. Manuf. Technol. 2021, 112, 853–865. [Google Scholar] [CrossRef]
  25. Houssein, E.H.; Helmy, B.E.D.; Oliva, D.; Elngar, A.A.; Shaban, H. A novel black widow optimization algorithm for multilevel thresholding image segmentation. Expert Syst. Appl. 2021, 167, 114159. [Google Scholar] [CrossRef]
  26. Jia, Q.; Fan, X.; Luo, Z.; Song, L.; Qiu, T. A fast ellipse detector using projective invariant pruning. IEEE Trans. Image Process. 2017, 26, 3665–3679. [Google Scholar] [CrossRef] [PubMed] [Green Version]
  27. CircleDetection. Available online: https://Github.Com/Zikai1/CircleDetection (accessed on 10 April 2022).
  28. CACD. Available online: https://Github.Com/Yzjba/CACD (accessed on 10 April 2022).
  29. Fuzzy Edge Detection. Available online: https://Github.Com/SeyedMuhammadHosseinMousavi/Fuzzy-Edge-Detection (accessed on 10 April 2022).
Figure 1. Location of N(1–8) around P.
Symmetry 15 00734 g001
Figure 2. The intermediate results of our procedure are shown: (a) the original image. (b) The results of the original fuzzy inference edge extraction. (c) The image after we performed the main contour edge screening and contour refinement. (d) The image after we performed the arc-like determination.
Symmetry 15 00734 g002
Figure 3. Feature matrices for two directions along (a) 45 and (b) 135 .
Symmetry 15 00734 g003
Figure 4. Square verification support region.
Symmetry 15 00734 g004
Figure 5. Fuzzy edge detection and our improved fuzzy edge algorithm for the fuzzy detection experiments. From top to bottom are the original image, and the images with 3 × 3, 5 × 5, 7 × 7, 9 × 9, and 11 × 11 Gaussian filter sizes. From left to right are the experimental image, the contour curve image of fuzzy edge detection, the contour curve image of our improved fuzzy algorithm, the circle detection result of fuzzy edge detection, and the circle detection result of our improved fuzzy algorithm.
Symmetry 15 00734 g005
Figure 6. Circle detection samples from datasets Interference (the first seven rows), and GH (the last three rows) for all algorithms. From the left to right column: input image, RHT, RCD, Jiang, Wang, CACD, and ours. As can be seen, the proposed method obtains better performance than others.
Symmetry 15 00734 g006
Figure 7. Circle detection results in the GH dataset, which is widely used by other algorithms. From the left to right column: input image, RHT, RCD, Jiang, Wang, CACD, and ours. As can be seen, the proposed method obtains better performance than others.
Symmetry 15 00734 g007
Figure 8. Circle detection results in the traffic dataset, which is widely used by other algorithms. From the left to right column: input image, RHT, RCD, Jiang, Wang, CACD, and ours. As can be seen, the proposed method obtains better performance than others.
Symmetry 15 00734 g008
Table 1. Summary of previous work.
Circle Detection AlgorithmPrevious Work
CHTCHT maps any three points to a three-dimensional parameter by traversing all of the edge points to determine the true circle.
RHTRHT randomly samples three different points to calculate circle parameters and votes on the linked list of parameters.
RCDRCD samples one more point than RHT to verify candidate circles.
Wang’s algorithmWang samples one point and obtains the other two points by searching in horizontal and vertical directions in order to find the true circle.
Jiang’s algorithmJiang uses difference region sampling to improve sampling efficiency and find the true circle.
Yao’s algorithmYao finds the true circle efficiently by adaptively estimating the radius of curvature to eliminate non-circular contours.
Table 2. The performance of our algorithm on the datasets.
InterferenceGH [27]Mini [27]Traffic
Number of Edge Points60,68821,339.276113.12522574.92
Number of Screened Edge Points6658462534684462
Screening Retention Rate10.97%21.67%56.73%19.77%
Number of Edge Points on the Circle2133149514882300
Circle Content Rate3.51%7.01%24.34%10.19%
Circle Retention Rate100.00%99.02%100.00%97.54%
Table 3. Result of RHT, RCD, Jiang, Wang, CACD, and our method in the interference dataset.
PrecisionRecallF-MeasureTime (s)
RHT0.080.250.0623.42
RCD0.070.250.066.12
Jiang0.010.130.026.42
Wang0.280.280.201.51
CACD0.740.760.696.48
Our1.000.890.931.42
Table 4. Result of RHT, RCD, Jiang, Wang, CACD, and our method in the GH dataset.
PrecisionRecallF-MeasureTime (s)
RHT0.200.230.2113.82
RCD0.090.580.166.41
Jiang0.250.390.302.45
Wang0.380.570.461.66
CACD0.520.730.614.73
Our0.720.780.751.08
Table 5. Result of RHT, RCD, Jiang, Wang, CACD, and our method in the mini dataset.
PrecisionRecallF-MeasureTime (s)
RHT0.050.460.0616.55
RCD0.130.590.165.66
Jiang0.680.520.5725.70
Wang0.970.600.712.59
CACD0.840.780.780.22
Our1.000.950.970.44
Table 6. Result of RHT, RCD, Jiang, Wang, CACD, and our method in the traffic dataset.
PrecisionRecallF-MeasureTime (s)
RHT0.360.360.3010.59
RCD0.320.310.248.29
Jiang0.590.460.4829.10
Wang0.700.610.522.81
CACD0.770.800.7015.57
Our1.000.950.971.43
Disclaimer/Publisher’s Note: The statements, opinions and data contained in all publications are solely those of the individual author(s) and contributor(s) and not of MDPI and/or the editor(s). MDPI and/or the editor(s) disclaim responsibility for any injury to people or property resulting from any ideas, methods, instructions or products referred to in the content.